Embed Size (px)
Citation preview

J. Bio. & Env. Sci. 2014
79 | Rahmanuddin et al
RESEARCH PAPER OPEN ACCESS
Sustainability analysis on fisheries resources of tidal marsh in
Barito Kuala district, South Kalimantan
Rahmanuddin1*, Soemarno2, Marsoedi3, Bambang Djoko Priatmadi4
1Doctoral Program of Agricultural Sciences, Interest of Environmental Sciences and Technology,
University of Brawijaya, Malang, Indonesia
2Department of Soil Sciences, Faculty of Agriculture, University of Brawijaya, Malang, Indonesia
3Department of Water Resources Management, Faculty of Fisheries and Marine Sciences, University
of Brawijaya, Malang, Indonesia
4Environmental Sciences and Technology Graduate Program, University of Lambung Mangkurat,
Banjarbaru, Indonesia
Article published on June 05, 2014
Key words: fisheries, sustainability index, status of sustainability, tidal marsh.
Abstract
Barito Kuala district is a region that is mainly composed of tidal marsh. Marsh area is a crucial area for
agropolitan development on fisheries resources. With the current issues of land use converted function, we need
to assess the sustainability level of the marsh area. This study aimed to assess the sustainability of tidal marsh
fishery resources in the Barito Kuala district based on five dimensions of sustainability, i.e. ecological, economic,
socio-cultural, technology, as well as legal and institutional dimensions. We used Multi-Dimensional Scaling
(MDS) approach which was called Rap-Batola and the results were expressed in index and status of sustainability.
The results showed that the Kuripan Sub-district has the highest sustainability index (59,37) compared to the
Marabahan Sub-district (59,27) and Cerbon Sub-district (58,21). However, in general it can be stated that the
fishery resources of tidal marsh in three sub-district areas were quite sustainable. Thus it can be stated that the
fisheries resources of tidal marsh in the Barito Kuala district has sustained sufficient status.
*Corresponding Author: Rahmanuddin [email protected]
Journal of Biodiversity and Environmental Sciences (JBES) ISSN: 2220-6663 (Print) 2222-3045 (Online)
Vol. 4, No. 6, p. 79-91, 2014
http://www.innspub.net

J. Bio. & Env. Sci. 2014
80 | Rahmanuddin et al
Introduction
Tidal marsh land opening was firstly done with
purpose to transmigration resettlement program that
began in Pelita I (New Order) around 1969 through
program of Tidal Rice Field Opening Project (P4S).
Tidal land use for agriculture is a strategic choice in
balancing the shrinking land equilibrium in the island
of Java that was converted to non-agricultural sectors
such as housing, highways, industry and other
development.
Barito Kuala district is one of the regions of South
Kalimantan Province, which is geographically located
about 45 km in the north of Banjarmasin City (the
capital of South Kalimantan Province), the width of
299.686 ha, with an area of 287.922 ha marsh and
lowland marsh 11.774 ha. Meanwhile, land use of tidal
marsh area was converted into oil palm plantations in
Barito Kuala district covering 45.622 ha, with
smallholding farm is 20% of the total plantation,
managed by private companies, i.e. 9.124 ha (Forestry
and Plantation of Barito Kuala District, 2010).
Tidal marsh land area in the district of Barito Kuala
may potentially be used as local fish farming.
Stagnant water tidal peat marsh among oil palm
plantation, rice and horticulture and citrus crops are
still not used as a location for the local fish farming.
Stagnant water can be converted into a local pond fish
culture. Less productive tidal peat marsh began to be
used as oil palm plantations. To increase the
additional value of stagnant water between the palm
trees is necessary to be used as a local fish farming
location. Local fish is generally very tolerant in the
waters of this region. Local fish farming ponds or
among palm trees, rice and citrus can give additional
value to the community as an additional source of
family income and consumed animal protein.
Based on the above issues, the study aimed to assess
the sustainability of fishery resources in the tidal
marsh of Barito Kuala based on five dimensions of
sustainability, i.e. ecological, economical, social-
cultural, technological, and legal and institutional
dimensions.
Materials and methods
Study Site
Research on the management of tidal marsh for fish
farming in the perspective of regional autonomy in
Barito Kuala district has 17 administrative districts
namely Tabunganen, Tamban, Mekarsari, Anjir
Pasar, Anjir Muara, Alalak, Mandastana, Belawang,
Wanaraya, Barambai, Rantau Badauh, Cerbon,
Bakumpai, Marabahan, Tabukan, Kuripan, and
Jejangkit. The study was conducted from December
2011 to June 2013.
Data Collection
The data consisted of secondary and primary data.
Secondary data was obtained through the study of
literature and documents from several institutions
associated with research. Meanwhile, primary data
obtained from expert opinion. Some considerations in
determining who will be the experts respondent,
using the following criteria: (a) has competent
experience in accordance with the studied field, (b)
have a reputation, position/job in the field of assessed
competence, and (c) have a high credibility, willing,
and or are in the studied locations.
Data Analysis
The overall sustainability resources of tidal marsh
were analyze use Multi Dimensional Scaling (MDS)
which was a modified approach of the RAPFISH
(Rapid Assessment Techniques for Fisheries)
program that developed by Fisheries Center,
University of British Columbia (Fauzi, 2000;
Kavanagh, 2001; Fauzi and Anna, 2003). This
method can widely include dimensions associated
with the presence of marsh resources by determining
a baseline of "good" and "bad". MDS can analyze a
complete picture of the state of the marsh resources.
This method is basically a multivariate method that
can handle non-metric data and is also known as one
of the ordination (dimensions) to minimized space.
Ordination itself is a process of "plotting" object point

J. Bio. & Env. Sci. 2014
81 | Rahmanuddin et al
(position) along the axes that arranged according to
two or more particular relationship (an ordered
relationship) or in a graphics system (Susilo, 2003).
Another advantage of this method is it summarizes
multidisciplinary data to produce plenty quantitative
information and projections. The approach of this
method has been developed to analyze the
environmental data (Susilo, 2003).
MDS analyzing each attribute of marsh resources by
scoring all secondary and primary data. The
assessment showed differences which depend on the
number of theoretical basis’ ratings. Analyses were
performed using MDS referred to Susilo (2003) as
follows:
1) Determine the other two main point, called
"central point" of bad and good points; two
additional main point is also determine in a
vertical direction that marked as "up" and
"down"
2) Create an additional reference point called the
“anchor” that used for the ordination. The point
act as a stabilizer – a kind of envelope that
pinpoints the location of research in Barito Kuala
is not beyond the envelope. These points are also
useful in the regression analysis to calculate the
"stress" as a part of the MDS.
3) Standardize the scores of the attributes to:
;
XikSd = standard score of the study sites
(including point reference) to i =
1, 2,... n, on each attribute to k = 1,
2,.... p;
Xik = the value of the initial score of the
study site (including its
reference point) to i = 1, 2,... n, on
each attribute to k = 1, 2,... p ;
Xk = midpoint scores on each attribute
to k = 1, 2,.... p ;
Sk = standard deviation scores for each
attribute k = 1,... 2,..., p.
4) Calculate the distance between the location of
resources in the marsh with the Euclidean
distance method of n dimension as follows:
5) Ordinate all attributes for each dimension based
on MDS analysis algorithm aspect into two
dimensional axis, X and Y. Results of ordination
is the V matrix (nx 2) where n is the number of
assessed sites.
6) The distance between the objects is calculated by
regressing the Euclidean distance (dij) with the
origin (DIJ).The equation as follow :
Regression analysis in MDS which included stress
assessment by the goodness of fit becomes very
crucial, because the goodness of fit reflects the value
of S (stress) indicator when referring to the level of
RAPFISH S value (stress > 0.25). The manufacture of
sustainable scale (sustainability) from "Poor" to
"Good" (0-100) refers to Susilo (2003), at a ± 50
point above the x-axis on the scale and 50points lower
the y-axis.
Stress values and coefficient of determination (R2)
determined whether the addition of attributes is
accurately reflected the dimensions or not (approach
on actual conditions). Stress values reflect the
goodness of fit in MDS, which shows the exact size of
a point configuration to reflect the original data.
Lower stress value indicates a good fit, while high
stress values indicate the opposite. In the model of
Rapfish, the desired stress value is smaller than 25%
(Fauzi and Anna, 2003).
For i = 1, 2, ....n;
Vf(i,2) = Vf(i,2) – Vf(I good, 2)

J. Bio. & Env. Sci. 2014
82 | Rahmanuddin et al
Index values for the dimensions of the marsh
resource of Barito Kuala are sustainable if it’s > 50
and if the index is < 50 it means it is not sustainable.
Sustainability index for this study were made in four
categories (Table 1).
Table 1. Sustainability Index and Status
Index Value Category
0 – 25 Not sustainable 26 – 50 Less sustainable 51 – 75 Fair sustainable
76 – 100 Highly sustainable
Sensitivity Analysis
After the analysis of MDS and resource sustainability
indices obtained, we conducted sensitivity analysis of
these attributes. The analysis was used to determine
the attributes that influence or contributes to the
sustainability of the resource’s value. The sensitivity
analysis use the "attribute leveraging" to see a change
from the results of the MDS analysis. The influence of
each attribute is implied in the form of changes of
root mean square (RMS), especially on the x-axis
scale, the sustainable resource. Otherwise, conversely
the change on the y-axis is not concerned. The RMS
formula is:
Description:
Vt (i1) = Value of MDS (after rotating and flipping);
Vt (,1) = the middle value of MDS in column – 1
Leverage analysis is used to determine the sensitive
attributes, or interventions that can be performed to
enhance the sustainability status of fisheries
resources of tidal marsh in Barito Kuala District.
Leverage is calculated based on the difference
standard error between the attribute scores and
scores that obtained without attributes.
Monte Carlo Analysis
Monte Carlo analysis was performed to evaluate the
effect of statistical error value of particular aspect, in
95% confidence interval. Spence and Young (1978)
stated that this analysis is assessing the stability on
the ordinance analysis, which is essentially intended
to see the level of disturbance (perturbation) against
the value of the ordinance. The stability indicator
implied that the results of the analysis are valid and
trusted. The results of the analysis are expressed in
the form index value of Monte Carlo, which is further
distinguished by the index value of the MDS. Analysis
of Monte Carlo (Kavanagh, 2001; Fauzi and Anna,
2003) is use for assessing:
1) The effect of the error from the attribute scores
which describes the conditions of marsh’s
resources.
2) Effect of scores variation due to different opinion
or judgment by other studies.
3) Stability of the MDS was processed repeatedly
(iteration) and also considered to perform
further analysis on the quality of the reference
points stability.
4) The error on data entry or missing data.
5) The high value of the results of stress analysis.
The small index value indicates: (a) errors in score of
each attribute is relatively small, (b) variation of
scores is relatively small due to differences of opinion,
(c) the analysis that conducted repeatedly is stable,
(d) data entry errors and lost data can be avoided.
Result and discussion
Sustainability Status on Ecology Dimensions
The attributes that considered affect the sustainability
of fishery resources in the tidal marsh of Barito Kuala
District in the ecological dimension. It consists of 12
attributes, i.e. (1) exploitation of fish resources; (2)
land pressure; (3) rehabilitation of wetlands; (4)
sedimentation; (5) water pollution; (6) utilization of
tourism object; (7) utilization of ground water; (8)
disposal waste into the marsh; (9) availability of
landfill; (10) marsh abrasion ; (11) changes in the size
of fish caught; and (12) changes in the number of fish
caught (Fig. 1).

J. Bio. & Env. Sci. 2014
83 | Rahmanuddin et al
Fig. 1. Ordinance and leverage on ecological dimension to the sustainability of tidal marsh fishery resources in
Barito Kuala
Rap-Batola is directed to produce the ecological
dimension ordinate that determine the relative
position of each fishery resources of the tidal marsh
ordination in the good range value of 100, and the
bad with a value of zero. Based on this ordinate, we
could calculate the index and the sustainability status
of fisheries resources in tidal marsh on ecology
dimension.
The results of the Rap-Batola ordinance analysis on
the ecological dimension with three times iterations is
a coefficient of determination (R2) of 93.3% and the
value of stress (S) by 14%. Thus, the ecological
dimension analysis in this study indicates the
condition goodness of fit, given the stress value 14%.
The results of the analysis leverage all the attributes
or dimensions of ecological indicators. It indicate that
the attributes sensitive to sustainability. The
sedimentation valued 3,70 and the availability of
landfill has a value of 3,64. The high tidal marsh
sedimentation in Barito Kuala is closely related to
land pressure, in the form of land-use change into
plantation and farming. The land-use changes are not
well ordered as the presence of new rice fields. The
irrigation systems are also less managed. While the
opening of oil palm plantations is on a large scale,
farming practices was poorly managed. Nevertheless,
the lack of landfill availability for garbage disposal
was not considering the impact of environmental
pollution. This will certainly have an impact on the
marsh ecosystem, which in turn will affect the growth
of fish within. Both of these attributes must be
managed better so that the value on ecological
dimension of sustainability indices increased in the
future. Meanwhile, Monte Carlo analysis with
scatterplot on the ecological dimension indicates that
the tidal marsh fishery resources in Kuripan Sub-
district, Cerbon Sub-district and Marabahan Sub-
district have not experienced much disturbance
(perturbation) (Table 2).
Table 2. Sustainability of fisheries resources in
Barito Kuala tidal marsh: ecology dimension
Site of Marsh Sustainability
Index Status
Cerbon Sub-district 62,84 Fair
Sustainable
Kuripan Sub-district 61,22 Fair
Sustainable
Marabahan Sub-district
59,25 Fair
Sustainable
Sedimentation is an indicator of the ecological
dimension that is more sensitive than the landfill.

J. Bio. & Env. Sci. 2014
84 | Rahmanuddin et al
Disposition of landfill that adjacent to marsh waters
may cause physical, chemical and biological changes
in the water (Ahiablame et al., 2010). Domestic waste
which discharged into waters may cause muddiness,
total suspended solids (TSS) increases, accelerates
siltation of tidal marsh, and increases microbes in the
water. Huey and Meyer (2010) stated that besides
previous effects, forest and grassland fires, and
microbes are the biggest threat to the sustainability of
fisheries resources. Domestic waste and erosion
increased sedimentation of tidal marsh, led to the
diminishing of fish habitat and food biota if not wisely
managed. Furthermore, sedimentation and waste
from landfill could lead to eutrophication.
Eutrophication caused predatory fish and natural
feed pressed (Salihoglu and Sevinc, 2013). Consider
the impacts, the management of domestic waste
(landfill) and the prevention of sedimentation should
be managed well to preserve the sustainability of
fishery resources.
Sustainability Status on Economic Dimensions
Nine attributes are considered to affect the
sustainability level of fishery resources in the tidal
marsh of Barito Kuala on the economic dimension,
i.e. (1) absorption of labor, (2) increasing the income
of farmers/fishermen; (3) equity on profitability, (4)
contributions to the local economy (GDP), (5)
contributions to revenue (PAD); (6) central/regional
government subsidies; (7) the pattern of partnership;
(8) market opportunities, and (9) Institutional
financing (Fig. 2).
Fig. 2. Analysis of the ordinance and analysis of leverage economic dimension to the sustainability of fishery
resources in the tidal marsh of Barito Kuala
The results of the analysis of the Rap-Batola
ordinance on the economic dimension show
coefficient of determination (R2) of 92,9% and a
stress value (S) of 17,4%. This indicates the condition
of the area is goodness of fit, given the stress values
obtained for 17,4%.
The results of the leverage analysis on all
attributes/dimensions of economic indicators are
essentially having no sensitivity to the sustainability
of fishery resources in the tidal marsh of Barito Kuala
(Table 3). However, improvement prioritizeson the
highest attribute values: (1) contribution to local
revenue (PAD) and (2) income of farmers/fishermen.
Fisheries marsh in Barito Kuala is lack contribution to
the increased local revenue (PAD), due to the low
level of knowledge and awareness in the utilization of
the marsh itself as aquaculture farming areas which
potentially will improve the community's economy. In
addition, the government is still passive in optimizing

J. Bio. & Env. Sci. 2014
85 | Rahmanuddin et al
the function of marsh resource in effort to increase
the local revenue.
Table 3. Sustainability of fisheries resources of
Barito Kuala tidal marsh: economic dimension
Site of Marsh Sustainability
Index Status
Cerbon Sub-district 36,36 Less
Sustainable
Kuripan Sub-district
37,80 Less
Sustainable
Marabahan Sub-district
36,37 Less
Sustainable
The economic dimension of sustainability must be
managed better to be increased. Meanwhile, Monte
Carlo analysis with scatterplot on the economic
dimension of fisheries indicates that the tidal marsh
in Kuripan, Cerbon and Marabahan Sub-district has
not experienced much disturbance (perturbation).
Contribution of fisheries resources in the District of
Cerbon, Kuripan and Marabahan to local revenue and
income of fishermen is relatively low. We assume that
fishing activities in the natural tidal marsh should be
followed by fish farming and fishery business
diversification to increase the income of fish farmers.
Salusu (2006), Grygoruk et al. (2013), and Xiang et
al. (2014) stated that an integrated environmental
management system is necessary to improve the
quality of the aquatic environment to support socio-
economic development and sustainable management
of the local water environment.
Sustainability Status on Socio-Cultural Dimensions
Eleven attributes are considered to affect the level of
fishery resources sustainability in the tidal marsh of
Barito Kuala on the socio-cultural dimension.
Theattributes are: (1) the relative education level of
the community, (2) local knowledge, (3) guidance and
counseling to the community, (4) socialization of
marsh resource policy, (5) The number of family
members working in utilization of marsh resource, (6)
the conflicts level of resource marsh use, (7) efforts to
repair marsh damage, (8) the community role in the
marsh management, (9) meetings frequency between
related parties to the local management that
facilitated by the government, (10) time spent for
remediate the utilization of marsh resources, and
(11)alternative business besides using the fish
resources (Fig. 3).
Fig. 3. Analysis of ordinance leverage and socio-culture dimensions on the sustainability of fishery resources of
tidal marsh in the Barito Kuala District.
The results of the analysis of the ordinance by Rap-
Batola in socio-culture dimension resulted R2 of
94,5% and a stress value (S) of 14,2%. Stress values
reflect the goodness of fit in the MDS, where the

J. Bio. & Env. Sci. 2014
86 | Rahmanuddin et al
analysis of the socio-cultural dimensions indicate the
condition of goodness of fit, given the stress value
obtained was 14,2%.
The results of the leverage analysis on all attributes or
indicators of socio-cultural dimensions that have a
sensitivity to the sustainability of fishery resources in
the tidal marsh are: 1) The number of family members
working in the utilization of marsh resource (5,32)
and 2) the level of conflict with the value of marsh
resource utilization (3,30). Family members who
work in the utilization of marsh resources in Barito
Kuala still limited. The family members prefer to
work in other sectors such as agriculture and private
companies, especially oil palm plantation companies.
Meanwhile, related to the conflict in marshes
resource utilization is only occurred between certain
people with oil palm plantation owners. Conflicts that
arise mainly due to land clearing, companies expand
arable land area so there rarely no wetlands that has
not turned into plantations area, narrowing the width
of marsh itself. Monte Carlo analysis on the socio-
cultural dimension suggests that fisheries resources
in Kuripan, Cerbon and Marabahan Sub-district in
Barito Kuala have least disturbance (perturbation)
(Table 4.).
Table 4. Sustainability of fisheries resources of
Barito Kuala tidal marsh: socio-cultural dimension
Site of Marsh Sustainability
Index Status
Cerbon Sub-district 62,72 Fair
Sustainable
Kuripan Sub-district 64,39 Fair
Sustainable
Marabahan Sub-district
63,20 Fair
Sustainable
Utilization of fisheries resources need government
regulation to avoid conflicts between fishermen and
the fish farming developer, and also maintained the
economic sustainability of the fisheries sector. This
issue can be countered by planning the sustainable
development on economic-aquatic environment
management system by utilizing local potencies with
water reclamation (Xiang et al., 2014). Development
of tidal marsh can be done technically by plotting the
tidal marsh according to its potency, perform
reclamation to improve the quality and productivity
of the area, and empower surround farmers/fishermen
to manage and supervise the being developed area
(Tejoyowono, 2006; Salusu, 2006).
Sustainability Status on Technological Dimensions
There are eight attributes on technology
dimensionthataffect the sustainability level of fishery
resources of tidal marsh in Barito Kuala. These
attributes are: (1) the use of appropriate aquaculture
technology; (2) use of environmental friendly
technologies; (3) use of catching tools (fish attraction
devices, fads); (4) the use of selective fishing gear; (5)
the use of destructive fishing gear; (6) aquaculture
method that is not environmental friendly; (7) Post-
harvest handling prior to shipping, and (8) utilization
of fish waste handling technologies (Fig. 4).The
results of the ordinance analysis and Rap-Batola on
the technology dimension resulted R2 of 93% and a
stress value (S) of 15,4%.

J. Bio. & Env. Sci. 2014
87 | Rahmanuddin et al
Fig. 4. Analysis of the ordinance and dimensional leverage on the sustainability of fisheries technology in tidal
marsh of Barito Kuala District
Leverage analysis on the technological dimension
attributes has a sensitivity, particularly to the
attributes: 1) post-harvest handling prior to shipping
(4,79) and 2) utilization of fish waste treatment
technologies (4,33). The catch is sold directly to
collectors or to the consumer, caused incapability in
providing a better selling point. The fish should be
processed first, i.e. salting or preserved through the
process of fermentation (wadi – local preserved
process). While the existence of waste is also less
considered and disposed down to the drainage and
was not fully re-utilized. Therefore, the role of
technology is very crucial. It is not only for the
processing of the fish, but also the processing of fish’s
waste to be more useful, such as used as fertilizer or
animal feed. Monte Carlo analysis shows that the
technological dimension of fisheries resources in tidal
marsh of Kuripan, Cerbon and Marabahan Sub-
district has not experienced much disturbance
(perturbation) (Table 5).
Table 5. Sustainability of fisheries resources of
Barito Kuala tidal marsh: technology dimension
Site of Marsh Sustainability
Index Status
Cerbon Sub-district 74,60 Fair
Sustainable
Kuripan Sub-district
75,04 Fair
Sustainable
Marabahan Sub-district
75,87 Fair
Sustainable
Post-harvest handling before marketed is needs to
improve the sale rate of fish, and should meet the
standards of health on fishery products. It is also
important to not carelessly dispose the waste into the
water environment (Abdurachman et al, 1999).
Recently, fisherman was counseled with technological
knowledge of efficient wastewater treatment, to
prevent water pollution. An example on proper
management of waste fisheries products is fertilizer
or compost, due to its high protein content with
nitrogen-containing groups (-NH) that useful for
plant growth. Physiologically, fishery products (fish)
will rapidly decay without proper handling (Ridwan et
al., 2004). Handling of fishery products affect the
quality and have a direct impact on the selling price.
Technically, post-harvest handling provides low
temperature preservative systems (ice) and
appropriate container technologies design to reduce
impact on the environment.
Sustainability Status on Legal and Institutional
Dimensions
Twelve attributes of legal and institutional
dimensions affect the level of sustainability of fishery
resources in the tidal marsh of Barito Kuala. The
attributes are: (1) The formal instruction of marsh
management in the form of law and regulations; (2)
non-formal rules include customs and religion; (3)
appropriate local government policy and openness in
justice; (4) transparency in marsh resource policies;

J. Bio. & Env. Sci. 2014
88 | Rahmanuddin et al
(5) government policy towards protection of the
marsh ecosystem; (6) intensity of illegal use of marsh;
(7) zone arrangement of marsh resource; (8)
institutional strengthening; (9) law information
related to the management of the marsh; (10) law
enforcement on marsh management; (11) ability of
local government officials in supporting the marsh
management, and (12) role models of society (Fig.
5).The analysis of the ordinance on legal and
institutional dimensions of the number of iterations
by 2 times, resulted R2 of 94,7% and a stress value (S)
of 13,7%,indicate the condition of goodness of fit,
given the stress values obtained for 13,7% (<25%).
Fig. 5. Analysis of the ordinance on legal and institutional dimensions leverage to the sustainability of fishery
resources in tidal marsh of Barito Kuala District
Legal and institutional attributes dimensions that
have a particular sensitivity are: 1) zone setting of
resource marsh (4,57), and 2) intensity of illegal use
of marsh (3,18). Resources are relatedto zone settings
of marsh in Barito Kuala. Marsh resource
management is determined by hereditary habits and
applicable customs. An example in Kuripan, beje is
empowered as a legacy for generations and it is legally
recognized by existing customary rules. Meanwhile,
intensity of illegal use of marsh, most fishing
activities uses toxic chemicals and electric shock.
These practices will endanger the marsh ecosystem
and impact on marsh ecology itself. Monte Carlo
analysis on the legal and institutional dimensions
indicates that the fishery resources of tidal marsh in
Kuripan, Cerbon and Marabahan Sub-district have
not experienced much disturbance (perturbation)
(Table 6).
Table 6. Sustainability of fisheries resources of
Barito Kuala tidal marsh: legal and institutional
dimensions
Site of Marsh Sustainability
Index Status
Cerbon Sub-district 58,00 Simply
Sustainable
Kuripan Sub-district 55,72 Simply
Sustainable
Marabahan Sub-district
64,24 Simply
Sustainable
Multidimensional Sustainability Status of Fisheries
Resources Tidal Marsh in Barito Kuala
Sequentially, the Kuripan Sub-district has the highest
sustainability index (59,37) compared to the
Marabahan (59,27) and Cerbon (58,21). However, in
general it can be said that the fishery resources in the
tidal marsh of these three areas is quite sustainable.
Monte Carlo analysis on the MDS shows that fishery
resources of tidal marsh in three sub-districthas not
experienced much disturbance (perturbation). This is
shown by the plot that gather at one place and not
J. Bio. & Env. Sci. 2014
89 | Rahmanuddin et al
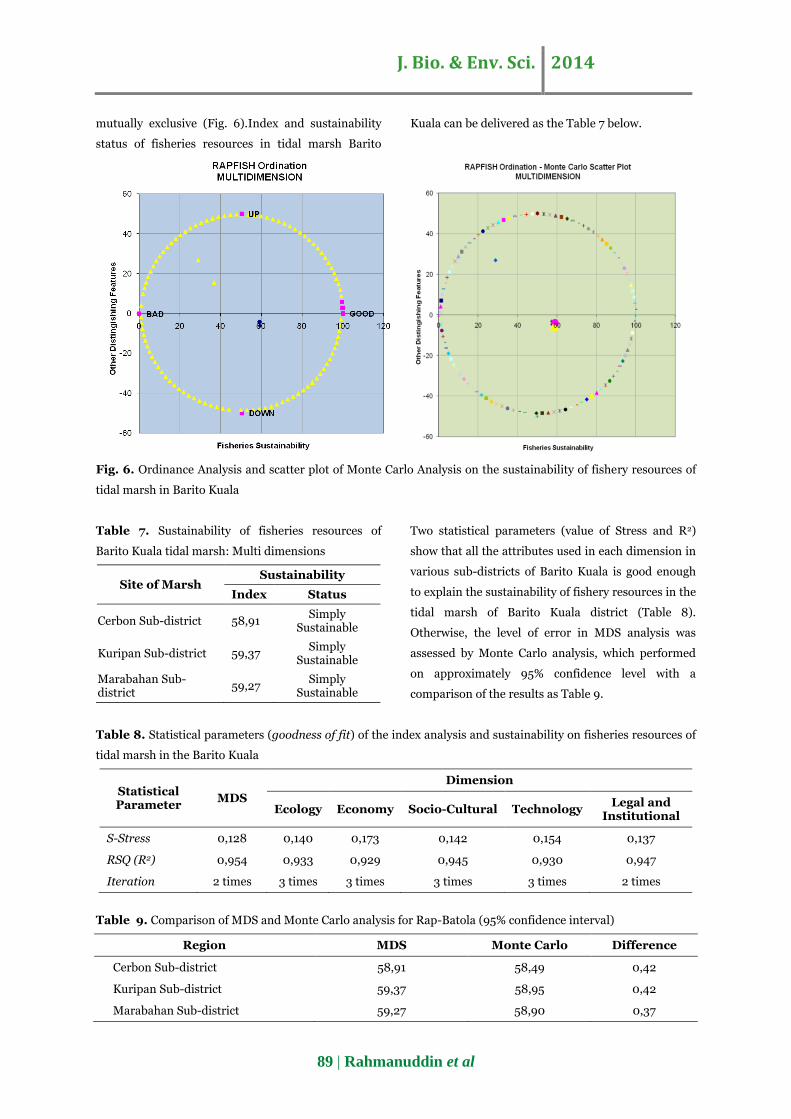
mutually exclusive (Fig. 6).Index and sustainability
status of fisheries resources in tidal marsh Barito
Kuala can be delivered as the Table 7 below.
Fig. 6. Ordinance Analysis and scatter plot of Monte Carlo Analysis on the sustainability of fishery resources of
tidal marsh in Barito Kuala
Table 7. Sustainability of fisheries resources of
Barito Kuala tidal marsh: Multi dimensions
Site of Marsh Sustainability
Index Status
Cerbon Sub-district 58,91 Simply
Sustainable
Kuripan Sub-district 59,37 Simply
Sustainable
Marabahan Sub-district
59,27 Simply
Sustainable
Two statistical parameters (value of Stress and R2)
show that all the attributes used in each dimension in
various sub-districts of Barito Kuala is good enough
to explain the sustainability of fishery resources in the
tidal marsh of Barito Kuala district (Table 8).
Otherwise, the level of error in MDS analysis was
assessed by Monte Carlo analysis, which performed
on approximately 95% confidence level with a
comparison of the results as Table 9.
Table 8. Statistical parameters (goodness of fit) of the index analysis and sustainability on fisheries resources of
tidal marsh in the Barito Kuala
Statistical Parameter
MDS
Dimension
Ecology Economy Socio-Cultural Technology Legal and
Institutional
S-Stress 0,128 0,140 0,173 0,142 0,154 0,137
RSQ (R2) 0,954 0,933 0,929 0,945 0,930 0,947
Iteration 2 times 3 times 3 times 3 times 3 times 2 times
Table 9. Comparison of MDS and Monte Carlo analysis for Rap-Batola (95% confidence interval)
Region MDS Monte Carlo Difference
Cerbon Sub-district 58,91 58,49 0,42
Kuripan Sub-district 59,37 58,95 0,42
Marabahan Sub-district 59,27 58,90 0,37
J. Bio. & Env. Sci. 2014
90 | Rahmanuddin et al
The comparison between MDS and Monte Carlo
analysis shows that the status of fishery resources
sustainability index of tidal marsh in Barito Kuala
district issignificantly indifferent (<1) The small
difference indicate that both mistakes from the
methods and the variety of scoring due to opinion
differences are relatively small. This difference also
shows that the studied systems have a high level of
confidence. Some parameters of the statistical test
results show that the method of Rap-Batolais good
enough to be used as an evaluating tools to assess the
sustainability of fishery resources in the tidal marsh
of Barito Kuala quantitatively and rapidly (rapid
appraisal).
Analysis using Multi-Dimensional Scaling (MDS)
method, which is called Rap-Batola and the results
are expressed in index and status of sustainability.
Kuripan Sub-district have the highest sustainability
index (59.37) compared to the Marabahan Sub-
district (59.27) and Cerbon Sub-district (58,21).
However, in general it can be said that the fishery
resources of tidal marsh in threesub-district area is
quite sustainable. Thus, the status of tidal marsh
fisheries resources in Barito Kuala district is
sustained enough to be developed for the
implementation of regional autonomy.
Recommendation
Barito Kuala district government should prioritize
improvements of attributes or dimensions of
sustainability that have low index values, i.e. the
economic dimension, because the existence of tidal
marsh are passively contribute to the local economy.
Furthermore, the improvement of the attributes
should also not only done on sensitive attributes that
affect the improvement of the status of sustainability,
but also the attributes that are not sensitive to the
status sustainability of the region. So it can improve
the sustainability index values to 100%, by taking into
account the ability of the area itself.
References
Abdurachman A, Sudarman K, Suriadikarta
DA. 1999. Tidal marsh development: success and
failure in terms of physico-chemical of tidal marsh.
In: Abranet et al., Eds. Proceedings of the national
seminar on supporting research of Tidal land
development acceleration, Balittra, Banjarbaru.
Ahiablame L, Chaubey I, Smith D. 2010.
Nutrient content at the sediment-water interface of
tile-fed agricultural drainage ditches. Water 2, 411-
428. Doi:10.3390/ w2030411.
Fauzi A, Anna S. 2003. Depreciation assessment
materials fishery resources fisheries development
policy consideration determination. Journal of
Coastal and Marine 4 (2), 36-49.
Fauzi A. 2000. Training of RAPFISH (multi
dimensional scaling). Center of Resource Economics
and Policy Studies (CREPS), Bogor.
Forestry and Plantation Department of Barito
Kuala District. 2010. Forestry and plantation.
http://v6.baritokualakab.go.id/index.php/pembangu
nan/sumber-dayaalam/ kehutanan-perkebunan.
Accessed March 2014.
Grygoruk M, Mirosław-Świątek D, Chrzanowska
W, Ignar S. 2013. How much for water? Economic
assessment and mapping of floodplain water storage
as a catchment-scale ecosystem service of wetlands.
Water 5, 1760-1779. Doi: 10.3390/ w501760.
Huey GM, Meyer ML. 2010. Turbidity as an
indicator of water quality in diverse watersheds of the
upper Pecos River Basin. Water 2, 273-284.
Doi:10.3390 /w2020273.
Kavanagh P. 2001. Rapid Appraisal of Fisheries
(RAPFISH) Project: RAPFISH Software Description
(for Microsoft Excel). University of British Columbia,
Fisheries Centre, Vancouver.

J. Bio. & Env. Sci. 2014
91 | Rahmanuddin et al
Ridwan A, Djadja SS, Rahardjo MP,
Sulistiono. 2004. Fish physiology (digestion and
feed absorption). Department of Fisheries Resources
Management. Faculty of Fisheries and Marine
Sciences. Bogor Agricultural University, Bogor.
Salihoglu B, Sevinc N. 2013. Quantification of the
synergistic effects of eutrophication, apex predator
pressure, and internal processes on the black sea
ecosystem. Turkish Journal of Fisheries and Aquatic
Sciences 13, 581-592. DOI: 10.4194/1303-2712-
v13_4_03.
Salusu J. 2006. Decision making process planning,
development planning module. Center of
Development Policy and Management, LPPM.
Hasanuddin University, Makassar.
Spence I, Young FW. 1978. Monte Carlo studies in
nonmetric scaling. Phycometrica 43 (1), 75-89.
Susilo SB. 2003. Land suitability analysis of land
use and coastal zone policy Balikpapan Bay. Jurnal
Pesisir dan Lautan 3 (2), 1-16.
Tejoyowono N. 2006. Policy pattern of wetland,
swamp and coastal resources. Scientific Seminar of
25th Dies Natalis of University of Jember, Jember.
Xiang N, Jinghua S, Jingjing Y, Feng X. 2014.
Dynamic modeling and simulation of water
environment management with a focus on water
recycling. Water 6, 17-31. Doi:10.3390/w6010017.