Embed Size (px)
Citation preview

FINAL REPORT
SHEAR STUDS
FOR
SUSQUEHANNA STEAH ELECTRIC STATION
UNITS 1 AND 2
Prepared by: Aravind S. Gore
Checked by : Girish H. Shah
Approved by: M. J. Lidl
BECHTEL POWER CORPORATIONSan Francisco, California
December 30, 1977
(P-85a)

I g
V
1

TABLE OF CONTENTS
Section Title Page
'1.0 Purpose
2.0 Shear Connectors
3.0 Background
4.0 Description of Deficiencies
5.0 Immediate Corrective Action
6.0 Analysis of Saf ety Implications
7.0 Technical Evaluation of Deficiencies
8.0 Corrective Actions 26
9.0 ~ Concl usion 31
APPENDICES
Statistical Analysis and- Evaluation ofField Test Data
Field Test Data
Reduced Field Data
D Repair Procedures
E and F Report by "Fngineering Decision Analysis Company"
(P-Sea>

1.0 PURPOSE
r .
The purpose of this report is to provide final data and in-formation as required by 10CFR50.55 (e) (3) subsecuent to
the notification of a reportable deficiency. 'The subject
deficiency is associated with the installation and inspec-
tion of steel shear connectors in the reinforced concrete
composite floors.
2.0 SHEAR CONNECTORS
Shear connectors, used on this project, are round, headed
steel studs, commercially manufactured. After the erection
of floor beams and the placement of the metal decking, studs
are attached to the top flange of structural steel floorbeams, by resistance, welding using a semi-automatic process.
The studs are then embedded in subsequently placed concrete
and provide a shear connection between the concrete slabs
and structural steel framing to develop a composite floorsystem.
Materials, i'nstallatio'n, welding, inspection and testing ofthe studs is in accordance with Project Specification 8856-
C-19, "Installation of Shear Connectors," and American Weld-
ing Society Code AWS Dl.l-75. The specification requires a
bend test to be performed on the first two studs welded to
each structural steel member. 'fter the completion of stud
installation on any beam, the weld between the stud and

1

structural steel is required to be inspected visually and
tested by selectively bending the studs to a minimum angle
of 30 degrees from the vertical. Such bending does not af-fect the functioning of the stud as a shear anchor.
Composite construction has been used in the following structures:
Category Il. Reactor Building Units 1 and 2
,2. Control Building
3. Diesel Generator Building
Non-Category I1. Turbine Building Units 1 and 2
2. Radwaste Building3. Circulating Water Pumphouse
Inspection of studs in all Category I structures is the respon-
sibility of Quality Control (QC) personnel and the Quality Con-
trol program provides the technical directions and means of docu-
mentation of inspection and testing activities. For Non-Category
I structures, this function is performed by Field Engineering;a
however, documentation is not a requirement.
3.0 BACKGROUND
Subsequent to QC final pre-concrete inspection and acceptance
on May 21, 1977 for concrete placement 183-S-02 (Area 33 atElevation 719'-1" in the Reactor Building Unit 2) PennsylvaniaPower & Light Company Quality Assurance (PLNQA) personnel found
(P-85a)

some studs, which did not meet specification requirements.
It was also observed that the inspection requirements
were not completely met. Two other areas were in progressat this time (Placement 714-S-03, Area 21, E)evation 771'-0"
in the Control Building and 201-S-02, Area 28, Elevation749'-1" in the Reactor Building Unit 1). QC performed
another inspection of all studs for these placements. On
completion of the required repair/rework, QC accepted
these placement areas on May 26, 1977. Subsequently, on
the same date, PLNQA again found a few more nonconforming
studs for these placements.
A stop work report was issued on May 27, 1977 precluding any
concrete placement in the above noted areas.
4.0 DESCRIPTION OF DEFICIENCIES
4.1 Construction personnel failed to repair, test or
replace the defective studs as required by the
specification.
-4. 2 QC personnel failed to inspect and carry out the
assigned responsibilities as defined in the qualitycontrol instructions (QCI) for stud weld inspection.The following specifics are cited:
a. Responsible QC engineering personnel in the
welding discipline signed inspection records
(P-Sea)

'i

signifying that 100% inspection had been.per-
formed. However, the inspections as defined
by the program were not completely performed.
b. Responsible.QC supervision personnel at the
jobsite failed to provide adequate, definitivedirections to the responsible .QC engineering
personnel in the welding discipline and failedto detect the lack of acceptable performance
of the QC engineering personnel.
5.0 IMMEDIATE CORRECTIVE ACTION
5.1 Placements Identified in MCAR-1.18
Nonconformance reports (NCR's) were issued againstthe studs found to be in noncompliance with specifiedrequirements for concrete placements 183-S-02, 201-S-02
and 714-S-03. These NCR's were evaluated and disposi-tion provided to either "rework" or "use as is" de-
pending upon engineering evaluation. In addition,Quality Assurance issued a- Management Corrective ActionReport (MCAR-1.18) on May 26, 1977 and a Stop Work
Report on May 27; 1977. These reports precluded furtherembedment of shear studs pending complete reinspectionof studs in these placements to assure conformance
to specification and design drawing requirements. A
complete reinspection of the three concrete placement
(P-85a)

areas wi.thin the scope of the SCAR was carried out.
The reinspection was accomplished in accordance with
a specially prepared program, containing several pro-
visions to maximize the effectiveness of the inspec-
tion and to virtually eliminate any inspection error.The special provisions included the following:
a. A detailed training program specifically ad-
dressing the unique aspects of the special
inspection and the fundamental requirements
for stud inspection was conducted. Special
emphasis was placed on the recent problems
related to the studs.
b. Each stud to be inspected was uniquely identi-fied by number, providing traceability to the
inspection record for the particular stud.
c. As-built drawings were made identi,fyingthe location of every stud by providing the
direction sequence of the stud numbers.
d. A separate check list was completed and signed
for each particular stud.
e. Each individual stud received a "general sound-
ness test," consisting of striking the stud using
a heavy hammer. Studs failing the soundness testwere replaced with new studs.
(P-85a)

f. Each inspection for each individual stud was doc-
umented, and the resulting inspection records were
independently reviewed for completeness and accept-
ability.
g. NCR's were written identifying nonconforming condi-tions and were dispositioned'providing alternatesof repair and retest or replacement thereby allowingthe field engineer participating in the reinspec-tion to provide direction for immediate replace-ement or repair as necessary. Each occurrence was
documented.
All required repair was accomplished with acceptableresults. Results of the above inspection activitieshave been properly recorded and documented.
5.2 Field Test Data
5.2.1 During this period, stud installation in progressin other areas, was also stopped. These areas
included:
a. Reactor Building:Placement 202-S-Ol, area 27; 199-S-01,
area 25; 202-S-02, area 29, all at Ele-
vation 749'-1" in Unit 1.
Placement 182-S-Ol, area 32; 184-S-01,
area 34 at Elevation 719'-1" in Unit 2.
(P-85a)

b. Control BuildingPlacement 714-S-03,'rea 21
c. There were also some studs exposed in a con-
struction opening in a previously poured slab
in the Diesel Generator Building.All studs in the above areas were thoroughlyinspected by QC using the same inspectioncriteria as described in Section 5.1.
5.2.2 Field Engineering also performed a thorough
inspection of all exposed studs installed priorto May 1977 in the Turbine Building and Circu-lating Hater Pumphouse.
5.2.3 For the Radwaste Building, civil constructionwas completed prior to May 1977. Thus, no
exposed studs were available for inspection.
5.3 Above inspection results of Section 5.2 identified as
field test data in the following sections, are thebasis for statistical evaluation.
It must be not'ed here that for. the three areas noted.
in Section 5.1,
1. Some studs were installed after the bottom re-inforcing steel was placed, thus making the
stud install'ation difficult.
(P-85a>

2. Some studs were welded directly through decking.
Thus, the stud installation in these areas cannot be consi-
dered as, representative. Additionally, the studs in these
areas were subjected to many inspections, therefore, the
inspection results cannot be used as a reliable sample
data. Based on these considerations, this data was ex-
cluded in the statistical analysis.
6.0 ANALYSIS OF SAFETY IMPLICATIONS
The stud installation is grouped into various categories
noted below -to provide a base for analyzing the safety
implications and performing technical evaluation.
6.1 Studs embedded in the concrete prior to May 1977.
6.1.1 As these studs, are embedded, they are not ac-
cessible to determine the quality of the stud
installation.
Until the discovery of the problem, there had
been no major change either in the inspection
and testing criteria or in the method of stud
installation. Thus the field test data, ob-
tained as described in section 5.0, can be
considered as truly representative of the past
work. At certain locations, the data indicates
abnormally high stud failure rates, which
deserve special attention.H
(P-8Sa)


6.1.2 A statistical evaluation of the field test da-
ta has been performed for the purpose of es-
tablishing the failure rate and projecting at90% confidence level the number of reliablestuds that are considered effective in the
existing, installed beams. The statisticalprojection of the number of reliable studs,together with the calculated minimum number
of studs required for each beam, are the
basis for verifying the adequacy of the com-
posite structural system.
6.1.3 Based on the foregoing general criteria the
following two categories are established:
6.1.3.1 For areas- which exhibit acceptable
stud failure rates, the test data
on welded studs indicates that eitherone of the following conditions ismet:
a) Stud failure rates fall withinacceptable industry practice so
as not to jeopardize the struc-tural requirements.
b) The projected number of reliablestuds exceeds the actual minimum
(P-85a)

required according to structuraldesign calculation.
Consequently, in these areas the
structural integrity has not been
compromised, and the structural sys-
tem is in full conformance with the
basic design criteria and the bases
of the Safety Analysis Report.
The Turbine Building, Unit 1 and 2,
Control Building, Circulating Water
Pumphouse, Radwaste Building and
Diesel Generator Building belong
to this category.
6.1.3.2. In areas associated with high fail-ure rates, there are some beams forwhich the projected number of reli-able studs is insufficient with re-
spect to the minimum required by
structural design., This condition
has the, following impl ications: The
design requirements stated in the
Safety Analysis Report are not met
completely due to the potential stud
(P-S5a)-10-


deficiency. Repair work must be un-
dertaken to correct the defective installations and assure that there
are no structural systems which do
not meet the design bases.
The Reactor Building Unit 1 and 2
fall in this category.
6.2 Studs Not Embeoded in Concrete at the Time of theReporteo Pro em.
In these areas, deficient studs are traceable tospecific construction and/or inspection practices,which have been positively ioentified. The studs
in these areas have been inspected under strict en-
forcement of the revised insoection procedures and
repaired or replaced as reauired. New studs were alsoinspected to the full inspection reauirements. Thisprovides adeauate assurance regarding the aualityof the stud installation in these areas.
7 0 TECHNICAL EVALUATION OF DEFICIENCIES
7.1 General
Impact of the above noted deficiencies renders the
structural adeauacy of the studs installed indeter-minate in the absence of technical evaluation. Reme-
dial measures taken and to be taken to prevent the
recurrence are described in section 3.0 and 8.0.
(P-S3a>-11-


Therefore, the technical evaluation in this sectionis limited to the studs embedded in the concrete slabs
prior to Nay 1977.
The approach used for this evaluation is as follows:
a. Evaluate the design criteria and theoretical consi-derations, assumptions, associated research and
testing, which are the basis for the design re-quirements in the AISC specification.
Based upon this evaluation, reassess and/or revisethe original design and compute the number of studs
required, which not only satisfy strength require-ments but also meet the specification requirements.
b. Analyze the field test data statistically to arriveat a success rate at a certain confidence level foreach building.
Based upon this analysis compute the number of re-liable studs on every beam.
c. Design shear connectors.
d. Identify those beams where the number of studs re-quired is larger than the reliable studs.
7.2 Design Criteria and Structural Design of CompositeConstruction
-12-

0

General
A common approach in the design of structuralfloor systems is to develop composite actionbetween the steel framing beams and the rein-forced concrete slabs. The composite actionaffords a flexural system superior to the beam
or slab action alone and generally results incost savings in the overall design. Composite
action is achieved by providing shear connec-
tors welded to the top side of the beam and
embedded in the concrete. These shear connec-
tors can also be used to -improve the anchorage
of steel framing into concrete slabs to permitthe transfer of horizontal loads from the fram-
ing to the slab diaphragm and to incorporatethe slab in resisting heavy loads suspended
from the beams.
7.2.2 Design Criteria and Theoretical Considerations
Section 1.11 of 'Specification for Design Fabri-cation and Erection of Steel for
Buildings'Sixth
Edition) adopted by American institute ofSteel Construction in 1969 and subsequent three
supplements are the bases for structural design.The new revision of the specification is due
for publication in early 1978. Revised section
(P-85b)-13-

1.11 to. be incorporated in the forthcoming edi-tion is published in "Inryco Composite Beam
Design Manual, 21-12" by Inryco Inc. in July1977. This revision is essentially based
upon the paper "Composite Beams with Formed
Steel Deck," by Grant, Fisher and Slutter,in AESC Engineering Journal, Volume 14, FirstQuarter 1977.
Prom the review of the development of this sec-
tion, it is evident that the design criteriais still in the developmental stage, and isbeing modified continuously to reflect the
latest state of the art.
The majority of the research and testing done
to date pertains to composite beams with thinslabs. In the associated theoretical considera-
tions, the ultimate moment capacity of,thet
concrete section is disregarded. Thus, the
contribution of the internal couple produced
by shear connection becomes very significantin computing the ultimate structural capacityand the factor of safety. For reinforced thickslabs, however, the ultimate moment capacityof the concrete section becomes so dominant
-14-

that the significance of the shear connection
is greatly reduced. Thus, the design based
upon the specification results in a high re-serve capacity for composite beams with thickslabs. The AISC specification, however,.has
not recognized this phenomenon.
The-AISC Specification and its supplements de-
fine the allowable horizontal shear loads forstuds and also prescribe analytical procedures
for evaluating incomplete composite action by
equation (l.ll-l) as follows:
S ff= S + Vh (S~-S )VIi
Where: Vh the lesser of the horizontalshear associated. with either theconcrete or the steel section
V11
the shear value permitted by the"number, of connectors provided, re-levant for incomplete compositeaction
Ss section modulus of the steel beamreferred to its bottom flangesection modulus of the transformedcomposite sec tion ( ful 1 ) referredto its bottom flangeeffective section modulus of theincomplete composite section
(P-85b)

The equation is based on early research, and
it represents a linear variation of S ff witheffrespect to V'h.
Recent research recognized by the AISC indic-ates that the functional relationship described
above is more accurately expressed by introduc-ing a square root expression for the shear ra-tio in equation (l.ll-l). This modificationrepresents a refinement on the analytical tech-
nique for the evaluation of incomplete. compo-
site action, and it results in a substantiallyhigher capacity than that allowed by the pre-vious, extremely conservative linear expres-
sion. This proposed expression offers a lib-eralized analysis reflecting the current think-ing, but it prudently affords some conservatism
with respect to the research findings.
The specification also prescribes a minimum of25% of complete shear connection to be devel-
oped by the studs. This lower limit, however,
is arbitrary and is not necessarily based upon
the theory. Zn fact, test results described
in the above referenced paper indicate thatthe test beams with wide slabs and less than
25% of complete shear connection performed0
-16-

satisfactorily with an adequate factor ofsafety. Thus, the test proves that the
percentage shear connection is not neces-
sarily a function of the capacity of the
composite beam or its factor of safety.
Detailed discussion on this subject can be
found in the above noted paper by Grant,
Fisher and Slutter and also in Appendix "E".
As a summary it is concluded that:1. The analytical approach per the present
AISC specification, although reasonable
for beams with thin slabs,= is a very con-
servative method for the composite beams
with thick slabs.
2. The design based upon the specificationusing revised 1.11-1 equation and assum-
ing 25% complete shear connection willstill provide adequate margin of safetyand conservatism.
7.2.3 Structural Design
In the current structural design, the welded
studs were provided in the majority of the
beams to develop complete action, and the
(P-85b)-17-

steel beam sections were designed according tothe arbitrary overall floor loads prescribed
for the various areas. However, in view ofthe potential problem with the welded studs,
the structural design was reassessed with the
intention of relieving the stud reouirements
without violating the basic oesign criteria.
The first step in the reassessment was to re-view the loading associated with each of the
floor beams. This was achieved by considering
actual load distributions obtained from the
eouipment and floor occupancies which at thisdate have been established more definitelythan at the time of initial design. Another
aspect of the load refinement consisted of a
more detailed analvsis of the tributary areas
for each beam by recognizing actual load dis-tributions oerived from the one-way and two-
way flexural action of the corresponding con-
crete slabs.
The second step in the reassessment was to re-fine the oesign by computing the effective sec-
tion modulus according to the latest analytical
(0criteria, i.e., the AISC approved expression
-ls-


with the souare root. This analytical refine-ment allowed for a revised higher capacity for
sections in which the projected number of reli-able stuas did not permit complete composite
action. The above analytical features were
used prudently, and the minimum number of studs
reouired per beam was judiciously selected by
the criteria described in Section 7.4.
7.3 Outline- of Statistical Analysis and Evaluation:
This section provides a brief description of the sta-
tistical approach used in the projection of the reli-ability of studs installed to date. A more detailed
coverage of the statistical analysis used for thisreport is provided in Appendix A. Another statisticalanalysis using different method was performed indepen-
dently, which gave essentially same basic results
(Refer Appendix F).
The initial phase of the statistical analysis was to
segregate the field test data into homogeneous groups
judged to be statistically compatible. This juogement
was based on Chi-sauare test on similarities of the
stud failure rates and their distribution patterns.
The first level of segregation established was accord-
ing to the various buildings within the plant. Each
structure was thus recognized as a separate group with
its own- characteristic sampling and corresponoing sta-.
tistical projections.-19-


The second phase of the statistical evaluation
consisted of determining the reliable studs
for each of the established groups. These pro-
jections are based on the failure rates de-
rived from field test data. Their development
takes into account the number of studs tested
with respect to the total number installed,and recognizes that the reliability of the
studs must not be on an individual basis, but
with due regard to stud groupings derived from
the required number of studs per beam. The,ana-
lytical bases of the statistical projections
are der:ived from the required number of studs
per beam and are based on the hyperbinominal
distributions, without resorting to empirical
idealizations. The fundamental assumption isthat the field samples are unbiased and applic-able to,the balance of the corresponding stud
group. This assumption is justified since the
exposed areas where the sampling was obtained
came into existence randomly, and due to rea-
sons which are unrelated to the stud welding
and QC inspection. The quality of the studJ
welding. in these exposed areas were not in-fluenced by and are independent of the lo-cation of these
areas.'P-85b)
-20-

The confidence level of the statistical projec-tion of reliable studs was set at 90%. This
level of confidence is consistent with the cri-tieria used by governing organizations in-volved in the preparation of codes of practice.Additionally, based upon engineering judgement,
the probability of exceeding the design liveload is extremely low.
7.4 Design of Shear Connectors
7.4.1 General
The shear connectors used in all instances were
welded headed studs, and ar'e designed to be in-stalled by using a semi-automatic welding pro-,cess.
7.4.2 Design Criteria
a. As discussed in Section 7.2.2, partialcomposite action (V'h ) was limited to 25%.
b. The latest expression (square root) was
used for computing the effective sectionmodulus under incomplete composite actionand the corresponding stud requirement.
c. P'resent AESC code does not address the ef-feet of grouping of studs in a rib. Latest
-21-

research and proposed revision to the spec-
ification requires that if there are more
than three studs in a rib, the cumulative
allowable capacity must'be computed by
using the reduction factor (Equations
1.11-8 and 1.11-9). The stud requirement,
which is more stringent based upon the new
code, has been used.
7.4.3 . Following the above design criteria, the num-
ber of studs dictated by the revised struc-tural design calculations, based on reassessed
loading analysis, were computed.
7.5 Conservative Features Not Resorted to in the Design
This is a commentary on some features that would in-crease the margin of safety of the design.
1. Based on engineering judgement, the allowable loadsstuds could be increased in proportion to the square
root of the concrete compressive strength f'c . Zn
the current design, the allowable stud, loads based
on f' 4000 psi, according to the AISC Specifica-tion have been used
actual f'hich isc
without taking credit for the
close to 5000 psi.
(P-85b)-22-

2. In the basic design criteria, live loads are as-
sumed to be acting over the entire floor area.
However, under actual operating conditions, thisis highly unlikely to occur. Thus, the reduction
that may be achieved by considering actual liveloads is not used in the revised design.
3. For computing N2, (Equation 1.11-7), the underly-
ing assumption is that the horizontal shear is re-
sisted by only those studs within the shear span.
In reality, because of the longitudinal bottom
reinforcing steel, the horizontal shear will be
transferred to adjoining studs, although thisphenomenon is not recognized by AISC. Thus, the
computed N2 based upon present design will resultin an even higher factor of safety.
7.6 Discussion on Radwaste Building
The Radwaste Building was completed prior to May 1977.
As no studs were exposed at the time the problem was
discovered, actual test data could not be obtained on
the same basis as it was collected for other struc-tures. For the slab at 715'-0" elevation, there issome record available on the visual inspection and
testing activities performed by Field Engineering col-lectively on area basis instead of individual beam
(P-85b)-23-

basis. Additionally, there are no soundness test re-
sults available for these areas. The record including
bend test results on the studs failing visual examina-
tion is shown in the following Table.
TABLE lArea No. of Total
No. beams studsStuds failing Studs failingvisual exam- bend test
ination
272 32
2 35 2,490 184
16 941 103
15 881 77
13 757 61
14 1,095 85
12 729 59
12 801
759
59
Interviews with the responsible Field Engineer and the
welder provided following information.
I,
1. Studs failing visual or bend test were not in a
single cluster but were spread over the entirearea without any definite pattern.
(P-85b)--24-

2. The welder who did the majority of the stud weld-
ing on this building, worked previously on the
Circulating Water Pumphouse, and is presently
working on the Diesel Generator Building from the
very beginning. It is noted that the field testdata for the above two building indicate OS fail-ure rate, which is a reflection on the workmanship
of the .welder.
3. As a matter of routine, it has been the policy of
the welder to replace the stud, when it would give
unsatisfactory sound of the shot.
4. Additionally, although not required by the speci-
fication, the welder has been bend testing the
last two studs on every beam.
Based upon the engineering judgement and the evalua-
tion of above record and information, the potentialfailure rate on the existing stud installation would
be extremely'low. In addition, present structuraldesign is based upon complete composite action; there-
fore, the additional'factor. of safety is inherently
built into the design. Thus, with adeauate assurance,
it is concluded that the present stud installationmeets the design, criteria.
(P-85b)-25-


7.7 Conclusions
7.7.1 The design of composite beams with thick slabs
per present AISC specification is extremely
conservative.
7.7.2 =All existing beams when designed based upon
the basic theory and computed number of reli-able studs, have adequate margin of safetywithout performing any. repair or modifica-
tion. This design, however, does not satisfythe requirement of the specification for all
* beams.
7.7.3 In order to meet the specification require-ments as noted in the Safety Analysis Report,
those beams where the number of studs required
per revised design is smaller than the number
of computed reliable studs, will be repaired.
7.7.4 Using the above criteria, it is observed thata few beams in the Reactor 'Building requirerepair. These beams are identified, and the
associated repair methods are described inAppendix D.
8.0 CORRECTIVE ACTION
Corrective action are grouped in three categories. Each
category and corresponding actions are described below.
(P-85b)-26-

8.1 Category IThis category describes those studs already embedded
in concrete prior to discovery of this problem in
May 1977.
To evaluate the impact of the deficiencies on the .
adequacy of the structural members, field data was
obtained, analyzed and evaluated. Based upon thisevaluation, the number of projected reliable studs
was computed for each beam and compared with the- number of studs required based upon reassessment
of the design criteria: Wherever the revised stud
requirement is found to be greater than the projec-
ted reliable studs, these beams will be repaired,
as described in Appendix 'D'Repair Procedures",.
On completion of the required repair, the existingstructural members, will satisfy the design require-
ments.
8.2 Category ZI
This category describes the studs in eight placements
in Control and Reactor Buildings, when the problem was
discovered (See Section 3.'0 and 5.0).
Studs in these placements have been extensively in-spe'cted, examined and tested as described in Section
5.0, thus providing adequate assurance that these studs
(P-95a}-27-

(- will perform satisfactorily under design loads. There-
fore, no further corrective action is deemed necessary.
8.3 Category I1IThis category belongs to present stud installationsince the discovery of the problem. Since completionof above noted eight placements the following specificcorrective actions have been instituted at the site.
8.3.1 Corrective Actions by Quality Control.a. The QC welding discipline has been re-
lieved of the responsibility for in-spection" of the studs, except those in-stalled during prefabrication of embeds.
The QC civil discipline has been directedto assume this responsibility. This ac-
tion results in the following upgrading
of the inspection program:
i. The inspection of studs is now more
closely integrated with other relat-ed pr'eplacement inspections, such as
embeds, reinforcing steel, conduit,etc.
ii. Addition of the 'General 'Soundness
Test'P-95a)
-28-

iii. The amount of QC engineering manpower
which may be focused upon stud in-spection is now increased.
1v ~ Inspection may now more often be car-
ried out while stud installation is, being performed, and while craft per-
sonnel are present to perform imme-
diate rework or repair if necessary.
v. Stud inspection may now normally be
completed before the studs are visual-ly, obscured by, other installed items,
such as curtains of reinforcing steel.
b. The inspection plan for stud inspection has
been reviewed and strengthened in the fol-lowing specific areas:
Marking to physically identify both
acceptable and unacceptable studs
has been clearly defined in the in-spection plan.
ii. Verification of proper stud welding
cable length (i.e., less than 100
feet) has been added.
8.3.2 Corrective Actions by Field Engineering.
a. A special training session on stud instal-lation dated June 10, 1977 was conducted
-29-


at the jobsite for QC, Engineering and Su-
pervision to guarantee improved quality ofinstallation.
b. In future placements, installation of rein-forcing steel or other materials which
would interfere with installation or inspec-tion of shear studs will be withheld untilthe shear stud. installation in the area iscompl e ted.
c. A training session was held on June 26, 1977
for all ironworkers involved with stud
installation. Emphasis was placed on the
craftsman's primary responsibility forcorrect installation of shear studs. The
complete installation sequence of studs
was also reviewed in depth.
d. A vendor representative for the welding
equipment was brought on site June 22,
1977. During this visit equipment set-tings, maintenance and trouble shootingwere reviewed with the ironworkers and
superintendents.
e. Equipment maintenance program has been
revised and re-organized including a
(P-95a)-30-

larger inventory of spare parts being
maintained on site.
f. All rectifiers in the field are returned
to the manufacturer on a rotational basis
to ensure they are performing correctly.
9.0 CONCLUSION
9.1 In most of the areas, the projected number reliablestuds are not only sufficient to perform structural
„ function but also meet the specification.
9.2 Although all projected reliable studs are adequate tosatisfy the structural requirement, there are some
beams at a few elevations in the Reactor Buildingwhich do not conform to specification requirements inits entirety. Thus, these deficiencies will be cor-rected by repairs performed on the existing installa-tion.
9.3 On completion of the required repair, the structuralanalysis and design will satisfy. strength and code
requirements and will also assure that the existinginstallation will conform to the design criteria and
bases of Safety Analysis Report.
(P-95a)-31-

APPENDIX A
TO
FINAL REPORT ON SHEAR STUDS
STATISTICAL ANALYSIS
AND
EVALUATION OF FIELD TEST DATA
(P-74b)

STATISTICAL ANALYSIS AND EVALUATION OF FIELD TEST DATA
1.0 OBJECTIVE
To analyze the test data in each beam completed prior toNay 1977 and to determine,t.he statistical basis for esti-mating the total number of oood studs that can be reliedupon.
2. 0 F I ELD TEST DATA
2.1 General
In the fourth week of May 1977, when the problem was
discovered, there were many areas where the stud in-stallation was completed and also the studs were
accessible. These studs were subjected to a thorough
inspection and testing as shown below in the flowchart. In addition to visual examination and selec-tive bend testing as per the specification reguire-ment every stud received 'general soundness test'.Complete field test data and the reduced field testdata used for statistical analysis is provioed inAppendix B and C respectively.
2.2 DEFINITIONS:
l. Soundness Test: On completion of stud welding,the stud is struck with a heavy hammer. If it.gives a clean ringing sound, the stud is consi-dered acceptable. Otherwise it is replaced witha new stud.
(P-74a)

2. Visual Examination: After completion of 'the
soundness test, each stud is examined visually'o insure that there is fillet weld all around
th'e periphery of the stud. lf there are no voids,the stud is considered passing the visual examina-
tion.
:3. Bend Test: Studs failing visual examination. are
bent 15.away from the void in the weld with re-., spect to the- vertical axis. lf the stud does not
'develop cracks at the root or separates from the
beams, it is considered acceptable. This is the
.most severe and, reliable test.
2.3 FLO!0 CHART
Studs testedin a beam
Studs passingsoundness test Ps.
Studs failingsoundness test Fs
Studs passingvisual examination
Studs failingvisua3 examination
Studs bend tested Fvl Studs which were repairedFv2
Pass bendtest Pl
Fail bendtest
Pass bendtest P2
Fail Bendtest F2
.-Rote: P2 and F2 are assumed numbers. See section 2.6.3;3
for clarification.(P-74 a)

2.4 Notations:
2X = Chi-square
N = Number of beams tested in each building.T = Total studs tested in a beam.
Ps = Studs passing- soundness test.Fs = Studs failing soundness test.Pv = Studs passing visual examination.
Fv = Studs failing visual examination.
Fvl = Studs failing visual examination, which were
bend tested.
Fv2 Studs failing visual examination, which were re-
paired prior to bend test.
Pl = Studs (Fvl) passing bend test.Fl = Studs (Fvl) failing bend test.P2 = Studs (Fv2) passing bend test (assumed).
F2 = Studs (Fv2) failing bend test (assumed).
P = Good studs
Pv + Pl + P2
F = Bad studs
Fs + Fl + F2
( P-74a)

2.5 Summary of Field Test Data
Table 1
Structure Number ofbeams
Total studstested/examined
Reactor Building
Control Building
Turbine Building 17
11309
1764
831
Circulating Haterpumphouse
Diesel GeneratorBuilding
107
2.6 Discussion on Field Test Data
2.6.1 Studs failing soundness test (Fs)
The soundness test indicates the qualityof the weld between a stud and structuralsteel but it may not be foolproof. That is,it is very likely that some of the studs
failing this test may be good from a struc-tural strength point of view. Since the
exact reliability of the soundness test is not
known, all studs failing the soundness testare considered to be bad studs, to insure
conservative 'estimates.
(P-74a)

2.6.2 Stuos passing visual examination. (Pv)
Stud manufacturers have indicated that irre-spective of the method of testing, the overallfailure rate is observed to be about 2% under
normal working conditions. Based upon thisfact, in a given population of studs (T), ifthe studs failing visual and soundness test(Fs + Fv) are removed, the'uccess rate forthe remaining sample (Pv) can reasonably be
considered to be 100%. A recent bend testconducted on randomly picked population of543 studs, which had passed both visual and
soundness test gave 3.005 success rate. Thus,
these results also reinforce the validity ofthe above assumption.
2.6.3 Studs failing visual examination (Fv)
For this category, the specification providesan option to the field either to perform a
bend test or to repair. Field test indicatesh
that all studs were not necessarily subjected
to bend test. The test was performed on (Case 1)
all, (Case 2) one, (Case 3) some or (Case 4)
none of ths studs on a beam. Reasons for ei-ther including or excluding the studs to be
subjected to bend test was based upon any one


of the following: construction schedule, ac-cessibilityy,
inadeauate room for replacement
in case of a failure and arbitrary decision
by the field. Thus, for case 2, 3 and 4 toinclude the studs repaired (FV2)'or statis-tical analysis, following criteria has been
used.
2.6.3.1 'Case 1: Pv = FV1
FV2 = 0
As the bend test is performed on allstuds failing visual (Fv), the testdata is used 'as is'.
2.6.3.2 Case 2: Fvl = 1
Fv2 = Fv — 1
In this case, only one stud was sub-
jected to bend test, thus its resultscan not be applied in a meaningful
way to other studs. Therefore, beam
samples containing this combination
are omitted from the total sample.
2.6.3.3 Case 3 : Fvl Q '
Fv2 = FV-- FV1
For the reasons stated above, selec-tion of the studs to be bend tested
(P-74a)

was arbitrary therefore the failurerate as observed for FV1 can reason-
ably be assumed to be same for FV2.
2.6.3.4. Case 4: Fvl = 0
Fv = Fv2
As no bend test data is available
for Fvl, beam samples containing
this combination were excluded
from the total sample.
2.7 Based upon the above criteria, failure rate for each"
beam is calculated as noted below.
Failure rate = Fs+ Fl+ F2~Tota stu<uts T)
where Good studs = Pv + Pl + P2
and Bad studs = Fs + Fl + F2
3.0 ANALYSIS OF FIELD TEST DATA
3.1 Although the Field test data is available for fivebuildings, the data for only three buildings with
higher failure rates is considered here for statis-tical analysis. The reason for this is, the failurerate for Circulating Water Pumphouse and Diesel Gen-
erator Building is 0%.
For the Reactor, Control and Turbine buildings, in a
total sample of 72 beams, 7967 studs were tested. Fol-
lowing the criteria described in sections 2.6.3 and

2.7, 7427 passed and 540 failed for an overall success
rate of 93.22%. It would be attractive to treat thisdata as a single aggregate sample since that would
yield the greatest precision of the estimate of the
success rate parameter p. However, different failurerates have been observed in different buildings so
that failure parameters may differ from building tobuilding. Statistical tests were used to determine
whether this in fact did occur.
3.2 Construction of various buildings is done on the area
concept, i.e. a separate group of Field Engineers,
Superintendents and workers are assigned to and re-sponsible for the construction of that particularbuilding. Thus, even though the governing specifica-tion is the same for all buildings, workmanship and
auality may vary within reasonable limits from build-ing to building.
Test results for the above three buildings are sum-
marized as below.
Table 2
BuildingStudspassed
Studsfailed
%Failurerate
ReactorControlTurbine
49701633
824
402131
7
7 ..487.420.84
Total 7427 540 6.78
From the above table there is a noticeable amount of

variation in the failure rate. The primary question isif these are variations to be observed in any random pro-cess (e.g., 10 tosses of the same fair coin may yield 7
heads in one sequence and 4 in the other) . lt must be
emphasized here that all known parameters affectingthe failure rate are the same for the entire stud welding
operation in any building. If the different rates can
be shown to lie within the realm of probabilistic'noise,'hen
all individual tests may be pooled together intoan aggregate sample and 6.78% as the failure rate.However, if this can not be shown, then the data must
be regarded as separate subsamples and an allowance
made for the lower precision which results. The sub-
sequent section on the hyperbinomial distribution de-
scribes how the final recommendations incorporatethis loss in precision to assure a rigorous and con-
servative analysis.
The key analytic question is whether or not the underly-ing pass/fail probability is the same for above three
buildings. The principal statistical tool to be used is2.the X test of homogeneity.
If the studs in all three buildings had a common failurerate of 6.78%, (i.e. if homogeneity is null hypothesis),the expected number of "passes" in the Reactor .Buildingwould have been 5008 with 1644 and 775 expected in the
Control and Turbine Buildings respectively. Similarly,
(P-74a)

the expected number of failures would have been 364,120
and 56.
The X test statistic is based upon the differences be-
tween all 6 observed and expected values.
X test = (4970-5008) + (1633-1644) + (824-775)
+ (402-364) + (131-120) + (7-56)
= 51.31*
This test statistic is approximately distributed as an
X random variable with 2 degrees of freedom [1] for" which there is only 0.5% chance of exceeding 10.6.
Since the test statistic is so much greater than thisvalue, the conclusion is that the sample under consi-deration is non-homogeneous. Thus, each building must
be considered as an individual subsample.
3.3 Even after the need to analyze the data building by
building is established, the major concern is the
adequacy of collection of studs on each individualbeam or girder, for determining effectiveness ofcomposite action. Therefore, it is necessary toconsider the field data for each beam as an individualsample.
*T is va ue i ers rom t e exact X value. The apparent difference2is due to rounding off the expected values to integers for narrativepurpose. The exact values were used in reaching all data clusteringdecisions.
[1] A. M. Mood and F. A. Graybill, Introduction to Theory ofStatistics. McGraw Hill (1963) p. 318.
-1 0-

3.4 Based upon above discussion and criteria, the beam data
for each building is analyzed.
3.4.1 Reactor Building Units 1 and 2
Although the following discussion pertains to
the Reactor Building, it is also applicable to
other buildings except as noted otherwise..
For a sample of 44 beams, the data can be
grouped as follows:Number
of beams Failure rate
20 to 38$
15 to 20%
10 to 15%
20
5 to 10%
0 to 5%
It is evident from the above grouping, that for the
majority of the beams, the failure rate ranges from
0 to 108. When the X test was performed on the sam-2
pie of 44 beams, the sample was found to be non-homo-
geneous. Notwithstanding that the method of stud in-stallation, the governing specification, workmanship,
construction sequence, and all other known'variables
were same, the wide variation in the failure rate can
not be explained. Despite testing the sample withvarious permutations and combinations, no reason was
found which-could be attributed for this occurrence.
(P-74a)-ll-

In light of this situation, it was decided to testthe truncated sample i.e, disregarding the beam sam-
ples starting with the lowest failure rates, for es-
tablishing homogeneity. After several iterations,a sample of 6 beams with,failure rate ranging from
19.05% to 38.36% was found to be homogeneous. This
truncated sample with 390 'passes'nd 146'failures'ave
overall failure rate of 27.2%. With the above
discussion, it must be emphasized here that using thishigher failure rate is indeed an extremely conservative
assumption, and can be applied, with a high confidence
level, in projecting 'good'tuds in the areas where
the studs have already been embedded in the concrete.
3.4.2 Control BuildingThe data is available for 11 beams with 1764
studs tested. The failure rate for the beams
ranged from 3.53 to 25.93%. It was also ob-
served that only one beam has unusually high
failure rate. When, the total sample was test-ed for homogeneity, the sample was found'to
be non-homogeneous. However, the sample ex-
cluding the beam with the highest failure ratewas found to be homogeneous. In light of thisfact, it can be concluded that the data forthis particular beam with the highest failurerate is a stray sample. However, for computing
(P-74a)-12-

v
the overall failure rate,'his beam is in-cluded.
3.4.3 Turbine Building
Available data is for 17 beams with 831 studs
tested. Out of this total, 824 passed and 7
failed giving average failure rate of 0.84%.
It is observed that 15 beams out of 17 beams,
have 0% failure rate. The sample consisting\
of remaining two beams was found to be homo-
geneous. Thus the failure rate of 4.14% for
these two beams has been used for all the
beams in Turbine Building which again is a
conservative approach.
3.4.4 Circulating Water Pumphouse
At the time, when the problem was discovered,
only two beams with a total of 107 studs were
exposed. Out of this total, only one stud
failed visual examination but the stud passed
the subsequent bend test. Thus, the observed
failure rate is 0%.
3.4.5 Diesel -Generator Building
Forty-four studs on a beam in a construction
opening were exposed. All the studs were
tested with no failure, thus giving a failurerate of 0%.
(P-74a)-13-

3.5 Summary
BuildingStudsPassed
Studsfailed Failure rate
Reactor
Control
390
1642
146
121
27.2%
6.85%
Turbine 162 7 4 e14%
Above information was used as inputs into the hyper-
binomial distribution to establish probabilistic char-
acteristics of beams and girders for each building as
described in the subsequent section.
4.0 HYPERBINOMIAL DISTRIBUTION
The results of the above analysis establishes the appropri-
ate homogeneous groupings of test data for quality charac-
teristics of individual studs.
This analysis proceeds by recalling the hyperbinomial dis-tribution.( ) The motivation is as follows. First, if the
success parameter, p, were known precisely. then the totalnumber of good studs (k) in a collection of h would vary
according to a binomial distribution:
Ptkof hIp) k p, 1p
For example, if p = 6 and h = 5, then the numerical values 'of
the resulting mass function would be:
H. Raiffa and R. Schlaifer, Applied Statistical DecisionTheory Harvard University Press (1961). p. 237
(P-74b)-14-

No. Good Studs = k pkof 5;p=.601234
5
. 010
.077
.230
.346
.259
.07800
However, if p is not known but must be estimated, then such a
binomial distribution assumes more precision than actuallyexists and makes things appear better than they are. For ex-
ample, if n studs have been tested and only r passed, then the
parameter p itself has a probability distribution,
f ( )(n+1) ! r (1 )r! (n-r) !
for 0 < p < 1
~lthe familiar beta distribution( ) . Thus, while the expected
value of p is r/n, other values of p between 0 and 1 may also
have generated the sample, and these cannot be ignored in any
subsequent inferences.
To obtain the probability of k good studs in a beam of h when
r of n similar studs have passed the strike test, the uncondi-
tional distribution mav be found by:1 ~
P [k of h; r of n] = P [k of h)p) f (p; r, n) dp0
1 h! k 1h-k (n+1) ! r n-r
! p0
al,-,,....,., ~,.„...„....,...,yof Statistics, McGraw-Hill (1963) p. 129 ff.
(P-74b)

Collecting constants:
h! (n+1) !k! (h-k) ! r! (n-r) !
k+r (1 p)n+h-r-k
dp
performing the integration,h! (n+1) ! (k+r) ! (n+h-r-.k) !
! hk)! r! n r)! n+h+1)!
and rearranging terms in combinational notation yields the
hyperbinomial distribution:P [kofh; rof n]
r+k n+h-r.-kr h-k
n+h+1 for k = 0, ..., hand r < n
To gain a sense of the effect of this distribution, suppose
that 1S studs have been tested and 9 have passed. The esti-mated value of p is 9/15 (i.e., still .6) as before. However,
repeated evaluations of the above expression yields the fol-lowing distribution:
No. Good Studs (k)
012345
p k; 9 of 15
.023
.103
.227
.303
.246
.098MRo
Note that this distribution is more diffuse than the simple
binomial; i.e. the tails of the distribution are,-"fatter"
and less probability mass is concentrated around the central
value. The import of this is that when infe'rences are made
about the adequacy (or inadequacy) of studs on beams or gird-ers, a more stringent, conservative set of standards are ap-
plied than would result from the simple (and inappropriate)
(P-74b)-16-


binomial distribution.
The values of n and r are on the order of 20 studs to severalhundred in some instances. Thus, the evaluation of all the
appropriate mass and cumulative distributions is a laboriousand computationally demanding task. Accordingly, a computer
program was developed to assist in these studies. The pro-gram listing accompanies this appendix. The program containscomments to make it self-documenting.
Statements 20, 30, and 40 are used to set the parameters ofthe distribution. The two key ideas are:
i) all probabilities are carried in logarithmic form.- until the final printout to guard against round-off
error and assure the requisite level of accuracy.
ii) each value of the mass function is related to the
previous one, so that once p(0 of h; r of n) isfound, the other values may be calculated recursive-ly. This reduces the number of factorial evaluationsand.aids the computational efficiency of the totalprogram.
Execution of the computer program yields the density and theprobability functions derived from a given set of field testdata for a given total of studs grouped according to the num-
ber of studs per beam. Next this output is reduced to obtainthe probability of exceeding the prescribed design criteria as
a function of the number of reliable studs which exist or which
(P-74b)-17-

are to be provided in a given beam. From this information,'he projected number of reliable studs for a given beam isderived observing the stipulated 90% confidence level.
Acknowledgement:
The foregoing appendix was prepared under the direction ofDr. Carl W. Hamilton, Associate Professor of QuantitativeBusiness Analysis, University 'of Southern California. Dr'.
Hamilton was engaged as a consultant for statistical studies.
(P-74b)-18-

~ ~
(y STUDS
>t ~
PROGFWt LISTING FOR THEHYPERBINOMIAL PROBABILITY DISTRIBVTIOh~
ao20304045506070901101401501601701SO190200210220230240250260270280500510520530540550
DIH P[300]H=5R=9N=15REH ~ ~ ~ ~ ~ ~ ~ ~ ~ ~ ~ ~ ~ ~ ~ ~ ~ ~ ~ ~ ~ ~ ~ ~ ~ ~ ~ ~ ~ ~ ~ ~ ~ ~ ~ ~ ~ ~
REH FIND P(0) FOR THE STARTING POINTREM SET THE NILfERATOR FACTORSh'1] ~h+H-RN[2]-N+1REM . SET THE DENOMINATOR FACTORSD[1]=N-RD[2]=h+H+1h'l=D1=0FOR J=l TO 2F N'[j]COSUB 500N1~Nl+FaNEXT JFOR J~a TO 2F=D[J]GOSUB 500Dl=Dl+FlNEXT JP [1]=Na-DaGOTO 600RH 1 ~ ~ ~ ~ ~ o ~ ~ ~ ~ o ~ ~ ~ ~ ~ ~ o o o o ~ 'o
~ ~ ~ ~ o ~ ~ ~ o ~ o o ~ ~ ~ o
REH SUBROUTINE TO GET F1=LOG(F()F1~0IF F>l THEN 550RETURNFOR Z~2 TO F
~ ~ ooo ~ o ~ ~ ~ ~
560 Fl=F1+I OG (Z)570 NEXT Z590 RETURN
(~
595. 600
6106156206256306406506606706806907007107207309000
I ~ ~ ~ ~ ~ ~ ~ ~ ~ ~ ~ ~ ~ ~ o ~ ~ ~ ~ o ~ ~ ~ ~ ~ ~ ~ ~ ~ ~ ~ o ~ ~ ~ ~ o ~ ~REtREH COMPUTE P (1), P (2),...., ETC.FOR K~2 TO H+1x=k-aP[K]=P[1'-1]+LOG(R+X)-I.OG(N+H-R-X+1)P[K]=P[K]-LOG(X)+LOG(H-X+1)NEXT KREH CHANGE I-OCS TO PROBABILITIESFOR K=1 TO H+1P[K]-EXP(P[K])NEXT KREH PRINT THE RESULTSC=OFOR K=1 TO K+1C=C+r[K]PRINT 1'-l,p[K]+NEXT I'
~ ~ ~ ~ ~ ~ ~ ~ ~ ~

APPENDIX B
TO
FINAL REPORT ON SHEAR STUDS
FIELD TEST DATA

1. inspection results noted as Field Test Data on the fol-lowing pages, pertain to the exposed studs installedprior to Hay 1977
2. For the explanation of the terms and expressions used,
refer to Appendix "A".

Cr
:I FIELD TEST DATA FOR REACIOR BLDG. 41
Placement: 202-S-01 Area: 29 Elev. 749'-1"
Sample Beam StudNo. No. Installed
StudsFailing
SoundnessTest
Studs Failing VisualExam. With Bend Test
ResultsFailing
Total Bend Test
Fl
StudsFailingVisual
Exam. ButRepaired Remarks
16 88 Case 1
17 86 27 Case 3
18 88 16 Case 1
86 34 Case 1
20 88 15 Case 3
21 86 13 Case 2
22 88 47 Case 4
23 86 Case 4
24 10 86 35 Case 4
83 30 Case 4
26 12 80 32 Case 4
27 13 213 37 Case 3
28 14 90 18 Case 3
29 15 132 10 Case 3
~~86ai

I

FIELD TEST DATA FOR REACIOR BLDG. 41
Placement: 199-S-01 Area: 25 Elev. 749'-1"
SampleNo.
Beam StudNo. Installed
\
StudsFailing
SoundnessTest
Studs Failing VisualExam. Kith Bend Test
ResultsFal lng
Total Bend Test
StudsFailingVisual
Exam. ButRepaired Remarks
FS Fl
450 188 Case 4
39 15 Case 4
21 Case 4
26 10 Case 4
CO,50
30
16
22
Case 4
Case 4
48 31 Case 4
17 216 105 Case 4
18 76 12 Case 4
10 19 76 16 Case 4
20 76 Case 4
12 21 76 27 Case 4
22 76 Case 1
14 ~ 30 123 Case 4
(r 86a)

I ~
I t

1
FIELD TEST DATA FOR REACIOR BLDG. 41
Placement: 199-S-Ol Area: 25 Elev. 749'-1
Sample Beam StudNo. No. Installed
StudsFailing
SoundnessTest
FS
Studs Failing VisualExam. Kith Bend Test
ResultsFai zng
Total Bend Test
Fl
StudsFailingVisual
Exam. ButRepaired Remarks
15 31 165 29 Case 4
(P-86a)

C
FIEKZ) TEST DATA FOR REACTOR BLOG. 41
r"Placement:
r
202-S-01 Area: 29 Elev. 749'-1"
Sample Beam StudNo. No. Installed
StudsFailing
SoundnessTest
FS
Studs Failing VisualExam. With Bend Test
ResultsFal lng
Total Bend Test
Fl
StudsFailingVisual
Exam. ButRepaired Remarks
FV2
30 16 62 16 0 Case 1
31 17 32 20 Case 4
32 18 711 102 Case 3
33 19 177 62 Case 1
34 20 149 19 Case 1
C 35 21 86, 14 Case 1
36 22 84 23 Case 4
37 23 96 16 Case 1
38 24 106 35 Case 4
39 '27 0 0 22 - Case 4
40 26 34 0 Case 2
27 17 Case 4
42 28 101 41 . Case 3
r 43 29 105 0 18 Case 4
<P-86a>

,~
F1ELD TEST DATA FOR REACTOR BLDG. 41
Placement: 202-S-02 Area: 29 Elev. 749'-1"
Sample Beam StudNo. No. Installed
StudsFailing
SoundnessTest
FS
Studs Failing VisualExam. With Bend Test
Resul tsFax xng
Total Bend Test
FV1 Fl
StudsFailingVisual
Exam. ButRepaired Remarks
44 30 96 39 Case 4
31 88 Case 1
32 130 15 Case 4
47 33 130 24 24 Case 3

f Il i e

ceFIELD TEST DATA FOR REACTOR BLDG. 41
Placement: 202-S-01 Area: 27 Elev. 749'-1"
Sample Beam StudNo. No. Installed
StudsFailing
SoundnessTest
FS
Studs Failing VisualExam. With Bend Test
ResultsFan xng
Total Bend Test
Fl
StudsFailingVisual
Exam. ButRepaired Remarks
48 114 Case 4
13 Case 4
50 34 13 Case 3
10 Case 1
52 76. 66 Case 4
ce- Case 3
54 274 67 20 Case 3
18 Case 3
57 18 Case 3
10 44 30 Case 1
45 18 4 Case 1
59 12 48 14 Case 3
60 13 42 Case 4
(061 14 21 Case 1
(P-86a)

(FIELD TEST DATA FOR REACTOR BLDG. Cl
Placement: 202-S-Ol Area: 27 Elev. 749'-1"
Sample Beam StudNo. No. Installed
StudsFailing
SoundnessTest
FS
Studs Failing VisualExam. With Bend Test
ResultsFax zng
Total Bend Test
FV1 Fl
StudsFailingVisual
Exam. ButRepaired Remarks
62 17 223 19 Case 1
63 19 38 22 12 Case 1

(FIELD TEST DATA FOR R-WCIOR BLDG. 42
Placement: l82-S-01 Area: 32 Elev. 719'-1"
Sarrnle Beam StudNo. No. Installed
StudsFailing
SoundnessTest
Studs Failing VisualExam. With Bend Test
ResultsFal 1ng
Total Bend Test
StudsFailingVisual
Exam. ButReoaired Remarks
FS FV1 Fl
64 66 21 Case 4
65 70 23 Case 2
66 62 29 Case 4
67 62 36 Case 4
68 62 18 Case 4
i 69 122 Case 4
70 Case 4
71 16 Case 4
72 87 21 Case 4
73 10 50 19 Case 4
74 32 12 Case 4
12 241 31 Case 2
76 13 204 10 Case 3
77'4 198 53 Case 4

l f
/

'FIELD TEST DATA FOR 1HACTOR BLDG. 02
Placement: 182-S-01 Area: 32 Elev. 719'-1"
Sannle Beam StudNo. No. Installed
StudsFailing
SoundnessTest
FS
Studs Failing VisualExam. With Bend Test
ResultsFan zng
Total Bend Test
StudsFailingVisual
Exam. ButRepaired Remarks
78 307 Case 1
79 20 36 19 Case 4
80 21 Case 4
81 22 68 Case 4
82 23 76 22 Case 4
( 83 29 15 Case 4
<r 86a)
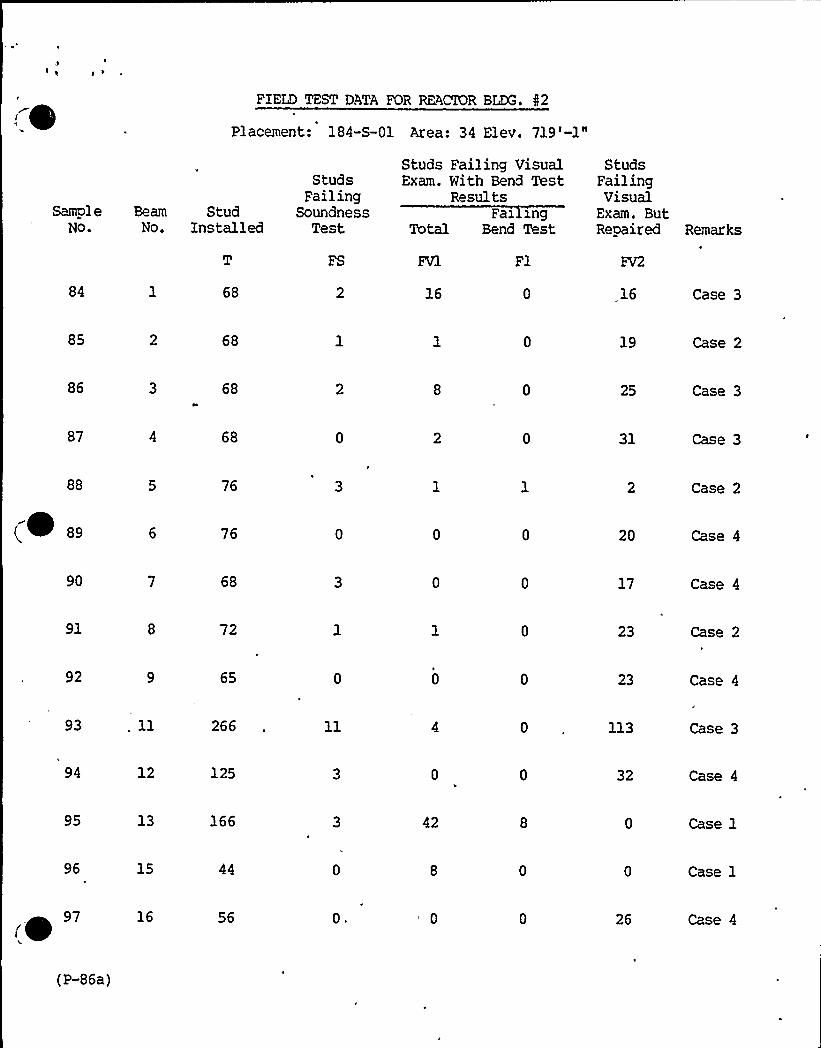
FIELD TEST DATA FOR REACK)R BLDG. g2
Placement: 184-S-Ol Area: 34 Elev. 719'-1"
Samol e Beam StudNo. No. Installed
StudsFailing
SoundnessTest
FS
Studs Failing VisualExam. With Bend Test
ResultsFan xng
Total Bend Test
FVl Fl
StudsFailingVisual
Exam. ButReoaired Remarks
FV2
84 68 16 16 Case 3
85 68 19 Case 2
86 68 25 Case 3
87 68 31 Case 3
88
(0 89
76
76 20
Case 2
Case 4
90 68 17 Case 4
91 72 23 Case 2
92 65 23 Case 4
93 266 113 Case 3
94 12 125 32 Case 4
95 13 166 Case 1
96 15 Case 1
97 16 0. 26 Case 4

I ~
rFIELD TEST DATA FOR REACIOR BLDG. 42
Placement: 184-S-01 Area: 34 Elev. 719'-1"
Sample Beam StudNo.. No. Installed
StudsFailing
SoundnessTest
Studs Failing VisualExam. With Bend Test
ResultsFai zng
Total Bend Test
StudsFailingVisual
'xam. ButRepaired Remarks
98 17 76
FS FVl Fl
0 0 10 Case 4
99 18 153 15 64 Case 4
100 19 71 Case 1
101 20 70 Case 3
102 21 70 14 Case 3
~ 103
104
22
23
72
269 110
Case 2
Case 4
105 70 20 Case 2
106 25 70 27 Case 4
.107 26 69 0 8'ase 4
108 27 73 23 28 Case 1
109 28 256 37 13 105 Case 3
110 29 86 13 Case 3
(.31 245 12 89 Case 4
(Z 86a>

FIELD TEST DATA FOR CONTROL BUILDING
Placement: 714-S-03 Area: 21
SampleNo.
StudsFailing
Beam Stud SoundnessNo. Installed Test
FS
Studs Failing VisualExam. With'Bend Test
Resul tsFai zng
Total Bend Test
Fl
StudsFailingVisual
Exam. ButRepaired Remarks
7
,- 8
9
10
3 170
4 . 167 4
202
5A 54
204
210
141
10
138
135
169 0
2 174 7
24
15
14
22
38
34
29
13
20
13
19
Case 3
Case 3
Case 3
Case 3
Case 3
Case 3
Case 3
Case 3
Case 3
Case 3
Case 1
( ~(P-86b)

(~
~
FIELD TEST DATA FOR IURBQK BLDG. 41
Placement: — Area: 16 Elev. 729'-0"
Sanple BeamNo. No.
StudsFailing
Stud SoundnessInstalled Test
FS
Studs Failing VisualExam. Nith Bend Test
Results,Fan zng
Total Bend Test
Fl
StudsFailingVisual
Exam. ButRepaired Remarks
8
,010
.12
13
15
16
17
9
10
13
14
15
16
17
18
64
32
100
24
24
124
80
46
45
48
42
40
96
0
10
5'
0
0
Case 1
Case 1
Case 1
Case 1
Case 1
Case 1
Case 1
Case 1
Case 1
Case 1
.Case 1
Case 1
Case 1
Case 1
Case 1
Case 1
Case 1
<0(P-86b)

~ ~

FIELD TEST DATA
SweeNo.
StudsFailing
Beam,
Stud SoundnessNo. Installed Test
Studs Failing VisualExam. With Bend Test
ResultsFan xng
Total Bend Test
StudsFailingVisual
Exam. ButReoaired Remarks
Circulating Water Pumphouse
1 53
FS Fl
Case 1
54 0 Case 1
Diesel Generator Building
qe44 Case 1
(P-86b)

APPENDIX C
TO
FINAL REPORT ON SHEAR STUDS
REDUCED FIELD TEST DATA
(P-74b)

SUMMARY
OF
REDUCED FIELD DATA
StructureSample-Nos.
TotalStUdS
TotalPass
TotalFail
ReactorBuildingUnits 1and 2
44 5372 4970 402
TurbineBuildingUnits 1and 2
17 831 824
ControlBuilding 1764 1633 131
CirculatingWaterPumphouse
107 107
DieselGeneratorBuilding
44 44
Note: For the explanation of terms and expressions used onthis and the following pages refer to Appendix "A".
(P-86b)

REDUCED FIELD DATA FOR STATISTICAL ANALYSIS
Building : Reactor Building
Studs failingvisual with
bend test results
Studs failing visualbut repaired prior
to bend test
Sample TotalNo. Studs
StudsFail- Studsing . Passing Total
Soundness Visual
Pass Fail Pass Failbend bend Total Assumed Assumed (Pv+Pl (Fs+Fltest test Pass Fail +P2) +F2) Remarks
FS PV FV1 Pl Fl FV2 P2 F2
13 76
16 88
17 86
18 88
19 86
20 88
27213'8
90
29 132
30 62
0
70
67
58
68
52
174
68
114
46
21
27
16
34
37
18
16
19
19
13
27
36
13
0 0
2 0
8 1
3 0"
0
7 0 0
3 15 9
1 2
3 2
1 10
3 0
70
86
77
81
'979
1 211
84
2 129
0 59
(P-86b)

REDUCED FIELD DATA FOR STATISTICAL ANALYSIS
Building: Reactor Building
Studs failingvisual vith
bend test results
Studs failing visualbut repaired prior
to bend test
Sample TotalNo. Studs
StudsFail- Studsing Passing Total
Soundness Visual
Pass Fail Pass Failbend bend Total Assumed Assumed (Pv+Pl (Fs+Fltest test Pass Fail +P2) +F2) Remarks
32 711
33 177
34 149
35 86
37 96
42 101
45 88
47 130
50 34
51 10
53 157
54 274 51
71
79
81
79
20
10
139
136
14
16
41
24
13
16
67
PV FVl
553 52
ill 62
130 . 19
Pl Fl FV2 P2
51 1 102 100
53
19
9 0 0
0 0 0
20
10
0 0 0
4 24 20
3 1 0
0 0 0
ll 5 2
52 15 20 15
F2
704 7
164 '3149 0
82 4
90 6
100 1
88 0
119 ll30 4
10 0
151 6
203 71
(P-86b)

I I ~ ~ '

REDUCED FIELD DATA FOR STATISTICAL ANALYSIS
Building : Reactor Building
Studs failingvisual with
bend test results
Studs fag.ing visualbut repaired prior
to bend test
Sample TotalNo. Studs
StudsFail- Studsing Passing Total
Soundness Visual
Pass Fail Pass Failbend bend Total Assumed Assumed (Pv+Pl (Fs+Fltest test Pass Fail +P2) +F2) Remarks
55 57
56 57
57 44
58 45
59 48
61 21
62 223
63 . 38
76 204
78 307
84 68
86 68
FS
12 30
23
26
14
125
15
178
305
34
94
22
16
33
PV FVl
38 18
38 18
Pl
12
10
Fl FV2 P2
6 1 0
8 1 0
21 9
14 4
14 0
'3 3
75 19
10 12 0
10 1 10
0 0 0
16 0 16 16
8 0 25 25
F2
0 ~
P F
50 7
48 9
33 ll37 8
46 2
17 4
200 23
25 13
197 7
305 2
66 2
66 2
(P-86b)

t I

REDUCED FIELD DATA FOR STATISTICAL ANALYSIS
Building: Reactor Building
Studs failingvisual with
bend test results
Studs failing visualbut repaired prior
to bend test
Pass Fail Pass Failbend bend Total Assumed Assumed (Pv+Pl (Fs+Fltest test Pass Fail +P2) +F2)
StudsFail- - Studs
Sample Total ing Passing TotalNo. Studs Soundness Visual Remarks
87 68
93 266
95 166
96 44
100 71
101 70
102 70
108 73
109 256
110 86
FS
23
37
121
36
67
52
47
22
101
45
42
28
13
35
PV FVl
35 2
138 4
Pl Fl FV2 P2
34
0 31 31
0 113 113
8 0 0
0 0 0
0 0 0
3 7 4
0 14 14
22 13 1
23 5 0
12 1 105 96
F2 P
0 68
0 255 11
0 155 ll0 44 0
0 67 4
3 60 10
0 65 5
0 45 28
9 209 47
1 67 19
(P-86b)

I f

REDUCED FIELD DATA FOR STATISTICAL ANALXSIS
Building: Turbine Building
Studs failingvisual with
bend test results
Studs failing visualbut repaired prior
to bend test
StudsFail- Studs Pass Fail Pass Fail
Sample Total i.ng Passing Total bend bend Total Assumed Assumed (Pv+Pl (Fs+FlNo. Studs Soundness Visual test test Pass Fail +P2) +F2) Remarks
FS Pl Fl FV2 P2
1 18
2 64
3 36
4 32
5 100
6 24
7 24
8 . 124
9 80
10 46
ll 45
12 48
18
56
31.
92
23
20
109
79
46
43
10
-0
0 18
0 64
0 36
0 32
0 100
0 24
0 24
0 118
0 80
0 46
0 44
0 48

REDUCED FIELD DATA FOR STATISTICAL ANALYSIS
Building : Turbine Building
Studs failingvisual with
bend test results
Studs failing visualbut repaired prior
to bend test
StudsFail- Studs
Sample Total ing PassingNo. Studs Soundness Visual
T FS PV
Pass Fail Pass FailTotal bend bend Total Assumed Assumed (Pv+Pl (Fs+Fl
.test test Pass Fail +P2) +F2) Remarks
FVl Pl Fl FV2 P2 F2 ' F
13
14
15 42
16 40
17 96
37
36
0
42
40
96
(P-86b)


REDUCED FIELD DATA FOR STATISTICAL ANALYSIS
Building: Control Building
Sample TotalNo. Studs
Studs failingvisual with
bend test resultsStudsFail- Studs Pass Failing Passing Total . bend bend
Soundness Visual test test
Studs failing visualbut repaired prior
to bend test
Pass FailTotal Assumed Assumed (Pv+Pl (Fs+Fl
Pass Fail +P2) +F2) Remarks
1 '692 174
3 170
4 167
5 202
6 54
7 204
8 210
9 141
10 138
11 135
FS PV
126
147
129
126
153
37
149
170
115
116
121
FVl Pl Fl FV2
24 18 6 19
9 2 7
34 27 7 20
29 23
13 4 13
2 19
8 0
15 ll 4
14 14 0 21
22 17 5 15
38 27 ll ll
P2
21
15
158
161
164
154
187
13
15
13
40
191
200
133
123
122
14
13
10
15
13
F2 P F
(P-86b)

I

REDUCED FIELD DATA FOR STATISTICAL ANALYSIS
Studs failingvisual with
bend test results
Studs failing visualbut repaired prior
to bend test
Sample TotalNo. Studs
StudsFail- Studsing Passing
Soundness Visual
FS PV
Pass Fail Pass FailTotal bend bend Total Assumed Assumed (Pv+Pl (Fs+Fl
test test Pass Fail +P2) +F2)
Pl Fl FV2 P2 F2 P F
Remarks
Circulating Water Pumphouse
53
54
53
53
0 0
0 0
53
Diesel Generator Building
1 44 44 0 0 44
(P-86b)

APPENDIX D
TO
FINAL REPORT ON SHEAR STUDS
REPAIR PROCEDURES

l4

REPAIR PROCEDURES
1.0 General
As noted in section 7.6 of the final report, some beams
in the Reactor Building have been identified, where some
restitution of studs is necessary. These beams are marked
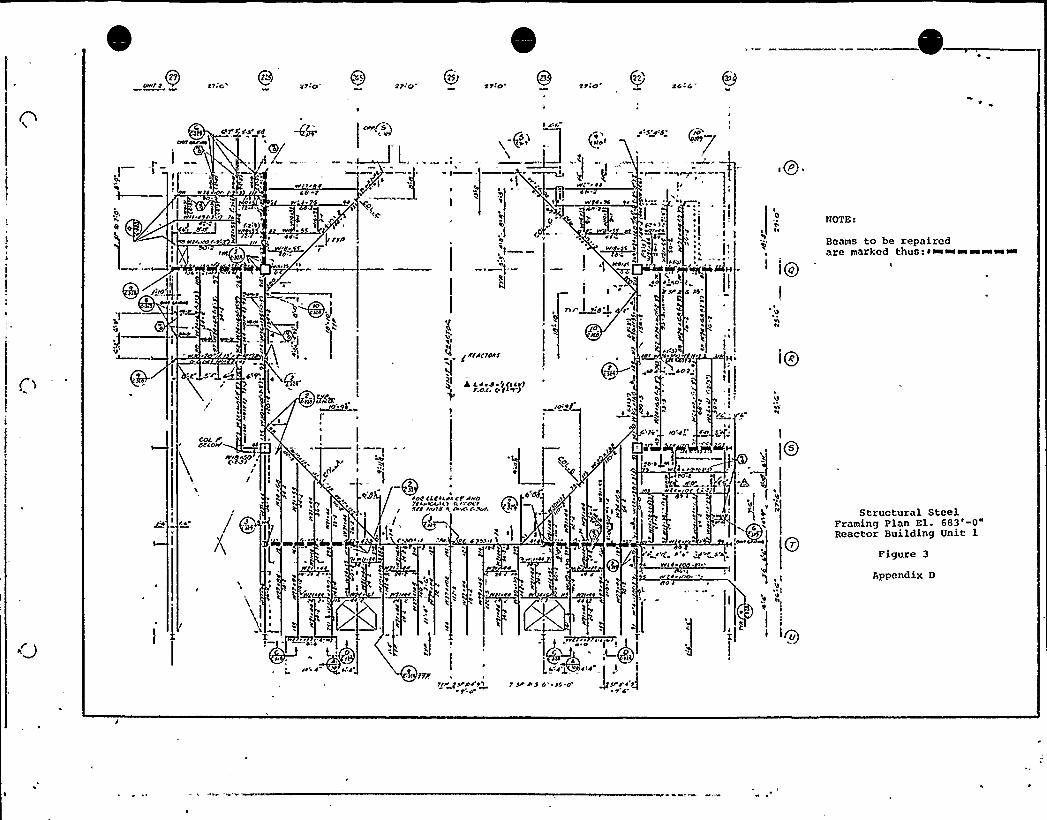
on the plans (See figures 1 thru 5).
2e0 Repair Hethods and Design CriteriaFollowing repair methods are proposed to achieve the re-
quired restitution.
2.1 The first method is to provide a horizontal shear
key within the ridge when the metal deck is pro-
vided over and across the steel beams. The shear
key is well anchored to the top flange by a fric-tion type bolt. Positive engaoement and the con-
tact at the key-decking is attained by the bond-
ing properties of the epoxy agent, and at the
decking-slab interface is developed by .the con-
crete engagement into the corrugation of the deck-
ing. See figure 6 for details.
2.2 The second approach is to provide a through-bolt
where the oecking corruoations are parallel to the
steel beams. The basic concept here is to develop
a friction type connection between .beam and slab
through the pre-tensioned, high strength bolt. The
(P-74b)

'I
4
I
f

grouting of the bolt in the drilled ho1e and the
friction connection render the detail effective by
minimizing the tendency of initial slip. See fig-ure 7 for details.
2.3 Xn some instances, when the decking is parallel tothe beam and the above method cannot be used be-
cause of embedded conduits in the s1ab, it is pro-posed to design the steel beam as a non-composite
section and reinforce the existing beam to providethe reauired section modulus. The actual detailsof reinforcement will be designed on a case by case
basis depending on the existing conditions at thet ime o f r epair.

021.0'a z QnSJ-0
g~I
I
d 4~ '1
.2Qyo
~S11 4
AIIS~ 4S
~111
NI 4 t4
41CNOICS
It Sf
I
ffP
I
p4 Jd~t I
IA(
")SSP 414 d:r
dd SOP
Ioh /2;JXC'-
2
I
a~re VJ 144dlf ffd
4 Jf
1111 14
OO'
SP 4$a
)
j0
I
141 AASSCANI/ fdfSPACA+
SSS 414114 1 (fflt)I 0
Qe
NOTE:
Beams to be repairedarc marked thus. ~ ~~~~wa
v~444
hkuNO4
Wk)df oaf'a
hPOIAASACA If 4IfffffASSA
+ CCS ANSI AtffQg 2 gi
~ANISC.SCfP~SIC AAVCV111
4:t 2'J"C~jPJ—.
4
O'ASC IAOSISQll/Of441 4 41 1dffCOO Cfff14'4
42 oVv P
444r.
"./ 'fv"*'@'V
>vh
rPS~w4 ISII
~ I ASVINS'J
tt f
V
C
'4
1 44
'lljj'J II ~
SI 'l
l",44
11~ tvI
4 ".i I)
0
OSC fNOIS J Cftf1)
NIICfICCIÃAIC'thft 4 f4 IRLVAtA CICA INN lVfCACfhhC CAN 44 OhhLCCI(r
Structural SteelFraming, Plan El. 670'-0"Reactor Building Unit 1
Figure lJ4
l
SII;tvdtlfvfOPA) g]414
...);| I l<O.lhtf(" >Il.4 fw.f ~~Sf' A)
I
~ 4 ftJlu PQg I~ . 4 v
CASfl 4 1AhfON 'Ifvvlvf f2ffSll SPdCSOI 2
1 Sl 4 IVI' Jd NI114 Sdffr 22SIC 114 JCC~f> 144 CIV slid
(SOP 44 fICPSAAII CC. CCSICPwld)
J'2
I141
Qd„>CO
Appendix D

1150 1150 cf>c>t t
tcii 4>C Vc
I
QOI
, src ivotr grift) S:r
d t>>5>VSO
rt>T CtldwOrd «d>Vo»lwTSOl tfttt SCCWot d O>O MV
~ f o.0
tIl
C
f sj
1
'o
L. g,Beams to be repairedare marked thus
>OO C ~tt 1
tistwortr
SO ~IrVtt»O lt
~Ttiitt tut
~ Cco>ftvotcot.crit ~doSfC Cwo CVGI1
II
fvtrtcrofts,
f'o>rood @~ ~
tu Gt>ff>COCC. GSCYO
~q
lsd
A
5>
Oo>c ~ ic>I> 5
SCC>TS>C C Icnlt
~i ~
V-*
w»ol>v~ G CsdaiSftd>OC411
rS!s>Ocoloc
dClttVO>ftOt/ V>WCCC tofftlfCW> CftffI
W
Sff0» C4>ff
4
A~ „-
tt i oft
O , ~ ..jw55
Q4,
ir.
64.wti Tt t>
OO
.c, ~Tft 4 >5>VCS
1 dtt>S>O'S>0
I IBttWOV>GC I I
;jJ
cr>
''!G, g
(~ I
4 YJ TSGCOG50ids>0
Su» )
Gt CVGCCC 8Cot tot Olidsfc cw>I cot
Structural SteelFramcing Plan at El. 670'-0"Reacter IIuilding Vni 2
Figure 2
Appendix D
raS -tc>S u >c 0iolOi'olf>at CG Otd 0 C>IDIO.
n
« II
I I/.r C-
«I/. It>I>/.Il
S< ./
~I It
/S.l>1
0
Qt>1
jSt
gkts S
0
Wf/ '>0
co4
~W ~ I
I .1
gCCAC/S>hf
a I.S«d $ (CSr)C.o.l, s tt0)
I
~fr>/~J
'I~ f''lt ss
'
:c
0
fl!
I
I I«/ >s
I1
>/Illa Ifp'
sdf
-i!„qW
ISS 4/S (/d
7t 'l~ I
t
"I
0
~ lt
'o~I
'0
I
UOTB:
Beams to be repairedare marked thusf ~ ~wm~~~w
lts Ah
/h 1
COC
A'rtfPO,
/
r
I
'I~
'
4LCahdt I //N. 1>,l) l
/dr IIII>A>Cf««Drls«««>hf I tv«>15/I t>httd h. /«s/
l
S
'1
hf
dl)v'ol/I'/I 5'sr>S
Structural SteelFraming Plan El. 683'-0"Reactor Building Unit 1
~ 't. I
~ f I
~,h
Irr~lr/ICrh0
rsent ~
lt//
t
«I 'lt.) ~
-'l
«0 '[ I
~ Ilg
r 0
dO Ih
I .' N
}ra
Figure 3
Appendix D


0
r.at la ra
c~r iec/e
4 v
r I~ 14
c g
4$I
PH4
-I
w t ~ l4
11P. 44 ~IS }
=-1-""
$J C cvt
O P III
4'4
W LL4c
0
o
~ io
NOTE:
Beams to be repairedare ntarked thus
0
ra/C JC t/I/IAIIttalentttl tHY tl/I/rett1Sct /c 4 DIrt cd/
~/o~kI
I /I I
~C,
Rt~+
+ @tet ~ 't CC~)toe steps
I
i$5a fIC/C4$
Q~d
,4
,4'
c t4'/>
h
h
I
IM
4'
~ 44
~i'll,, I 4
h
1
I ~ ~
'
I
)N™~rtl g I
'4
4}
r/r/I tltt t yr 'Ic
litct- t'I
} 4
'
4
4
'
}ct>
Structural SteelFraming Plan El. 683'-0"Reactor Building Unit 2
Figure 4
Appendix D
L
4/ 4044
4
4


etr 0 27 0 7 0 2170
I/fe '50'rh 57/b 6 5I474 d
@. P//trit I4'0/453'IO
t9: Ct
rrt4 no'
r 0 ~ ~I 'I I~ ~
C.I
~tt
IIIC4/tt WI WI
Itt 'OI
I
I-
9~p/ d.e d.e
-0b0) fW'I+I
~ ICCkr
tt/I.ir I.tt7-e'-0)7r 44
0 I 3Wtrr
W/0 5
-fl- ~9Ie 4.44 IP
</ceo
<OLc
trr I
<.t.tt I0 0 . <Ir'.t.tt
hen'4 h440 Irttktea. <rw~~ CIIIIOI47
~ ttt/
W 0 < 7 to ) 7 t. 'I99 t) /Iog
7
I? Wd rdlQt
t<O Cr- I; '~'%.,:,
i-4'-dt U
t t,
gt-g3
IttkI 44'2
W~kr 6
0
I /0'o,~'~Att2 I
I
rt/.Is ete'lli
hh
hI
I ~
p"i
J~ IOCAO1OXO
IOVt tto
I
I„hh
5:o'/0
~ ~
IOO
,I
I0
(
/0IIh 7
I
7
/00 Cl tl<rrICC Ar/0rdirpocrkt ctrppokr244 Itdtt*DWCL4'JOI
~ I
Tk 4 4rdrt <tttt)I.at.o III
0a
r
ett4ktt< twh
Itltt1 ekkIVOIC2 I/+Irre
et:97 IWtkIIIEl
Wttrd4
II
-- iQS
i 4'I,?o—
70.2Ittt 55< 7797 Wttrdo
tor I ttt7 ~'=''
te 2'f 6297Wtkred
tthlO.
.o !ttk
6I
Wr 7eti t/Cr1<II l--
t/ I tnor tt Il~«I) too 4->
> ~w>5 ~ too 4
W ~ ~
rrd~lt trdhetk/9
0 /to
~t '
1
d
ioret Pitt I<I
ICO II I0Iro
4
~Crt 44 fk t4 Wtk.dt ~4 tt 4ro4 4I 04~rtk de 54 74dd t
OO I
6 2 cd4'kt.~ ~ e
nI
ttT" 0o 00
k74 44r 4
J [i'4 ttre/0
b 7/ tttr/4)~644~ t—z-
Beams to bc repairedarc marked thus. ~~~m~~
Structural SteelFraming Plan El,. 7lglReactor Building Unit 1
Figure 5
Appendix D


Inverted 3" metaldecking
No~-shrink highstrength epoxygrout
3" long steel block(AS2". 2-441) we& atarred in hole for3/4" P A-325 ric~antyoe bolt.
l /oversized hole.
Top flange of steelbeam
Q
Ctv
IU)
0 lAQ
Haroened p]ate ~asher
* Naninal oeckin" dim~~sions pmmanufacture 's catalog
R"?PZB PFKEDJRE — YiETHOD
'2'IGUK6
APP~IX
'D'P-74b)

't

Non-shrinkhigh strengthgrout
5 ll p 4-1/2" P x 1/2" hardenedplate washer each side.
~ t
g
~ r C'.0880
steel beamor plategirder
1-1/2" g threaded rod with one nut oheach end ASTN A-325 torqued for fric-tion connection. 1/16" oversized holein plate washers and the top flange.3/8" oversize hole in concrete slab.
Notes:
1. Prior to drilling check hole location as follows:
—with rebar detector, ascertain that top layer or reinforcement andany embeds are clear of hole.
2. Preferred location is at valley of decking corrugations. Do not locatethru sides of decking.
REPAIR PROCEDURE — S<ETHOD
'1'IGURE7
APPENDIX
'D'P-74b)


APPENDIX E
FINAL REPORT ON SHEAR STUDS
BASIC THEORY OF COMPOSITE BEAM CONSTRUCTION
ENGINEERING DECISION ANALYSIS COMPANY

BASIC THEORY OF COYiPOSITE BEAN CONSTRUCTION
SUSQUEHANNA STEAN ELECTRIC STATION
prepared forBECHTEL PO'HER CORPORATION
San Francisco, California
21 December l977
LE<L7ENGII4EERING D-CISION ANA'SIS COMPANY. INC.
480 CALIFORNIAAVE SUITF 301 2400 MICHELSON DRIVE SURNITZSTRASSE 34
G

TABLE OF CONTENTS
Paoe
SYNOPSIS.
1. INTRODUCTION.
2. GENERAL THEORY AND A COMPARISON WITH THE AISC
Theory and Verification .
3. COYiPAR'SON WITH AISC SPECIFICATIONS;
Ana1ysis of Composite Beams . . . . . . ; - .Ana1ysis of Project Beam 14 . ... .Other AISC Provisions .
~ o o ~ ~ ~ ~ e ~ 1-1
Sr ECIF ICATIONS.. 2-1
2-1
3-1
3-2
3-4
3-44. RECOt"ENOATIONS AND CONCLUSIONS . . . . . . . . . . . . . . . . 4-1
REFERENCES

tw
SYNOPSIS
This'report presents a general ultimate strength theory for composite
beams that fits the type found in the Susquehanna Steam Electric Station(SSES) and more conventional construction. The construction of the SSES
employs composite beams. having heavy, thick reinforced concrete slabs
poured on a formed steel deck which in turn is supported by the generallyunshored steel beams. In contrast, the construction in ordinary build-ings employ> a thin lightweight floor slab with a formed steel deck sup-
ported on deep but light steel rolled sections.
An extensive study of the .experimental data upon which the AISC specifi- .
cations are based was made since the project beams are very differentfrom those for which the AISC specifications are meant to apply. It is
, shown that the AISC specifications are grossly conservative. A validultimate strength procedure which fits the experimental data and the pro-ject beams is derived based on recognized concepts .
The study closes with recommendations for use -in evaluating the, projectbeams.

1-1
l. INTRODUCTION
This report is prepared in accordance with Bechtel Contract No.
7 PE-TSA-11 and in accordance with meetings between 8echtel Power Cor-
poration and Engineering Decision Analysis Company, Inc. (EDAC). This
report is concerned with a, study of the basic theory of composite beam
construction and the relationship to the specifications of the American
Institute of Steel Construction. The focus is on the type of composite
construction employed in the SSES.
Chapter 2 of this report is concerned with the general theory of com-
posite beam construction and the verification of that theory. Chapter 3
focuses on the suitability of the AISC specifications for composite con-
struction with beams of the type employed in the SSES design. The exper-
imental data upon which the AISC specifications are based involve a thinconcre'te slab poured on a formed steel deck with shear studs connecting
the concrete slab to a steel beam. In laboratory tests, there was suf-
ficient slippage between the slab and the steel beam for all studs in the
shear span to be developed, and failure was associated with concrete
failure involving pull out of the studs from the slab and the development
of a yield hinge in the steel beam. The bending strength o, the slab by
itself on the span of the steel beams was very small, so that the
strength of the composite beam was the sum of the strength of the steel
beam and the stud connection in terms o ultimate bending movement. In
all cases, the dead load was very small compared to the ult'imate load.

1-2
The beams employed in the project differ greatly from the test beams inthat the slab thickness is of the same order as that of the steel beam.
The slab is heavily reinforced. The dead load is not small compared tothe live load and the steel beams are generally unshored wnen the slab isplaced so that the steel beam supports all of the dead load while compos-
ite behavior is present under live load.
Analyses presented in Chapter 2 disclose that the AISC specificationsmust be modified to fit beams of the type of interest in this study. A
general, method of analysis and design is presented in Chapter 3 which
fits the experimental data, is consistent with the literature, and pro-vides a relationship betw en the AISC specifications and construction ofthe type employed in the project.
Finally, Chapter 4 presents recommendations and conclusions.

2-1
2. GENERAL THEORY OF COMPOSITE BEAM CONSTRUCTION AND
VERIFICATION OF THE THEORY
This chapter is concerned with a development of a general strength theory
and verification of that theory by comparison with experimental results
of tests of composite beams employing a formed steel deck. The proven
analytical methodology is then compared with the AISC specifications in
Chapter 3.- A methodology for analysis of the composite beams in the SSES
is also presented in Chapter 3.
THEORY
The discussion that follows is based on the work of Grant, Fisher, and
Slutter (Ref. 1). The methodology is based on the ultimate strength ofthe composite beam. Sufficient slippage is assumed to take place at the
slab beam interface to assume that each shear stud in the shear span car-
ries the same loading.
The AISC specifications assume that it is possible to relate the ultimatebending strength of the composite section in which the steel beam devel-
ops a yield hinge to an elastic stress analysis at the same section using
transformed section techniques focused on the unit stress in the bottom
tension flange of the steel beam. The assumption is also made that the
effective section modulus of the composite section is a linear functionof the ratio of the capacity of the shear studs in the shear span to the
theoretical limit of this capacity.

'I ~
0
0

2-2
Examination of the experimental data upon which the AISC specificationsare based discloses that the composite beams that have been tested fit a
particular type of building construction, that involving a thin concretefloor slab, and light but deep steel beams. The largest slab thickness
in 74 tests was 9 in. with a 3 in rib height making a 6 in. net slab
thickness. The beam span was 34.9 ft. Yiore than half of the slabs were
constructed of lightweight concrete. The bending strength of the slabwas neglected in the analysis. The slab was effectively considered to be
a 'purely compression member with the comprhssive , orce located at the
center of gravity of the concrete section neglecting the rib concrete.
The single elastic deformation requirement is that the curvature of thenet concrete slab be the same as that of the steel beams. If both slaband beam are elastic, the live load carried by the slab and beam is pro-portional to their stiffnesses (EI). The largest ratio of slab to beam
stiffness in the experimental data is 0.15, that for the 17 Lehigh testranoes from 0.009 to 0.021, and Grant, Fisher, and Slutter say that thisratio is generally less than 0.05. With project beam 14, this ratio is2.07. ~
Grant, Fisher, and Slutter (Ref. 1) state that the ratio of the sectionmodulus of the transformed section to that of the steel beams is approxi-mately 1.5 for composite beams comnonly used in building construction.This ra io is 2.9 for project beam 14.
H
The general theory for ultimate strength of a composite beam is shown inFigure 2-1. The equilibrium condition is shown in Figure 2-Ib and 2-1c.With the experimental beams, the slabs were very flexible compared to the
~ steel section. In Figure 2-1c, a bending momemt is shown to .exist at theslab to steel beam interface. This bendino moment is large compared tothat from load distribution in all experimental tests. Mith very thin

2-3
slabs, it is reasonable to assume that the compressive force in the slabacts at the center o, gravity of the net concrete section (see Grant,Fisher, and.Slutter) (Fig. 2-lc). The tensile force on the steel sectionacts to reduce the plastic moment capacity (Fig. 2-ld). In the analysisof the experimental tests made in .this study, it was assumed that the web
and flanoes of the steel rolled section iere of constant thickness as
given in AISC handbook.
With thick slabs it is necessary to modify the theory to account for theultimate strength charac ristics of the slab (Fig. 2-2). Equation 4
results and this relationship were checked by comparison with the experi-mental data. The analysis showed that the mean ratio of experimental tocalculated strength was 1.000 (0.9997) with a standard deviation of 0.081for the 74 test beams and the data had a range of 0.835 to 1.1884. The
ratio of observed-to-calculated capacity is plotted in the histogram ofFigure 2-3 and the same data are plotted on no'rmal probability paper inFigure 2-4. The fit to a straight line is excellent so that the observedvariability can be assumed to be the sum of random variations no one ofwhich is dominant. The. standard deviation is equal to the coefficient ofvariation with these data since the mean is unity. The coefficient ofvari ation is of the same order as that found in the yield point of steelrolled sections of nominally ident'ical material.
The analytical comparison is also shown in Figure 2-5 in which the ratioof experimental-to-calcuated strength is plotted against the ratio ofshear stud capacity provided to maximum shear stud capacity. It appearsreasonable to state that the reliability of the theory is not a functionof the shear stud design level. That is, the design with a Y'h/Vh of0.25 is fully as reliable as that with a ratio of unity.

t

2-4
Dl Hc Sl~s~ei rw
~ PC StagJ~
'Srec.l Sec&an
Hp5<ppork8 b~ 5lecl ckom
LI
„h C.9. CO~C.-
DF
C Q OI7 5~IIC'S ~t
-'(g+h) P~rop;
S> Ii I~ Compr.oF YP
Fk yejSfCC I in7erSI'an0I'P
?ezsim
Lo& 0< 5/ud~of'kc
I
FIGURE 2-1 COMPOSITE BEAM RELATIONSHIPS

2-5
I V'h ='.zs 7 u.b
ArFy
) ~C = ~r Ff< t"-
Ar~gr
a. Slab Cona'I'ho~
V'kl
+~ ~s C2
2. 2
g>+8<+ y'h(2 +t- ~) (3)V'/7
. a=—O.ZS Fc b
Yh~ = o,F5 Ki 5 cf -h)
j s +4, —gp f yQ p(f P)(l-)g
v'h v'h ~
z v~. J
S(l.7)(o cd Fy Cs)
FIGURE 2-2 CO'",POSITE B AM ULTIMATE STR NGTH RELATIO"'SHIPS

2-6
/5
Ex rgi~e~&l CC!PoCI~'a6
o:Cc /cu/a fed
CA,~«i'yon=
l.go, 5ja~+orr/ St rich~= 4.08'
jGUpE 2-3 HjSTOGRA!~j Of EXpER j~, ENTAL TO CAlCULATED ULTjl'tATE STRENGTH

2-7
'ttt SW tt % tl SS C> SC CS SC 4 % 1 $ t 1 Cd CC CICCS C 1
) ~ I
I ~'1e /4
Ie
e
\'
e Ie e- .1
C
h'1
e
e e
I- --.-:- e 1 1 ~ I ~ .:1 ".te .'I ~... e
' i, l ~ "f "f ". I ~ .e . 1]1 ). ~ .;f,.)"If, I +1 ~ ':f Ht>rt~ l 0 0;
f'-:f':;:1' I
~'I'.l,:;c r ! r~z r r r
~ ~ ~~ e I e
pe ggVC l
~e P I ~
~ ~ ~ & ~ ~ r ~i
/ 'e~ee ~
I
s .f——.).. ~ l—~ ".
e
A. er
Clll L5 CJ C CS 1 t 1 lt 0 S 4 SC Q tC 4 10 tt tt tt ttl tt.l ffB0~arlrg
FIGURE 2-4 PLOT OF RATIO OF EXPERI YIENTAL CAPACITY TO
CALCULATEO CAPACITY ON NORl'IAL PROBABILITY PAPER

Z-8
/.2
Z~x. Cap.Ca/C. Cu/d
0,9
s= o.oI/X
'x
O.g
x.Lchij/j TnU~ 0/her Tisfs
P.6
FIGURE 2-5 PLOT SHO'r'ING 2ERO CORRELATION OF STRENGTH RATIO VITH V'hlyn

,.-
, ~,
J
COMPARISON OF THEORY MITH AISC SPECIFICATIONS
3-1
The 1969 Edition of the AISC specifications employs the relationshipshown in Figure 3-1 for elastic 'design based on ultimate strength
proper-'ies.
The criteria is the tensile stress in the bottom flange of the
steel beam (0.66 Fy} and the effective section modulus for elastic designis. equal to a simple linear function of the section modulus of the rolledsteel section, the transformed section modulus referred to the bottom
flange, and the ratio of actual shear stud capacity to the maximum shear1
stud capacity. The true effective section modulus for pseudo elasticdesign is given by Equation 5 (Fig. 1-2) in which the load factor is 1.7and the allowable unit stress is 0.66 Fy.
The true section modulus for each of the experimental beasm using the
calculated ultimate strength by Equation 4 of Chapter 2 is plotted inFigure 3-1 against the effective section modulus defined by the AISC
specifications. The plot shows that the AISC relationship is conserva-tively biased by approximately 30 percent'ased on a mean value func-tion. However, approximately 50 percent of the beams have capacitiessmaller than that defined by the mean value function. The variability ofthe data about the mean value function appears to be independent of thesection modulus and independent of Y'h/Vh. The AISC relationship approx-
imates a lower bound on strength for section modulus up toapproximately'0
to 100 in. ~
The variability shown in Figure 3-1 is consistent with that of the plas-tic design methodology for structural steel beams so that it does not

3~2
appear reasonable to require the conservatism for composite beams with a
section modulus larger than approximately 100 in. ~ The project beams ofinterest have very large section modulus, of the order of 1200 in.sThere is a strong trend for the shear stud connection to show a decrease
in variabilty with increase in the number of studs owing to the low cor-relation between individual stud strengths.
Ho studies were made of the experimental data with respect to stud pro-
perties.
ANALYSIS OF COMPOSITE BEAMS
Strict elastic analysis of a composite beam cannot account for the unde-
fined slippage on the slab to steel beam interface so that it is neces-
sary to employ pseudo elastic procedures which fundamentally are based on
ultimate strength properties. Thus this discussion will focus on theanalysis based on ultimate strength, Figure 3-2.
Equation 4 of Chapter 2 defines the ultimate moment capacity of a compos-
ite section for combined dead and live load. At ultimate, the beam
develops a yield hinge, the reinforced concrete slab is at its ultimatecapacity, and the V'h force has its largest possible moment arm consis-tent with the strain conditions in the steel beam and the slab.
With three interrelated sources of strength, it is possible for any one
source to develop the necessary capacity,,any combination of two souces,or all three sources together. In general, the design will not be bal-anced so that at least one source need not be fully developed. The anal-ysis that follows considers first the steel beam to its plastic limit,then adds the reinforced concrete slab to its ultimate, and then adds as

3-3
many shear connectors as necessary to satisfy the loading criteria while
accounting for the influence of the tension on the steel beam and for thecompression in the slab.
From the standpoint of ultimate load, it makes no difference whether the
steel beam is shored or unshored at the time the concrete for the slab isplaced. This is true regardless of the stress condition in the steelbeam under dead load alone as a consequence of redistribution of loading
among the three resisting systems prior to ultimate. The ultimatestrength is independent of the path employed to attain the ultimatestrain conditi'ons.
The same is not true with regard to deflections and rigidity. If both
the steel beam and the slab deform elastically while slippage is allowedat the stud line, the requirement of identical curvature allows the cal-culation of the load carried by the slab and the steel beam. If no shear
studs are provided, the deflection is that of the steel beam under theloading supported by the steel beam (with proper accounting for the dead
load deflection). Mith shear studs, the elastic stress conditions are-undefined since the slippage conditions at the shear studs are unde-
fined. However, if the dead load (concrete slab and steel beam) unitstresses in the bottom flange of the steel beam reach the yield pointunder this loading, the composite beam will show degrading rigidity withthe application of further loading although the ultimate capacity of thecomposite section is unchanged.
A pseudo elastic analysis of the composite -section is shown in Figure3-2. A wide variety of such empirical procedures are possible.


Cif
~,
3-4
ANAlYSIS OF PROJECT BEAN 14
Project beam 14 is analyzed in Figure 3-3 both on an ultimate strengthand a pseudo elastic analysis concept. From the standpoint of ultimatestrength, it is seen that the slab and steel beam without compositeaction can supply 93 percent of the required moment capacity. A trialstud capacity (in the shear. span) of 200 kips was assumed. The strengthexceeded the required capacity with only nine studs needed when 46.5 areprovided and 42 are effective at a normal 2 percent level. See EDAC
Report 249.03, "Studies of Shear Stud Adequacy —. Susquehanna Steam Elec-tric Station," for development of the equivalence relationship.
~ '
pseudo elastic analysis of project beam 14 is also shown in Figure3-3. The analysis begins by assuming that there are no shear studs and
checks for design adequacy assuming that the steel beam supports all thedead load and its proportion of the live load. It is found that thestiff slab is not adequately reinforced to support its portion of the-live load while the steel beam unit stresses are less than allowable.The elastic slab capacity plus the steel beam capacity is 92 percent ofthat needed (neglecting elastic strain requirements). A trial V'h of 200
kips (elastic) produced a satisfactory capacity with the steel sectionnot used to capacity or a- V'h of 100 kips was satisfactory with the steelat elastic capacity. The required number of studs was nine with 100 kipstud loads and 18 with 200 kip stud loads.
OTHER AISC PROVISIONS
The AISC specifications contain a limitation on the transformed sectionmodulus which is a function of the. ratio -of dead to live load bendingmoment (Equ. 1. 11-2) and stud layout relationship (11.1-6). There
appears to be no justification for the equation involving the live todead load bending moment ratio. From the standpoint of ultimatestrength, the strain condition at ultimate strength is independent of the


3-5
ratio of live-to-dead load. Even if the unit stresses in the bottom
flange of the steel beam are at full yield under the dead load (un-
shored), the ultimate moment capacity of the composite section is un-
changed. The dead load is cons~dered the same as the live load in the
strength calculation. Mith unit stresses under dead load limited to 0.66
.Fy, there appears to be no justification for the specification. lt was
not possible to determine the basis of the requirements.
The second requirement dealing with the layout of shear studs in the
shear span problem cannot be justified on the basis of ultimat'e strengthconsiderations. The Lehigh tests involved a four-point loading withone-quarter of the loading applied at a point 19 to 22 percent of thespan from the end supports.
A variety of shear stud arrangements were examined in the Lehigh testsranging from proportioning the layout in accord with the relative shear
in the span to a uniform layout indepedent of the shear in the composite
beam. Statistical analysis of the data relating the experimental to cal-culated strength (not considering stud layout) as a function of the studs
in the region of maximum shear to the total number of studs showed thatstrength is uncorrelated with layout (Fig. 3-4). Unless, other evidence
exists to verify AISC Equation 1.11.-6 (p. 5-35), the relationship is notvalid. The result of the application of the equation is to increase theproportion of studs in the portion of the beam having the largest shearand more or less reflects analysis and design procedures based on an as-sumed elastic behavior of the studs-

1

3-6
7his Repaint
/.oo
QP 0
Up
A/SC
Sqff = Ss ~ —Qp~ -Ss)YA
VA
gy~k/
+60x
/op /5o
5'e/C'Attic) - i'n~
'zoo
FIGURE 3-1 PLOT OF TRUE EFFECTIYE SECTION
NODULUS TO THAT BY AISC SPECIFICATIONS

I1

3-7
/41A/ '/8/5 -'L7/P///7E Si/'- Eh/ bT//'.7
(hey> H Hg) = f7~ + c/.7') +/.7Mc
DL on s&I plo~e-
Cnsz 2=
Q7Hp +I.7'. — (Hs —Ag)) 7
~u — /Vs + ~cC+sz W: ''h g V, (I'h +o be n rni~i~u~)
P>o~ /Vowenf Cc~t~aeifp:
a. V'h — d~ (4- Z tp-) F~
s= ~D~ ~$L — Vj dj/ (d-fF)6. V'h ~ 8 w Col- ~ <Z) Fp
cl'-2d
n'-('p-~)~Prt
~ lcnS/cn
CVp
Proc'en'ure- Cuse ZI Cc/Iculofe'<g = I-7 <+o PM3 a~d ~~- Mp
Wo C 0.16+y S2. ~ Check, ~~ ~ I >Z+ Mc ZX SO, Vh=u3. If Vh Is ceeded,
P. +Sainte
Volumes'of
p"h0>. Coypu* 'PAL (h'ofe g~z ~ 5 ~I>)PJ Cr~pscfe Wc,
e. CI .k=~ ~r/»/7//c <see/—/c < —[a'<erht// h)/'h)jVh
/ 2or ~u = Ies +Ac+. VA go'//~p-g,+ (x'-h)g/ V'h)7
2 Vhc ~
F1GURE 3-2 ULTIYiATE STRENGTH ANALYSIS


3-8
ANALYS'/5': UL g /MAiw 57R+A 67& ~Cd/i flnue d)
Cess Z.. V/ yOL've /~c/'an de p~o~rbib«d ~~cordi~ 9o E'i.
lwn~Ys(s: E~zsiic (ps~~~o)
CAs- ~= Vh = 0Ll~e loam' s/ob ancl'.an pro/ or 6'onol * E3cod' oa@ ~o Skc/ 8c,a~.
Pfc >( P~Z /fgp Df +1/ /I">4k el/ ur'cled bp /. /p HCz I 7 J
Check dopa c rh'es:ahg: Z.L (+,+~so~ o l~)Shd/ = 3L + LI (Pr4P orflon)
CAsz- W- Yh gODL 4 s/c c'.l,gl jp SPec/ on@'oncrek'cpodrono/ 9o EZ
u. Concrete: Check <ci ME'Pm>do~5ke/'hccE p7>p 5zz ~,O'er F>Sc. Cow~+ leg urea''h
(l) Co~c~.- Vh = t-—Z
(z) Si'eel: R>m~~F = 0> ~~isfCa~if=<> ( Ccrc + Uljgn"Rk)goopy+ ffA or c'her&
cap4kcI IQ fear col/v(n +i@1
CRiada)
FIGURE 3-2 continued) ULTIMATE STREt>GTH ANALYSIS

3-9
Ah'I-.'L)'5I ~ PZOJd= C7'-"dq ff 6+
) re@ z.
zs.g''3
- —3'r). stuc/s /n 9 rovers
3/ 5/ms pd..r roc++55-+ S'/VHS tn 5heor'nHD = 255,2. (/s= 7. i ~)
~c = /27P./" (f =37. Ag>c= F'$'/ZS
/3'/
~c= > ~ "Ar" (ACZ)
Fc Zc—= z.o9A Zs
gc'bcb 76.S"F>-- wo k5C
P 9e/Z" ~ 2/.5
oI~ Z91Z"Spy /.
IBS')
~ O'.D9/
2)53'C'i
S/205= e/+"2 -" /8'S
~ 2'/75/GO
fy ~ S pQi'h
= 2358 S)'cc/
t//, = czez c.~
g/5s = I./ordc)~ gc
Pus ~ 21 8H CA/SC 8 /3,9 )
Qrc = —'( J(—)8+s = @755 g„s
Pu = 2'3.8$ 'sf~d
UL d // 3 AiS'/p&'6 5 //' /V/n/'rrdu rr) number p i/ sled ds needed.
Pf ).7 (go /.h'-26 ob.4
+VsSV 3 sX-Vh -"0 C<o Sgvds 7dssdrd)
spxo ~<6<~ /9'37 5 /5/hd/ zGob Gsp /z
Csosf Z:ZC OC.C —Zg'q 3 5
dr)pprc v. 6'rrckd Vh
fVc/ 7enslon Ce/.= ~~ (d'-2'/.-) Fy~ (o.CSCXZ2.//S)CSo) = 13'C.5/
7'h m Zgg Cuc b 0 kPly = cc/c.- «p d g (c/'- dp')Hs ~ (/5/.09/) g/ /3s)(s'o)(261'z -I./95)(/z) = /57/,co*
s la'3 5 si a(5 5)(l )j —1l-57li3-7i3iss(1- —jj=5+Vhc (Z)(liP C2'/Z
dc + +S + Ny/ +54 + /$2/-W 7'ISO = ZC P.G p 24 O&.tp o'
h c. 87 5dci& nd'ecIPcl = —= S'S (YC.5 ~vp+ aid)Zoo
23.<S(535Z Pfkchm ~/ g'%)
FIGURE 3-3 EXAMPLE: ANALYSIS OF PROJECT BEAM 14


'
'
g<ALY5/S PRoJ CT BERN ~>+ (Canflnved)
EL<5 Tl< - CFbeudo)
CAsz I': Vh=o= ?ZAN 2 7o: Sleek
Pi l~/~ lZ. of *d
Pfgi = —(/277.I) = d'4+5lvz.of
iVsg = —L'/?7F.l) = '//S 6"'
Og'~<C
n~ = 'OZ.C +ASS'2= 4GRg"
/S 3XZ
~~~ + P.'6$ F<S = JVOC.S"
95C+cz= = NZ 46/.7
o.CCF>$ = (in;S o~
CjgSZ/58 K3 - /+o C „yPPPrtP'$ ~~ ., 0: 90.+ CO oycraI2'W
3'r
y'f FCd/5 - >CSq gC
3'ry
Vh = Zoo E/ps&a'~uiv'. = (2g2OQ) = +00
vV 72~gdP 5+4 +Cd h)(I —~)J /gpss q< = pf (~~)V/ I- Vi,
IH (El.)= —H 'g(V<7)= 751 7/I4~ + + h (EL) 9 Hz< = /'/Egg ) /277./1 ok.(Does no/ crsc s/cr/ 4 ccpacr~g)
/X V'h. /oo" H„> CeZ) = —= 3l'~"r+cF e G.C't'<$ + Hrg Cc,L) = 1 /F~< o4 An Apprvi'm A'on
51'ods pA &p'= (0.J'o 9)C/s.3) = lJ.4 d/sv udzdu" /7 Aecdca'~ n8 /oo 0 /-'~eckJ oE
(0 FIGURE 3-3 continued EXAMPLE: ANALYSIS OF PROJECT BEAM 14

P P p
l.2
Rg 5+dsSh:or Spun
~C)
/,0
fSfogc = OOOE8cSP SgQo~~ Fik )+~<~ f
0.6
Z~bro]V'z
07
FIGURE 3-4 PLOT SHORING lACK OF CORRELATION OF
ULTIMATE STR NGTH MITH VARIATION IN STUD PLACEt'ENT PATTERN

4. RECOi"8ENDATIONS AND CONCLUSIONS
The two basic conclusions of the study are, first, an adequate ultimatestrength theory exists for evaluating composite beams, and second, theAISC specifications for composite beams reflect a specific type of designrather than a general- methodology and thus should only, be applied to thinslabs combined with deep steel beams. It is shown in the report thatthick-slab composite beams of the type employed in the project are
approximately 30 percent stronger than the strength by AISC specifica-tions. The influence of tho formed steel deck appears to be adequatelycovered by existing relationships.

''
i '.0REFERENCES
R-1
1. Grant, J. A., Fisher, J. M., and Slutter, R. G., "Composite Beams
with Formed Steel Deck," Engineering Journal AISC, First quarter1977.
2. "hanual of Steel Construction," AISC, Seventh Edition and Supplements
3. Benjamin, J. R. and Cornell, C. A., Probabi-lity, Statistics, andDecision for Civil Engineers, McGraw >I oo ompany, nc., I 0.

APPENDIX F
TO
FINAL REPORT ON SHEAR. STUDS
STUDIES OF SHEAR STUD ADEQUACY
ENGINEERING DECISION ANALYSIS COMPANY
(P-74b)

4

EDAC-249.03
STUDJES OF SHEAR STUD ADEQUACY
SUSQUEHANNA STEAt~j EL ECTR I C STATION
prepared forBECHTEL POWER CORPORATION
San Francisco, California
21 December 1977
L'!t:EK.".aENGIN ERING DECISION ANALYSISCOMPANY, INC.
460 CALIFORNIA,AYE.~ SUITE 301
PALO ALTO CA'LIF. 94306
2403 L4ICHEI.SON DRIVE
IRVIN"=. CALIF. 92715
BURNITZSTRASSE 34
6 FRANKFURT70. IV. GERMANY

~,
TABLE OF CONTENTS
~Pa e
SYNOPSIS.
1. INTRODUCTION.
2. STATISTICAL ANALYSIS OF SHEAR STUD DATA
Analysis by Beams .
Analysis by Studs . . . . . . . . . . .Interpretation. .
RECOt"'PENDATIONS AND CONCLUSIONS
0 0 ~ 0 ~ 0 ~ 0 0 ~ 111
~ 0 0 0 ~ ~ t ~ 0 ~ 0 1-1
0 0 ~ ~ ~ ~ ~ 0 0 0 ~ 2 1
~ 0 ~ ~ ~ 0 0 0 0 0 ~ 2-1
~ ~ 0 0 0 ~ ~ t ~ 0 ~ 2-2
0 0 0 0 0 0 0 ~ 0 t 0 2~2
0 0 0 0 0 0 0 ~ t 0 0 ~ 3-1
REFERENCES

SYNOPSIS
Upon inspection at the Susquehanna Steam E'lectric Station constructionsite, a higher proportion of improperly welded shear -studs was observed
than is considered normal in composite beam construction. It- is normal,.
for approximately 2 percent of the shear studs to be inadequately'eldedto the steel beam. Of the shear studs tested, approximately 9 percent
failed to pass inspection on an average. A portion of the reinforcedconcrete floor slab was in place at the time of the inspection and thequestion is to determine whether or not measures should be taken to im-
prove the shear connection between the steel rolled section and the con-
crete slab in. that portion of the structure where the floor slab has been
placed, since the shear stud connection is uncertain.
The construction at the power plant employs heavy, thick slabs on heavy
steel rolled sections. In contrast, the common construction in ordinarybuildings employs a thin lightweight floor slab with a formed steel deck
(as slab forming) and the structural steel. beam. 'A formed steel. deck was
employed in the project construction and the steel beams were generallynot shored when the slab concrete was placed;
The statistical -analysis of'ata on shear stud properties where theycould be tested showed that the mean number of studs not passing inspec-tion in any beam in Reactor Buildings 1 and 2 and the Control Buildingwas 9.2, percent, and the standard- deviation of this measure was 6.4 per-cent. The data for the three structures were so similar that they couldbe combined. In contrast, the mean percent of studs not passing inspec-tion was 0.42 percent in the Turbine Building, so that two different

conditions exist. No detailed analytical study appears to be necessaryfor the Turbine Building.
A total of 13,904 studs were examined in the field, 13,073 for Reactor,Buildings 1 and 2 and the Control Building, and 831 in the Turbine Build-ing. The mean failure rate of individual studs in the former group ofstructures is estimated to be 0.0842 and for the latter structure isestimated to be 0.0084. The reason for the need to estimate these ratesarises from the fact that many studs were repaired upon failing to passthe visual test, while only approximately 18 percent of those failing thevisual test actually failed the bending test.
The sample size is adequate for estimation and forecasting.
The study closes with recomnendations for use in evaluating the projectbeams.

1-1
1. INTRODUCTION
This report is prepared in accordance with Bechtel Contract No.
7 PE-TSA-11 and in accordance with, meetings between Bechtel Power Corpor-
ation and Engineering Decision Analysis Company, Inc (EDAC). This reportis concerned with a stastical study of shear stud adeouacy and recormien-
dations for handling the problems from the standpoint of design.
ce
Reference is made to the Bechtel Power Corporation report (Ref. 1) of 1?
Dune 1977 for a statement of the problem. In. essence, a higher failurerate (soundness and bend test) of shear studs than expected has been
observed in the construction of some of the composite beams in the Sus-
quehanna Steam Electric Station construction. The question is whether ornot those beams which had their slabs poured prior to this observationare adequate.
Stud failure data analysis and forecast procedures are discussed in Chap-
ter 2 using, two different types of analysis. The first,type of analysisassumes that the occurrence of inadquate studs is by beams with independ-
ence between beams. This type of analysis produces a failure rate interms of the percent of studs that are satisfactory and-unsatisfactory inany given beam. The second type of analysis assumes that the occurrence
of an inadeouate stud is an independent chance event. No systematic phe-
nomena appear to exist which makes failures tend to occur together'on a
particular beam or in areas of the structure. The two statistical pro-cedures yield slightly different forecasts of the number of adequate
studs in any beam. It was not found possible to consider partialstrengths of studs in the study o~ing to a lack of data.
ceFinally, Chapter 3 presents recomnendations and conclusions.

4

2-1
2. STATISTICAL ANAYSIS OF SHEAR STUD OATA
Two different analyses of the same data are presented in this chapter.
Tn the first analysis, the data are considered in a beam-by-beam basis
assuming independence between beams but not necessarily b tween the studs.
in any one beam. In contrast, the second type of analysis assumes thateach individual stud is independent of all other studs. The chapter
closes with an interpretation of the results in =terms of equivalence ofthe portion of the construction of concern and normal conditions.
ANALYSIS BY BEAMS
The data fall into four sets, Reactor Buildings. 1'and 2, Control Build-ing, and,Turbine Building. In each set, the total number of inadequate
studs was taken as the sum of those that failed the soundness (hamerblow) test, plus those that failed the visual test and the bend
test,'lus
a portion of those that failed the visual test and were repairedwithout further testing. The latter portion was assumed to have the same.
proportion of failures as those that failed the bending test 'after fail«ing the visual test. The results of the analysis are- given in Table
'-1.It is seen that all data except for the Turbine .Building have simi-lar properties so that the data on beams for Reactor Buildings 1 and 2
and Control Building were combined into the first data set .(Fig. 2-1),with that from the Turbine Building being the second data set. No
detailed analysis of the second data set was necessary owing to the low
inadequacy rate.

~,
2~2
The data of the first set-were ordered and plotted on both normal and
lognormal probability paper. The fit of the data to a straight line was
fair on normal probability paper (Fig. 2-2) and fair on lognormal proba-bility paper (Fig. 2-3). This result is reasonable considering the factthat some dependency is apparent in the data on an area bas~s that cannot
be quantified statistically. The median of the lognormal distributionwas 7.5 percent and the standard deviation was 0.626 (log).
ANALYSIS BY STUDS
If the same treatment of the data is employed on an individual stud
basis, the failure rate is 0.0842 for Reactor Buildings 1 and 2, and Con-
trol Buil'ling. If each stud amounts to an independent trial, the proba-,
bility of any combination of failures and successes can be readily calcu-lated using the binominal probability model. Ample data exist to allowthe point estimate of the failure rate to be used in the binomial distri-bution. Thus if a beam contains 100 studs, the mean number of unsatis-factory studs is (100)(0.0842) = 8.42 studs or the mean number of satis-factory studs is 100 - 8.42 = 91.58. Using the analysis by beams, the
corresponding mean number of satisfactory studs is 90.82.
INTERPRETATION
The two different probability models yield slightly different results,with the lognormal model being more conservative than the binominalmodel. That is,,the lognormal model produces a larger probability of
'I
high failure rates than with the binomial model.
From a practical standpoint, however, the two models yield very similarresults. Figure 2-4 provides a useful interpretation of the statisticalstudies. The figure was constructed by assuming that a beam contained100 studs, and i nspection has shown that the proportion of studs which do
not pass the bending test is 5, 8.42, or IO percent (binomial by studs)

~ . ~
2~3
or 9.18 percent by beam (lognormal). If the, a pacce table failure rate is 2
ce t that 100 studspercent (ordina e), analysis can be based on the concep a
are placed when the design only needs 92.5 (8.42 percent curve) studs inorder to achieve an effective mean failure rate of 2 percent.
Thus to achieve an effective mean failure ra e pt of 2 ercent {acceptable)when the actual rate is larger than this value, it is only necessary toplace additional studs. Mith the binomial model, 100 studs in place at a
failure rate-of 8.42 percent becomes a 2 percent f 'ailure rate using 92.5
of the 100 in place studs. The beam (lognorma ) y 'l)anal sis yields 91 of100 studs in place associated with 2 percent failureai lure rate. The two solu-tions are essentia y a sll th t arne with the lognormal (beam) analysis being
very conservative. A gamna model was als 'go investi ated with resultsshown.
The concept. of equivalence expressed in Figur're 2-4 is useful in analysisand design since-the curves relate 100 stu s pd at a articular failure rateto a reduced number of studs at an acceptabl e or normal failure rate.
The above results agree with the study made yb Bechtel Power Corporation{Ref. 5) (Appendix A).

TABLE 2-1
DATA PARAMETERS BY BEAMS
RBl
Source
RB2
Contro1
Composite Set
Turbine
Beams
63
48
11
122
17
'I
MeanPercent
9.26
9. 38
7.88
9.18
0.42
StandardDeviation
Percent
6.55
&.69
. 3.75
6.36
1.26
Coefficientof
Variation
0.71
0.48
0.69
Insufficient Data

-<h
C
90
Zo
/0
geon=v.iE
/0 ZO
Remend
30
FIGURE 2-1 HISTOGRAM> OF SEND TEST FAILURES
IN PERCENT OF STUDS PROVIDED It( A BEAM

ir

2-6
55.55 tt 5 tW tt Se 05 00 '00 10 00 50 0.. 00 10 50 5 1 1 00 Cd C)005 010
2t i— I ~ ~
CN CJ 00 C0 5 1 0 00 Zl 00 A 00 0 70 00 00 5$ 05 55 ttl tkt tLttCs r dih'C Prsko4'II~J
FlGURE 2-2 PLOT OF BEND TEST FA1LURE RATE ON NORMAL PROBABILITY PAPER

I,I'

iE
V
( 2-7
I ~ . ' . ',, ~,
20. 20
20~ ~
wa
I
~ '..tt ~ ' ~ 'I''l!; ' l."'!iI:!I..!!!i '!:.!:I<,",.:~ -'<!;!:i:!I <'i(,].i.a, ~,;i
~!$!;! <
~ ~ I J <0 "s.:.,; "t pc p. Ict,< cr ~ ..< ~ c. <m <Ic <ri~str ct st r. ~....isc<yp .ae <rs '.' < .. I <, ~ 'asw
K.::2I
$
icr 4 av ~ I' '~ r~p ~ I ~ I ~, pJrsr st ~ ~ c h ~ '~'It,ant ~,ti, ' t I 'pJ I t$ 4 2
C ~~ ",' IP ' W ', ~ t <,...,.t ~
rs
0$ .$ . $ CJ IJ ~rSJ'. CW SC< ~ ~ W CSCPP,
0$ ,4
,s . s ~ 'i'- "Pc '$ -'I"w"1<wi < -i'i < 'i "tts'<l l ' i'i' 'i "i''- i! ! i::::i: l ! I l:.::i:.:.:<!"i ~ . I! i < I!: ! ";! I!.ii! l i I':!:$lsh'i: li!i.is« i< .'! l « '. 'i i i'! i::!!i:! !: ! '::! i <
<0 ~ ~ I~ 2 ~ 't" < ~;t -. ~ ~ . I" at sr ~ ~ . ~ ~ ~ ~ ~ ~ I' ~.: I' ~ ~ t P {rs I ~
C4<mcc/c7 TI ${'Q I rp Ey 61% ~g
FIGURE 2-3 PLOT OF BENO TEST FAILURE RATE Oh LOGNORNAL PROBABIL1TY PAPER

i fl tC f

~ ~ ~
2-8
/0
EPPES A'nolgse (Zoynormal) 'R l8fo+am Hnolysrs ($a~mn)
%/E'%%an
g~lj'ufo'atp In Ic5 Si~
8.92 F
0JOO o~5- oZ g gi'O
P'urn$ er g~<umPd /doormat Of /00 SFadS Taiga/
Fl GURE 2-4 E UIVALENCE DIAGRAM

3-1
3. RECOt'~Pi" NDATIONS AND CONCLUSIONS
A detailed statistical analysis of shear stud adequacy disclosed that the
occurrence of studs which fail to pass the soundness and bend test fol-lows recognized probabilistic models. Detailed analyses provided a validbasis for forecasting stud adequacy on the basis of equivalence of those
provided with those having a 2 percent inadequacy rate by the soundness
and bend tests. A slightly different alternate technique was used by
Bechtel Power Corporation (Ref. 5) with the sam basic results.


REFERENCES


R-1
REFERENCES
l. Bechtel Power Corporation, "Interim Report on Shear Studs for Susque-hanna Steam Electric Station Units 1 and 2," 17 June 1977.-
2. Grant, J. A., Fisher, J. h'., and Slutter, R. G., "Composite Beamswith Formed Steel Deck," Engineering Journal AISC, First quarter1977.
3. "manual of Steel Construction," AISC, Seventh Edition
4. Benjamin, J.-R. and, Cornell, C. A., Probability, Statistics, andDecision for Civil Engineers, NcGraw Hi 1] Book Company, Inc., 1970.
5. Bechtel Power Corporation, "Final Report on Shear Studs for Susque-hanna Steam Electric Station Units 1 and 2," 30 December 1977.

/
4l