Embed Size (px)
Citation preview

Ecological Applications, 17(5) Supplement, 2007, pp. S42–S63� 2007 by the Ecological Society of America
SUSCEPTIBILITY OF SALT MARSHES TO NUTRIENT ENRICHMENTAND PREDATOR REMOVAL
LINDA A. DEEGAN,1,7 JENNIFER L. BOWEN,1 DEANNE DRAKE,1 JOHN W. FLEEGER,2 CARL T. FRIEDRICHS,3
KARI A. GALVAN,2 JOHN E. HOBBIE,1 CHARLES HOPKINSON,1 D. SAMUEL JOHNSON,2 J. MICHAEL JOHNSON,1
LYNSEY E. LEMAY,3 ERIN MILLER,4 BRUCE J. PETERSON,1 CHRISTIAN PICARD,1 SALLIE SHELDON,4
MICHAEL SUTHERLAND,5 JOSEPH VALLINO,1 AND R. SCOTT WARREN6
1The Ecosystems Center, Marine Biological Laboratory, Woods Hole, Massachusetts 02543 USA2Department of Biological Sciences, Louisiana State University, Baton Rouge, Louisiana 70803 USA
3Virginia Institute of Marine Science, Gloucester Point, Virginia 23062 USA4Middlebury College, Middlebury, Vermont 05753 USA
5University of Massachusetts, Amherst, Massachusetts 01003 USA6Department of Botany, Connecticut College, New London, Connecticut 06320 USA
Abstract. Salt marsh ecosystems have been considered not susceptible to nitrogenoverloading because early studies suggested that salt marshes adsorbed excess nutrients inplant growth. However, the possible effect of nutrient loading on species composition, and thecombined effects of nutrients and altered species composition on structure and function, waslargely ignored. Failure to understand interactions between nutrient loading and speciescomposition may lead to severe underestimates of the impacts of stresses. We altered wholesalt marsh ecosystems (;60 000 m2/treatment) by addition of nutrients in flooding waters andby reduction of a key predatory fish, the mummichog. We added nutrients (N and P; 15-foldincrease over ambient conditions) directly to the flooding tide to mimic the way anthropogenicnutrients are delivered to marsh ecosystems. Despite the high concentrations (70 mmol N/L)achieved in the water column, our annual N loadings (15–60 g N�m�2�yr�1) were an order ofmagnitude less than most plot-level fertilization experiments, yet we detected responses atseveral trophic levels. Preliminary calculations suggest that 30–40% of the added N wasremoved by the marsh during each tidal cycle. Creek bank Spartina alterniflora and highmarsh S. patens production increased, but not stunted high marsh S. alterniflora. Microbialproduction increased in the fertilized creek bank S. alterniflora habitat where benthicmicroalgae also increased. We found top-down control of benthic microalgae by killifish, butonly under nutrient addition and in the opposite direction (increase) than that predicted by afish–invertebrate–microalgae trophic cascade. Surprisingly, infauna declined in abundanceduring the first season of fertilization and with fish removal. Our results demonstrateecological effects of both nutrient addition and mummichog reduction at the whole-systemlevel, including evidence for synergistic interactions.
Key words: bottom-up; eutrophication; Fundulus heteroclitus; multiple stressors; nutrient loading; saltmarsh; Spartina alterniflora; Spartina patens; species change; top-down.
INTRODUCTION
The sustainability of coastal ecosystems in the face of
widespread environmental change is an issue of pressing
concern throughout the world (Emeis et al. 2001).
Coastal ecosystems form a dynamic interface between
terrestrial and oceanic systems and are one of the most
productive ecosystems in the world. Coastal systems
probably serve more human uses than any other
ecosystem, and they have always been valued for their
rich bounty of fish and shellfish. Coastal areas are also
the sites of the nation’s and the world’s most intense
commercial activity and population growth; worldwide,
;75% of the human population now lives in coastal
regions (Emeis et al. 2001).
Since the mid-1970s, nutrient enrichment of coastal
and estuarine waters has become the premier issue for
both scientists and managers (National Research
Council 2000). Our understanding of coastal eutrophi-
cation has been developed principally through monitor-
ing of estuaries, with a focus on pelagic or subtidal
habitats (National Research Council 2000, Cloern
2001). Because estuarine systems are usually nitrogen
limited, NO3� is the most common nutrient responsible
for cultural nutrient enrichment (Cloern 2001). In-
creased nitrogen delivery to pelagic habitats of estuaries
produces the classic response of ecosystems to stress
(altered primary producers and nutrient cycles and loss
of secondary producer species and production; Nixon
1995, Rapport and Whitford 1999, Deegan et al. 2002).
Manuscript received 15 March 2006; revised 19 October2006; accepted 15 November 2006; final version received 12December 2006. Corresponding Editor: A. Townsend. Forreprints of this Special Issue, see footnote 1, p. S1.
7 E-mail: [email protected]
S42

Saltmarsh ecosystems have been thought of as not
susceptible to nitrogen overloading, because early
studies found added nitrogen increased marsh grass
production (primarily Spartina spp., cordgrass) and
concluded that salt marshes can adsorb excess nutrients
in plants and saltmarsh plant-derived organic matter as
peat (Verhoeven et al. 2006). Detritus from Spartina is
important in food webs (Deegan et al. 2000) and in
creating peat that forms the physical structure of the
marsh platform (Friedrichs and Perry 2001). However,
the accumulation of peat and inputs of sediments, and
the losses of peat through decomposition and sediment
through erosion, may be altered under high nutrient
regimes and threaten the long-term stability of marsh
systems.
Nitrogen addition may lead to either net gain or loss
of the marsh depending on the balance between
increased marsh plant production and increased decom-
position. Absolute change in marsh surface elevation is
determined by marsh plant species composition, pro-
duction, and allocation to above- and belowground
biomass, microbial decomposition, sedimentation, ero-
sion, and compaction (Friedrichs and Perry 2001).
Levine et al. (1998) suggested that competitive dynamics
among plants might be affected by nutrient enrichment,
potentially altering relative abundance patterns and
favoring species with less belowground storage and thus
lowering rates of peat formation. When combined with
the observation that nutrient additions may also
stimulate microbial respiration and decomposition
(Morris and Bradley 1999), the net effect on the salt
marsh under conditions of chronic nitrogen loading is a
critical unknown.
Although most research treats nutrient enrichment as
a standalone stress, it never occurs in isolation from
other perturbations. The effect of nutrient loading on
species composition (both plants and animals), and the
resultant structure and function of wetlands, has been
largely ignored when considering their ability to adsorb
nutrients (Verhoeven et al. 2006). Recent studies suggest
the response of estuaries to stress may depend on animal
species composition (Silliman et al. 2005). Animal
species composition may alter the balance between
marsh gain and loss, as animals may increase or decrease
primary production, decomposition, or N recycling
(Pennings and Bertness 2001).
Failure to understand interactions between nutrient
loading and change in species composition may lead to
underestimating the impacts of these stresses. The
‘‘bottom up or top down’’ theory originated from the
observation that nutrient availability (bottom up) sets
the quantity of primary productivity, while other studies
have shown that species composition (top down),
particularly of top consumers, has a marked and
cascading effect on ecosystems, including controlling
species composition and nutrient cycling (Matson and
Price 1992, Pace et al. 1999). Most examples of trophic
cascades are in aquatic ecosystems with fairly simple,
algal-grazing pelagic food webs (Strong 1992). The
rarity of trophic cascades in terrestrial systems has been
attributed to the importance of detrital food webs (Polis
1999). Detritus-based aquatic ecosystems, such as salt
marshes, bogs, and swamps, have classically been
considered bottom-up or physically controlled ecosys-
tems.
Recent experiments, however, suggest that salt
marshes may exhibit top-down control at several trophic
levels (Silliman and Zeiman 2001, Silliman and Bertness
2002, Quinones-Rivera and Fleeger 2005). One abun-
dant, ubiquitous predator, a small (,10 cm total length)
killifish (Fundulus heteroclitus, mummichog) has been
suggested to control benthic algae through a trophic
cascade, because they prey on the invertebrates that
graze on the benthic algae (Kneib 1997, Sarda et al.
1998). In late summer, killifish are capable of consuming
3–10 times the creek meiofauna production, and
meiofauna in the absence of predators appear capable
of grazing .60% of the microalgal community per day
(Carman et al. 1997). Strong top-down control by
grazers is considered a moderating influence on the
negative effects of elevated nutrients on algae (Worm et
al. 2000). Small-scale nutrient additions and predator
community exclusion experiments have demonstrated
bottom-up and top-down control of macroinfauna in
mudflats associated with saltmarsh creeks (Posey et al.
1999, Posey et al. 2002). Together, these observations
suggest mummichogs are at the top of a trophic cascade
that controls benthic algae (Sarda et al. 1998).
Mummichogs are also omnivorous and ingest algae,
bulk detritus, and the attached microbial community
(D’Avanzo and Valiela 1990). As a result, marsh
decomposition rates may be limited by top-down
controls through trophic pathways or by release from
competition with algae for nutrients.
Whole-ecosystem experiments have shown that re-
sponses to stress are often not predictable from studies
of the individual components (Schindler 1998). Devel-
oping the information needed to predict the interacting
impacts of nutrient loading and species composition
change requires experiments with realistic alterations
carried out at scales of space and time that include the
complexities of real ecosystems. Whole-ecosystem ma-
nipulation experiments have been used effectively in
other ecosystems (Bormann and Likens 1979, Carpenter
et al. 1995), but they are rare in coastal research. The
scale of experiments in salt marshes have traditionally
been less than a few square meters. Our understanding
of the response of saltmarsh plants to nutrient enrich-
ment is from small (,10 m2), plot-level additions, where
uniform levels of dry inorganic fertilizer (20 to .1000
g N�m�2�yr�1) are sprinkled on the marsh surface at low
tide. Dry-fertilizer additions were usually made every
two weeks or monthly, and the duration of elevated
nutrient levels after these additions was usually not
determined. Tidal water is the primary vector for N
delivery to coastal marshes, suggesting that dry fertilizer
July 2007 S43SALTMARSH RESPONSE TO MULTIPLE STRESSORS

addition to the marsh surface may not be the best basis
for determining if Spartina production responds to
nutrient enrichment of tidal waters. Similarly, our
understanding of top-down controls in salt marshes
also relies on small (1–4 m2) exclusion experiments that
use cages to isolate communities from top consumers.
While the design of these cage experiments has
improved, there are some remaining drawbacks. For
example, it is impossible to selectively exclude single
species using cages, and recruitment or size-selective
movement into or out of the cages may obscure
interpretations. In addition, while these small-scale
experiments provide insight into controls on isolated
ecosystem processes, they do not allow for interaction
among different parts of the ecosystem that may buffer
or alter the impacts, nor are they appropriate for
determining the effects of populations of larger more
motile animals on whole ecosystems or the effects of
ecosystem changes on populations. For example, inter-
actions may be caused when a motile species alters its
distribution among the habitats available to it because
of an experimental treatment. Small-scale experiments
generally do not allow such events to happen. Complex
feedbacks among physical and biological processes can
alter accumulation rates and affect marsh elevation
relative to sea level rise, making extrapolation of small
plot-level experiments to whole-marsh ecosystems prob-
lematic.
We are conducting an ecosystem-scale, multiyear field
experiment including both nutrient and biotic manipu-
lations to coastal saltmarsh ecosystems. We are testing,
for the first time at the ecosystem level, the hypothesis
that nutrient enrichment and species composition
change have interactive effects across multiple levels of
biological organization and a range of biogeochemical
processes. We altered whole saltmarsh creek watersheds
(;60 000 m2 of salt marsh) by addition of nutrients (15-
fold above ambient levels) in flooding waters, and by a
60% reduction of a key fish species, the mummichog.
Small marsh creek watersheds provide an ideal exper-
imental setting, because they have the spatial complex-
ity, species composition, and processes characteristic of
the larger salt marsh ecosystem, which are often
hundreds of thousands of square meters. Manipulating
entire saltmarsh creeksheds allowed us to examine
effects on large motile animals and the interactive effects
of motile species changes on ecosystem processes
without cage artifacts. Because our manipulations were
done on whole-marsh ecosystems, we are able to
evaluate the integrated and interactive effects on all
habitats (e.g., water column, tidal creeks, and marsh)
and on populations. These experiments are similar in
many respects to the small watershed experiments
carried out in forested catchments.
Our nutrient enrichment is novel compared to past
studies in two important ways. We added nutrients (N
and P) directly to the flooding tidal creek waters to
mimic the way in which anthropogenic nutrients reach
marsh ecosystems. All previous experimental salt marsh
nutrient enrichment studies used a dose–response design
with spatially uniform dry-fertilizer loading on small
plots (,10 m2). Nutrients carried in water will interact
and reach parts of the ecosystem differently than dry
fertilizer. Our enrichment method also creates a spatial
gradient of nutrient loading across the landscape that is
proportional to the frequency and depth of inundation
in the marsh. Spatial gradients in loading within an
ecosystem are typical in real-world situations in many
terrestrial and aquatic ecosystems. Because of our
enrichment method, at any location in the ecosystem,
nutrient load will be a function of the nutrient
concentration in the water, the frequency and depth of
tidal flooding, and the reduction of nutrients from the
flooding waters by other parts of the ecosystem.
Uniform loading misses important aspects of the spatial
complexity of ecosystem exposure and response.
This work is organized around two questions that are
central to understanding the long-term fate of coastal
marshes:
1) Does chronic nutrient enrichment via flooding
water increase primary production more than it
stimulates microbial decomposition?
2) Do top-down controls change the response of the
saltmarsh ecosystem to nutrient enrichment?
Here we present findings on the first two years of these
experiments including the following: (1) water chemis-
try, (2) standing stocks and species composition of
benthic microalgae, (3) microbial production, (4) species
composition and ecophysiology of macrophytes, (5)
invertebrates, and (6) nekton. Because even highly
eutrophic waters result in nutrient loading that is an
order of magnitude less than most plot-level experi-
ments, we expected little stimulation of saltmarsh
vascular plant growth. However, moderate levels of
nutrient enrichment in the water column were expected
to increase benthic algal biomass and to stimulate
bacterial activity and detrital decomposition throughout
the ecosystem because of direct uptake of nitrogen from
the water column and availability of more high-quality
organic matter from increased algal production. We
predicted nutrient enrichment would increase inverte-
brate production because of an increase of high-quality
microalgal and microbial production at the base of the
food web. Finally, we predicted that fish reduction
would reduce predation on benthic invertebrates,
resulting in increased abundance of benthic inverte-
brates that would graze down the benthic algae.
SITE DESCRIPTION
The Plum Island Sound estuary in New England,
USA, where we conducted our experiments is a classic
saltmarsh estuary that is currently unaffected by
nutrient loading (Fig. 1). Tall Spartina alterniflora
(;200 cm in height; smooth cordgrass) is found in pure
stands in low marsh and along creek banks that receive
daily tidal inundation, while Spartina patens (20–60 cm
LINDA A. DEEGAN ET AL.S44Ecological Applications
Special Issue
in height; saltmeadow cordgrass) is most abundant in
higher elevation areas that are well drained and flood
less frequently (see Plate 1). S. alterniflora also occurs in
a short form (20–60 cm in height) in the high marsh,
often in pure stands in areas that are poorly drained.
Most of the total marsh area (;80%) is high marsh that
floods on spring tides. Mean tide is 2.6 m; mean spring
tides are 3 m. During a typical growing season, S.
alterniflora in Plum Island is under water ;35% of the
time, while S. patens and short form S. alterniflora are
inundated ;12% of the time. As is typical of most New
England marshes, historically the marsh platform was
ditched for saltmarsh haying and mosquito control.
Ditch edges show the same vegetation zonation as creek
banks. Currently, the all marshes are periodically
sprayed with Bacillus thuringienis israelensis (BTI) for
mosquito control.
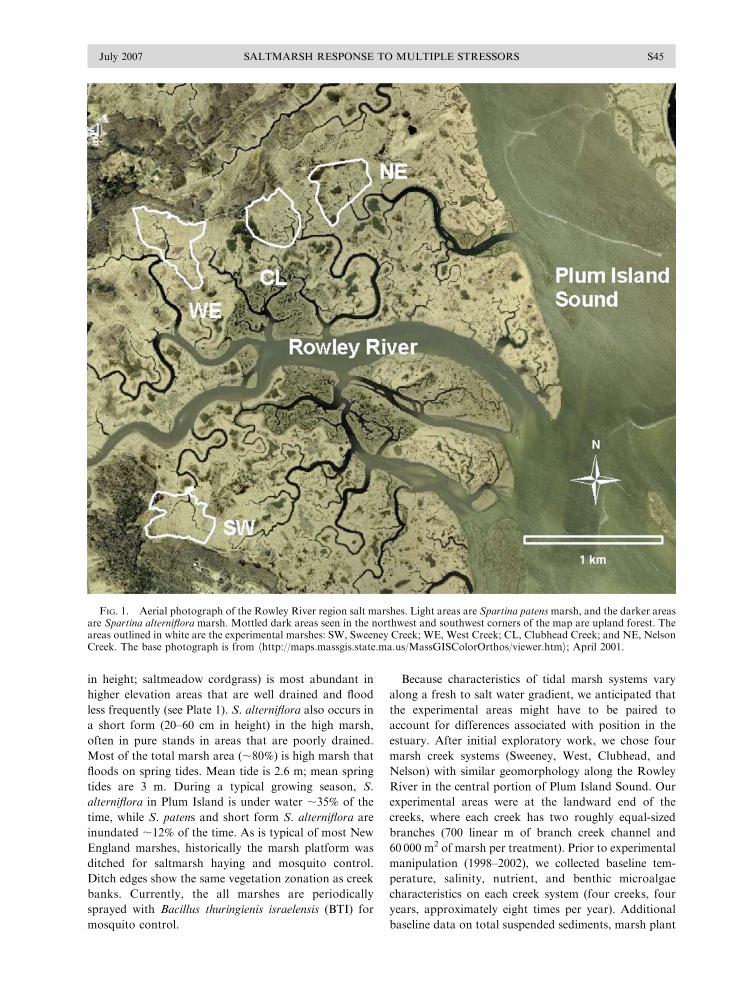
Because characteristics of tidal marsh systems vary
along a fresh to salt water gradient, we anticipated that
the experimental areas might have to be paired to
account for differences associated with position in the
estuary. After initial exploratory work, we chose four
marsh creek systems (Sweeney, West, Clubhead, and
Nelson) with similar geomorphology along the Rowley
River in the central portion of Plum Island Sound. Our
experimental areas were at the landward end of the
creeks, where each creek has two roughly equal-sized
branches (700 linear m of branch creek channel and
60 000 m2 of marsh per treatment). Prior to experimental
manipulation (1998–2002), we collected baseline tem-
perature, salinity, nutrient, and benthic microalgae
characteristics on each creek system (four creeks, four
years, approximately eight times per year). Additional
baseline data on total suspended sediments, marsh plant
FIG. 1. Aerial photograph of the Rowley River region salt marshes. Light areas are Spartina patensmarsh, and the darker areasare Spartina alterniflora marsh. Mottled dark areas seen in the northwest and southwest corners of the map are upland forest. Theareas outlined in white are the experimental marshes: SW, Sweeney Creek; WE, West Creek; CL, Clubhead Creek; and NE, NelsonCreek. The base photograph is from hhttp://maps.massgis.state.ma.us/MassGISColorOrthos/viewer.htmi; April 2001.
July 2007 S45SALTMARSH RESPONSE TO MULTIPLE STRESSORS

species composition, and distribution was collected in
2003.
The four marsh creek watersheds were very similar,
but differences in salinity and vascular plant community
composition supported pairing the two sets of experi-
mental and reference creeks. Water column temperature,
nutrients (NO3�, NH4
þ, PO43�), total suspended sedi-
ments, and phytoplankton did not differ among the four
creeks, or in branches within creeks (P . 0.05 for all
constituents except ammonium; see Appendix A),
however water column parameters for all creeks were
different from Plum Island Sound water (Table 1).
Creeks had warmer temperatures, lower salinities,
higher nutrients, and higher phytoplankton biomass
than did the Sound. Sweeney and West are located
further upstream along the tidal Rowley River, closer to
sources of freshwater, and had slightly lower salinities
than did Clubhead and Nelson.
Marsh vegetation followed the classic distribution of
saltmarsh plant communities: tall Spartina alterniflora
was found along the creek banks in a band that varied in
width (1–3 m); short S. alterniflora, S. patens, and
Distichlis spicata (saltgrass) were found on the high-
marsh platform (see Plate 1). Similarity analysis of the
plant community (ANOSIM, Primer-E, Plymouth, UK)
found no difference between Sweeney and West (P ¼0.195) and between Clubhead and Nelson (P ¼ 0.152).
Analysis of all other creek pairings found that the plant
communities were significantly different (for all other
pairings, P , 0.004). Total cover of tall S. alterniflora
and of high-marsh S. patens did not differ among creeks.
Sweeney and West had less short S. alterniflora than did
Clubhead and Nelson, and much higher cover of D.
spicata. Atriplex patula (spear saltbush) contributed little
to total cover and had higher cover in Sweeney and West
compared to Clubhead and Nelson. Sweeney and West
also had consistently less plant litter and standing dead
than did Clubhead and Nelson. We also mapped the
boundaries of individual plant communities using high
precision GPS (62 cm horizontal; maps not shown) to
provide a baseline from which to determine long-term
shifts in plant community boundaries.
Baseline benthic microalgal biomass differed among
habitats (Table 1), and was highest in the intertidal S.
alterniflora habitat (220 mg chl a/m2), intermediate in
intertidal mudflat habitat (100 mg chl a/m2), and lowest
in high-marsh S. patens (60 lg chl a/m2; see Plate 1).
West had higher mudflat and S. alterniflora habitat
microalgae biomass compared to Sweeney, while Club-
head and Nelson were very similar to each other. Algal
biomass in S. patens was highest in Nelson and lowest in
Sweeney.
Creek pairings were made on the basis of plant
community structure and position in the estuary. Creek
pair 1 was Sweeney and West. This pair was closest to
the freshwater end of the estuary, had slightly lower
salinity and very similar marsh plant communities.
Creek pair 2 was Clubhead and Nelson. This pair was
TABLE 1. Saltmarsh characteristics (means 6 SE) prior to experimental manipulations (1998–2003).
Characteristic P
Creek pair 1 Creek pair 2Plum Island
SoundSweeney West Clubhead Nelson
Marsh creek area (m2 3 104) 12.5 14.8 11.4 12.1
Water column
Salinity (psu) 0.001 20.8a 6 0.8 24.0a,b 6 0.8 27.0b 6 0.8 25.2b 6 0.9 29.1b 6 0.9Temperature (8C) 0.009 18.7a 6 0.8 19.4a 6 0.6 20.0a 6 0.7 19.0a 6 0.9 14.1b 6 1.1Nitrate (lm) 0.023 4.3a 6 0.3 3.5a 6 0.4 3.2a 6 0.3 2.7a 6 0.3 0.7b 6 0.2Ammonium (lm) 0.001 11.7a 6 1.3 10.0a 6 1.6 13.8a 6 1.8 14.9a 6 2.1 0.8b 6 0.2Phosphate (lm) 0.001 1.2a 6 0.1 0.9a 6 0.1 1.1a 6 0.1 1.3a 6 0.1 0.4b 6 0.03Phytoplankton (mg chl a/L) 0.001 8.4a 6 0.9 8.8a 6 1.6 7.4a 6 0.8 9.0a 6 1.1 2.5b 6 0.4TSS (mg/L) 15 6 0.8 18 6 1.0 19 6 1.3 14 6 1.6
Benthic algae (mg chl a/m2)
Mudflat 0.001 62.7b 6 3.7 93.6a 6 7.7 134.7c 6 6.7 110a,c 6 11.1S. alterniflora 0.250 197.5a 6 33.9 250.8a 6 23.9 215.2a 6 6.8 249.0a 6 27.4S. patens 0.001 94.6a 6 19.4 48.6a 6 6.5 55.1a 6 4.3 135.9b 6 27.6
Vascular plant community(percent cover)
Tall S. alterniflora 0.738 5.5 6 1.1 6.2 6 1.1 7.16 1.2 7.1 6 1.1Short S. alterniflora 0.001 16.8a 6 1.5 18.5a 6 1.6 24.9b 6 1.9 30.6b 6 1.8S. patens 0.078 41.0 6 1.7 42.3 6 1.9 43.6 6 2.0 37.1 6 1.7D. spicata 0.001 25.9a 6 1.5 18.0b 6 1.4 7.8c 6 1.1 8.0c 6 1.1No. plant species/m2 0.001 2.7a 6 0.1 2.5a 6 0.1 2.1b 6 0.0 2.1b 6 0.1
Notes: Water column and benthic algae data are from 1998–2002. Total suspended solids (TSS) and vascular plant community(percent cover) are from 2003, prior to experimental treatments. Values of P are for ANOVAmain effect for creek on water columnand benthic algae. Differences between creek branches were always P . 0.05. Different superscript letters indicate differencesamong creeks within a row (Tukey, P , 0.05). Error degrees of freedom N (see Appendix A): salinity, 240; temperature, 159;nitrate, 230; ammonium, 161; phosphate, 250; phytoplankton, 247; mudflat habitat benthic algae, 247; Spartina alterniflora habitatbenthic algae, 99; Spartina patens habitat benthic algae, 102; total inorganic suspended sediments (TSS), 109; and vascular plants,23 for each plant species and number of species.
LINDA A. DEEGAN ET AL.S46Ecological Applications
Special Issue

more seaward, with higher salinities and marsh plant
communities similar to each other and different than
creek pair 1.
EXPERIMENTAL DESIGN
We manipulated the marsh ecosystem in two ways: (1)
nutrients were added to one creek of each pair (to ;15-
fold above ambient reference concentrations); and (2)
fish were reduced in one branch of each creek (;60%
decline in mummichog) (Fig. 2). This design resulted in
four, ;60 000 m2 marsh treatments within each pair:
ambient nutrients–ambient mummichog, ambient nutri-
ents–low mummichog, high nutrients–ambient mummi-
chog, and high nutrients–low mummichog. We will refer
to the ambient-nutrient creeks as ‘‘nutrient reference’’
and the nutrient-enriched creeks as ‘‘nutrient enrich-
ment.’’ The fish treatments will be called ambient
(‘‘fish’’) or reduction (‘‘low fish’’); these are located in
either a reference or nutrient-enrichment creek.
We used a before-and-after control (BACI) type of
experimental design in which pairing of experimental
units accounts for variability that would contribute to
error in a completely randomized design (Underwood
1994). Replication of ecosystem-scale experiments is
difficult, because it is often hard to find similar
ecosystems (Carpenter et al. 1995, Schindler 1998); the
matched-pair approach helps ameliorate this difficulty
(Stewart-Oaten and Bence 2001). The use of large
experimental units (in our case ;60 000 m2/treatment)
is both labor-intensive and expensive (fertilizer alone
costs ;$20 000/yr for each creek). These types of
constraints generally necessitate low replication of
individual treatments in ecosystem-scale experiments.
While subject to the limitations of pseudoreplication
(Hurlbert 1984) and small sample size, large-scale
manipulative studies provide a realistic environment
for examining effects and processes that occur at an
ecosystem-scale. Our results include the effects of spatial
variation and complexity, interactions between all of the
species in the system, gradients across large areas, and
large habitat patches.
The experiment was implemented in phases. In 2003
(year 0), standardized procedures and methods were
developed and extensive baseline measurements were
made in all creeks and branches. In 2004, we began
nutrient and fish reduction manipulations in creek pair 1
(year 1). In 2005, manipulations continued in creek pair
1 (year 2) and began in creek pair 2 (year 1). Nutrients
were added to Sweeney Creek (pair 1) and Clubhead
Creek (pair 2).
Nutrient addition
We implemented an enrichment of 70 lmol NO3�/L
and 4 lmol PO43�/L (both 15-fold increases over
background concentrations of ,5 lmol NO3�/L and
;1 lmol PO43�/L; Table 1). These concentrations are
typical in estuarine systems designated as moderate to
highly eutrophic, based on the response of the pelagic
and subtidal system (National Oceanic and Atmospheric
Administration 1999, Environmental Protection Agency
[EPA] 2002). We added the NO3�and PO4
3� in ;15:1
molar ratio as anthropogenic increases in NO3� in
coastal waters is usually accompanied by increased
PO43� (EPA 2002). We added nutrients by pumping a
concentrated solution of NO3� and PO4
3� to the
flooding water of every tide during the growing season
(mid-May–October; ;150 d). The pump rate was
adjusted every 10 min throughout each incoming tide
(based on a hydrologic model) to maintain constant N
and P concentrations in incoming waters until a water
depth of 3.2 m in the channel (equivalent to ;15 cm of
water on the high-marsh platform) was reached. The
cessation of nutrient addition at water levels .3.2 m
affected approximately the last half hour of the
incoming tide on ,20% of the tides between May and
October. The solution was distributed through the water
column by vertical and horizontal spreader bars and
traveled ;100 m allowing in-channel mixing to occur
before reaching the experimental area boundary.
Fish reduction
Mummichogs in this estuary have been observed to
winter in deep water and move up into marsh systems to
spawn in May and June, although some may winter in
pools on the marsh platform (Raposa 2003). We
excluded adult mummichogs from entering one branch
of each creek by using block nets (installed at the branch
mouth and small channel boundaries prior to the spring
migration) and by constantly deployed minnow traps
that fished throughout the season (selective for mum-
michogs; Layman and Smith 2001). Previous tagging
work in these marshes found mummichogs had a home
range of ;300 linear meters of creek and little
movement between creek branches (Sweeney et al.
FIG. 2. Diagram of design of creek pairs and experimentaltreatments. Stars indicate locations of nutrient addition toflooding water. Dotted lines indicate locations of fish barriers;minnow traps were placed behind this barrier with ;25-mspacings.
July 2007 S47SALTMARSH RESPONSE TO MULTIPLE STRESSORS

1998). Minnow-trapped mummichogs were released .1
km from the treatment area; all other species werereturned to the creek. The combination of block netting
and minnow trapping reduced mummichog abundanceby ;60% (analyses presented in Results: Fish reduction).
Sampling locations
Three benchmark sample areas, or ‘‘strata,’’ were
established on each branch of each creek in 2003. Eachstratum began in the creek channel, was 10 m wide, and
extended onto the marsh platform for 50 m. Strata weredesigned to represent the whole treatment area, and to
include potential effects of distance from the nutrientaddition point. The strata were spaced along each
branch ;100 m apart, and each included all majorhabitat types: intertidal mudflat (MF) in the creek,
filamentous microalgae (FA) at the top of the creekbank, tall-form S. alterniflora (TSA) at the top the creek
bank, S. patens (SP) on the marsh platform, and short-form S. alterniflora (SSA) on the platform. During
2003–2005, much of the routine/repeated sample collec-tion, such as benthic chlorophyll and invertebrates,
sediments, and plant production, was conducted withinthe strata; replicates from each habitat type wascollected from within each stratum. Specific collection
points were haphazardly located within habitats. Addi-tional samples of many types were frequently collected
outside of the established strata.
METHODS
Nutrients and suspended sediments
We measured baseline water quality characteristics
(NO3�, NH4
þ, PO43�, TSS, salinity, etc.) for four
growing seasons prior to manipulations (May–Septem-
ber, 1998–2002). We collected water samples duringmid-ebb once or twice per month from each creekbranch and from ;25 m seaward of the confluence of
each pair of creek branches. Water samples were alsocollected two to four times each year from three
locations in the Plum Island Sound, New England,USA, to characterize the water that floods the creeks.
In 2003 (premanipulation), 2004, and 2005, weconducted intensive, bimonthly, tidal cycle sampling
(hourly sampling over a full, 12-h tidal cycle). Eachmonth (May–September), one spring tide cycle and one
neap tide cycle were sampled at each creek branch andconfluence location. Tidal cycle sampling allows calcu-
lation of nutrient delivery, retention, and export(budgets) for whole tidal cycles.
One-liter water samples were collected in acid washed,Nalgene bottles using an autosampler (SIGMA, Love-
land, Colorado, USA). Samples were refrigerated andfiltered within 24 h of collection (precombusted 47 mm
glass fiber filter [GFF]) and frozen until analysis.Chlorophyll a (chl a) was determined on the filter (foil
wrapped; frozen; 90% acetone extraction and fluorom-eter analysis, Holm-Hansen et al. 1965). Concentrations
of NO3� were determined colorimetrically on a flow
injection analyzer (Lachat Quik Chem 8000, Lachat
Zellweger Instruments, Milwaukee, Wisconsin, USA)
using the cadmium–copper reduction method (Wood et
al. 1967), concentrations of PO43� were determined
colorimetrically using the ascorbic acid method (Parsons
et al. 1984), and concentrations of NH4þ were deter-
mined colorimetrically using the phenolhypochlorite
method modified for small sample size (Solorzano
1969). Both PO43� and NH4
þ samples were run on a
Cary Spectrophotometer (Varian, Palo Alto, California,
USA).
Water on the marsh platform at high tide was sampled
during 2005. Acid washed, narrow-mouthed bottles were
attached to stakes and placed throughout the marsh at
low tide. The flooding tide filled the bottles, which were
retrieved after the tide subsided. These samples were
treated as described and analyzed for NO3�.
In 2003, total suspended solids samples were collected
weekly at slack high tide within each branch of the four
creeks. One-liter samples were filtered through pre-
weighed, ashed filters (47 mm, 0.7 lm GFF). Filters
were then ashed and weighed to determine the amount
of inorganic material in suspension.
Vascular marsh plants
To characterize the marsh community prior to
manipulations (July 2003), plant species occurrence
and visual estimates of percent cover by species were
recorded in contiguous 1-m2 plots (N ¼ 50) along the
length of each strata for each creek (N ¼ 3 strata per
treatment branch; N ¼ 6 per creek). Plant frequency
(percentage of plots in which a species occurred) and
mean percent cover for each species were determined for
each strata (N ¼ 6 for each species per creek).
Shoot growth of tall S. alterniflora, short S. alterni-
flora, and S. patens was determined in creek pair 1 (years
1 and 2). Every two weeks (mid-May–August) haphaz-
ardly selected shoots (N ¼ 25) of each type in each
stratum were cut at the peat surface and refrigerated
within two hours. Each shoot was individually washed
to remove sediment, measured for length, and dried
(808C for �24 h). Mean shoot length (cm), mass (g), and
length-specific leaf mass (mass of an individual shoot
divided by the total length; g/cm) were determined for
each shoot. Values were normally distributed for all
three parameters. Nitrogen and carbon content of tall S.
alterniflora, short S. alterniflora, and S. patens were
determined (June, July, and August, 2004; N ¼ 6 per
plant type per creek; PerkinElmer 2400 Series II
CHNS/O analyzer, PerkinElmer Life and Analytical
Sciences, Wellesley, Massachusetts, USA). Stem density
(shoots per unit area) was counted in four plots
haphazardly located within 5 m of the centerline of the
sample strata in August, and means were calculated for
each plant type for each stratum (N ¼ 6 per plant type
per creek). Because of known differences in stem density
between species and growth forms, different size
quadrats were used for each species: tall S. alterniflora,
LINDA A. DEEGAN ET AL.S48Ecological Applications
Special Issue

square 0.25 m2; short S. alterniflora, square 0.0625 m2;
S. patens, circle 0.008 m2.
Microbial production
Surface sediment samples for bacterial production
were taken using a core (N ¼ 10; 1.5 cm diameter, ,10
mm depth) monthly during the growing season in tall S.
alterniflora and S. patens. Replicates were homogenized
and then subsampled (N ¼ 5) for measurement of
bacterial production by uptake of tritiated leucine in
sediment slurries (Buesing and Gessner 2003).
Benthic microalgae
Benthic microalgal biomass samples were collected
monthly (June–September; 2003, 2004, and 2005; creek
pair 2 was not sampled in 2004) in mudflat, tall S.
alterniflora, and S. patens habitats. Macroalgae were
rare in these systems. Filamentous (and associated
epiphytic) algae occur in specific habitats (i.e., the creek
wall near the top and associated with the stems of short-
form S. alterniflora), and their responses will be
discussed in future reports. In September 2005, supple-
mental samples spaced along the entire creek branch
length were taken in each habitat. Cores were taken in
each habitat in each sampling area (two per habitat per
area; 2.7 cm diameter, 2 cm depth), frozen immediately,
and total chlorophyll a (mg chl a/cm2) determined
(Lorenzen 1967; acetone extraction and spectrophoto-
metric analysis). Data were log-transformed.
Benthic microalgal species composition and numerical
response were measured monthly on glass slides (five
slides per collection; one collection per stratum per
month) located parallel to stream flow in the middle of
the creek channel and submerged for 2–3 days. Slides
were preserved in 70% ethanol, and the species
composition and density were determined by micro-
scopic examination.
Benthic invertebrates
Macroinfauna and meiofauna collections were taken
coincident with monthly benthic microalgal samples.
Macroinfauna samples taken 10 wk after nutrient
addition and fish reduction treatments began (2–3
August 2004) in tall S. alterniflora in creek pair 1 were
analyzed. Duplicate cores (6.6 cm diameter push core; to
5 cm depth) were collected at low tide and fixed with
10% formalin and Rose Bengal. After a minimum of two
days, samples were sieved (500-lm sieve) and macro-
infauna were enumerated and identified to the lowest
possible taxon. Permanent meiofauna (e.g., nematodes)
were not enumerated. Because annelids constituted 98%
of all macroinfauna and not all species have been
identified, we report only total annelid abundance. Data
met the criteria for normal distribution.
To examine the effects of fish reduction on motile
saltmarsh epifauna, passive collectors (litterbags) were
placed in the tall S. alterniflora habitat of reference
creeks in July 2005. The bags (13.5 3 29 cm, with 5-mm
delta weave mesh) were filled with ;20 g of dried,
standing, dead, S. alterniflora leaves (Fell et al. 1998).
After two weeks, litterbags were collected and contents
preserved in 50% ethanol and Rose Bengal solution.
After at least two days, litter was rinsed over a 0.5-mm
sieve, and all animals were collected using forceps and a
hand lens. Animals were identified to lowest possible
taxon and enumerated. Here we report on the most
abundant species collected, the amphipod Uhlorchestia
spartinophila, which comprised about 75% of the
animals collected.
Nekton abundance, growth, and diet
Nekton were collected on the marsh surface each
month (September–October 2003; June–September 2004
and 2005) during nighttime spring tides in each stratum
(N¼ 3 per treatment branch). Flume nets (dyed green 3-
mm delta mesh) were 3 m wide at the marsh–creek
interface and extended perpendicularly 10 m onto the
marsh surface (30 m2 of marsh surface). Nets were flush
with the marsh surface as the tide rose; at slack high tide,
the sides were lifted, and the front and back nets
attached to enclose the area. The front net collected fish
as they moved off of the marsh surface with the falling
tide. All nekton collected were identified to species, and
�300 individuals of each species measured (total length(TL) 6 1 mm) and weighed (mass 6 0.01 g) individually;
if we collected .300 individuals per species, remaining
individuals were weighed as an aggregate by species.
Abundance and biomass were square-root (n þ 1)
transformed. Mean size (TL 6 1 mm) of young-of-the-
year Palaemonetes pugio (daggerblade grass shrimp) was
estimated in August and September using length
frequency (NORMSEP procedure; Food and Agricul-
ture Organization of the United Nations, 2000, FISAT
II, Rome, Italy). Growth was estimated as the change in
mean size of the smallest size group. Length frequency
was square-root (n þ 1) transformed before ANOVA
analysis. Mummichog diet was analyzed on fish (N¼ 20
per treatment per period) captured in flume nets or
minnow traps in summer of 2004 and 2006. Gut fullness
was estimated and items identified to lowest practical
taxon under a dissecting microscope (Hyslop 1980).
Data analysis
A paired BACI-type ANOVA (Nutrient, Fish reduc-
tion, Before/After) analysis with Type III sums of
squares was used to analyze the effectiveness of the fish
reduction treatment, and the response of benthic
microalgal biomass and grass shrimp abundance to
nutrient addition and fish reduction treatments. We
present computed P values, but infer significance when
P , 0.1 because, in a complex ecosystem experiment,
background variability is generally high and replication
low, and we wanted to identify hypotheses with support
in the data (Oksanen 2001, Hobbs and Hilborn 2006).
Evidence from several lines of inquiry was used to
further examine support for the responses. Because of
July 2007 S49SALTMARSH RESPONSE TO MULTIPLE STRESSORS

known differences between creek pairs, and because the
pairs were manipulated for different lengths of time,
creek pairs were analyzed separately. Replicates of
response variables were averaged by sample strata
within a treatment (N ¼ 3 per treatment). In explor-
atory analysis, we found no spatial pattern associated
with strata for any variable, therefore they were
considered independent estimates of the treatment
response. Monthly data were nested within treatment
Year (0, 1, 2) and Before (0)/After (1, 2). Analysis was
performed on the mean response variables (appropri-
ately transformed to meet the assumption of normal-
ity), not differences, so that we could examine the
interactive effects of nutrient addition and fish reduc-
tion. A significant interaction term (Nutrient 3 Fish 3
Month(Year, Before/After) indicated a difference
among treatments over time. If a significant interaction
occurred, data were examined visually and Tukey or t
tests used to determine differences (Stewart-Oaten and
Bence 2001, Parker and Wiens 2005). A two-way
ANOVA (Nutrient, Fish reduction) was used to analyze
benthic microalgal count and macroinfaunal abun-
dance. An ANOVA (Nutrient, Fish reduction, Month)
was used to analyze shrimp body size data. All
ANOVAs were calculated using SuperANOVA (1996,
Abacus Concepts, Berkeley, California, USA). We
expected that fish reduction would have no effect on
vascular plants, as the overall nutrient regime (enriched
or reference) would not be altered by fish abundance.
This was confirmed by initial analyses, and therefore
vegetation data were pooled between fish treatments
within a creek (nutrient reference or enrichment) and
analyzed using the individual measurements. Because
the plant response metrics were calculated from the
same samples (height- and length-specific leaf mass, N¼125 for each species in each creek), we used a
Bonferroni adjustment of significance from 0.1 to
0.05. Tukey or t tests were used to examine differences
among treatments. Plant community data was analyzed
using the ANOSIM procedure in Primer (Primer 5 for
Windows Version 5.2.9, 2002, Primer-E, Plymouth,
UK). Microbial production was analyzed by plotting
nutrient-enriched against reference values and examin-
ing the distribution above and below the one-to-one
line with Wilcoxon signed rank test.
RESULTS
Experimental manipulations
Nutrient addition.—In both creek pairs, we achieved
our target NO3� enrichment of ;15-fold increase over
reference conditions. Nutrient addition increased theannual mean concentration of NO3
� in the water
flooding in creek pair 1 by a factor of ;14-fold (year1) to ;19-fold (year 2) and ;23-fold in creek pair 2
(Table 2). The nutrient addition increased PO43�
concentrations in creek pair 1 by a factor of approxi-
mately five. We added ;3500 kg of N (as NaNO3) and250 kg of P (as NaH2PO4) each year to each of the
nutrient-enriched creeks (creek pair 1, 3251 kg N in year1, 3546 kg N in year 2, 231 kg P in year 1, 252 kg P in
year 2; creek pair 2, 4592 kg N in year 1, 327 kg P in year1). Mean flooding water nutrient concentrations in year0 (prior to nutrient addition) in the nutrient-enrichment
and reference creeks of both pairs (NO3�, 2.6 lmol/L;
NH4þ, 9.1 lmol/L; PO4
3�, 0.9 lmol/L) were similar to
the 1998–2002 concentrations (Table 1). In year 0, as istypical of salt marshes, ebbing waters generally had
lower NO3� concentrations (1.3 lmol/L), while NH4
þ
was highly variable through the tidal cycle (,1–24
lmol/L), with high concentrations generally occurring atlow tide. The concentration of PO4
3� remained at ;1
lmol/L through the tidal cycle.In the first year of nutrient addition to creek pair 1,
our addition resulted in an annual mean of 70 lmolNO3
�/L and 5.1 lmol PO43�/L for the experimental
period. However, examination of specific tidal cycles
early in the growing season demonstrated lower thantarget concentrations during spring tides and higher
than target concentrations during neap tides. Conse-quently, we adjusted the nutrient addition rate in the
following year to achieve more uniform nutrientconcentrations over a variety of tidal regimes.
The consistent decrease in NO3� concentration on
ebbing tides in both nutrient-enriched creeks suggests
uptake of the added NO3� by the marsh ecosystem.
Significantly lower concentrations of NO3� in ebbing
water compared to flooding water in creek pair 1 (year 1,
TABLE 2. Incoming and outgoing nutrient concentrations (means 6 SE) during the major tidal water flux periods for all creeks inthe premanipulation year (year 0) and nutrient addition creeks in treatment years (years 1 and 2).
Nutrient
Baseline Nutrient addition
All creeks Creek pair 1 Creek pair 2
Year 0 Year 1 Year 2 Year 1
In Out In Out In Out In Out
NO3� 2.6 6 0.3 1.3 6 0.3 70.7 6 38.3 58.4 6 38.9 94.9 6 18.4 59.2 6 17.1 116.3 6 20.8 98.2 6 22.4
NH4þ 9.1 6 3.1 4.7 6 3.4 9.4 6 1.3 4.4 6 0.6 3.7 6 1.0 6.5 6 1.9 ��� ���
PO43� 0.9 6 0.05 1.0 6 0.08 5.1 6 2.6 4.2 6 2.5 ��� ��� ��� ���
Notes: All nutrient concentrations given in lmol/L. Missing data for samples that have not yet been analyzed are indicated byellipses (���).
LINDA A. DEEGAN ET AL.S50Ecological Applications
Special Issue

58 vs. 70 lmol NO3�/L; year 2, 60 vs. 95 lmol NO3
�/L)
and creek pair 2 (98 vs. 116 lmol NO3�/L) suggest
uptake by the marsh. Concentrations of NH4þ did not
differ substantially between flooding and ebbing tides.
Despite our initial expectation that the marsh far from
the addition point might receive water with lower
nutrient concentration due to uptake as the water
moved across the marsh, nutrient concentrations at
high tide were high across the marsh platform (Fig. 3).
The mean NO3� concentration on the nutrient-enriched
marsh was ;80 lmol NO3�/L (range, 49–105 lmol
NO3�/L) for creek pair 1. The NO3
� concentration was
;50 lmol NO3�/L (range, 2–78 lmol NO3
�/L) on the
nutrient-enriched marsh of creek pair 2. On highest
tides, some dilution of nutrient concentration by water
from other creeks outside the study areas was evident on
the southern border of creek pair 2. These edges were
several hundred meters away from the designated
sampling areas and were not sampled for any response
variables.
FIG. 3. Concentration of NO3� (lmol/L) on the marsh platform of the nutrient addition creeks of each creek pair at high tide,
July 2005. Creek pair 1 is Sweeney, and creek pair 2 is Clubhead. The four-pointed star indicates the point of nutrient addition ateach study site, and the dotted line indicates the location of the fish barrier. The base aerial photograph is from hhttp://maps.massgis.state.ma.us/MassGISColorOrthos/viewer.htmi; April 2001.
July 2007 S51SALTMARSH RESPONSE TO MULTIPLE STRESSORS

Fish reduction.—Reduction of mummichog (Fundulus
heteroclitus) was effective, with a decrease in abundance
of ;60% between the ambient-fish (Fish) and low-fish
(Low fish) treatments (Fig. 4; see Appendix B). The
overall mean was 65 mummichogs/30 m2 in ambient-fish
treatments compared to 25 mummichogs/30 m2 in low-
fish treatments. Mummichog was the most abundant
fish species captured (19% of total nekton abundance
and 92% of fish abundance; 41% of total nekton biomass
and 89% of fish biomass over the three years).
Mummichog abundance and biomass were near zero
in June and increased rapidly until peak abundance in
September and October. Mummichogs arrive in June to
spawn and leave the marsh shortly after October to
winter over in deeper water. Mummichog ranged in size
from 15 to 110 mm and exhibited size classes associated
with spawning and recruitment events. Our sampling
methodology was most effective on larger mummichogs,
suggesting that young-of-the-year and thus total mum-
michog abundances in all treatments may be underes-
timated. Fish abundance differed between fish
treatments (Before/After 3 Fish treatment: creek pair
1, F1,77¼ 18.3, P¼ 0.0001; creek pair 2, F1,73¼ 2.7, P¼0.10), but there was no additional effect of nutrient
addition on mummichog abundance for either creek pair
(nutrient addition: creek pair 1: F1,77 ¼ 1.3, P ¼ 0.25;
creek pair 2, F1,73¼ 0.06, P¼ 0.8). In creek pair 1 prior
to manipulations (year 0), fish abundance in the
reference creek branch randomly chosen for fish
reduction was significantly higher (seasonal mean, 133
individuals/30 m2) than the paired ambient-fish density
branch (43 individuals/30 m2, t test, P , 0.001); our
removal reduced abundance to below the paired ambient
density (low fish 17 vs. fish 46 individuals/30 m2; t test, P
, 0.05). In the nutrient-enriched creek of creek pair 2,
initial fish abundance was slightly, but not significantly,
lower in the branch designated for fish reduction (46
individuals/30 m2) compared to the ambient density
branch (90 individuals/30 m2 with high variation);
removal lowered abundance in the reduction branch
significantly below the previous density in that branch
(22 vs. 46 individuals/30 m2) and well below ambient
density in the experimental year (22 vs. 86 individuals/30
m2; t test, P , 0.05). Reduction was most effective for
the larger size individuals (.40 mm TL), as smaller fish
were not retained by the minnow traps or excluded by
the block net. Thus, the effect of removing fish made a
larger difference in reducing the total biomass compared
to the number of individuals of mummichog. The overall
seasonal average was ;30 g/30 m2 in low-fish vs.
;100g/30 m2 in ambient-fish treatment (Fig. 4).
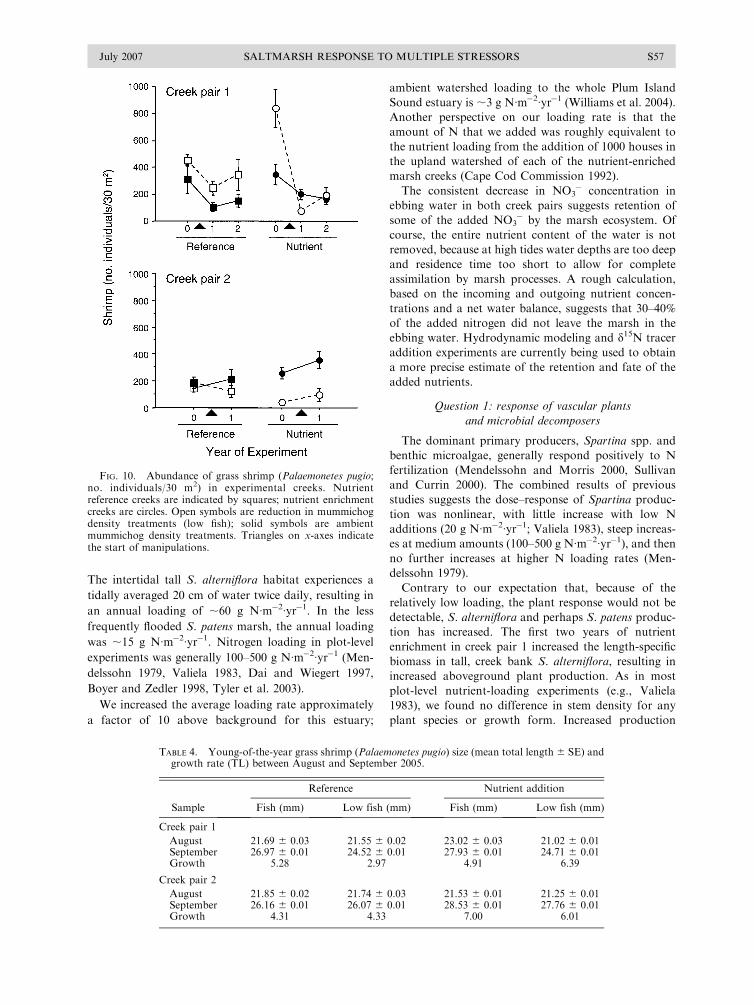
FIG. 4. Abundance (no. fish/30 m2) and biomass (g/m2) of mummichog (Fundulus heteroclitus) in experimental creeks. Nutrientreference creeks are indicated by squares; nutrient enrichment creeks are circles. Open symbols are reduction in mummichog densitytreatments (low fish); solid symbols are ambient mummichog density treatments. Along the x-axis, year 0 corresponds topremanipulation year, years 1 and 2 correspond to first and second years of manipulation, and numbers above year are months(e.g., 6 ¼ June); small triangles indicate when manipulations began.
LINDA A. DEEGAN ET AL.S52Ecological Applications
Special Issue

Ecosystem response
Vascular marsh plants.—Both S. alterniflora and S.
patens growth increased with the nutrient addition, but
stem density did not change (Fig. 5, Table 3). Nutrient
enrichment increased tall S. alterniflora stem length by
20% in year 1 and increased length-specific leaf mass
(g/cm of stem) by 25% in both years compared to the
nutrient reference creek in creek pair 1 (Fig. 5a–d).
Mean short-form S. alterniflora length-specific leaf mass
was greater in both years, but the difference was
significant only in the first year of nutrient enrichment.
S. patens length-specific leaf mass was indistinguishable
between nutrient-enriched and reference creeks in either
year of nutrient enrichment (Fig. 5c, d). In the first year
of nutrient enrichment, mean height of S. alterniflora
(tall and short) and S. patens began to diverge between
the enriched and reference creeks in July, and by mid-
August the height differences were significant. In the
second year of nutrient enrichment, by mid-August S.
patens was again significantly taller in the nutrient-
FIG. 5. Growth and percentage nitrogen content (mean 6 SE) of tall Spartina alterniflora (TSA), short-form S. alterniflora(SSA), and S. patens (SP) of creek pair 1 after one and two years of nutrient addition. (a and b) Mid-August shoot height (cm), (cand d) mid-August length-specific leaf mass (g dry mass/cm shoot length), and (e and f) nitrogen content (percentage of dry mass)of above- and belowground biomass in year 1 (SP belowground not measured). Significantly different pairs are indicated by anasterisk (t test, P , 0.05, N ¼ 125 for each creek for plant growth, and N ¼ 6 for each creek for %N).
TABLE 3. Stem density (no. stems/m2; means 6 SE) in 2005 for tall Spartina alterniflora, short Spartina alterniflora, and marshplatform Spartina patens.
Marsh plant
Creek pair 1 Creek pair 2
Reference Nutrient addition Reference Nutrient addition
Tall Spartina alterniflora 263b 6 15.9 206a 6 12.4 197a 6 8.9 173a 6 8.7Short Spartina alterniflora 1336a 6 60 1336a 6 118 1358a 6 71 1532a 6 87Spartina patens 6938b 6 2356 6263a,b 6 1246 5025a 6 1314 5575a 6 1767
Notes: Data for creek pair 1 are year-2 nutrient addition; data for creek pair 2 are year-1 nutrient addition. Different lettersindicate differences among creeks within a row (Tukey, P , 0.05). N ¼ 24 for each species for each creek.
July 2007 S53SALTMARSH RESPONSE TO MULTIPLE STRESSORS

enriched creek, however tall S. alterniflora height did not
differ between creeks and short S. alterniflora was taller
in the reference.
For both tall and short S. alterniflora, nitrogen
content in aboveground shoots was higher in plants
from the nutrient enrichment creek compared to the
reference creek, while nitrogen content of S. patens was
identical (Fig. 5e). For belowground biomass, tall S.
alterniflora in the nutrient enrichment creek had a higher
percentage N than the reference, but the short S.
alterniflora did not differ in its percentage N. Over the
growing season, nitrogen content of shoot tissue
declined by ;35% in tall S. alterniflora, 42% in short
S. alterniflora, and 55% in S. patens. Nitrogen content in
belowground roots and rhizomes was higher in the
nutrient enrichment creek for tall S. alterniflora, but
short S. alterniflora had higher N content in the
reference creek.
After two years of nutrient enrichment, we found no
differences in stem density associated with nutrient
enrichment for all plant species (Table 3). West had
higher tall S. alterniflora stem density compared to the
other three creeks, while short S. alterniflora stem
density did not differ among creeks. Sweeney and West
had higher S. patens stem densities than Clubhead and
Nelson, but only West was significantly different.
Microbial production.—The bacterial production as-
say suggests that the productivity of microbes was
enhanced by nutrient enrichment in some marsh
habitats, but was unaffected in others. In the tall S.
alterniflora zone, rates of production were significantly
higher in nutrient-enriched areas compared paired
reference areas, but bacterial production in the S. patens
zone was unaffected by nutrient enrichment (Fig. 6).
These results suggest that the microbial response to
nutrient enrichment is via some indirect mechanism that
has differing effects in each marsh habitat.
Benthic microalgae.—Several lines of evidence dem-
onstrate that benthic algae had a cumulative response to
the nutrient addition and that the response to nutrient
enrichment was greatest in the fish reduction treatment
(Figs. 7 and 8). By the end of the second year of nutrient
enrichment, under the ambient-fish treatment, benthic
microalgal biomass was 60% higher than initial baseline
and the reference creek for both tall-form S. alterniflora
(TSA) and mudflat habitats (interaction term: mudflat,
F1,25 ¼ 1.5, P , 0.09; TSA, F1,25 ¼ 2.3, P , 0.004; see
Appendix B). Nutrient enrichment had a strong positive
effect on benthic microalgal biomass in the fish
reduction treatment in the second year (Fig. 7; t test, P
, 0.05). Nutrient enrichment also altered the seasonal
pattern and supported a high benthic microalgal
biomass in mudflat and tall S. alterniflora habitats
throughout the summer, while in reference creeks and
pretreatment years microalgal biomass was lowest in
midsummer. The pattern (1998–2002) of higher benthic
microalgal biomass in tall S. alterniflora and mudflat
habitats in the reference creek of creek pair 1 was also
observed in the year immediately prior to manipulations
(year 0). In the first year of nutrient enrichment of creek
pair 1, microalgal biomass in the tall S. alterniflora
habitat increased over baseline in the nutrient-enriched
creek and was approximately equal to the mean for the
reference creek (1998–2003).
The benthic microalgal response was spatially vari-
able. Benthic microalgal biomass in S. patens habitat did
not differ among any treatment or years (F1,25¼ 1.2, P¼0.25). Creek pair 2 had no detectable change in benthic
microalgal biomass associated with any treatment in any
habitat (mudflat, F1,11¼ 0.5, P¼ 0.9; TSA, F1,11¼ 1.18,
P¼ 0.3; S. patens, F1,11¼ 0.6, P¼ 0.8; see Appendix B).
Fish reduction had no discernable effect on microalgal
biomass in the reference creeks (Fig. 7).
Microalgal numerical abundance (creek pair 1)
followed the same pattern as mudflat microalgal
biomass, with a significant increase in the nutrient-
enriched creek by the end of year 2, although no
differences were apparent among treatments in the first
year. Again, the greatest response to nutrient enrichment
was observed in the low-fish treatment (Fig. 8a).
Algal species richness increased in response to both
the nutrient enrichment and the fish reduction (Fig. 8b).
Similar to other measures of microalgal response,
species richness increased more in response to the
nutrient enrichment in the fish reduction treatment.
Species composition differed with nutrient addition,
FIG. 6. Benthic microbial production in tall Spartinaalterniflora and S. patens habitats in creek pair 1 ambient-fishtreatment after two years of nutrient enrichment. A significantdifference from the one-to-one line was found for S. alterniflora(Wilcoxon signed-rank test, Z ¼ 3.5, P , 0.01), but not for S.patens (Wilcoxon signed-rank test, Z ¼ 0.72, P . 0.10).
LINDA A. DEEGAN ET AL.S54Ecological Applications
Special Issue

with more diatom species and no cyanobacteria species
found in the nutrient-enriched creek.
Benthic invertebrates.—Infaunal annelid abundance
declined with both nutrient enrichment and fish reduc-
tion. Total abundance ranged within 10 000–40 000
individuals/m2 (Fig. 9a), with a 50% reduction in
abundance in the nutrient-enriched creek (F1,20 ¼19.13, P , 0.001), and within a nutrient treatment
slightly lower abundances in the low-fish treatment
(F1,20¼ 3.02, P¼ 0.098); effects were independent (F1,20
¼ 0.00, P ¼ 0.95). Abundance of the amphipod (U.
spartinophila) increased approximately threefold (Fig.
9b) with reduction of mummichog (t value ¼ 4.70, P ,
0.0001) in reference creeks.
Nekton community.—Daggerblade grass shrimp (Pa-
laemonetes pugio; 79% of abundance, 42% of biomass)
and mummichog were the dominant nekton species
(combined 98% of total abundance) out of 11 species.
The other species were typical of salt marshes: Crangon
septemspinosa (sand shrimp), Carcinus maenas (green
crab), Xanthidae sp. (crabs), Anguilla rostrata (Ameri-
can eel), Clupeidae sp. (herring), Menidia menidia
(Atlantic silversides), Apeltes quadracus (fourspine stick-
leback), Pungitius pungitius (ninespine stickleback), and
Syngathus fuscus (northern pipefish). These species were
not abundant or captured frequently enough to examine
the effects of the experimental treatments.
Grass shrimp responded to the nutrient addition with
increased growth, but abundance did not differ among
treatments (Fig. 10). Grass shrimp abundance increased
over the season, with peak abundance in the fall. The
mean abundance of P. pugio varied within 50–1000
individuals/30 m2 (sample range 0–1319 individuals/30
m2). Grass shrimp abundance was variable among years
and treatments and did not appear to be affected by any
treatment in either creek pair (see Appendix B).
Although we found a significant interaction term (creek
pair 1: F1,77 ¼ 2.3, 0.003) in creek pair 1, this did not
appear to be attributable to any treatment effect (Fig.
10). Creek pair 2 did not have a significant interaction
(F1,73 ¼ 0.89, P ¼ 0.6).
Growth of grass shrimp in nutrient addition creeks
was 50% higher (;6 mm/month) than growth achieved
in the reference creeks (;4 mm/month; Table 4). Shrimp
grew between August (overall mean ¼ 21 mm TL) and
September (overall mean¼ 27 mm TL), with an overall
FIG. 7. Biomass of benthic microalgae (mg chl a/m2) in mudflat, Spartina alterniflora, and S. patens habitats. Nutrient referencecreeks are indicated by squares; nutrient enrichment creeks are circles. Open symbols are reduction in mummichog densitytreatments (low fish); solid symbols are ambient mummichog density treatments. Asterisks indicate significantly different (P , 0.05)creek pairs (ANOVA, Appendix B).
July 2007 S55SALTMARSH RESPONSE TO MULTIPLE STRESSORS

effect of larger size in the nutrient-enriched marshes
(nutrient: creek pair 1, F1,3275¼ 75.25, P , 0.001; creek
pair 2, F1,1677¼ 22.01, P , 0.0001; see Appendix C); fish
reduction had a small negative effect (creek pair 1,
F1,3275¼ 43.89, P , 0.0001; creek pair 2, F1,1667¼ 5.1, P
¼ 0.023) in both reference and nutrient addition creeks.
Mummichog diet was a mixture of detritus, algae,
aquatic invertebrates (amphipods, polychaete worms,
shrimp, isopods, copepods, nematodes, and snails), and
terrestrial insects (spiders, flies, and grasshoppers), as
has been found in other saltmarshes, with an ontoge-
netic shift from largely carnivorous at small sizes to a
more omnivorous, plant-based diet at larger sizes (Smith
et al. 2000, Wainright et al. 2000, Fell et al. 2003). All
fish examined had food in their guts; gut fullness was
usually .60%. In 2006, 20% of fish .40 mm TL in the
nutrient-enriched, fish reduction treatment had algae as
the most abundant food item in their stomachs. Detritus
was ranked the most abundant item in all other fish.
DISCUSSION
Our results demonstrate ecological effects of both
nutrient addition and predator reduction at the whole-
system level, including evidence for synergistic interac-
tions. Our nutrient-loading rates were approximately 10
times less than previous dry-fertilizer plot-level experi-
ments, yet we detected responses at several trophic levels
within one to two years, suggesting that application of
nutrients via daily water flooding is critical to under-
standing the impacts of coastal N enrichment. The
results also suggest that eutrophication may have
cumulative effects that are not apparent in a single year
of nutrient enrichment and interactive effects with
species composition. Observed changes in primary
producers and decomposers suggest a long-term change
in N-processing capacity in response to chronic N-
enrichment.
Nutrient loading
Our annual N loadings were low compared to most
plot-level experiments, despite the high concentrations
we achieved in the water column. The simplest approach
to estimating the loading rate in our experiment is to
divide the total mass of N added by the area of the
marsh, resulting in a watershed mean loading of 30
g N�m�2�yr�1. This approach does not account for the
spatial gradient of nutrient delivery set up by the
differential flooding by the tide and marsh elevation.
We can estimate habitat-specific loading rates by using a
marsh-flooding model (L. Harris, J. Vallino, and C. T.
Friedrichs, unpublished data) that estimates the duration
and depth of flooding over the experimental addition
period of 150 d and measured nutrient concentrations.
FIG. 8. (a) Cell counts (mean 6 SE) and (b) species richness(no. species) of benthic algae in creek pair 1. (a) Nutrientreference creeks are indicated by squares; nutrient enrichmentcreeks are circles. Open symbols are reduction in mummichogdensity treatments (low fish); solid symbols are ambientmummichog density treatments. Triangles indicate the start ofmanipulations. (b) ‘‘F’’ indicates filamentous species, and ‘‘S’’indicates single-cell species. Data are from year 2.
FIG. 9. Abundance of (a) infauna (total annelids; no.individuals/m2) in creek pair 1 after one year of treatments(August 2004), and (b) epifaunal (no. Uhlorchestia) in ambient-fish and low-fish treatments in reference creeks (2005).
LINDA A. DEEGAN ET AL.S56Ecological Applications
Special Issue
The intertidal tall S. alterniflora habitat experiences a
tidally averaged 20 cm of water twice daily, resulting in
an annual loading of ;60 g N�m�2�yr�1. In the less
frequently flooded S. patens marsh, the annual loading
was ;15 g N�m�2�yr�1. Nitrogen loading in plot-level
experiments was generally 100–500 g N�m�2�yr�1 (Men-
delssohn 1979, Valiela 1983, Dai and Wiegert 1997,
Boyer and Zedler 1998, Tyler et al. 2003).
We increased the average loading rate approximately
a factor of 10 above background for this estuary;
ambient watershed loading to the whole Plum Island
Sound estuary is ;3 g N�m�2�yr�1 (Williams et al. 2004).
Another perspective on our loading rate is that the
amount of N that we added was roughly equivalent to
the nutrient loading from the addition of 1000 houses in
the upland watershed of each of the nutrient-enriched
marsh creeks (Cape Cod Commission 1992).
The consistent decrease in NO3� concentration in
ebbing water in both creek pairs suggests retention of
some of the added NO3� by the marsh ecosystem. Of
course, the entire nutrient content of the water is not
removed, because at high tides water depths are too deep
and residence time too short to allow for complete
assimilation by marsh processes. A rough calculation,
based on the incoming and outgoing nutrient concen-
trations and a net water balance, suggests that 30–40%
of the added nitrogen did not leave the marsh in the
ebbing water. Hydrodynamic modeling and d15N tracer
addition experiments are currently being used to obtain
a more precise estimate of the retention and fate of the
added nutrients.
Question 1: response of vascular plants
and microbial decomposers
The dominant primary producers, Spartina spp. and
benthic microalgae, generally respond positively to N
fertilization (Mendelssohn and Morris 2000, Sullivan
and Currin 2000). The combined results of previous
studies suggests the dose–response of Spartina produc-
tion was nonlinear, with little increase with low N
additions (20 g N�m�2�yr�1; Valiela 1983), steep increas-
es at medium amounts (100–500 g N�m�2�yr�1), and then
no further increases at higher N loading rates (Men-
delssohn 1979).
Contrary to our expectation that, because of the
relatively low loading, the plant response would not be
detectable, S. alterniflora and perhaps S. patens produc-
tion has increased. The first two years of nutrient
enrichment in creek pair 1 increased the length-specific
biomass in tall, creek bank S. alterniflora, resulting in
increased aboveground plant production. As in most
plot-level nutrient-loading experiments (e.g., Valiela
1983), we found no difference in stem density for any
plant species or growth form. Increased production
FIG. 10. Abundance of grass shrimp (Palaemonetes pugio;no. individuals/30 m2) in experimental creeks. Nutrientreference creeks are indicated by squares; nutrient enrichmentcreeks are circles. Open symbols are reduction in mummichogdensity treatments (low fish); solid symbols are ambientmummichog density treatments. Triangles on x-axes indicatethe start of manipulations.
TABLE 4. Young-of-the-year grass shrimp (Palaemonetes pugio) size (mean total length 6 SE) andgrowth rate (TL) between August and September 2005.
Sample
Reference Nutrient addition
Fish (mm) Low fish (mm) Fish (mm) Low fish (mm)
Creek pair 1
August 21.69 6 0.03 21.55 6 0.02 23.02 6 0.03 21.02 6 0.01September 26.97 6 0.01 24.52 6 0.01 27.93 6 0.01 24.71 6 0.01Growth 5.28 2.97 4.91 6.39
Creek pair 2
August 21.85 6 0.02 21.74 6 0.03 21.53 6 0.01 21.25 6 0.01September 26.16 6 0.01 26.07 6 0.01 28.53 6 0.01 27.76 6 0.01Growth 4.31 4.33 7.00 6.01
July 2007 S57SALTMARSH RESPONSE TO MULTIPLE STRESSORS

resulted from greater biomass per unit length of shoot or
longer shoots, or in some cases both. We observed a
response in year 1 of creek pair 1, but not in year 1 of
creek pair 2. In the first year of some studies, researchers
found little response (Valiela 1983), while others found
differences with nutrient enrichment (Tyler et al. 2003).
The higher aboveground plant nitrogen content in
nutrient-enriched plants supports the suggestion that
both growth forms of S. alterniflora responded to our
low nutrient loading. Nitrogen content was consistently
greater in both tall and short forms of S. alterniflora in
the nutrient-enriched compared to the reference creek,
as has been found in many other nutrient enrichment
studies (Tyler et al. 2003). Interestingly, despite taller
plants in both years, nitrogen content of S. patens was
identical in the two creeks. Nitrogen content in roots
and rhizomes was less clear-cut, with a tendency toward
greater nitrogen in tall S. alterniflora in the nutrient-
enriched creek compared to the reference, and no
difference in short S. alterniflora from the high marsh.
This result is similar to Boyer et al. (2000) who found
that ,2% of N added was incorporated into root tissue
and that there was only a slight trend toward increased
belowground biomass with N nutrient enrichment in a
created Spartina foliosa marsh.
Spartina spp. exhibits low uptake rates of NO3� from
overlying water (Wright et al. 1996) consistent with
Spartina obtaining its nutrients from belowground. The
probable mechanism for increased growth of S. alterni-
flora near creek edges is tidal pumping (Mendelssohn
and Morris 2000), which flushed nutrient-rich water
through the root zone at the creek edge. The ditching of
the marsh increased water inundation and nutrient
transport onto the high marsh, potentially increasing the
S. alterniflora edge effect. The response of S. patens was
probably limited by the infrequent flooding of the high
marsh with the enriched water and because the nutrients
do not penetrate deeply into the already water-saturated
soil of the high marsh during the short period of time (3–
4 h) that the marsh is flooded each tide.
Microbial production.—Nutrient enrichment was ex-
pected to stimulate bacterial activity and decomposition
throughout the ecosystem because of direct uptake of N
from the water column and availability of more high-
quality organic matter from increased algal production
(Howarth and Hobbie 1982). We expected that in
sparsely vegetated saltmarsh habitats, such as creek
bank S. alterniflora, where there is sufficient light
penetration for benthic microalgae to proliferate (Pinck-
ney and Zingmark 1993), rates of bacterial production
would increase as an indirect result of the increase in
highly labile carbon from benthic microalgae. Converse-
ly in more densely vegetated habitats, such as S. patens
high marsh, we anticipated that, because of the large
store of carbon in marsh peat, bacteria would be
PLATE 1. Early season (June 2004) sampling for benthic algae and invertebrates on the marsh platform near the head of theWest Creek of the Plum Island Sound estuary in New England, USA (David Johnson on the left and Kari Galvan on the rightstanding in tall Spartina alterniflora habitat). Intertidal creek mudflat habitat can be seen at the bottom of the photo. The expanseof the lighter grass in the background is high marsh platform S. patens habitat. Photo credit: L. Deegan.
LINDA A. DEEGAN ET AL.S58Ecological Applications
Special Issue

nitrogen limited and bacterial production would be
directly enhanced by new nitrogen inputs.
We found a microbial production increase only in the
tall S. alterniflora habitat, not in the S. patens high-
marsh habitat. If bacteria in these salt marsh sediments
were responding directly to the increased nitrogen input,
we expected to see stimulation of bacterial production in
both creek bank S. alterniflora and S. patens habitats.
The lack of a response to the nutrient addition in the S.
patens high-marsh habitat was surprising, given the large
store of carbon and the importance of microbial
decomposition in salt marshes (Howes et al. 1984,
Buchan et al. 2003). Nitrate additions in laboratory
experiments have stimulated aerobic saltmarsh detritus
decomposition (Howarth and Hobbie 1982, Morris and
Bradley 1999) and anoxic decomposition via NO3�
reduction (Zumft 1991).
Because we see microbial production stimulation only
in the nutrient-enriched creek bank S. alterniflora
habitat where benthic microalgae also increased, this
suggests that bacteria are responding primarily to
increases in high-quality organic matter from benthic
microalgae, not to increases in dissolved nitrogen.
Although saltmarsh macrophytes dominate the total
primary productivity in marsh ecosystems, stable
isotopic evidence indicates that it may not be a preferred
carbon source for marsh sediment bacteria even in the
presence of elevated inorganic nitrogen. Stable carbon
isotope ratios of bacterial specific polar lipid-derived
fatty acids from the Waarde Marsh, The Netherlands,
indicated that the dominant carbon source for marsh
sediment bacteria was algal (Boschker et al. 1999).
Similarly, in a d15N tracer addition experiment in the
Rowley River, Massachusetts, USA, the d15N value of
the bacterial-specific biomarker diaminopimelic acid
indicated that the bacteria were more closely linked to
benthic microalgae than to bulk-sediment detritus
(Tobias et al. 2003). These findings support the
hypothesis that bacterial production is indirectly stim-
ulated through increased production of benthic micro-
algae. We are examining this hypothesis through a d15Ntracer addition experiment in the nutrient-enriched and
reference marshes and with litterbag experiments.
Question 2: top-down controls
We found evidence for top-down control on benthic
microalgae and on marsh epifauna, but not on benthic
infauna. Top-down effects on benthic microalgae were
seen only under nutrient enrichment, suggesting that
killifish influence microalgae via direct effects (e.g.,
herbivory). The response of the benthic microalgae is
suggestive of a synergistic effect of nutrients and top-
down control, and perhaps a self-shading limitation
(Hillebrand 2005). Benthic algal biomass and produc-
tivity typically increased in response to N additions, but
these increases were often limited by marsh grass
shading and grazing (Pinckney and Zingmark 1993,
Sullivan and Currin 2000). The lack of response in
microalgal biomass in nutrient-enriched S. patens was
consistent with previous studies that found light-limited
benthic algal production under the dense S. patens
canopy; we found mean light under the S. patens canopy
was ,3% of ambient (S. Sheldon, unpublished data).
In the S. alterniflora habitat, where light is often not
limiting, the simplest microalgal-response model as-
sumes a linear increase in biomass with nutrient addition
and no consumer control. This model predicts that
benthic microalgae would increase from 150 (back-
ground) to 2000 mg chl a/m2 with our 15-fold increase in
nutrient enrichment, if there were no other limiting
factors. While we saw nearly a doubling of microalgal
biomass in year 2 with nutrient enrichment and fish
reduction (to 250 mg chl a/m2), the increase was clearly
not directly proportional to added nutrients. Species
composition also changed, with more diatom species
and few cyanobacteria species found in the nutrient-
enriched creek, suggesting potential increases in the
palatability of algae and loss of N fixation. Typical
values for benthic microalgal biomass in the S. alterni-
flora habitat are ;100 mg chl a/m2 (Sullivan and Currin
2000), suggesting that the initial high microalgal
biomass might have limited the scope for response
before self-shading became limiting (Hillebrand 2005).
The highest microalgal biomass measured in any salt
marsh habitat was 800 mg chl a/m2 in a cyanobacteria
mat in a high-marsh salt panne (Sullivan and Currin
2000). Our nutrient addition decreased the abundance of
cyanobacteria, thus development of a dense cyanobac-
teria mat is not likely to occur. It is doubtful that we will
ever measure 2000 mg chl a/m2 unless the algal
community changes from domination by diatoms to
filamentous algae or macroalgae.
Grazers also clearly play a role in the response of
benthic microalgae to nutrient additions (Sullivan and
Currin 2000). We found a top-down control on benthic
microalgae, but only under conditions of nutrient
addition. This is consistent with other studies that found
the largest increases in benthic microalgae in response to
increased nitrogen occurred when grazers were removed
(Sullivan and Currin 2000). Killifish is considered a
secondary consumer, with a diet of small invertebrates,
benthic algae, and detritus (Deegan et al. 2000, Currin et
al. 2003). Contrary to our expectations, benthic micro-
algae increased with mummichog reduction, suggesting
either that mummichog exert top-down control by direct
grazing, or that the trophic cascade operated in ways we
do not understand. Based on previous work, we
expected that mummichog removal would result in a
trophic cascade in which infauna increase and benthic
microalgal biomass would decrease in response to
increased infaunal grazing. Instead, our results suggest
that, under conditions of high algal productivity, killifish
may drop in trophic level from carnivore to herbivorous
grazer and become an important grazer in a nutrient-
enriched environment.
July 2007 S59SALTMARSH RESPONSE TO MULTIPLE STRESSORS

Counter-intuitively, our results show that small
infauna abundance decreased slightly with mummichog
reduction. We did not find the predicted increase in
small infauna expected if release from predation by
mummichog controlled their abundance. Our methods
of lower mummichog abundance were most effective on
fish .40 mm, and larger mummichogs probably prey
more heavily on larger epifauna (e.g., amphipods and
grass shrimp) and algae than on small infauna (Currin et
al. 2003, Fell et al. 2003), perhaps explaining the absence
of direct top-down control on infauna. An increase in
the importance of algae in the diet of large mummichogs
remaining in the fish reduction treatment supports the
potential importance of direct grazing; this idea is also
being examined by stable-isotope analysis. Additionally,
Spartina stems may inhibit foraging by F. heteroclitus
(Walters et al. 1996, Carson and Merchant 2005),
thereby precluding strong direct effects in grass habitats.
Our experimental reduction of mummichogs may
have affected an intermediate predator of infauna, the
grass shrimp, and perhaps initiated an indirect interac-
tion. P. pugio graze epiphytic algae and forage for
macroinfauna (Fleeger et al. 1999). Smaller mummi-
chogs compete with grass shrimp for infaunal food, and
larger mummichog prey on grass shrimp (Kneib and
Stiven 1982, Cross and Stiven 1999, Weis et al. 2000).
Mummichog removal was thus predicted to increase
grass shrimp growth and abundance and thereby
increase grazing pressure on microalgae and infauna.
Although we found no effect on abundance of grass
shrimp with mummichog reduction, fish reduction may
have allowed grass shrimp to modify their behavior.
Carson and Merchant (2005) found that grass shrimp
reduce swimming behavior in the absence of large
mummichogs, resulting in increased benthic contact
time that may facilitate grass shrimp feeding activities.
Thus, observed declines in infauna in areas where
mummichog abundance was experimentally reduced
could be mediated by increased grass shrimp predation.
We are currently examining infaunal responses in other
marsh habitats and quantifying species composition to
determine if responses to mummichog reduction were
habitat or species specific (Posey et al. [1999] found
species-specific responses).
An important prey species for large mummichog is the
intertidal amphipod (Uhlorchestia spartinophila), a large
epifaunal amphipod (Covi and Kneib 1995; K. Galvan,
unpublished manuscript). Amphipod abundance in S.
alterniflora habitats more than doubled with mummi-
chog reduction (Fig. 9), suggesting release from preda-
tion. U. spartinophila is widely distributed through the
vegetated intertidal marsh, unlike other talitrid amphi-
pods that are restricted to supralittoral zones (Covi and
Kneib 1995), and our results demonstrate that their
abundances may be regulated by mummichog predation.
This may have consequences for long-term gains or
losses in marsh elevation, as these amphipods are
detritivores that can accelerate the decomposition of S.
alterniflora litter by stimulating microbial activity
(Lopez et al. 1977, Bousfield and Heard 1986). These
amphipods also feed on benthic microalgae (K. A.
Galvan, unpublished data), and it is possible that they are
important grazers in this system. Additional studies are
planned to examine treatment effects on amphipod
activity patterns.
Unexpectedly, infauna responded to nutrient addition
with reduced abundance in the first year of nutrient
addition. We are currently examining annelid biomass to
determine if there was a per capita increase in biomass
with nutrient addition, as found by Posey et al. (2006).
This first year of nutrient addition did not bring about
large increases in benthic microalgae, perhaps explaining
why infauna did not respond in a bottom-up cascade.
Furthermore, the increased body size of grass shrimp in
nutrient-enriched creeks suggests they exerted increased
predation pressure on infauna. Collections from the
second year of nutrient addition are currently being
processed.
Overall, we found that top-down effects may modify
the responses of benthic microalgae to nutrient enrich-
ment, i.e., a synergistic effect on benthic microalgae
biomass occurred when nutrients were added and when
mummichog was reduced in saltmarsh creeks, but that
light limitation prevented similar responses in the high
marsh. Although nutrient addition and predator reduc-
tion effects noted to date are best expressed as
independent on benthic infauna, additional collections
across the marsh landscape are being processed. Most
tests for interactions among environmental factors are
based on small-scale exclusion (Posey et al. 1999) or
mesocosm studies (Breitburg et al. 1999); we anticipate
that our whole-ecosystem study will provide a more
realistic picture of how nutrient addition and predator
reduction interact throughout a salt marsh.
CONCLUSIONS
Human activity is changing local and global environ-
ments at unprecedented rates. Some of the most
significant changes involve global warming, sea level
rise, widespread nutrient enrichment, and species
changes. All of these affect saltmarsh ecosystems.
Understanding the responses of saltmarsh ecosystems
to stressors, as well as the mechanisms and processes
that underlie these responses, is fundamental to the
pressing regulatory and cultural decisions that many
communities now face. Our project fills a unique role in
provision of an ecosystem-scale, multiyear perspective
for management decisions, such as installation of sewage
treatment plants or regulating housing density, that will
affect coastal communities and ecosystems for genera-
tions.
The initial results and analyses presented here
demonstrate ecological effects of both nutrient addition
and fish reduction at the whole-system level. Evidence of
synergistic interactions between these stressors is also
emerging, especially at higher trophic levels. Given the
LINDA A. DEEGAN ET AL.S60Ecological Applications
Special Issue

cumulative effects we have observed, it is far too early to
make long-term predictions about the relative stimula-
tion of plant production vs. microbial decomposition.
Although we have identified some early effects of these
stressors, we know that saltmarsh ecosystems will
respond to stress over time periods much longer than
two years; some effects may be cumulative, and some,
such as plant community change, may take many years
to develop. This highlights the importance and potential
benefit of continuing the manipulations for several
additional years. Related, ongoing studies within the
project include sediment dynamics, hydrodynamics,
benthic microalgal physiological responses, phytoplank-
ton community and nutrient cycling, and isotopic tracer
studies examining food webs and biogeochemistry; these
will add substantially to our understanding of the effects
of multiple anthropogenic stressors on saltmarsh eco-
systems. Our continuing work examines response
thresholds and time lags, the mechanisms regulating
saltmarsh responses, cumulative responses over longer
periods of disturbance, and, we hope eventually,
recovery.
ACKNOWLEDGMENTS
The National Science Foundation (grant DEB 0213767,OCE 9726921, and OCE 0423565) supported this work.Additional funding was provided by a National ScienceFoundation postdoctoral fellowship in Microbial Biology(DBI-0400819) , the NOAA Coastal Intern grant(NA04NOS4780182), the Office of Environmental Educationof Louisiana, Middlebury College, and Connecticut College.Any opinions, findings, and conclusions or recommendationsexpressed in this material are those of the authors and do notnecessarily reflect the views of the funding agencies. We thankBonnie Keeler for her role in the initial design and implemen-tation of the experiment and Lora Harris for thoughtfulcomments on the manuscript. Finally, the authors thank themany interns and undergraduates for their many hours of workand contributions to this project. It would not have been as funwithout them. Note also that, after the first author, names arein alphabetical order.
LITERATURE CITED
Bormann, F., and E. Likens. 1979. Pattern and process in aforested ecosystem. Springer-Verlag, New York, New York,USA.
Boschker, H. T. S., J. F. C. de Brouwer, and T. E. Cappenberg.1999. The contribution of macrophyte-derived organicmatter to microbial biomass in salt-marsh sediments: stablecarbon isotope analysis of microbial biomarkers. Limnologyand Oceanography 44:309–319.
Bousfield, E. L., and R. W. Heard. 1986. Systematics,distributional ecology, and some host–parasite relationshipsof Uhlorchestia uhleri (Shoemaker) and U. spartinophila, newspecies (Crustacea: Amphipoda), endemic to salt marshes ofthe Atlantic coast of North America. Journal of CrustaceanBiology 6(2):264–274.
Boyer, K. E., J. C. Calloway, and J. B. Zedler. 2000. Evaluatingthe progress of restored cordgrass (Spartina foliosa) marshes:belowground biomass and tissue nitrogen. Estuaries 23:711–721.
Boyer, K., and J. Zedler. 1998. Effects of nitrogen additions onthe vertical structure of a constructed cordgrass marsh.Ecological Applications 8:692–705.
Breitburg, D. L., J. G. Sanders, C. C. Gilmour, C. A. Hatfield,R. W. Osman, G. F. Riedel, S. B. Seitzinger, and K. G.Sellner. 1999. Variability in responses to nutrients and traceelements, and transmission of stressor effects through anestuarine food web. Limnology and Oceanography 44:837–863.
Buchan, A., S. Y. Newell, M. Butler, E. J. Biers, J. T.Hollibaugh, and M. A. Moran. 2003. Dynamics of bacterialand fungal communities on decaying salt marsh grass.Applied and Environmental Microbiology 69:6676–6687.
Buesing, N., and M. O. Gessner. 2003. Incorporation ofradiolabeled leucine into protein to estimate bacterialproduction in plant litter, sediment, epiphytic biofilms, andwater samples. Microbial Ecology 45:291–301.
Cape Cod Commission. 1992. Nitrogen loading. TechnicalBulletin 91-001, Cape Cod Commission Water ResourceOffice, Barnstable, Massachusetts, USA.
Carman, K. R., J. W. Fleeger, and S. Pomarico. 1997. Responseof a benthic food web to hydrocarbon contamination.Limnology and Oceanography 42:561–571.
Carpenter, S. R., S. W. Chisholm, C. J. Krebs, D. W. Schindler,and R. F. Wright. 1995. Ecosystem experiments. Science 26:324–327.
Carson, M. L., and H. Merchant. 2005. A laboratory study ofthe behavior of two species of grass shrimp (Palaemonetespugio Holthuis and Palaemonetes vulgaris Holthuis) and thekillifish (Fundulus heteroclitus Linneaus). Journal of Exper-imental Marine Biology and Ecology 314:187–201.
Cloern, J. E. 2001. Our evolving conceptual model of thecoastal eutrophication problem. Marine Ecology ProgressSeries 210:223–253.
Covi, M. P., and R. T. Kneib. 1995. Intertidal distribution,population dynamics and production of the amphipodUhlorchestia spartinophila in a Georgia, USA, salt marsh.Marine Biology 121:447–455.
Cross, R. E., and A. E. Stiven. 1999. Size-dependentinteractions in salt marsh fish (Fundulus heteroclitus Lin-naeus) and shrimp (Palaemonetes pugio Holthuis). Journal ofExperimental Marine Biology and Ecology 242:179–199.
Currin, C. A., S. C. Wainright, K. W. Able, M. P. Weinstein,and C. M. Fuller. 2003. Determination of food web supportand trophic position of the Mummichog, Fundulus hetero-clitus, in New Jersey smooth cordgrass (Spartina alterniflora),common reed (Phragmites australis), and restored saltmarshes. Estuaries 26:495–510.
Dai, T., and R. G. Wiegert. 1997. A field study ofphotosynthetic capacity and its response to nitrogen fertil-ization in Spartina alterniflora. Estuaruarine and CoastalShelf Science 45:273–283.
D’Avanzo, C., and I. Valiela. 1990. Use of detrital foods andassimilation of nitrogen by coastal detritivores. Estuaries13(1):20–24.
Deegan, L. A., J. E. Hughes, and R. A. Rountree. 2000. Saltmarsh ecosystem support of marine transient species. Pages333–365 in M. P. Weinstein and D. A. Kreeger, editors.Concepts and controversies in tidal marsh ecology. KluwerAcademic, Dordrecht, The Netherlands.
Deegan, L. A., A. Wright, S. G. Ayvazian, J. T. Finn, H.Golden, R. Rand Merson, and J. Harrison. 2002. Nitrogenloading from upland areas alters seagrass support of highertrophic levels. Aquatic Conservation: Freshwater and MarineEcosystems 12:193–212.
Emeis, K. C., J. R. Benoit, L. Deegan, A. J. Gilbert, V. Lee,J. M. Glade, M. Meybeck, S. B. Olsen, and B. von Bodungen.2001. Unifying concepts for integrated coastal management.Pages 341–364 in B. Von Bodungen and R. K. Turner,editors. Science and integrated coastal management. DahlemUniversity Press, Berlin, Germany.
July 2007 S61SALTMARSH RESPONSE TO MULTIPLE STRESSORS

Environmental Protection Agency. 2002. Mid-Atlantic inte-grated assessment (MAIA) estuaries 1997–1998. Summaryreport. U.S. Environmental Protection Agency, Office ofResearch and Development, National Health and Environ-mental Effects Research Laboratory, Atlantic EcologyDivision, Narragansett, Rhode Island, USA.
Fell, P. E., R. S. Warren, J. K. Light, R. L. Rawson, Jr., andS. M. Fairley. 2003. Comparison of fish and microinverte-brate use of Typha angustifolia, Phragmites australis, andtreated Phragmites marshes along the lower ConnecticutRiver. Estuaries 26:534–551.
Fell, P. E., S. P. Weissbach, D. A. Jones, M. A. Fallon, J. A.Zeppieri, E. K. Faison, K. A. Lennon, K. J. Newberry, andL. K. Reddington. 1998. Does invasion of oligohaline tidalmarshes by reed grass, Phragmites australis, affect theavailability of prey resources for the mummichog, Fundulusheteroclitus? Journal of Experimental Marine Biology andEcology 222:59–77.
Fleeger, J. W., K. R. Carman, S. Webb, N. Hilbun, and M. C.Pace. 1999. Consumption of microalgae by the grass shrimp,Palaemonetes pugio. Journal of Crustacean Biology 19:324–336.
Friedrichs, C. T., and J. E. Perry. 2001. A review of tidal saltmarsh morphodynamics. Journal of Coastal Research,Special Issue 27:7–37.
Hillebrand, H. 2005. Light regime and consumer control ofautotrophic biomass. Journal of Ecology 93:758–769.
Hobbs, N. T., and R. Hilborn. 2006. Alternatives to statisticalhypothesis testing in ecology: a guide to self teaching.Ecological Applications 16:5–19.
Holm-Hansen, O., C. Lorenzen, R. Holmes, and J. Strickland.1965. Fluorometric determination of chlorophyll. Journal duConseil Permanent International Pour l’Exploration de laMer 30:3–15.
Howarth, R. W., and J. E. Hobbie. 1982. The regulation ofdecomposition and heterotrophic microbial activity in saltmarsh soils. Pages 183–207 in V. S. Kennedy, editor.Estuarine comparisons. Academic Press, New York, NewYork, USA.
Howes, B. L., J. W. H. Dacey, and G. M. King. 1984. Carbonflow through oxygen and sulfate reduction pathways in saltmarsh sediments. Limnology and Oceanography 29:1037–1051.
Hurlbert, S. H. 1984. Pseudoreplication and the design ofecological field experiments. Ecological Monographs 54:187–211.
Hyslop, E. J. 1980. Stomach contents analysis—a review ofmethods and their application. Journal of Fish Biology 17:411–429.
Kneib, R. T. 1997. The role of tidal marshes in the ecology ofestuarine nekton. Oceanography and Marine Biology: AnAnnual Review 35:163–220.
Kneib, R. T., and A. E. Stiven. 1982. Benthic invertebrateresponses to size and density manipulations of the commonmummichog, Fundulus heteroclitus, in an intertidal saltmarsh. Ecology 63:1518–1532.
Layman, C. A., and D. E. Smith. 2001. Sampling bias ofminnow traps in shallow aquatic habitats on the EasternShore of Virginia. Wetlands 21:145–154.
Levine, J., S. Brewer, and M. Bertness. 1998. Nutrients,competition and plant zonation in a New England saltmarsh. Journal of Ecology 86:285–292.
Lopez, G. R., J. S. Levington, and L. B. Slobodkin. 1977. Theeffect of grazing by the detrivore Orchestia grillus on Spartinalitter and its associated microbial community. Oecologia 30:111–127.
Lorenzen, G. L. 1967. Determination of chlorophyll and phaeo-pigments; spectrophotometric equations. Limnology andOceanography 12:343–346.
Matson, P., and M. D. Price. 1992. The relative importance oftop-down and bottom-up forces in populations and commu-nity ecology. Ecology 73:723.
Mendelssohn, I. A. 1979. The influence of nitrogen level, formand application method on the growth response of Spartinaalterniflora in North Carolina. Estuaries 2:106–112.
Mendelssohn, I. A., and J. T. Morris. 2000. Eco-physiologicalcontrols on the productivity of Spartina alterniflora Loisel.Pages 59–80 in M. P. Weinstein and D. A. Kreeger, editors.Concepts and controversies in tidal marsh ecology. KluwerAcademic, Dordrecht, The Netherlands.
Morris, J. M., and P. Bradley. 1999. Effects of nutrient loadingon the carbon balance of coastal wetland sediments.Limnology and Oceanography 44:699–702.
National Oceanic and Atmospheric Administration (NOAA).1999. National estuarine eutrophication assessment: effectsof nutrient enrichment in the nation’s estuaries. NationalOcean Service, NOAA, U.S. Department of Commerce.
National Research Council. 2000. Clean coastal waters:understanding and reducing the effects of nutrient pollution.National Academy Press, Washington, D.C., USA.
Nixon, S. W. 1995. Coastal marine eutrophication: a definition,social causes and future concerns. Ophelia 41:199–219.
Oksanen, L. 2001. Logic of experiments in ecology: ispseudoreplication a pseudoissue? Oikos 94:27–38.
Pace, M. L., J. J. Cole, S. R. Carpenter, and J. F. Kitchell. 1999.Trophic cascades revealed in diverse ecosystems. Trends inEcology and Evolution 14(12):483–488.
Parker, K. R., and J. A. Wiens. 2005. Assessing recoveryfollowing environmental accidents: environmental variation,ecological assumptions, and strategies. Ecological Applica-tions 15:2037–2051.
Parsons, T. R., Y. Maita, and C. M. Lalli. 1984. A manual ofchemical and biological methods for seawater analysis.Pergamon Press, New York, New York, USA.
Pennings, S., and M. D. Bertness. 2001. Salt marsh communi-ties. Pages 289–316 in M. D. Bertness, S. D. Gaines, and M.Hay, editors. Marine community ecology. Sinauer Associ-ates, Sunderland, Massachusetts, USA.
Pinckney, J. L., and R. G. Zingmark. 1993. Modeling theannual production of intertidal benthic microalgae inestuarine ecosystems. Journal of Phycology 29:396–407.
Polis, G. A. 1999. Why are parts of the world green? Multiplefactors control productivity and the distribution of biomass.Oikos 86:3–15.
Posey, M. H., T. D. Alphin, and L. Cahoon. 2006. Benthiccommunity responses to nutrient enrichment and predatorexclusion: influence of background nutrient concentrationsand interactive effects. Journal of Experimental MarineBiology and Ecology 30:105–118.
Posey, M. H., T. D. Alphin, L. Cahoon, D. Lindquist, andM. E. Becker. 1999. Interactive effects of nutrient additionsand predation on infaunal communities. Estuaries 22:785–792.
Posey, M. H., T. D. Alphin, L. Cahoon, D. Lindquist, M. A.Mallin, and M. B. Nevers. 2002. Top-down versus bottom-uplimitation in benthic infaunal communities: direct andindirect effects. Estuaries 25:999–1014.
Quinones-Rivera, Z. J., and J. W. Fleeger. 2005. The grazingeffects of grass shrimp, Palaemonetes pugio, on epiphyticmicroalgae associated with Spartina alterniflora. Estuaries 28:274–285.
Raposa, K. 2003. Overwintering habitat selection by themummichog, Fundulus heteroclitus, in a Cape Cod (USA)salt marsh. Wetlands Ecology and Management 11:175–182.
Rapport, D. J., and W. G. Whitford. 1999. How ecosystemsrespond to stress. Bioscience 49:193–203.
Sarda, R., K. Foreman, C. E. Werme, and I. Valiela. 1998. Theimpact of epifaunal predation on the structure of macro-
LINDA A. DEEGAN ET AL.S62Ecological Applications
Special Issue

infaunal invertebrate communities of tidal saltmarsh creeks.Estuarine and Coastal Shelf Science 46:657–669.
Schindler, D. W. 1998. Replication versus realism: the need forecosystem-scale experiments. Ecosystems323–334.
Silliman, B. R., and M. D. Bertness. 2002. A trophic cascaderegulates salt marsh primary productivity. Proceedings of theNational Academy of Sciences (USA) 99:10500–10505.
Silliman, B. R., J. van de Koppel, M. D. Bertness, L. E.Stanton, and I. A. Mendelssohn. 2005. Drought, snails, andlarge-scale die-off of southern U.S. salt marshes. Science 310:1803–1806.
Silliman, B. R., and J. C. Zeiman. 2001. Top-down control ofSpartina alterniflora production by periwinkle grazing in aVirginia salt marsh. Ecology 82:2830–2845.
Smith, K. J., G. L. Taghon, and K. W. Able. 2000. Trophiclinkages in marshes: ontogenetic changes in diet for young-of-the-year mummichog Fundulus heteroclitus. Pages 221–237in M. P. Weinstein and D. A. Kreeger, editors. Concepts andcontroversies in tidal marsh ecology. Kluwer Academic,Dordrecht, The Netherlands.
Solorzano, L. 1969. Determination of ammonium in naturalwaters by the phenolhypochlorite method. Limnology andOceanography 14:799–801.
Stewart-Oaten, A., and J. R. Bence. 2001. Temporal and spatialvariation in environmental impact assessment. EcologicalMonographs 71:305–339.
Strong, D. 1992. Are trophic cascades all wet? Differentiationand donor-control in speciose ecosystems. Ecology 73:747–755.
Sullivan, M. J., and C. A. Currin. 2000. Community structureand functional dynamics of benthic microalgae in salt-marshes. Pages 81–106 in M. P. Weinstein and D. A.Kreeger, editors. Concepts and controversies in tidal marshecology. Kluwer Academic, Dordrecht, The Netherlands.
Sweeney, J., L. Deegan, and R. Garritt. 1998. Population sizeand site fidelity of Fundulus heteroclitus in a macrotidalsaltmarsh creek. Biological Bulletin 195:238–239.
Tobias, C. R., M. Cieri, B. J. Peterson, L. A. Deegan, J.Vallino, and J. Hughes. 2003. Processing watershed-derivednitrogen in a well-flushed New England estuary. Limnologyand Oceanography 48(5):1766–1778.
Tyler, A. C., T. A. Mastronicola, and K. J. McGlathery. 2003.Nitrogen fixation and nitrogen limitation of primaryproduction along a natural marsh chronosequence. Oecolo-gia 136:431–438.
Underwood, A. 1994. On beyond BACI: sampling designs thatmight reliably detect environmental disturbances. EcologicalApplications 4:3–15.
Valiela, I. 1983. Nitrogen in salt marsh ecosystems. Pages 649–678 in E. J. Carpenter and D. G. Capone, editors. Nitrogen inthe marine environment. Academic Press, New York, NewYork, USA.
Verhoeven, J. T. A., B. Arheimer, C. Yin, and M. M. Hefting.2006. Regional and global concerns over wetlands and waterquality. Trends in Ecology and Evolution 21:96–103.
Wainright, S. C., M. P. Weinstein, K. W. Able, and C. A.Currin. 2000. Relative importance of benthic microalgae,phytoplankton and the detritus of smooth cordgrass Spartinaalterniflora and the common reed Phragmites australis tobrackish-marsh food webs. Marine Ecology Progress Series200:77–91.
Walters, K., E. Jones, and L. Etherington. 1996. Experimentalstudies of predation on metazoans inhabiting Spartinaalterniflora stems. Journal of Experimental Marine Biologyand Ecology 195:251–265.
Weis, J. S., G. Smith, and C. Santiago-Bass. 2000. Predator/prey interactions: a link between the individual level and bothhigher and lower level effects of toxicants in aquaticecosystems. Journal of Aquatic Ecosystem Stress andRecovery 7:145–153.
Williams, M., C. Hopkinson, E. Rastetter, and J. Vallino. 2004.N budgets and aquatic uptake in the Ipswich River Basin,northeastern Massachusetts. Water Resources Research 11:1–12.
Wood, E. D., F. A. J. Armstrong, and F. A. Richards. 1967.Determination of nitrate in sea water by cadmium–copperreduction to nitrite. Journal of the Marine BiologicalAssociation of the United Kingdom 47:23.
Worm, B., H. Lotze, and U. Sommers. 2000. Coastal food webstructure, carbon storage, and nitrogen retention regulatedby consumer pressure and nutrient loading. Limnology andOceanography 45:339–349.
Wright, A. L., R. W. Weaver, and J. W. Webb. 1996.Concentrations of N and P in floodwater and uptake of15N by Spartina alterniflora in oil-contaminated mesocosms.Bioresource Technology 56:257–264.
Zumft, W. G. 1991. The denitrifying bacteria. Pages 554–582 inA. Balows, M. Dworkin, H. G. Schlegel, and H. Trueper,editors. The prokaryotes. Springer-Verlag, Berlin, Germany.
APPENDIX A
Two-way ANOVA (creek, branch) on routine sampling (1998–2002) prior to manipulations (Ecological Archives A017-063-A1).
APPENDIX B
BACI-type ANOVA results for effects of treatments and interactions on benthic algae biomass, nekton abundance, and nektonbiomass (Ecological Archives A017-063-A2).
APPENDIX C
ANOVA of body size of young-of-the-year grass shrimp (Palaemonetes pugio) in 2005 (Ecological Archives A017-063-A3).
July 2007 S63SALTMARSH RESPONSE TO MULTIPLE STRESSORS