Embed Size (px)
Citation preview

Survival trends for primary liver cancer, 1995–2009: analysis ofindividual data for 578,740 patients from 187 population-basedregistries in 36 countries (CONCORD-2)Bannon, F. (2019). Survival trends for primary liver cancer, 1995–2009: analysis of individual data for 578,740patients from 187 population-based registries in 36 countries (CONCORD-2). Annals of Cancer Epidemiology,3(6), [doi: ]. https://doi.org/10.21037/ace.2019.07.01
Published in:Annals of Cancer Epidemiology
Document Version:Publisher's PDF, also known as Version of record
Queen's University Belfast - Research Portal:Link to publication record in Queen's University Belfast Research Portal
Publisher rightsCopyright 2020 the authors.This is an open access article published under a Creative Commons Attribution-NonCommercial-NoDerivs License(https://creativecommons.org/licenses/by-nc-nd/4.0/), which permits distribution and reproduction for non-commercial purposes, provided theauthor and source are cited.
General rightsCopyright for the publications made accessible via the Queen's University Belfast Research Portal is retained by the author(s) and / or othercopyright owners and it is a condition of accessing these publications that users recognise and abide by the legal requirements associatedwith these rights.
Take down policyThe Research Portal is Queen's institutional repository that provides access to Queen's research output. Every effort has been made toensure that content in the Research Portal does not infringe any person's rights, or applicable UK laws. If you discover content in theResearch Portal that you believe breaches copyright or violates any law, please contact [email protected].
Download date:04. Apr. 2022

Page 1 of 25
© Annals of Cancer Epidemiology. All rights reserved. Ann Cancer Epidemiol 2019;3:6 | http://dx.doi.org/10.21037/ace.2019.07.01
Original Article
Survival trends for primary liver cancer, 1995–2009: analysis of individual data for 578,740 patients from 187 population-based registries in 36 countries (CONCORD-2)
Finian Bannon1, Veronica Di Carlo2, Rhea Harewood2, Gerda Engholm3, Stefano Ferretti4, Christopher J. Johnson5, Joanne F. Aitken6,7,8, Rafael Marcos-Gragera9,10, Audrey Bonaventure2,11, Anna Gavin12, Dyfed Huws13, Michel P. Coleman2, Claudia Allemani2; CONCORD Working Group**
1Centre of Public Health, Queen’s University Belfast, Institute of Clinical Science, Block B, Belfast, UK; 2Cancer Survival Group, London School
of Hygiene and Tropical Medicine, London, UK; 3Danish Cancer Society, Copenhagen, Denmark; 4Registro Tumori della Romagna, Sede di
Ferrara, Ferrara University, Ferrara Local Health Authority, Ferrara, Italy; 5Cancer Data Registry of Idaho, Boise, ID, USA; 6Cancer Council
Queensland, Fortitude Valley, QLD 4006, Australia; 7School of Public Health, The University of Queensland, Herston, QLD 4006, Australia; 8Institute for Resilient Regions, University of Southern Queensland, Springfield, QLD 4300, Australia; 9Epidemiology Unit and Girona Cancer
Registry, Descriptive Epidemiology, Genetics and Cancer Prevention Group, IdlbGi, Catalan Institute of Oncology, Girona, Spain; 10Consortium
for Biomedical Research in Epidemiology and Public Health, (CIBER de Epidemiología Y Salud Pública-CIBERESP), Madrid, Spain; 11CRESS,
Université de Paris, INSERM, UMR 1153, Epidemiology of Childhood and Adolescent Cancers Team, Villejuif, France; 12Northern Ireland Cancer
Registry, Queen’s University Belfast, Belfast, UK; 13Welsh Cancer Intelligence and Surveillance Unit, Public Health Wales, Cardiff, UK
Contributions: (I) Conception and design: F Bannon, MP Coleman, C Allemani; (II) Administrative support: V Di Carlo; (III) Provision of data on
patients with cancer: All cancer registry personnel in the CONCORD Working Group**; (IV) Collection and assembly of data: C Allemani, MP
Coleman, R Harewood, A Bonaventure, G Engholm, S Ferretti, CJ Johnson, JF Aitken, R Marcos-Gragera, A Gavin, D Huws; (V) Data analysis
and interpretation: F Bannon, V Di Carlo, R Harewood, MP Coleman, C Allemani; (VI) Manuscript writing: All authors; (VII) Final approval of
manuscript: All authors.
**See list of Working Group members at the end of the article.
Correspondence to: Finian Bannon, Centre of Public Health, Queen’s University Belfast, Institute of Clinical Science, Block B, Grosvenor Road,
Belfast BT12 6BA, UK. Email: [email protected].
Background: Primary liver cancer is the fifth most common cancer world-wide, and the second most common cause of death from cancer, with an estimated 841,100 new cases and 781,500 deaths each year. Hepatocellular carcinoma (HCC) accounts for 60–80% of cases, and cholangiocarcinoma 10–40%. We examined global trends in survival for both these sub-types of liver cancer, by country, age, sex and calendar period. Methods: Data on 1,005,032 adults (aged 15–99 years) diagnosed with a primary, invasive malignant neoplasm of the liver or intrahepatic bile ducts between 1995 and 2009 were provided by 243 population-based cancer registries in 60 countries. Analysis was restricted to patients for whom the diagnosis of a primary malignancy had been confirmed by histological or cytological examination, or assignation of a specific morphology code, and to registries from which survival estimates were considered reliable. We estimated both five-year net survival and conditional five-year net survival, for patients who survived to the first anniversary of diagnosis. Funnel plots were used to examine international variation in survival and variation by age and morphology.Results: Data on 578,740 patients from 187 registries in 36 countries were included after quality control. For patients diagnosed during 2004–2009, the pooled estimate of age-standardised five-year net survival for liver cancer was 14.8% (range, 4.4–23.7%), higher than for patients diagnosed during 1995–2000 (11.0%). Survival for patients diagnosed with HCC during 2004–2009 (pooled estimate 17.4%, range 7.7–25.5%) was higher than for those with cholangiocarcinoma (8.4%, range 3.7–16.0%). Survival for patients diagnosed during 2004–2009 was higher in Canada, Italy, Japan, Taiwan and Korea (21.2–23.7%) than the pooled
Annals of Cancer Epidemiology, 2019Page 2 of 25
© Annals of Cancer Epidemiology. All rights reserved. Ann Cancer Epidemiol 2019;3:6 | http://dx.doi.org/10.21037/ace.2019.07.01
Introduction
Primary liver cancer is the fifth most common cancer world-wide, and the second most common cause of cancer death, with an estimated 841,100 new cases and 781,500 deaths each year (1). More than 70% of cases and deaths arise in males. Hepatocellular carcinoma (HCC) accounts for 60–80% of invasive malignancies of the liver (2). It is estimated that 80% of HCC cases are secondary to chronic infection with hepatitis B or C (3). Aflatoxin contamination of cereals and peanuts is estimated to cause up to 28% of cases in sub-Saharan Africa, Southeast Asia, and China (4). In high-income countries, where incidence rates are lower, important risk factors are chronic hepatitis C infection, alcohol-induced cirrhosis (5), and increasingly, liver disease linked with diabetes and obesity (6).
Most other primary malignancies of the liver are cholangiocarcinomas [10–40% of cases (2)], arising in the intrahepatic bile ducts. In South-east Asia, particularly Thailand, infestation with the liver flukes Opisthorchis viverrini and Clonorchis sinensis is an endemic risk factor (7). Risk factors in other countries include primary sclerosing cholangit is (8) , cholel ithiasis (9) and hepatit is C infection (10), but cholangiocarcinoma has also been associated with smoking (11) and obesity (12).
A large proportion of the global burden of liver cancer, therefore, is potentially preventable through reductions in exposure to risk, particularly chronic viral infection. However, over 80% of HCC occur in sub-Saharan Africa and Asia (3). Vaccination against hepatitis viruses for
primary prevention can be difficult in low- and middle-income countries with limited infrastructure (13,14), although such a programme was successfully introduced in the Gambia (15). The global burden of incidence is thus likely to remain high for the foreseeable future. Global surveillance of survival is required, both to identify international variation in outcomes (16) and to identify modifiable prognostic factors in a given country, such as health-seeking behaviour, screening, access to services, early diagnosis and treatment, and health system organization (17).
Trends in population-based survival enable the overall effectiveness of the health system in each country to be monitored. Five-year net survival from liver cancer is very low (10–20%) in both developed and developing countries (18,19). Survival for patients whose cholangiocarcinoma is localised and who receive a transplant and chemoradiation can be as high as 68% at 5 years (20), while it can be as high as 75% for those with very early HCC (21); however, only a small proportion of patients are diagnosed sufficiently early for surgery and transplantation to be viable, even in developed countries. Patients with intra- or extra-hepatic metastases fare much less well, with five-year survival typically below 10% (21).
We present international comparisons of trends in population-based net survival up to five years after diagnosis of primary cancer of the liver among adults diagnosed during 1995–2009 in 36 countries that were included in the CONCORD-2 study (19).
estimate for patients diagnosed some 10 years earlier (1995–2000; 11.0%). Conditional survival in 2004–2009 was also higher in New Zealand, Canada, Taiwan, Korea, and China (42.0–52.7%) than the pooled estimate for 1995–2000 (33.2%).Conclusions: Survival from primary cancers of the liver has increased, but it remains poor in most countries we have examined. International variation in survival highlights the potential to improve outcomes, but prevention must also remain a priority. There is a need for continued and expanded surveillance of survival, especially in low- and middle-income countries, to assess the impact of interventions in policy and treatment. Greater consistency in registration practice and coding of liver cancer would reduce the variation in data quality and further improve the comparability of survival estimates.
Keywords: Survival; trends; liver cancer; hepatocellular carcinoma (HCC); cholangiocarcinoma; cancer registry;
international
Received: 20 May 2019; Accepted: 17 June 2019; Published: 20 September 2019.
doi: 10.21037/ace.2019.07.01
View this article at: http://dx.doi.org/10.21037/ace.2019.07.01

Annals of Cancer Epidemiology, 2019 Page 3 of 25
© Annals of Cancer Epidemiology. All rights reserved. Ann Cancer Epidemiol 2019;3:6 | http://dx.doi.org/10.21037/ace.2019.07.01
Methods
Methods of data acquisition, quality control and analysis for the CONCORD-2 study, and ethical approval, have been described (19). Data were submitted by 243 population-based cancer registries in 60 countries on 1,005,032 adults (aged 15–99 years) diagnosed with their first, primary, invasive, malignant neoplasm of the liver or intrahepatic bile ducts [International Classification of Diseases for Oncology, third revision (ICD-O-3) (22), C22.0 and C22.1] between 1995 and 2009. After exclusion of 22,175 records during data quality control, 982,857 patients were eligible for inclusion in analyses.
The liver is a common site for metastatic spread from cancer in other organs, so we only included primary, invasive, malignant tumours of the liver (behaviour code /3) for which the registry provided evidence of histological or cytological confirmation of the diagnosis, or a specific morphology code (i.e., excluding ICD-O-3 8000–8005), irrespective of the basis of diagnosis. We also included patients whose cancer was diagnosed with the specific tumour marker alpha-fetoprotein (usually >200 ng/mL serum) and coded as HCC, not otherwise specified (ICD-O-3 morphology 8170), according to guidelines from the European Network of Cancer Registries (ENCR) (23). We excluded data from registries for which the liver cancer survival estimates had been flagged as less reliable in CONCORD-2 (19). We also excluded patients whose tumour was registered only from a death certificate (DCO), or solely at autopsy.
We defined two main morphological groups: HCC (ICD-O-3 8170–8175) and cholangiocarcinoma (ICD-O-3 8050, 8140–8141, 8160–8161, 8260, 8440, 8480–8500, 8570–8572) (24).
Five-year net survival was estimated with the non-parametric Pohar-Perme estimator (25) using the Stata (26) program stns (27). Net survival deploys life tables of all-cause mortality rates in the general population by age, sex and year, to correct for the effect of the wide international variations in non-cancer mortality. Life tables were constructed from death and population counts by single year of age or five-year age group, sex, race/ethnicity (where possible) and calendar year or period, for the territory of each participating registry or country (28). The classical cohort approach was used to estimate survival for patients diagnosed during 1995–2000 and 2001–2003, because at least five years of follow-up for vital status were available for all these patients by 31 December 2009. We estimated
survival for patients diagnosed during 2004–2009 with the complete approach (29), because not all patients had been followed up for five years. We also estimated five-year survival conditional on survival to the end of the first year after diagnosis, as a surrogate for survival in patients with local or regional disease, since patients with advanced disease are unlikely to survive more than one year. The calendar periods were chosen to match the availability of data on stage from 2001, and changes in the data collection processes for coding SEER Summary Stage 2000 from 2004 (30).
We estimated net survival for each of five age groups, and used the International Cancer Survival Standard (ICSS) weights (15–44 years, 0.07; 45–54 years, 0.12; 55–64 years, 0.23; 65–74 years, 0.29; 75–99 years, 0.29) to produce age-standardised survival estimates for all ages combined (31). Age-specific survival was only estimated if data for at least 50 patients were available for analysis, and at least 10 deaths had been observed. If a survival estimate could not be obtained for a particular age group, the data for two adjacent groups were combined, and the analysis repeated. The pooled estimate was then used for both age groups in age-standardization.
Funnel plots (32) were adopted for graphical presentation, in preference to the conventional ranked bar charts, in order to identify countries with unexpectedly high or low survival, given the precision of the estimate. A random effects model (33), fitted by restricted maximum likelihood estimation, adjusted for the precision of each estimate, was used to estimate the mean and variance of the distribution of five-year survival estimates for all countries included in each analysis. The analysis was performed on the complementary log-log scale (34), with 5% ‘winsorisation’ (32) to reduce inflation of the variance. We use this pooled estimate as the target in the funnel plot, for purely descriptive purposes. The standard error of each estimate and the standard deviation between countries, derived from the random effects model, were used to construct the control limits of the funnel plot; estimates outside the 95.0% or 99.8% control limits are at least 1.96 and 3.09 standard deviations from the target, respectively (34).
Since none of the age-standardised survival estimates for 2004–2009 exceeded the upper 95% control limit in the funnel plot, we changed the ‘target’ or benchmark, to the pooled survival estimate for patients diagnosed during 1995–2000. This was done in order to help identify countries or registries in which the age-standardised 5-year net survival for patients diagnosed during 2004–2009 was

Annals of Cancer Epidemiology, 2019Page 4 of 25
© Annals of Cancer Epidemiology. All rights reserved. Ann Cancer Epidemiol 2019;3:6 | http://dx.doi.org/10.21037/ace.2019.07.01
higher than for patients diagnosed 10 years earlier. A similar approach was used to identify age-specific survival estimates for 2004–2009 that were higher than the corresponding pooled estimate for patients diagnosed during 1995–2000.
Results
Patients
Of the 982,857 patients el igible for inclusion in CONCORD-2, we excluded 166,557 (16.9%) patients from 56 registries in 24 countries for which the survival estimates were considered less reliable (19), or for which fewer than 50 patients were available for analysis in each calendar period, leaving 816,300 patients (Figure 1). We excluded a further 41,650 patients (4.2% of those eligible) whose tumour was registered from a death certificate only, or at post-mortem, or for other reasons (Table 1), and 195,910 patients (19.9% of those eligible) with no evidence of microscopic verification or a specific morphology code, including a code derived from the alpha-fetoprotein level (23). We included 578,740 patients (58.9% of eligible patients) from 187 registries in 36 countries in survival analyses. Age-standardised estimates of five-year net survival were
available for 28 of the 36 countries (Table 2).
Data quality
The proportion of tumours registered as a DCO or without microscopic verification varied widely (Table 1). DCO registrations exceeded 10% in 12 of the 36 countries. In China, Indonesia, Mongolia, Thailand and Poland, more than 50% of patients were excluded for lack of microscopic verification or a specific morphology code (not shown). In Thailand, Denmark, Poland and Sweden, 20% or more of cholangiocarcinomas were coded as arising in the liver (C22.0), rather than the intrahepatic bile ducts, while in Malaysia, 14% of HCC were coded as arising in the intrahepatic bile ducts (C22.1; Table S1).
The number of patients with data on stage at diagnosis was too small to enable international comparison of age-standardised net survival by stage.
Age, sex and histological group
Patients in low- and middle-income countries were generally younger than in European countries and Japan
1,005,032 patients submitted
982,857 patients eligible
(243 registries, 60 countries)
816,300
(187 registries, 36 countries)
774,650
(187 registries, 36 countries)
578,740 included in analyses
(187 registries, 36 countries)
22,175 patients ineligible because of incomplete data;
benign, in situ or uncertain behaviour, or metastatic from
another primary site; Kaposi sarcoma or haematopoietic
morphology, or age at diagnosis below 15 or above 99 years.
166,557 patients (16.9% of those eligible)
excluded from 56 registries (24 countries): survival estimates
less reliable, or fewer than 50 patients in a calendar period.
195,910 patients (19.9% of those eligible) without evidence
of histological or cytological confirmation or a specific
morphology code.
41,650 patients (4.2% of those eligible) diagnosed from a
death certificate only, or tumour detected solely at autopsy.
Figure 1 Patients diagnosed with liver cancer during 1995–2009: number submitted and excluded, and the final number included in the analyses.

Annals of Cancer Epidemiology, 2019 Page 5 of 25
© Annals of Cancer Epidemiology. All rights reserved. Ann Cancer Epidemiol 2019;3:6 | http://dx.doi.org/10.21037/ace.2019.07.01
Tab
le 1
Dat
a qu
ality
indi
cato
rs (%
) and
num
ber
of p
atie
nts
incl
uded
in a
naly
sis:
adu
lts (1
5–99
yea
rs) d
iagn
osed
with
pri
mar
y liv
er c
ance
r du
ring
199
5–20
09
Reg
ion
Elig
ible
pa
tient
s
Exc
lusi
ons
(%)†
Aft
er
excl
usio
ns
Dat
a qu
ality
indi
cato
rs (%
)††P
atie
nts
incl
uded
in a
naly
sis††
†
DC
O
or P
MO
ther
MV
Non
–spe
cific
m
orph
olog
yLo
st to
fo
llow
-up
Cen
sore
dA
ll pe
riods
(1
995–
2009
)19
95–2
000
2001
–200
320
04–2
009
Am
eric
a (C
entr
al a
nd S
outh
)
Col
ombi
a (C
ali)
750
12.0
1.3
650
67.7
31.5
0.0
5.1
458
126
92
240
Am
eric
a (N
orth
)
Can
ada*
22,4
79
4.7
1.3
21,1
24
53.1
0.0
0.0
0.0
11,9
02
3,77
42,
247
5,88
1
US
regi
strie
s19
7,77
2 5.
93.
018
0,21
8 74
.60.
00.
0<
0.1
140,
046
41,0
2627
,208
71
,812
Asi
a
Chi
nese
regi
strie
s33
,387
2.
7<
0.1
32,4
82
25.6
71.2
1.4
<0.
110
,569
71
0 1,
715
8,14
4
Indo
nesi
a (J
akar
ta)
305
1.3
0.0
301
21.6
71.8
0.0
0.0
85
85
Japa
nese
regi
strie
s27
,759
20.5
0.2
22,0
25
31.9
10.2
0.0
1.2
19,8
82
2,18
6 1,
401
16,2
95
Kor
ea*
184,
632
<0.
10.
518
3,65
9 28
.113
.30.
00.
016
0,12
5 44
,510
34
,081
81
,534
Mal
aysi
a (P
enan
g)98
610
.30.
787
7 65
.39.
00.
00.
081
4 21
4 1
26
474
Mon
golia
*6,
701
0.0
5.1
6,35
8 6.
6<
0.1
15.5
0.0
422
422
Taiw
an*
133,
641
0.0
0.2
133,
440
41.9
25.7
0.0
0.0
99,3
83
14,9
45
21,4
82
62,9
56
Thai
regi
strie
s15
,590
6.3
0.1
14,6
00
11.0
84.0
0.0
18.3
1,61
4 34
1 41
4 85
9
Turk
ey (I
zmir)
1,39
96.
21.
61,
290
57.1
0.8
0.0
21.2
736
183
147
406
Eur
ope
Aus
tria
*10
,088
0.3
6.8
9,36
8 88
.63.
70.
00.
09,
184
3,19
8 2,
053
3,93
3
Bel
gium
*3,
079
<0.
10.
83,
050
87.3
3.6
1.4
0.0
2,95
8 2,
958
Den
mar
k*4,
069
0.8
0.0
4,03
5 84
.620
.8<
0.1
0.0
3,51
9 1,
288
734
1,49
7
Est
onia
*1,
016
13.7
<0.
187
6 69
.57.
50.
00.
060
9 27
4 12
1 21
4
Finl
and*
4,81
714
.2<
0.1
4,12
9 80
.626
.7<
0.1
0.0
3,43
4 1,
122
611
1,70
1
Fren
ch re
gist
ries
9,02
5<
0.1
0.3
8,99
6 59
.716
.90.
90.
66,
500
3,11
8 1,
970
1,41
2
Ger
man
regi
strie
s8,
151
10.9
1.7
7,11
9 71
.81.
60.
30.
07,
034
1,42
3 1,
185
4,42
6
Irela
nd*
1,71
65.
43.
41,
564
51.5
3.8
0.0
0.0
811
195
143
47
3
Italia
n re
gist
ries
45,5
425.
41.
242
,614
43
.542
.80.
60.
224
,401
9,
245
6,09
0 9,
066
Mal
ta*
82
13.4
6.1
66
100.
025
.80.
00.
066
6
6
Tab
le 1
(con
tinue
d)

Annals of Cancer Epidemiology, 2019Page 6 of 25
© Annals of Cancer Epidemiology. All rights reserved. Ann Cancer Epidemiol 2019;3:6 | http://dx.doi.org/10.21037/ace.2019.07.01
Tab
le 1
(con
tinue
d)
Reg
ion
Elig
ible
pa
tient
s
Exc
lusi
ons
(%)†
Aft
er
excl
usio
ns
Dat
a qu
ality
indi
cato
rs (%
)††P
atie
nts
incl
uded
in a
naly
sis††
†
DC
O
or P
MO
ther
MV
Non
–spe
cific
m
orph
olog
yLo
st to
fo
llow
-up
Cen
sore
dA
ll pe
riods
(1
995–
2009
)19
95–2
000
2001
–200
320
04–2
009
Net
herla
nds*
4,94
02.
90.
74,
764
74.1
25.8
0.5
0.0
3,55
7 1,
215
711
1,
631
Nor
way
*1,
851
3.3
0.0
1,78
9 81
.612
.90.
10.
01,
583
546
322
71
5
Pol
ish
regi
strie
s14
,673
12.1
0.4
12,8
33
43.2
1.3
0.2
0.0
5,55
3 71
3 1,
368
3,47
2
Por
tuga
l*3,
768
0.7
2.5
3,64
7 85
.611
.4<
0.1
0.3
3,28
5 54
2 8
91
1,85
2
Rom
ania
(Clu
j)36
255
.20.
316
1 82
.00.
60.
00.
014
2 14
2
Rus
sia
(Ark
hang
elsk
)24
511
.44.
121
0 56
.24.
31.
00.
011
9 5
1 68
Slo
vaki
a*16
517
.60.
013
6 91
.98.
80.
00.
012
5 12
5
Slo
veni
a*1,
868
11.2
0.1
1,65
8 63
.835
.1<
0.1
0.0
1,08
6 38
8 22
8 47
0
Spa
nish
regi
strie
s13
,157
7.2
0.8
12,1
05
47.4
22.7
0.2
<0.
17,
811
2,86
4 1,
765
3,18
2
Sw
eden
*7,
543
0.0
0.0
7,54
3 92
.910
.80.
20.
07,
044
2,96
1 1,
419
2,66
4
Sw
iss
regi
strie
s4,
360
4.9
1.7
4,07
2 59
.816
.00.
80.
93,
095
1,02
0 65
8 1,
417
Uni
ted
Kin
gdom
*36
,779
7.
1<
0.1
34,1
52
46.0
5.7
<0.
1<
0.1
29,9
12
8,75
1 5,
843
15,3
18
Oce
ania
Aus
tral
ian
regi
strie
s11
,150
4.
01.
110
,583
56
.516
.70.
01.
08,
845
2,80
4 2,
002
4,03
9
New
Zea
land
*2,
453
11.9
0.2
2,15
6 60
.16.
40.
00.
02,
031
521
393
1,11
7
Tota
l 8
16,3
00
––
774,
650
––
––
578,
740
150,
328
117,
471
310,
941
*, d
ata
with
100
% c
over
age
of t
he n
atio
nal p
opul
atio
n; † ,
DC
O:
patie
nts
regi
ster
ed f
rom
a d
eath
cer
tific
ate
only
(D
CO
), or
who
se t
umou
r w
as d
etec
ted
sole
ly a
t au
tops
y.
Oth
er:
vita
l st
atus
or
sex
unkn
own;
inv
alid
seq
uenc
e of
dat
es;
inco
nsis
tenc
y of
sex
-site
, si
te-m
orp
holo
gy,
age-
site
, ag
e-m
orp
holo
gy,
or a
ge-s
ite-m
orp
holo
gy.
††,
MV:
m
icro
scop
ical
ly v
erifi
ed. N
on-s
peci
fic m
orph
olog
y: IC
D–O
–3 m
orph
olog
y co
de in
the
ran
ge 8
000–
8005
. Cen
sore
d: fo
r pa
tient
s di
agno
sed
durin
g 19
95–2
004,
aliv
e w
ith le
ss
than
five
yea
rs o
f fol
low
-up.
††† , p
atie
nts
with
mic
rosc
opic
ver
ifica
tion
as th
e ba
sis
of d
iagn
osis
, or
with
a s
peci
fic m
orph
olog
y co
de (s
ee ‘M
etho
ds’).

Annals of Cancer Epidemiology, 2019 Page 7 of 25
© Annals of Cancer Epidemiology. All rights reserved. Ann Cancer Epidemiol 2019;3:6 | http://dx.doi.org/10.21037/ace.2019.07.01
Tab
le 2
Num
ber
of p
atie
nts
incl
uded
in a
naly
sis,
five
-yea
r ne
t sur
viva
l (N
S, %
) and
95%
con
fiden
ce in
terv
al (9
5% C
I), p
atie
nts
diag
nose
d w
ith p
rim
ary
liver
can
cer† , 1
995–
2009
, in
36 c
ount
ries
Reg
ion
1995
–200
020
01–2
003
2004
–200
9
No.
Age
-sta
ndar
dize
dU
nsta
ndar
dize
dN
o.A
ge-s
tand
ardi
zed
Uns
tand
ardi
zed
No.
Age
-sta
ndar
dize
dU
nsta
ndar
dize
d
NS
(%)
95%
CI
NS
(%)
95%
CI
NS
(%)
95%
CI
NS
(%)
95%
CI
NS
(%)
95%
CI
NS
(%)
95%
CI
Am
eric
a (C
entr
al a
nd S
outh
)
Col
ombi
a (C
ali)
126
3.9
0.0–
7.9
927.
41.
2–13
.724
03.
40.
0–7.
2
Am
eric
a (N
orth
)
Can
ada*
3,77
414
.112
.9–1
5.2
14.6
13.3
–15.
82,
247
18.8
17.1
–20.
519
.217
.5–2
1.0
5,88
121
.319
.6–2
3.1
22.3
20.5
–24.
1
US
regi
strie
s41
,026
9.6
9.2–
9.9
9.6
9.3–
9.9
27,2
0813
.513
.0–1
3.9
14.0
13.5
–14.
471
,812
16.3
15.9
–16.
817
.016
.5–1
7.5
Asi
a
Chi
nese
regi
strie
s71
02.
71.
6–3.
83.
62.
1–5.
01,
715
20.4
17.6
–23.
219
.817
.7–2
1.8
8,14
419
.518
.0–2
1.0
20.1
18.9
–21.
4
Indo
nesi
a (J
akar
ta)
851.
90.
0–5.
8
Japa
nese
regi
strie
s2,
186
27.9
25.9
–29.
828
.626
.5–3
0.7
1,40
126
.424
.0–2
8.8
25.5
23.0
–28.
016
,295
23.7
22.6
–24.
723
.022
.1–2
3.9
Kor
ea*
44,5
1012
.311
.9–1
2.8
14.5
14.1
–14.
834
,081
16.4
15.8
–16.
919
.419
.0–1
9.9
81,5
3421
.220
.6–2
1.7
24.4
24.0
–24.
9
Mal
aysi
a (P
enan
g)21
410
.86.
4–15
.312
613
.27.
0–19
.347
415
.110
.6–1
9.7
16.1
11.5
–20.
7
Mon
golia
*42
28.
53.
1–13
.911
.32.
0–20
.7
Taiw
an*
14,9
4526
.625
.7–2
7.6
27.4
26.7
–28.
221
,482
21.1
20.5
–21.
822
.622
.0–2
3.2
62,9
5622
.722
.1–2
3.2
23.9
23.3
–24.
4
Thai
regi
strie
s34
119
.613
.4–2
5.8
18.5
12.1
–24.
841
45.
23.
1–7.
36.
93.
7–10
.085
94.
42.
3–6.
55.
73.
2–8.
1
Turk
ey (I
zmir)
183
19.1
9.9–
28.4
147
27.8
18.6
–37.
040
621
.515
.7–2
7.2
Eur
ope
Aus
tria
*3,
198
8.5
7.4–
9.6
7.6
6.6–
8.6
2,05
312
.010
.4–1
3.6
11.3
9.8–
12.8
3,93
312
.811
.2–1
4.4
11.9
10.4
–13.
4
Bel
gium
*2,
958
20.5
17.8
–23.
120
.317
.6–2
3.1
Den
mar
k*1,
288
2.7
1.8–
3.5
2.5
1.6–
3.4
734
3.8
2.5–
5.1
3.6
2.2–
5.1
1,49
76.
74.
8–8.
66.
23.
9–8.
4
Est
onia
*27
45.
02.
2–7.
812
18.
43.
2–13
.621
47.
52.
8–12
.1
Finl
and*
1,12
27.
76.
0–9.
57.
55.
6–9.
361
17.
24.
9–9.
41,
701
8.4
6.2–
10.6
7.8
5.5–
10.1
Fren
ch re
gist
ries
3,11
812
.911
.5–1
4.2
12.2
10. 9
–13.
51,
970
14.9
13.1
–16.
614
.312
.6–1
6.0
1,41
218
.616
.2–2
1.0
18.4
15.9
–21.
0
Ger
man
regi
strie
s1,
423
7.4
6.0–
8.8
6.6
5.2–
8.1
1,18
58.
56.
9–10
.18.
26.
4–9.
94,
426
14.7
12.9
–16.
513
.511
.8–1
5.2
Irela
nd*
195
9.0
4.7–
13.3
143
17.9
11.1
–24.
747
317
.012
.9–2
1.1
16.1
11.0
–21.
2
Italia
n re
gist
ries
9,24
515
.114
.2–1
5.9
14.5
13.7
–15.
36,
090
19.3
18.1
–20.
518
.217
.1–1
9.3
9,06
621
.720
.4–2
3.0
19.9
18.6
–21.
1
Tab
le 2
(con
tinue
d)

Annals of Cancer Epidemiology, 2019Page 8 of 25
© Annals of Cancer Epidemiology. All rights reserved. Ann Cancer Epidemiol 2019;3:6 | http://dx.doi.org/10.21037/ace.2019.07.01
Tab
le 2
(con
tinue
d)
Reg
ion
1995
–200
020
01–2
003
2004
–200
9
No.
Age
-sta
ndar
dize
dU
nsta
ndar
dize
dN
o.A
ge-s
tand
ardi
zed
Uns
tand
ardi
zed
No.
Age
-sta
ndar
dize
dU
nsta
ndar
dize
d
NS
(%)
95%
CI
NS
(%)
95%
CI
NS
(%)
95%
CI
NS
(%)
95%
CI
NS
(%)
95%
CI
NS
(%)
95%
CI
Mal
ta*
662.
20.
0–5.
6
Net
herla
nds*
1,21
58.
36.
7–10
.08.
36.
6–10
.071
111
.89.
5–14
.112
.39.
7–14
.91,
631
12.0
9.5–
14.4
12.1
9.4–
14.9
Nor
way
*54
66.
14.
2–8.
15.
23.
2–7.
232
27.
24.
6–9.
86.
73.
9–9.
671
511
.07.
9–14
.110
.36.
9–13
.6
Pol
ish
regi
strie
s71
38.
35.
7–10
.98.
15.
9–10
.41,
368
10.3
8.4–
12.1
10.2
8.5–
12.0
3,47
29.
37.
6–11
.09.
68.
0–11
.3
Por
tuga
l*54
210
.47.
9–12
.910
.17.
4–12
.889
113
.010
.6–1
5.4
13.3
10.8
–15.
71,
852
16.3
13.8
–18.
815
.813
.4–1
8.2
Rom
ania
(Clu
j)14
22.
40.
0–5.
8
Rus
sia
(Ark
hang
elsk
)51
2.2
0.0–
5.5
688.
30.
9–15
.6
Slo
vaki
a*12
56.
62.
0–11
.1
Slo
veni
a*38
83.
32.
0–4.
73.
71.
7–5.
622
85.
62.
5–8.
847
06.
03.
3–8.
74.
80.
5–9.
1
Spa
nish
regi
strie
s2,
864
12.5
11.1
–13.
811
.810
.5–1
3.1
1,76
515
.613
.8–1
7.5
14.6
12.8
–16.
43,
182
18.0
16.1
–20.
017
.415
.4–1
9.4
Sw
eden
*2,
961
5.6
4.6–
6.6
4.4
3.6–
5.2
1,41
95.
84.
6–7.
15.
13.
8–6.
42,
664
12.9
11.0
–14.
710
.89.
0–12
.6
Sw
iss
regi
strie
s1,
020
10.5
8.7–
12.3
9.8
7.8–
11.8
658
13.7
11.1
–16.
412
.910
.1–1
5.7
1,41
715
.212
.5–1
7.9
14.8
11.9
–17.
7
Uni
ted
Kin
gdom
*8,
751
6.4
5.8–
7.0
5.4
4.9–
5.9
5,84
38.
37.
5–9.
27.
06.
3–7.
715
,318
9.3
8.4–
10.1
7.8
7.0–
8.5
Oce
ania
Aus
tral
ian
regi
strie
s2,
804
14.2
12.8
–15.
513
.912
.6–1
5.3
2,00
214
.112
.5–1
5.7
13.8
12.2
–15.
54,
039
13.9
12.1
–15.
713
.711
.9–1
5.6
New
Zea
land
*52
112
.29.
2–15
.113
.510
.3–1
6.7
393
12.4
9.5–
15.4
14.5
10.8
–18.
21,
117
16.5
13.2
–19.
917
.013
.5–2
0.5
Com
bine
d es
timat
e††15
0,32
811
.08.
4–13
.510
.48.
1–12
.711
7,47
113
.310
.9–1
5.7
12.6
10.4
–14.
931
0,94
114
.812
.8–1
6.8
13.2
11.0
–15.
5
*, d
ata
with
100
% c
over
age
of th
e na
tiona
l pop
ulat
ion;
†, m
icro
scop
ical
ly v
erifi
ed (s
ee te
xt);
††, e
stim
ated
with
a r
ando
m e
ffect
s m
odel
(see
text
).

Annals of Cancer Epidemiology, 2019 Page 9 of 25
© Annals of Cancer Epidemiology. All rights reserved. Ann Cancer Epidemiol 2019;3:6 | http://dx.doi.org/10.21037/ace.2019.07.01
(Figure 2A). Most patients diagnosed during 2004–2009 were male (median proportion 69.4%, Figure 2B). HCC was more common than cholangiocarcinoma (median 70.4% and 19.4%, respectively; Figure 2C). HCC represented 84.0–89.7% of liver cancers in Taiwan, Japan, and Korea, while cholangiocarcinoma represented 67.4% of liver cancers in Thailand and 43.9% in the UK (Table S1).
Five-year net survival of patients diagnosed in 2004–2009
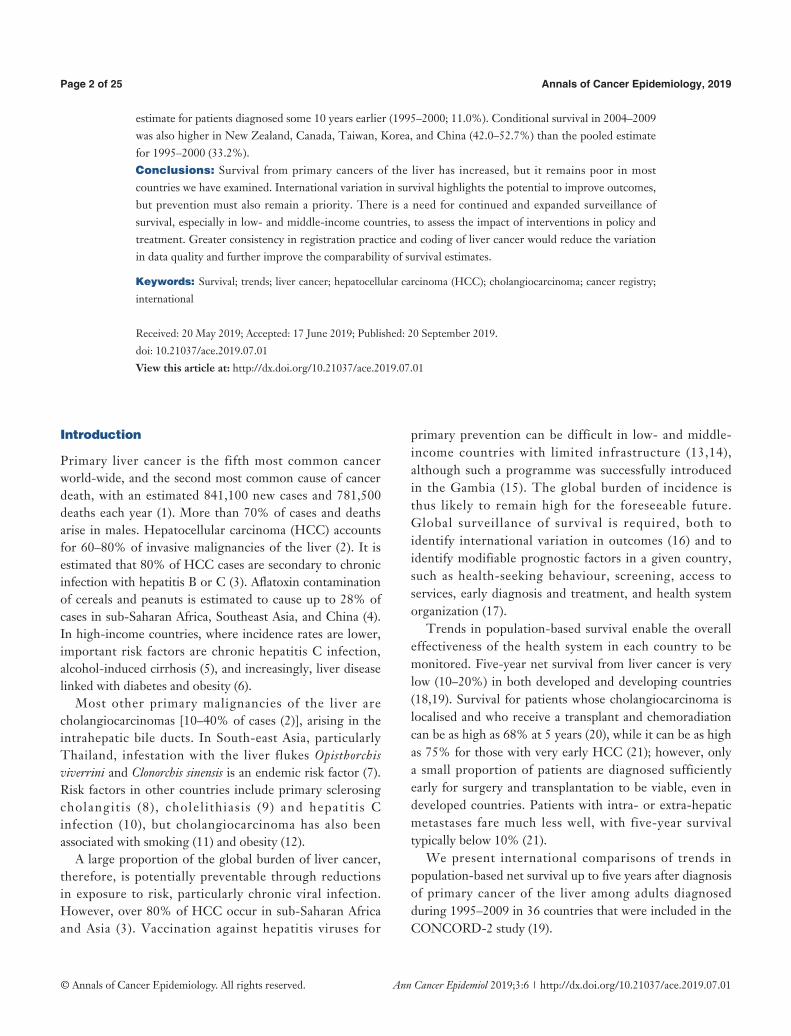
For all liver cancers combined, the pooled estimate of age-standardised five-year net survival in 28 countries for patients diagnosed during 2004–2009 was 14.8% (range 4.4–23.7%; Table 2). Survival was much lower than the pooled estimate for the same period in Denmark (6.7%), Slovenia (6.0%), and Thailand (4.4%; Figure 3A). None of the estimates exceeded the upper limit of the funnel plot.
Five-year survival for patients diagnosed during 2004–2009 in Canada, Italy, Japan, Taiwan, and Korea (21.2–23.7%) was higher than the upper 95% control limit around the 1995–2000 benchmark (11.0%) (Figure 3B).
Age-standardised five-year conditional survival for
patients diagnosed during 2004–2009 who had survived for at least one year varied from 24.4% to 52.7% (Table 3). In New Zealand, China, Canada, Taiwan and Korea, conditional survival for 2004–2009 (42.0–52.7%) was above the upper 95% control limit around the 1995–2000 benchmark (33.2%; Figure 3C).
Hepatocellular carcinoma
The pooled estimate of age-standardised five-year net survival for patients diagnosed during 2004–2009 was 17.4% (range 7.7–25.5%; Table 3). Survival in Slovenia (7.7%) and Denmark was lower than the pooled estimate (8.1%; Figure 4A). None of the estimates exceeded the upper 95% control limit of the funnel plot.
Five-year survival for patients diagnosed during 2004–2009 was higher than the upper 95% control limit for 1995–2000 in Canada, Italy, Japan, Taiwan and Korea (24.0–25.5%; Figure 4B), suggesting progress from the levels ten years earlier.
Conditional survival for patients diagnosed during 2004–2009 was higher than the 95% control limits for 1995–2000
Figure 2 Distribution (%) of liver cancers diagnosed during 2004–2009 by (A) age, (B) sex and (C) morphology. Numbers of patients in parentheses. Only microscopically verified tumours (see ‘Methods’). For definition of morphology groups, see text.
15-44
45-54
55-64 65-74 75-99
Men Women Hepatocellular
carcinoma Cholangiocarcinoma Other
A B C
Annals of Cancer Epidemiology, 2019Page 10 of 25
© Annals of Cancer Epidemiology. All rights reserved. Ann Cancer Epidemiol 2019;3:6 | http://dx.doi.org/10.21037/ace.2019.07.01
Figure 3 Age-standardised 5-year net survival for liver cancer patients diagnosed during 2004–2009: (A) the target value is the pooled estimate for the same period; (B) the target value is the pooled estimate for 1995–2000, 10 years earlier; (C) 5-year survival, conditional on survival to the end of the first year after diagnosis, for patients diagnosed during 2004–2009 with the pooled estimate for 1995–2000, 10 years earlier, as the target value. Hollow circles represent unstandardized survival estimates (Table 2). Only age-standardised estimates contributed to the construction of the funnel plot. UN country codes: AUS, Australian registries; AUT, Austria; BEL, Belgium; CAN, Canada; CHN, Chinese registries; COL, Colombian registries; DNK, Denmark; EST, Estonia; FIN, Finland; FRA, French registries; DEU, German registries; IDN, Indonesia (Jakarta); IRL, Ireland; ITA, Italian registries; JPN, Japanese registries; KOR, Korea; MYS, Malaysia (Penang); MLT, Malta; MNG, Mongolia; NLD, Netherlands; NZL, New Zealand; NOR, Norway; POL, Polish registries; PRT, Portugal; ROU, Romania (Cluj); RUS, Russia (Arkhangelsk); SVK, Slovakia; SVN, Slovenia; ESP, Spanish registries; SWE, Sweden; CHE, Swiss registries; TWN, Taiwan; THA, Thai registries; TUR, Turkey (Izmir); GBR, United Kingdom; USA, US registries.
in China, Sweden, Belgium, Canada, Korea and Taiwan (42.8–51.9%; Figure 4C), also suggesting progress in these countries.
Five-year net survival is generally lower in older patients. The pooled estimates of five-year net survival for patients diagnosed during 2004–2009 aged 15–44, 45–54, 55–64, 65–74 and 75–99 years were 30.6%, 24.6%, 21.4%, 15.8% and 10.2%, respectively (Table 4).
There is some evidence that age-standardised five-year survival tends to be slightly higher for women (21.8%) than men (17.5%; Table 5).
In every country except Poland, five-year net survival for younger patients (15–44 years) diagnosed during 2004–2009 was higher than the pooled estimate for patients diagnosed in that age group some 10 years earlier, 1995–2000 (20.2%; Figure 5A). In Korea, Taiwan and Italy, this increase was
40
30
20
10
0
70
60
50
40
30
20
10
0
40
30
20
10
0
Net
sur
viva
l (%
)N
et s
urvi
val (
%)
Net
sur
viva
l (%
)
2 4 6 8 10
2 4 6 8
2 4 6 8 10Log of precision (1/transformed sampling variance)
Log of precision (1/transformed sampling variance)
Log of precision (1/transformed sampling variance)
A
C
B
Target value 95.0% control limit (CL) 99.8% CL

Annals of Cancer Epidemiology, 2019 Page 11 of 25
© Annals of Cancer Epidemiology. All rights reserved. Ann Cancer Epidemiol 2019;3:6 | http://dx.doi.org/10.21037/ace.2019.07.01
Tab
le 3
Age
-sta
ndar
dise
d fiv
e-ye
ar n
et s
urvi
val (
NS,
%)
and
cond
ition
al s
urvi
val† , w
ith 9
5% c
onfid
ence
inte
rval
s (9
5% C
I), p
atie
nts
diag
nose
d w
ith h
epat
ocel
lula
r ca
rcin
oma
or
chol
angi
ocar
cino
ma††
dur
ing
2004
–200
9, in
28
coun
trie
s
Reg
ion
All
prim
ary
liver
can
cers
Hep
atoc
ellu
lar
carc
inom
aC
hola
ngio
carc
inom
a
5-ye
ar s
urvi
val
Con
ditio
nal s
urvi
val
5-ye
ar s
urvi
val
Con
ditio
nal s
urvi
val
5-ye
ar s
urvi
val
Con
ditio
nal s
urvi
val
NS
(%)
95%
CI
NS
(%)
95%
CI
NS
(%)
95%
CI
NS
(%)
95%
CI
NS
(%)
95%
CI
NS
(%)
95%
CI
Am
eric
a (N
orth
)
Can
ada*
21.3
19.6
–23.
143
.039
.4–4
6.6
25.4
23.3
–27.
546
.142
.1–5
0.1
8.1
5.6–
10.6
25.1
17.6
–32.
6
US
regi
strie
s16
.315
.9–1
6.8
38.8
37.7
–40.
017
.717
.2–1
8.3
40.0
38.7
–41.
38.
87.
9–9.
827
.324
.3–3
0.3
Asi
a
Chi
nese
regi
strie
s19
.518
.0–2
1.0
52.7
48.7
–56.
721
.319
.4–2
3.1
51.9
47.3
–56.
516
.011
.5–2
0.5
Japa
nese
regi
strie
s23
.722
.6–2
4.7
37.4
35.9
–39.
025
.524
.4–2
6.7
38.4
36.7
–40.
110
.98.
8–13
.0
Kor
ea*
21.2
20.6
–21.
742
.040
.7–4
3.2
24.1
23.4
–24.
843
.842
.4–4
5.3
9.5
8.5–
10.4
31.9
28.5
–35.
4
Mal
aysi
a (P
enan
g)15
.110
.6–1
9.7
10.6
6.9–
14.3
Mon
golia
*8.
53.
1–13
.9
Taiw
an*
22.7
22.1
–23.
242
.341
.2–4
3.4
24.0
23.4
–24.
742
.841
.7–4
4.0
8.3
7.1–
9.6
31.9
27.2
–36.
5
Thai
regi
strie
s4.
42.
3–6.
53.
71.
9–5.
6
Eur
ope
Aus
tria
*12
.811
.2–1
4.4
35.1
30.9
–39.
314
.612
.5–1
6.7
37.0
32.0
–41.
95.
73.
4–8.
0
Bel
gium
*20
.517
.8–2
3.1
40.6
35.3
–45.
923
.019
.8–2
6.2
44.4
38.4
–50.
414
.4
Den
mar
k*6.
74.
8–8.
68.
15.
5–10
.7
Finl
and*
8.4
6.2–
10.6
24.4
18.5
–30.
311
.38.
0–14
.73.
71.
6–5.
9
Fren
ch re
gist
ries
18.6
16.2
–21.
034
.930
.5–3
9.3
20.5
17.6
–23.
435
.931
.0–4
0.8
Ger
man
regi
strie
s14
.712
.9–1
6.5
36.7
32.4
–41.
016
.314
.0–1
8.6
38.9
33.7
–44.
010
.87.
8–13
.9
Irela
nd*
17.0
12.9
–21.
1
Italia
n re
gist
ries
21.7
20.4
–23.
037
.735
.6–3
9.8
24.0
22.5
–25.
539
.637
.3–4
2.0
7.9
5.6–
10.2
Net
herla
nds*
12.0
9.5–
14.4
32.2
25.8
–38.
613
.610
.5–1
6.7
33.0
25.7
–40.
35.
62.
8–8.
4
Nor
way
*11
.07.
9–14
.114
.09.
8–18
.1
Pol
ish
regi
strie
s9.
37.
6–11
.027
.822
.4–3
3.2
9.4
7.0–
11.9
25.2
18.7
–31.
68.
86.
4–11
.3
Por
tuga
l*16
.313
.8–1
8.8
40.9
34.7
–47.
016
.813
.7–1
9.8
38.3
31.7
–45.
013
.39.
5–17
.2
Slo
veni
a*6.
03.
3–8.
77.
74.
4–10
.9
Tab
le 3
(con
tinue
d)

Annals of Cancer Epidemiology, 2019Page 12 of 25
© Annals of Cancer Epidemiology. All rights reserved. Ann Cancer Epidemiol 2019;3:6 | http://dx.doi.org/10.21037/ace.2019.07.01
Tab
le 3
(con
tinue
d)
Reg
ion
All
prim
ary
liver
can
cers
Hep
atoc
ellu
lar
carc
inom
aC
hola
ngio
carc
inom
a
5-ye
ar s
urvi
val
Con
ditio
nal s
urvi
val
5-ye
ar s
urvi
val
Con
ditio
nal s
urvi
val
5-ye
ar s
urvi
val
Con
ditio
nal s
urvi
val
NS
(%)
95%
CI
NS
(%)
95%
CI
NS
(%)
95%
CI
NS
(%)
95%
CI
NS
(%)
95%
CI
NS
(%)
95%
CI
Spa
nish
regi
strie
s18
.016
.1–2
0.0
38.0
33.7
–42.
319
.317
.0–2
1.7
38.0
33.3
–42.
711
.47.
8–14
.9
Sw
eden
*12
.911
.0–1
4.7
42.7
37.0
–48.
317
.314
.9–1
9.7
46.5
40.0
–52.
95.
43.
4–7.
5
Sw
iss
regi
strie
s15
.212
.5–1
7.9
35.6
29.4
–41.
918
.215
.1–2
1.4
40.2
33.4
–47.
0
Uni
ted
Kin
gdom
*9.
38.
4–10
.129
.426
.8–3
2.1
12.5
11.2
–13.
835
.231
.3–3
9.1
5.3
4.3–
6.3
19.8
16.2
–23.
4
Oce
ania
Aus
tral
ian
regi
strie
s13
.912
.1–1
5.7
31.3
27.1
–35.
616
.914
.6–1
9.2
36.5
31.5
–41.
57.
24.
9–9.
616
.711
.1–2
2.4
New
Zea
land
*16
.513
.2–1
9.9
46.1
37.3
–54.
920
.315
.9–2
4.7
8.7
5.0–
12.4
Com
bine
d es
timat
e†††
14.8
12.8
–16.
837
.634
.9–4
0.4
17.4
15.2
–19.
539
.737
.2–4
2.3
8.4
7.0–
9.9
25.6
20.6
–30.
6
*, d
ata
with
100
% c
over
age
of t
he n
atio
nal p
opul
atio
n; † , f
ive-
year
sur
viva
l con
ditio
nal o
n su
rviv
al t
o th
e en
d of
the
firs
t ye
ar a
fter
dia
gnos
is; †
† , mic
rosc
opic
ally
ver
ified
(see
te
xt); †
††, e
stim
ated
with
a r
ando
m e
ffect
s m
odel
(see
text
).
seen in every age group (Figure 5A,B,C,D,E).
Cholangiocarcinoma
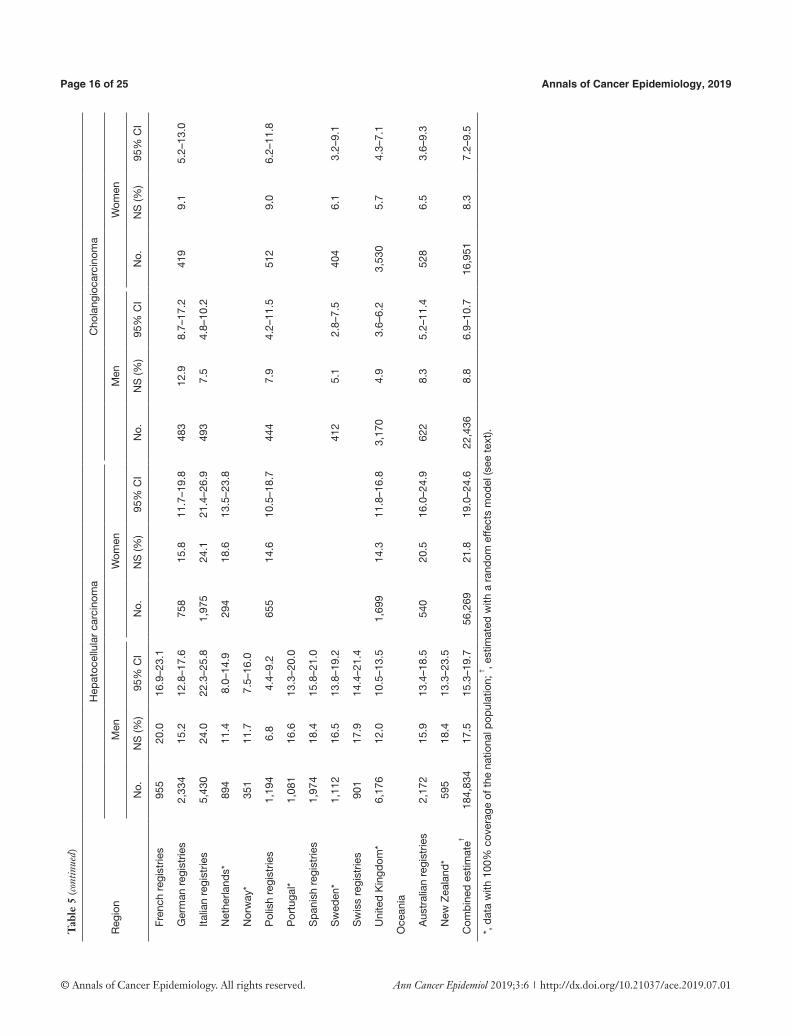
Age-standardised five-year net survival for patients diagnosed during 2004-2009 ranged from 3.7% in Thailand and Finland to 16.0% in China (Table 3; Figure 6A). The pooled estimate was 8.4%. Survival was similar for men (8.8%) and women (8.3%) (Table 5).
Five-year survival for patients diagnosed during 2004–2009 exceeded the upper 95% control limit for patients diagnosed during 1995–1999 in China (16.0%), Belgium (14.4%) and Portugal (13.3%) (pooled estimate 6.0%) (Figure 6B).
All the age-standardised five-year conditional survival estimates for 2004–2009 were within the control limits around the pooled estimate for patients diagnosed ten years earlier (22.0%), suggesting there had been little change in longer-term survival (Figure 6C).
Discussion
CONCORD-2 is the largest study to date of population-based survival from primary malignant neoplasms of the liver. The estimates of net survival up to five years after diagnosis presented here are based on data for 578,740 patients from 187 population-based registries in 36 countries over the 15-year period 1995–2009. All the estimates are corrected for international variation and trends in background mortality, and where possible they are age-standardised. For patients diagnosed during 2004–2009, age-standardised comparisons of net survival are now available for HCC in 25 countries and for cholangiocarcinoma in 20 countries.
The pooled estimate of age-standardised five-year net survival for primary liver cancer during 2004–2009 was 14.8% (range 4.4–23.7%). Survival was higher for patients diagnosed with HCC (17.4%, range 7.7–25.5%) than for those with cholangiocarcinoma (8.4%, range 3.7–16.0%).
Five-year net survival increased slightly between 1995–2000 (pooled estimate 11.0%) and 2004–2009 (14.8%), most noticeably in younger patients and for those with HCC. Given that survival is notably higher for HCC than for cholangiocarcinoma, and the wide international variation in the relative frequency of these two sub-types, international comparisons of liver cancer survival should probably be done separately for HCC and cholangiocarcinoma.
In Canada, Italy, Japan, Taiwan and Korea, five-year net

Annals of Cancer Epidemiology, 2019 Page 13 of 25
© Annals of Cancer Epidemiology. All rights reserved. Ann Cancer Epidemiol 2019;3:6 | http://dx.doi.org/10.21037/ace.2019.07.01
survival for HCC (21.2–23.7%) in 2004–2009 was higher than the pooled estimate for 1995–2000. Japan introduced a programme for early diagnosis with new imaging techniques from the 1980s, with advanced techniques in surgery and chemotherapy (35). The proportion of tumours larger than 10 cm fell from 65.0% to 6.0% during 1978–2005 (36). The proportion of patients diagnosed with localised disease in Japan (60%) (35) is higher than in Korea (44%) (37), the USA (41%) (38) or Taiwan (30%) (39). The evidence of reduced mortality from screening patients with chronic liver disease is weak (40), but a dose-dependent association was found in a national study in Taiwan between shorter intervals from ultrasonography examination to a confirmed diagnosis and subsequent mortality (41). The high
proportion of DCO registrations in Japan (20.5%) and the low proportion of patients with histological confirmation of the diagnosis in Italy (43.5%) may have modified the stage distribution (data not shown), but we have not examined survival by stage.
Age-standardised 5-year net survival for HCC was slightly but systematically higher for women than for men. A similar result was seen in the US SEER programme from a study of 39,345 patients diagnosed between 1988 and 2010, in which the hazard ratio for all-cause survival was 17% lower in women than men (42). The role of sex hormones was invoked in that study, but earlier detection could also play a role.
Conditional survival (five-year net survival among
Figure 4 Hepatocellular carcinoma: age-standardised 5-year net survival for patients diagnosed during 2004–2009: (A) the target value is the pooled estimate for the same period; (B) the target value is the pooled estimate for patients diagnosed during 1995–2000, 10 years earlier; (C) 5-year survival, conditional on survival to the end of the first year after diagnosis, for patients diagnosed during 2004–2009 with the pooled estimate for 1995–2000, 10 years earlier, as the target value. Hollow circles represent unstandardized survival estimates. Only age-standardised estimates (Table 3) contributed to the construction of the funnel plot. Country codes: see Figure 3.
40
30
20
10
0
60
50
40
30
20
10
40
30
20
10
0
Net
sur
viva
l (%
)N
et s
urvi
val (
%)
Net
sur
viva
l (%
)
2 4 6 8 10
3 4 5 6 7 8
2 4 6 8 10Log of precision (1/transformed sampling variance)
Log of precision (1/transformed sampling variance)
Log of precision (1/transformed sampling variance)
A
C
B
Target value 95.0% control limit (CL) 99.8% CL
Annals of Cancer Epidemiology, 2019Page 14 of 25
© Annals of Cancer Epidemiology. All rights reserved. Ann Cancer Epidemiol 2019;3:6 | http://dx.doi.org/10.21037/ace.2019.07.01
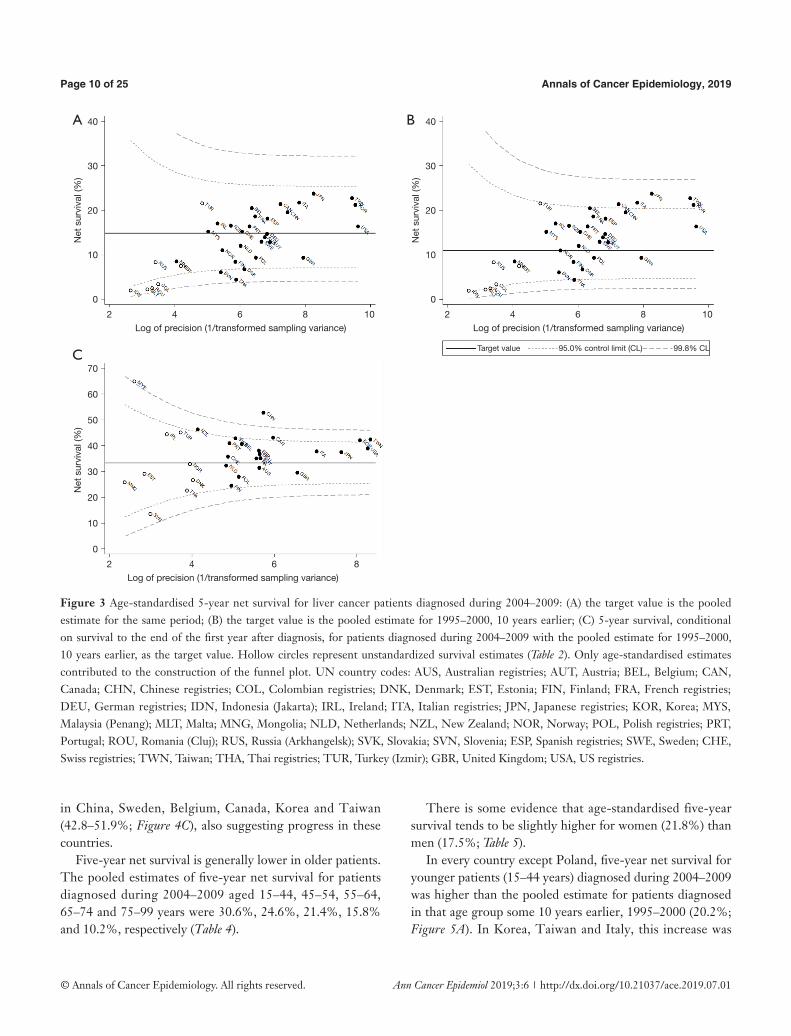
Tab
le 4
Fiv
e-ye
ar n
et s
urvi
val (
NS,
%) a
nd 9
5% c
onfid
ence
inte
rval
(95%
CI)
of p
atie
nts
diag
nose
d w
ith h
epat
ocel
lula
r ca
rcin
oma
duri
ng 2
004–
2009
† by
age
at d
iagn
osis
, 28
coun
trie
s
Reg
ion
15–4
4 ye
ars
45–5
4 ye
ars
55–6
4 ye
ars
65–7
4 ye
ars
75–9
9 ye
ars
No.
NS
(%)
95%
CI
No.
NS
(%)
95%
CI
No.
NS
(%)
95%
CI
No.
NS
(%)
95%
CI
No.
NS
(%)
95%
CI
Am
eric
a (N
orth
)
Can
ada*
177
42.8
33.4
–52.
274
638
.934
.0–4
3.8
1,14
535
.431
.3–3
9.6
1,20
621
.717
.5–2
6.0
1,05
511
.37.
3–15
.4
US
regi
strie
s2,
273
31.6
29.2
–34.
111
,720
22.9
21.8
–24.
017
,104
21.6
20.5
–22.
613
,152
16.2
15.1
–17.
312
,507
10.8
9.6–
11.9
Asi
a
Chi
nese
regi
strie
s70
723
.820
.0–2
7.7
1,53
825
.722
.9–2
8.4
1,31
323
.220
.0–2
6.3
1,33
619
.015
.8–2
2.2
721
19.6
14.7
–24.
5
Japa
nese
regi
strie
s19
833
.424
.7–4
2.1
803
29.0
25.2
–32.
83,
087
28.8
26.7
–31.
05,
692
25.9
24.3
–27.
54,
441
19.2
17.3
–21.
1
Kor
ea*
6,64
630
.328
.8–3
1.8
18,4
1831
.130
.1–3
2.1
19,6
8830
.129
.0–3
1.1
15,5
1023
.222
.0–2
4.4
6,28
915
.813
.9–1
7.7
Mal
aysi
a (P
enan
g)72
22.2
10.8
–33.
711
39.
72.
4–17
.010
011
.23.
0–19
.556
4.9
0.0–
11.4
Taiw
an*
5,07
830
.328
.7–3
1.9
10,1
5428
.026
.7–2
9.3
13,8
1729
.127
.9–3
0.3
16,3
0425
.624
.5–2
6.8
11,7
8715
.213
.8–1
6.6
Thai
regi
strie
s83
12.6
4.2–
21.0
7214
.23.
0–25
.4
Turk
ey (I
zmir)
8024
.411
.9–3
7.0
105
31.4
19.7
–43.
169
12.7
1.9–
23.4
Eur
ope
Aus
tria
*50
28.6
14.5
–42.
725
518
.112
.6–2
3.6
582
17.7
13.4
–22.
087
713
.39.
8–16
.783
58.
65.
2–12
.1
Bel
gium
*86
31.7
18.2
–45.
220
739
.530
.3–4
8.7
565
30.1
22.7
–37.
672
717
.912
.5–2
3.3
578
13.4
7.6–
19.1
Den
mar
k*78
11.9
3.8–
20.0
207
7.4
1.8–
13.1
275
5.3
1.4–
9.2
226
4.2
0.0–
9.3
Finl
and*
210
10.5
3.1–
17.9
340
15.7
10.1
–21.
438
87.
32.
3–12
.4
Fren
ch re
gist
ries
9425
.815
.0–3
6.7
275
27.4
21.0
–33.
740
018
.313
.6–2
3.0
306
14.4
8.9–
19.8
Ger
man
regi
strie
s61
39.9
25.6
–54.
126
622
.415
.4–2
9.4
608
19.9
14.8
–25.
11,
165
13.5
10.4
–16.
799
28.
04.
2–11
.8
Irela
nd*
7437
.221
.3–5
3.1
8410
.20.
1–20
.375
9.5
0.0–
19.0
Italia
n re
gist
ries
143
43.7
34.0
–53.
351
932
.727
.5–3
7.9
1,46
229
.526
.3–3
2.7
2,78
320
.618
.4–2
2.9
2,49
814
.712
.3–1
7.1
Net
herla
nds*
7827
.315
.2–3
9.5
133
20.8
9.4–
32.1
293
19.5
12.2
–26.
735
313
.06.
9–19
.133
13.
20.
0–6.
7
Nor
way
*58
20.4
8.1–
32.8
9116
.86.
4–27
.111
915
.36.
2–24
.419
65.
80.
9–10
.7
Pol
ish
regi
strie
s14
418
.510
.6–2
6.4
256
15.8
8.9–
22.6
499
8.7
4.2–
13.1
598
5.8
2.4–
9.3
352
8.9
3.1–
14.7
Por
tuga
l*62
25.7
13.5
–37.
818
325
.317
.3–3
3.3
317
19.1
13.6
–24.
545
411
.66.
8–16
.427
314
.47.
2–21
.6
Slo
veni
a*50
20.8
6.8–
34.8
930.
30.
0–0.
813
012
.23.
3–21
.175
0.2
0.0–
0.8
Spa
nish
regi
strie
s11
536
.826
.6–4
7.0
325
23.7
17.5
–30.
053
627
.021
.7–3
2.3
786
16.4
12.5
–20.
369
310
.25.
8–14
.6
Tab
le 4
(con
tinue
d)

Annals of Cancer Epidemiology, 2019 Page 15 of 25
© Annals of Cancer Epidemiology. All rights reserved. Ann Cancer Epidemiol 2019;3:6 | http://dx.doi.org/10.21037/ace.2019.07.01
Tab
le 5
Age
-sta
ndar
dise
d fiv
e-ye
ar n
et s
urvi
val (
NS,
%),
and
95%
con
fiden
ce in
terv
al (9
5% C
I), p
atie
nts
diag
nose
d du
ring
200
4–20
09 w
ith h
epat
ocel
lula
r ca
rcin
oma
or
chol
angi
ocar
cino
ma,
by
sex,
22
coun
trie
s
Reg
ion
Hep
atoc
ellu
lar
carc
inom
aC
hola
ngio
carc
inom
a
Men
Wom
enM
enW
omen
No.
NS
(%)
95%
CI
No.
NS
(%)
95%
CI
No.
NS
(%)
95%
CI
No.
NS
(%)
95%
CI
Am
eric
a (N
orth
)
Can
ada*
3,41
124
.221
.8–2
6.6
918
28.3
23.8
–32.
763
25.
62.
9–8.
254
310
.06.
5–13
.5
US
regi
strie
s43
,715
17.1
16.4
–17.
713
,041
20.7
19.6
–21.
95,
056
8.2
7.0–
9.4
4,60
79.
88.
3–11
.2
Asi
a
Chi
nese
regi
strie
s4,
375
20.8
18.4
–23.
21,
240
23.4
20.1
–26.
738
920
.514
.2–2
6.8
247
11.6
6.8–
16.4
Japa
nese
regi
strie
s9,
864
25.1
23.8
–26.
54,
357
28.2
26.1
–30.
287
611
.48.
7–14
.2
Kor
ea*
52,5
7723
.822
.9–2
4.7
13,9
7426
.725
.5–2
7.9
6,70
89.
48.
2–10
.64,
006
9.3
7.9–
10.8
Taiw
an*
41,4
3623
.422
.6–2
4.1
15,7
0427
.326
.2–2
8.5
2,44
08.
66.
9–10
.32,
155
8.2
6.4–
9.9
Eur
ope
Aus
tria
*2,
044
14.5
12.4
–16.
755
515
.110
.9–1
9.3
381
6.4
3.2–
9.7
Bel
gium
*1,
604
21.9
18.3
–25.
555
926
.120
.4–3
1.9
330
12.3
7.7–
16.9
Den
mar
k*63
97.
54.
4–10
.7
Tab
le 5
(con
tinue
d)
Tab
le 4
(con
tinue
d)
Reg
ion
15–4
4 ye
ars
45–5
4 ye
ars
55–6
4 ye
ars
65–7
4 ye
ars
75–9
9 ye
ars
No.
NS
(%)
95%
CI
No.
NS
(%)
95%
CI
No.
NS
(%)
95%
CI
No.
NS
(%)
95%
CI
No.
NS
(%)
95%
CI
Sw
eden
*14
132
.023
.2–4
0.8
330
20.7
14.6
–26.
845
711
.06.
7–15
.357
77.
44.
1–10
.7
Sw
iss
regi
strie
s12
022
.612
.1–3
3.0
260
24.4
17.0
–31.
841
316
.711
.1–2
2.4
301
12.5
6.8–
18.2
Uni
ted
Kin
gdom
*35
526
.820
.8–3
2.8
767
19.4
15.2
–23.
61,
659
17.8
14.8
–20.
72,
484
8.9
6.9–
10.9
2,61
05.
53.
2–7.
8
Oce
ania
Aus
tral
ian
regi
strie
s11
728
.415
.9–4
1.0
530
22.1
16.7
–27.
664
224
.319
.2–2
9.4
729
14.4
10.2
–18.
669
48.
54.
6–12
.4
New
Zea
land
*15
121
.79.
4–34
.119
424
.315
.2–3
3.4
184
22.6
13.6
–31.
716
414
.05.
5–22
.6
Com
bine
d es
timat
e†††
16,2
9030
.628
.3–3
3.0
47,7
4724
.622
.4–2
6.9
65,3
4121
.418
.3–2
4.5
66,7
2715
.813
.7–1
7.8
49,0
2010
.28.
4–12
.1
*, d
ata
with
100
% c
over
age
of th
e na
tiona
l pop
ulat
ion;
† , mic
rosc
opic
ally
ver
ified
(see
text
); †† , e
stim
ated
with
a r
ando
m e
ffect
s m
odel
(see
text
).
Annals of Cancer Epidemiology, 2019Page 16 of 25
© Annals of Cancer Epidemiology. All rights reserved. Ann Cancer Epidemiol 2019;3:6 | http://dx.doi.org/10.21037/ace.2019.07.01
Tab
le 5
(con
tinue
d)
Reg
ion
Hep
atoc
ellu
lar
carc
inom
aC
hola
ngio
carc
inom
a
Men
Wom
enM
enW
omen
No.
NS
(%)
95%
CI
No.
NS
(%)
95%
CI
No.
NS
(%)
95%
CI
No.
NS
(%)
95%
CI
Fren
ch re
gist
ries
955
20.0
16.9
–23.
1
Ger
man
regi
strie
s2,
334
15.2
12.8
–17.
675
815
.811
.7–1
9.8
483
12.9
8.7–
17.2
419
9.1
5.2–
13.0
Italia
n re
gist
ries
5,43
024
.022
.3–2
5.8
1,97
524
.121
.4–2
6.9
493
7.5
4.8–
10.2
Net
herla
nds*
894
11.4
8.0–
14.9
294
18.6
13.5
–23.
8
Nor
way
*35
111
.77.
5–16
.0
Pol
ish
regi
strie
s1,
194
6.8
4.4–
9.2
655
14.6
10.5
–18.
744
47.
94.
2–11
.551
29.
06.
2–11
.8
Por
tuga
l*1,
081
16.6
13.3
–20.
0
Spa
nish
regi
strie
s1,
974
18.4
15.8
–21.
0
Sw
eden
*1,
112
16.5
13.8
–19.
241
25.
12.
8–7.
540
46.
13.
2–9.
1
Sw
iss
regi
strie
s90
117
.914
.4–2
1.4
Uni
ted
Kin
gdom
*6,
176
12.0
10.5
–13.
51,
699
14.3
11.8
–16.
83,
170
4.9
3.6–
6.2
3,53
05.
74.
3–7.
1
Oce
ania
Aus
tral
ian
regi
strie
s2,
172
15.9
13.4
–18.
554
020
.516
.0–2
4.9
622
8.3
5.2–
11.4
528
6.5
3.6–
9.3
New
Zea
land
*59
518
.413
.3–2
3.5
Com
bine
d es
timat
e†18
4,83
417
.515
.3–1
9.7
56,2
6921
.819
.0–2
4.6
22,4
368.
86.
9–10
.716
,951
8.3
7.2–
9.5
*, d
ata
with
100
% c
over
age
of th
e na
tiona
l pop
ulat
ion;
† , est
imat
ed w
ith a
ran
dom
effe
cts
mod
el (s
ee te
xt).

Annals of Cancer Epidemiology, 2019 Page 17 of 25
© Annals of Cancer Epidemiology. All rights reserved. Ann Cancer Epidemiol 2019;3:6 | http://dx.doi.org/10.21037/ace.2019.07.01
Figure 5 Hepatocellular carcinoma: 5-year net survival for patients diagnosed during 2004–2009, by age at diagnosis: (A) 15–44 years, (B) 45–54 years, (C) 55–64 years, (D) 65–74 years, and (E) 75–99 years. The target value in each funnel plot is the pooled estimate for that age group for patients diagnosed during 1995–2000, 10 years earlier. Country codes: see Figure 3.
50
40
30
20
10
0
50
40
30
20
10
0
50
40
30
20
10
0
50
40
30
20
10
0
50
40
30
20
10
0
Net
sur
viva
l (%
)
Net
sur
viva
l (%
)N
et s
urvi
val (
%)
Net
sur
viva
l (%
)
Net
sur
viva
l (%
)
2 4 6 8 103 4 5 6 7 8
3 4 5 6 7
3 4 5 6 7 82 4 6 8
Log of precision (1/transformed sampling variance)Log of precision (1/transformed sampling variance)
Target value 95.0% control limit (CL) 99.8% CL
Target value 95.0% control limit (CL) 99.8% CL
Target value 95.0% control limit (CL) 99.8% CL
Target value 95.0% control limit (CL) 99.8% CL
Target value 95.0% control limit (CL) 99.8% CL
Log of precision (1/transformed sampling variance)
Log of precision (1/transformed sampling variance)Log of precision (1/transformed sampling variance)
A
C
E
B
D
15–44 years
55–64 years
75–99 years
45–54 years
65–74 years

Annals of Cancer Epidemiology, 2019Page 18 of 25
© Annals of Cancer Epidemiology. All rights reserved. Ann Cancer Epidemiol 2019;3:6 | http://dx.doi.org/10.21037/ace.2019.07.01
Figure 6 Cholangiocarcinoma: age-standardised 5-year net survival for patients diagnosed during 2004–2009: (A) the target value is the pooled estimate for the same period; (B) the target value is the pooled estimate for patients diagnosed during 1995–2000, 10 years earlier; (C) 5-year survival, conditional on survival to the end of the first year after diagnosis, for patients diagnosed during 2004–2009 with the pooled estimate for 1995–2000, 10 years earlier, as the target value. Hollow circles represent unstandardized survival estimates. Only age-standardised estimates (Table 3) contributed to the construction of the funnel plot. Country codes: see Figure 3.
patients who had survived to the first anniversary of diagnosis) in 2004–2009 was highest in New Zealand, Canada, Taiwan, Korea, and China (42.0–52.7%). International variation in conditional five-year survival from HCC is likely to reflect the impact of variation in treatment for earlier-stage disease better than variation in five-year survival estimates that include the first year, because many patients with advanced-stage disease will have died in the first year after diagnosis. It may also reflect variation in treatment for localised and early-stage disease, through wider access to surgery (38,43,44), including liver transplantation (45,46), better patient selection (47-49) and clinical experience
(50-52). Almost all these studies were done in Taiwan or the US.
Five-year net survival for patients diagnosed with cholangiocarcinoma during 2004–2009 was extremely low world-wide (3.7–16.0%). Survival in China, Belgium and Portugal has improved since 1995–2000, but little improvement has been seen in most other countries. Improvements in survival have been reported from the SEER programme in the USA (53), but most patients still receive no liver-directed intervention (54), despite evidence of better outcomes from resection (17) and transplantation (55). Resection rates have not improved (17), and barriers to treatment, such as household income (56)
30
20
10
0
60
50
40
30
20
10
0
30
20
10
0
Net
sur
viva
l (%
)N
et s
urvi
val (
%)
Net
sur
viva
l (%
)
3 4 5 6 7 8
2 3 4 5 6
3 4 5 6 7 8Log of precision (1/transformed sampling variance)
Log of precision (1/transformed sampling variance)
Log of precision (1/transformed sampling variance)
A
C
B
Target value 95.0% control limit (CL) 99.8% CL
Annals of Cancer Epidemiology, 2019 Page 19 of 25
© Annals of Cancer Epidemiology. All rights reserved. Ann Cancer Epidemiol 2019;3:6 | http://dx.doi.org/10.21037/ace.2019.07.01
have been identified. Again, most of these are studies are from the US.
This study has highlighted the wide variation in data quality for liver cancer from population-based cancer registries. The problem arises partly because liver cancers are often diagnosed late, when invasive investigation is not warranted, survival is poor and the proportion of cases registered only from a death certificate (DCO) can be high. The liver is also a site of predilection for metastasis from other organs. These aspects of data quality can affect the comparability of survival estimates, both by exclusion of DCOs, for which the duration of survival is unknown but probably very short, and by the inability to determine accurately the morphologic type or the stage at diagnosis. Variability in data quality was also shown by the coding of cholangiocarcinoma to the liver parenchyma (20–30% of cases in four countries).
Misclassification of liver metastases as primary liver cancers will have been reduced by the exclusion of patients for whom the only basis of diagnosis was a death certificate. We also excluded patients for whom there was no evidence of microscopic verification. The European Network of Cancer Registries recommends assignation of a morphology code for HCC (ICD-O-3 M8170) if a liver tumour is diagnosed solely from high levels of alpha-fetoprotein, so some primary HCCs may have been excluded where this practice was not adopted. Survival estimates are more susceptible to bias when a large proportion of patients is excluded, such as in Romania, Thailand, Japan, Italy and China. Incomplete trace-back to find the date of diagnosis of cases first notified to the registry from a death certificate, resulting in a high proportion of DCO registrations, has been shown to bias survival estimates upwards, because such cases are often diagnosed shortly before death, leaving little time for routine cancer registration (57,58). By contrast, Denmark undertakes very intensive trace-back; the proportion of DCO cases for liver cancer is extremely low (0.8%), and this leads to inclusion in the analyses of many patients with very short survival.
Funnel plots are preferable to ranked bar charts for displaying survival estimates as higher or lower than a given benchmark, because they take due account of the precision of each estimate (34). Here, we devised a new method, using a random effects model to handle the wide international variation in both the survival estimates and the precision of those estimates, while maintaining control limits within the
range 0 to 100%. The more objective comparison of survival estimates, presented alongside information on data quality, should motivate adoption of better registration practice, to improve both completeness and quality of the data. The collection of more complete data on tumour stage needs special emphasis, to enable evaluation of the contributions of early diagnosis and timely treatment to survival (59,60).
Unfortunately, many countries in Asia and Africa, where liver cancer incidence is usually high, could not be included in the analyses because of the lack of population-based cancer registry data. Survival in these countries is likely to be lower than in the high-income countries from which most of the data presented here were available (61).
Conclusions
Despite international variation and improvement over time, survival from liver cancer remains very low in most countries, particularly for cholangiocarcinoma. For hepatocellular carcinoma, prevention remains an urgent priority, through reduction in exposure to key risk factors such as aflatoxin (62), responsible for 5–28% of cases (4), and excessive alcohol consumption (63,64), as well as more widespread immunization against hepatitis B and C (14). Difficulties in implementing vaccination in low- and middle-income countries suggest that the incidence of hepatocellular carcinoma is likely to remain high (13).
Improving survival should therefore remain a high priority. Credible international comparisons of survival should stimulate policy to improve early diagnosis, and clinical trials of new approaches to treatment. Sustained effort is required to expand population-based cancer registration for surveillance of cancer incidence and survival worldwide. Global studies of cancer survival, such as CONCORD, contribute to this effort.
Acknowledgments
We thank Lisa Montel and Adrian Turculeț for logistical support. Funding from: Canadian Partnership Against Cancer (Toronto, Canada), Cancer Focus Northern Ireland (Belfast, UK), Cancer Institute New South Wales (Sydney, Australia), Cancer Research UK (London, UK), Centers for Disease Control and Prevention (Atlanta GA, USA), Swiss Re (London, UK), Swiss Cancer Research foundation (Bern, Switzerland), Swiss Cancer League (Bern, Switzerland), and
Annals of Cancer Epidemiology, 2019Page 20 of 25
© Annals of Cancer Epidemiology. All rights reserved. Ann Cancer Epidemiol 2019;3:6 | http://dx.doi.org/10.21037/ace.2019.07.01
University of Kentucky (Lexington KY, USA).
Footnote
Conflicts of Interest: The authors have no conflicts of interest to declare.
Ethical Statement: This study was approved by the Confidentiality Advisory Group of the UK’s Statutory Health Research Authority (HRA; reference ECC 3-04(i)/2011; last update March 3, 2017), the National Health Service Research Ethics Service (11/LO/0331; Feb 21, 2017), and the London School of Hygiene & Tropical Medicine Ethics Committee (12171; Sept 6, 2017). The authors are accountable for all aspects of the work in ensuring that questions related to the accuracy or integrity of any part of the work are appropriately investigated and resolved.
**CONCORD Working Group: Africa—Algeria: S Bouzbid (Registre du Cancer d’Annaba); M Hamdi-Chérif*, Z Zaidi (Registre du Cancer de Sétif); Gambia: R Swaminathan (National Cancer Registry); Lesotho: SH Nortje (Children’s Haematology Oncology Clinics - Lesotho); Libya: MM El Mistiri (Benghazi Cancer Registry); Mali: S Bayo, B Malle (Kankou Moussa University); Mauritius: SS Manraj, R Sewpaul-Sungkur (Mauritius National Cancer Registry); Nigeria: A Fabowale, OJ Ogunbiyi* (Ibadan Cancer Registry); South Africa: D Bradshaw, NIM Somdyala (Eastern Cape Province Cancer Registry); DC Stefan (Umtata University); Tunisia: L Jaidane, M Mokni (Registre du Cancer du Centre Tunisien).America (Central and South)—Argentina: I Kumcher, F Moreno (National Childhood Cancer Registry); MS González, EA Laura (Bahia Blanca Cancer Observatory); GH Calabrano, SB Espinola (Chubut Cancer Registry); B Carballo Quintero, R Fita (Registro Provincial de Tumores de Córdoba); DA Garcilazo, PL Giacciani (Registro Provincial Poblacional de Tumores de Entres Rios); MC Diumenjo, WD Laspada (Registro Provincial de Tumores de Mendoza); MA Green, MF Lanza (Registro de Cáncer de Santa Fe); SG Ibañez (Population Registry of Cancer of the Province Tierra del Fuego); Brazil: CA Lima, E Lobo de Oliveira (Registro de Câncer de Base Populacional de Aracaju); C Daniel, C Scandiuzzi (Cancer Registry of Distrito Federal); PCF De Souza, CD Melo (Registro de Câncer de Base Populacional de Cuiabá); K Del Pino, C
Laporte (Registro de Curitiba); MP Curado, JC de Oliveira (Registro de Goiânia); CLA Veneziano, DB Veneziano (Registro de Câncer de Base Populacional de Jaú); MRDO Latorre, LF Tanaka (Registro de Câncer de São Paulo); G Azevedo e Silva* (University of Rio de Janeiro); Chile: JC Galaz, JA Moya (Registro Poblacional de Cáncer Region de Antofagasta); DA Herrmann, S Vargas (Registro Poblacional Region de Los Rios); Colombia: VM Herrera, CJ Uribe (Registro Poblacional de Cáncer Area Metropolitana de Bucaramanga); LE Bravo (Cali Cancer Registry); NE Arias-Ortiz (Registro Poblacional de Cáncer de Manizales); DM Jurado, MC Yépez Chamorro (Registro Poblacional de Cáncer del Municipio de Pasto); Cuba: YH Galán Alvarez, P Torres (Registro Nacional de Cáncer de Cuba); Ecuador: F Martínez-Reyes, ML Pérez-Meza (Cuenca Tumor Registry); L Jaramillo, R Quinto (Guayaquil Cancer Registry); P Cueva, JG Yépez (Quito Cancer Registry); Puerto Rico: CR Torres-Cintrón, G Tortolero-Luna (Puerto Rico Central Cancer Registry); Uruguay: R Alonso, E Barrios (Registro Nacional de Cáncer).America (North)—Canada: C Nikiforuk, L Shack (Alberta Cancer Registry); AJ Coldman, RR Woods (British Columbia Cancer Registry); G Noonan, D Turner* (Manitoba Cancer Registry); E Kumar, B Zhang (New Brunswick Provincial Cancer Registry); FR McCrate, S Ryan (Newfoundland & Labrador Cancer Registry); H Hannah (Northwest Territories Cancer Registry); RAD Dewar, M MacIntyre (Nova Scotia Cancer Registry); A Lalany, M Ruta (Nunavut Department of Health and Social Services); L Marrett, DE Nishri* (Ontario Cancer Registry); CA McClure, KA Vriends (Prince Edward Island Cancer Registry); C Bertrand, R Louchini (Registre Québécois du Cancer); KI Robb, H Stuart-Panko (Saskatchewan Cancer Agency); S Demers, S Wright (Yukon Government); USA: JT George, X Shen (Alabama Statewide Cancer Registry); JT Brockhouse, DK O’Brien (Alaska Cancer Registry); L Almon (Metropolitan Atlanta Registry); J Bates (California State Cancer Registry); R Rycroft (Colorado Central Cancer Registry); L Mueller, CE Phillips (Connecticut Tumor Registry); H Brown, B Cromartie (Delaware Cancer Registry); AG Schwartz, F Vigneau (Metropolitan Detroit Cancer Surveillance System); JA MacKinnon, B Wohler (Florida Cancer Data System); R Bayakly (Georgia Cancer Registry); KC Ward (Georgia Cancer Registry; Metropolitan Atlanta Registry); CA Clarke, SL Glaser (Greater Bay Area Cancer Registry); D West (Cancer Registry of Greater California); MD Green, BY Hernandez (Hawaii Tumor Registry); CJ Johnson, D Jozwik (Cancer Data Registry of

Annals of Cancer Epidemiology, 2019 Page 21 of 25
© Annals of Cancer Epidemiology. All rights reserved. Ann Cancer Epidemiol 2019;3:6 | http://dx.doi.org/10.21037/ace.2019.07.01
Idaho); ME Charlton, CF Lynch (State Health Registry of Iowa); B Huang, TC Tucker* (Kentucky Cancer Registry); D Deapen, L Liu (Los Angeles Cancer Surveillance Program); MC Hsieh, XC Wu (Louisiana Tumor Registry); K Stern (Maryland Cancer Registry); ST Gershman, RC Knowlton (Massachusetts Cancer Registry); G Alverson, GE Copeland (Michigan State Cancer Surveillance Program); DB Rogers (Mississippi Cancer Registry); D Lemons, LL Williamson (Montana Central Tumor Registry); M Hood (Nebraska Cancer Registry); GM Hosain, JR Rees (New Hampshire State Cancer Registry); KS Pawlish, A Stroup (New Jersey State Cancer Registry); C Key, C Wiggins (New Mexico Tumor Registry); AR Kahn, MJ Schymura (New York State Cancer Registry); G Leung, C Rao (North Carolina Central Cancer Registry); LK Giljahn, B Warther (Ohio Cancer Incidence Surveillance System); A Pate (Oklahoma Central Cancer Registry); M Patil, SS Schubert (Oregon State Cancer Registry); JJ Rubertone, SJ Slack (Pennsylvania Cancer Registry); JP Fulton, DL Rousseau (Rhode Island Cancer Registry); TA Janes, SM Schwartz (Seattle Cancer Surveillance System); SW Bolick, DM Hurley (South Carolina Central Cancer Registry); J Richards, MA Whiteside (Tennessee Cancer Registry); LM Nogueira (Texas Cancer Registry); K Herget, C Sweeney (Utah Cancer Registry); J Martin, S Wang (Virginia Cancer Registry); DG Harrelson, MB Keitheri Cheteri (Washington State Cancer Registry); S Farley, AG Hudson (West Virginia Cancer Registry); R Borchers, L Stephenson (Wisconsin Department of Health Services); JR Espinoza (Wyoming Cancer Surveillance Program); HK Weir* (Centers for Disease Control and Prevention); BK Edwards* (National Cancer Institute).Asia—China: N Wang, L Yang (Beijing Cancer Registry); JS Chen (Changle City Cancer Registry); GH Song (Cixian Cancer Registry); XP Gu (Dafeng County Center for Disease Control and Prevention); P Zhang (Dalian Centers for Disease Prevention and Control); HM Ge (Donghai County Center for Disease Prevention and Control); DL Zhao (Feicheng County Cancer Registry); JH Zhang (Ganyu Center for Disease Prevention and Control); FD Zhu (Guanyun Cancer Registry); JG Tang (Haimen Cancer Registry); Y Shen (Haining City Cancer Registry); J Wang (Jianhu Cancer Registry); QL Li (Jiashan County Cancer Registry); XP Yang (Jintan Cancer Registry); J Dong, W Li (Lianyungang Center for Disease Prevention and Control); LP Cheng (Henan Province Central Cancer Registry); JG Chen (Qidong County Cancer Registry); QH Huang (Sihui Cancer Registry); SQ Huang (Taixing Cancer Registry); GP Guo (Cancer Institute of Yangzhong City); K Wei
(Zhongshan City Cancer Registry); WQ Chen*, H Zeng (The National Cancer Center); Cyprus: AV Demetriou, P Pavlou (Cyprus Cancer Registry); Hong Kong: WK Mang, KC Ngan (Hong Kong Cancer Registry); India: R Swaminathan (Chennai Cancer Registry); AC Kataki, M Krishnatreya (Guwahati Cancer Registry); PA Jayalekshmi, P Sebastian (Karunagappally Cancer Registry); SD Sapkota, Y Verma (Population Based Cancer Registry, Sikkim); A Nandakumar* (National Centre for Disease Informatics and Research); Indonesia: E Suzanna (Jakarta Cancer Registry); Israel: L Keinan-Boker, BG Silverman (Israel National Cancer Registry); Japan: H Ito, H Nakagawa (Aichi Cancer Registry); M Hattori, Y Kaizaki (Fukui Cancer Registry); H Sugiyama, M Utada (Hiroshima Prefecture Cancer Registry); K Katayama, H Narimatsu (Kanagawa Cancer Registry); S Kanemura (Miyagi Prefectural Cancer Registry); T Koike (Niigata Prefecture Cancer Registry); I Miyashiro (Osaka Cancer Registry); M Yoshii (Saga Prefectural Cancer Registry); I Oki (Tochigi Prefectural Cancer Registry); A Shibata (Yamagata Prefectural Cancer Registry); T Matsuda* (National Cancer Center); Jordan: O Nimri (Jordan National Cancer Registry); Korea: KW Jung, YJ Won (Korea Central Cancer Registry); Malaysia: A Ab Manan (Malaysia National Cancer Registry); N Bhoo-Pathy (University of Malaya); Mongolia: S Tuvshingerel (Cancer Registry of Mongolia); C Ochir (Mongolian National University of Medical Sciences); Qatar: AM Al Khater, MM El Mistiri (Qatar Cancer Registry); Saudi Arabia: H Al-Eid (Saudi National Cancer Registry); Taiwan: CJ Chiang, MS Lai (Taiwan Cancer Registry); Thailand: K Suwanrungruang, S Wiangnon (Khon Kaen Provincial Cancer Registry); K Daoprasert, D Pongnikorn (Lampang Cancer Registry); SL Geater, H Sriplung (Songkhla Cancer Registry); Turkey: S Eser, CI Yakut (Izmir Cancer Registry).Europe—Austria: M Hackl (Austrian National Cancer Registry); H Mühlböck, W Oberaigner (Tyrol Cancer Registry); Belarus: AA Zborovskaya (Belarus Childhood Cancer Subregistry); OV Aleinikova (Belarusian Research Center for Pediatric Oncology, Hematology and Immunology); Belgium: K Henau, L Van Eycken (Belgian Cancer Registry); Bulgaria: N Dimitrova, Z Valerianova (Bulgarian National Cancer Registry); Croatia: M Šekerija (Croatian National Cancer Registry); Czech Republic: M Zvolský (Czech National Cancer Registry); Denmark: G Engholm, H Storm* (Danish Cancer Society); Estonia: K Innos, M Mägi (Estonian Cancer Registry); Finland: N Malila, K Seppä (Cancer Society of Finland); France: J Jégu, M Velten (Bas-Rhin General Cancer Registry); E Cornet,

Annals of Cancer Epidemiology, 2019Page 22 of 25
© Annals of Cancer Epidemiology. All rights reserved. Ann Cancer Epidemiol 2019;3:6 | http://dx.doi.org/10.21037/ace.2019.07.01
X Troussard (Registre Régional des Hémopathies Malignes de Basse Normandie); AM Bouvier, J Faivre (Registre Bourguignon des Cancers Digestifs); AV Guizard (Registre Général des Tumeurs du Calvados); V Bouvier, G Launoy (Registre des Tumeurs Digestives du Calvados); P Arveux (Breast cancers registry of Côte-d’Or France); M Maynadié, M Mounier (Hémopathies Malignes de Côte d’Or); E Fournier, AS Woronoff (Doubs and Belfort Territory General Cancer Registry); M Daoulas (Finistère Cancer Registry); J Clavel (French National Registry of Childhood Hematopoietic Malignancies); S Le Guyader-Peyrou (Registre des Hémopathies Malignes de la Gironde); A Monnereau (Registre des Hémopathies Malignes de la Gironde; French Network of Cancer Registries (FRANCIM)); B Trétarre (Registre des Tumeurs de l’Hérault); M Colonna (Registre du Cancer du Département de l’Isère); A Cowppli-Bony, F Molinié (Loire-Atlantique-Vendée Cancer Registry); S Bara, D Degré (Manche Cancer Registry); O Ganry, B Lapôtre-Ledoux (Registre du Cancer de la Somme); P Grosclaude (Tarn Cancer Registry); A Belot (Hospices Civils de Lyon); F Bray*, M Piñeros* (International Agency for Research on Cancer); F Sassi (Organisation for Economic Co-operation and Development); J Estève (Université Claude Bernard, Lyon); Germany: R Stabenow (Common Cancer Registry of the Federal States); A Eberle (Bremen Cancer Registry); C Erb, AL Nennecke (Hamburg Cancer Registry); J Kieschke, E Sirri (Epidemiological Cancer Registry of Lower Saxony); H Kajueter (North Rhine Westphalia Cancer Registry); K Emrich, SR Zeissig (Rhineland Palatinate Cancer Registry); B Holleczek (Saarland Cancer Registry); N Eisemann, A Katalinic (Schleswig-Holstein Cancer Registry); H Brenner (German Cancer Research Center); Gibraltar: RA Asquez, V Kumar (Gibraltar Cancer Registry); Iceland: EJ Ólafsdóttir, L Tryggvadóttir (Icelandic Cancer Registry, Icelandic Cancer Society); Ireland: H Comber, PM Walsh (National Cancer Registry Ireland); H Sundseth* (European Institute of Women’s Health); Italy: G Mazzoleni, F Vittadello (Registro Tumori Alto Adige); A Giacomin† (Piedmont Cancer Registry Provinces of Biella and Vercelli); F Bella, M Castaing (Integrated Cancer Registry of Catania-Messina-Siracusa-Enna); A Sutera Sardo (Registro Tumori Catanzaro); G Gola (Registro Tumori della Provincia di Como); S Ferretti (Registro Tumori della Provincia di Ferrara); D Serraino, A Zucchetto (Registro Tumori del Friuli Venezia Giulia); R Lillini, M Vercelli (Registro Tumori Regione Liguria); S Busco, F Pannozzo (Registro Tumori della Provincia di Latina); S Vitarelli (Registro Tumori della Provincia di Macerata); P Ricci (Registro Tumori Mantova); C Pascucci
(Registro Tumori Marche Childhood); AG Russo (Registro Tumori Milano); C Cirilli, M Federico (Registro Tumori della Provincia di Modena); M Fusco, MF Vitale (Registro Tumori della ASL Napoli 3 Sud); M Usala (Nuoro Cancer Registry); R Cusimano, W Mazzucco (Registro Tumori di Palermo e Provincia); M Michiara, P Sgargi (Registro Tumori della Provincia di Parma); MM Maule, C Sacerdote (Piedmont Childhood Cancer Registry); R Tumino (Registro Tumori della Provincia di Ragusa); L Mangone (Registro Tumori Reggio Emilia); F Falcini (Registro Tumori della Romagna); L Cremone (Registro Tumori Salerno); M Budroni, R Cesaraccio (Registro Tumori della Provincia di Sassari); A Madeddu, F Tisano (Registro Tumori Siracusa); S Maspero, R Tessandori (Registro Tumori della Provincia di Sondrio); G Candela, T Scuderi (Registro Tumori Trapani); S Piffer (Registro Tumori Trento); S Rosso, L Sacchetto (Piedmont Cancer Registry); A Caldarella (Registro Tumori della Regione Toscana); F Bianconi, F Stracci (Registro Tumori Umbro di Popolazione); P Contiero, G Tagliabue (Registro Tumori Lombardia, Provincia di Varese); AP Dei Tos, M Zorzi (Registro Tumori Veneto); F Berrino*, G Gatta, M Sant* (Fondazione IRCCS Istituto Nazionale dei Tumori); R Zanetti* (International Association of Cancer Registries); R Capocaccia*, R De Angelis (National Centre for Epidemiology); Latvia: E Liepina, A Maurina (Latvian Cancer Registry); Lithuania: I Vincerževskienė (Lithuanian Cancer Registry); Malta: D Agius, N Calleja (Malta National Cancer Registry); Netherlands: S Siesling, O Visser (Netherlands Cancer Registry, IKNL); Norway: S Larønningen, B Møller (The Cancer Registry of Norway); Poland: A Dyzmann-Sroka, M Trojanowski (Greater Poland Cancer Registry); S Góźdź, R Mężyk (Holy Cross Cancer Registry); J Błaszczyk, K Kępska (Lower Silesian Cancer Registry); M Grądalska-Lampart, AU Radziszewska (Subcarpathian Cancer Registry); JA Didkowska, U Wojciechowska (National Cancer Registry); M Bielska-Lasota, K Kwiatkowska (National Institute of Public Health, NIH); Portugal: G Forjaz de Lacerda, RA Rego (Registo Oncológico Regional dos Açores); J Bastos, MA Silva (Registo Oncológico Regional do Centro); L Antunes, MJ Bento (Registo Oncológico Regional do Norte); A Mayer-da-Silva, A Miranda (Registo Oncólogico Regional do Sul); Romania: D Coza, AI Todescu (Cancer Institute I. Chiricuta); Russia: MY Valkov (Arkhangelsk Regional Cancer Registry); Slovakia: J Adamcik, C Safaei Diba (National Cancer Registry of Slovakia); Slovenia: M Primic-Žakelj, T Žagar (Cancer Registry of Republic of Slovenia); J Stare (University of Ljubljana); Spain: E Almar, A Mateos (Registro de Cáncer de
Annals of Cancer Epidemiology, 2019 Page 23 of 25
© Annals of Cancer Epidemiology. All rights reserved. Ann Cancer Epidemiol 2019;3:6 | http://dx.doi.org/10.21037/ace.2019.07.01
Albacete); JR Quirós (Registro de Tumores del Principado de Asturias); J Bidaurrazaga, N Larrañaga (Basque Country Cancer Registry); JM Díaz García, AI Navarro (Registro de Cáncer de Cuenca); R Marcos-Gragera, ML Vilardell Gil (Epidemiology Unit and Girona Cancer Registry); E Molina, MJ Sánchez Perez (Granada Cancer Registry); P Franch Sureda, M Ramos Montserrat (Mallorca Cancer Registry); MD Chirlaque, C Navarro (Murcia Cancer Registry); E Ardanaz, CC Moreno-Iribas (Registro de Cáncer de Navarra, CIBERESP); R Fernández-Delgado, R Peris-Bonet (Registro Español de Tumores Infantiles); J Galceran (Tarragona Cancer Registry); Sweden: S Khan, M Lambe (Swedish Cancer Registry); Switzerland: B Camey (Registre Fribourgeois des Tumeurs); C Bouchardy, M Usel (Geneva Cancer Registry); H Frick, C Herrmann (Cancer Registry Grisons and Glarus; Cancer Registry of St Gallen-Appenzell); JL Bulliard, M Maspoli-Conconi (Registre Neuchâtelois et Jurassien des Tumeurs); CE Kuehni, M Schindler (Swiss Childhood Cancer Registry); A Bordoni, A Spitale (Registro Tumori Canton Ticino); A Chiolero, I Konzelmann (Registre Valaisan des Tumeurs); KL Matthes (Cancer Registry Zürich and Zug); United Kingdom: J Rashbass (National Cancer Registration and Analysis Service England); D Fitzpatrick, A Gavin (Northern Ireland Cancer Registry); RJ Black, DH Brewster (Scottish Cancer Registry); CA Stiller (National Cancer Registration and Analysis Service, Public Health England); DW Huws, C White (Welsh Cancer Intelligence & Surveillance Unit); C Allemani*, A Bonaventure, MP Coleman*, V Di Carlo, R Harewood, M Matz, M Nikšić, B Rachet* (London School of Hygiene & Tropical Medicine); R Stephens* (National Cancer Research Institute, London); F Bannon (Queens University, Belfast).Oceania—Australia: E Chalker, L Newman (Australian Capital Territory Cancer Registry); D Baker, MJ Soeberg (NSW Cancer Registry); J Aitken, C Scott (Queensland Cancer Registry); BC Stokes, A Venn (Tasmanian Cancer Registry); H Farrugia, GG Giles (Victorian Cancer Registry); T Threlfall (Western Australian Cancer Registry); D Currow*, H You (Cancer Institute NSW); New Zealand: J Hendrix, C Lewis (New Zealand Cancer Registry).* CONCORD Steering Committee.†Dr. Adriano Giacomin passed away on 23 March 2017.
References
1. Ferlay J, Colombet M, Soerjomataram I, et al. Estimating the global cancer incidence and mortality in 2018:
GLOBOCAN sources and methods. Int J Cancer 2019;144:1941-53.
2. Katanoda K, Hori M. Morphological distribution of liver cancer from Cancer Incidence in Five Continents Vol. X. Jpn J Clin Oncol 2015;45:607.
3. El-Serag HB. Epidemiology of viral hepatitis and hepatocellular carcinoma. Gastroenterology 2012;142:1264-73.e1.
4. Liu Y, Wu F. Global burden of aflatoxin-induced hepatocellular carcinoma: a risk assessment. Environ Health Perspect 2010;118:818-24.
5. Donato F, Tagger A, Gelatti U, et al. Alcohol and hepatocellular carcinoma: the effect of lifetime intake and hepatitis virus infections in men and women. Am J Epidemiol 2002;155:323-31.
6. Wang C, Wang X, Gong G, et al. Increased risk of hepatocellular carcinoma in patients with diabetes mellitus: a systematic review and meta-analysis of cohort studies. Int J Cancer 2012;130:1639-48.
7. Sripa B, Pairojkul C. Cholangiocarcinoma: lessons from Thailand. Curr Opin Gastroenterol 2008;24: 349-56.
8. Wadsworth CA, Lim A, Taylor-Robinson SD, et al. The risk factors and diagnosis of cholangiocarcinoma. Hepatol Int 2013;7:377-93.
9. Cai H, Kong WT, Chen CB, et al. Cholelithiasis and the risk of intrahepatic cholangiocarcinoma: a meta-analysis of observational studies. BMC Cancer 2015;15:831.
10. Li H, Hu B, Zhou ZQ, et al. Hepatitis C virus infection and the risk of intrahepatic cholangiocarcinoma and extrahepatic cholangiocarcinoma: evidence from a systematic review and meta-analysis of 16 case-control studies. World J Surg Oncol 2015;13:161.
11. Ye XH, Huai JP, Ding J, et al. Smoking, alcohol consumption, and the risk of extrahepatic cholangiocarcinoma: a meta-analysis. World J Gastroenterol 2013;19:8780-8.
12. Parsi MA. Obesity and cholangiocarcinoma. World J Gastroenterol 2013;19:457-62.
13. Lahariya C, Subramanya BP, Sosler S. An assessment of hepatitis B vaccine introduction in India: lessons for roll out and scale up of new vaccines in immunization programs. Indian J Public Health 2013;57:8-14.
14. World Health Organisation. Hepatitis B vaccines: WHO position paper, July 2017 - Recommendations. Vaccine 2019;37:223-5.
15. Bah E, Carrieri MP, Hainaut P, et al. 20-years of population-based cancer registration in hepatitis B and liver cancer prevention in the Gambia, West Africa. PLoS

Annals of Cancer Epidemiology, 2019Page 24 of 25
© Annals of Cancer Epidemiology. All rights reserved. Ann Cancer Epidemiol 2019;3:6 | http://dx.doi.org/10.21037/ace.2019.07.01
One 2013;8:e75775.16. Coleman MP. Cancer survival: global surveillance will
stimulate health policy and improve equity. Lancet 2014;383:564-73.
17. Anderson JE, Hemming AW, Chang DC, et al. Surgical management trends for cholangiocarcinoma in the USA 1998-2009. J Gastrointest Surg 2012;16:2225-32.
18. Lepage C, Capocaccia R, Hackl M, et al. Survival in patients with primary liver cancer, gallbladder and extrahepatic biliary tract cancer and pancreatic cancer in Europe 1999–2007: Results of EUROCARE-5. Eur J Cancer 2015;51:2169-78.
19. Allemani C, Weir HK, Carreira H, et al. Global surveillance of cancer survival 1995-2009: analysis of individual data for 25,676,887 patients from 279 population-based registries in 67 countries (CONCORD-2). Lancet 2015;385:977-1010.
20. Razumilava N, Gores GJ. Cholangiocarcinoma. Lancet 2014;383:2168-79.
21. El-Serag HB. Hepatocellular carcinoma. N Engl J Med 2011;365:1118-27.
22. Fritz AG, Percy C, Jack A, et al. editors. International Classification of Diseases for Oncology (ICD-O). 3rd ed. Geneva: World Health Organization;, 2000.
23. Tyczynski JE, Démaret E, Parkin DM. Standards and guidelines for cancer registration in Europe. The ENCR recommendations. IARC Technical Publication No. 40. Lyon: IARC, 2003.
24. Forman D, Bray F, Brewster DH, et al. editors. Cancer incidence in five continents. Vol. X. (IARC Scientific Publications No. 164). Lyon: International Agency for Research on Cancer, 2014.
25. Perme MP, Stare J, Estève J. On estimation in relative survival. Biometrics 2012;68:113-20.
26. StataCorp. STATA statistical software. 14 ed. College Station TX: Stata Corporation, 2015.
27. Clerc-Urmès I, Grzebyk M, Hédelin G. Net survival estimation with stns. Stata J 2014;14:87-102.
28. Spika D, Rachet B, Bannon F, et al. Life tables for the CONCORD-2 study. London: CONCORD Central Analytic Team, 2015. Available online: http://csg.lshtm.ac.uk/tools-analysis/ (accessed 10 May 2018).
29. Brenner H, Gefeller O. Deriving more up-to-date estimates of long-term patient survival. J Clin Epidemiol 1997;50:211-6.
30. Allemani C, Harewood R, Johnson C, et al. Population-based cancer survival in the US: data, quality control and statistical methods. Cancer 2017;123:4982-93.
31. Corazziari I, Quinn MJ, Capocaccia R. Standard cancer patient population for age standardising survival ratios. Eur J Cancer 2004;40:2307-16.
32. Spiegelhalter DJ. Funnel plots for comparing institutional performance. Stat Med 2005;24:1185-202.
33. Spiegelhalter DJ. Handling over-dispersion of performance indicators. Qual Saf Health Care 2005;14:347-51.
34. Quaresma M, Coleman MP, Rachet B. Funnel plots for population-based cancer survival: principles, methods and applications. Stat Med 2014;33:1070-80.
35. Kudo M. Surveillance, diagnosis, treatment, and outcome of liver cancer in Japan. Liver Cancer 2015;4:39-50.
36. Kudo M, Izumi N, Sakamoto M, et al. Survival analysis over 28 years of 173,378 patients with hepatocellular carcinoma in Japan. Liver Cancer 2016;5:190-7.
37. Jung KW, Won YJ, Kong HJ, et al. Survival of Korean adult cancer patients by stage at diagnosis, 2006-2010: national cancer registry study. Cancer Res Treat 2013;45:162-71.
38. Altekruse SF, McGlynn KA, Dickie LA, et al. Hepatocellular carcinoma confirmation, treatment, and survival in surveillance, epidemiology, and end results registries, 1992-2008. Hepatology 2012;55:476-82.
39. Chiang CJ, Lo WC, Yang YW, et al. Incidence and survival of adult cancer patients in Taiwan, 2002-2012. J Formos Med Assoc 2016;115:1076-88.
40. Kansagara D, Papak J, Pasha AS, et al. Screening for hepatocellular carcinoma in chronic liver disease: a systematic review. Ann Intern Med 2014;161:261-9.
41. Wu CY, Hsu YC, Ho HJ, et al. Association between ultrasonography screening and mortality in patients with hepatocellular carcinoma: a nationwide cohort study. Gut 2016;65: 693-701.
42. Yang D, Hanna DL, Usher J, et al. Impact of sex on the survival of patients with hepatocellular carcinoma: a Surveillance, Epidemiology, and End Results analysis. Cancer 2014;120:3707-16.
43. Chiu CC, Wang JJ, Chen YS, et al. Trends and predictors of outcomes after surgery for hepatocellular carcinoma: A nationwide population-based study in Taiwan. Eur J Surg Oncol 2015;41:1170-8.
44. Sloane D, Chen H, Howell C. Racial disparity in primary hepatocellular carcinoma: tumor stage at presentation, surgical treatment and survival. Journal of the National Medical Association 2006;98:1934-9.
45. Devaki P, Wong RJ, Marupakula V, et al. Approximately one-half of patients with early-stage hepatocellular carcinoma meeting Milan criteria did not receive local

Annals of Cancer Epidemiology, 2019 Page 25 of 25
© Annals of Cancer Epidemiology. All rights reserved. Ann Cancer Epidemiol 2019;3:6 | http://dx.doi.org/10.21037/ace.2019.07.01
tumor destructive or curative surgery in the post-MELD exception era. Cancer 2014;120:1725-32.
46. Wong RJ, Devaki P, Nguyen L, et al. Ethnic disparities and liver transplantation rates in hepatocellular carcinoma patients in the recent era: results from the Surveillance, Epidemiology, and End Results registry. Liver Transpl 2014;20:528-35.
47. Wang JH, Changchien CS, Hu TH, et al. The efficacy of treatment schedules according to Barcelona Clinic Liver Cancer staging for hepatocellular carcinoma - Survival analysis of 3892 patients. Eur J Cancer 2008;44:1000-6.
48. Yi PS, Zhang M, Zhao JT, et al. Liver resection for intermediate hepatocellular carcinoma. World J Hepatol 2016;8:607-15.
49. Vitale A, Burra P, Frigo AC, et al. Survival benefit of liver resection for patients with hepatocellular carcinoma across different Barcelona Clinic Liver Cancer stages: a multicentre study. J Hepatol 2015;62:617-24.
50. Sato M, Tateishi R, Yasunaga H, et al. Mortality and morbidity of hepatectomy, radiofrequency ablation, and embolization for hepatocellular carcinoma: a national survey of 54,145 patients. J Gastroenterol 2012;47:1125-33.
51. Lu CC, Chiu CC, Wang JJ, et al. Volume-outcome associations after major hepatectomy for hepatocellular carcinoma: a nationwide Taiwan study. J Gastrointest Surg 2014;18:1138-45.
52. Lu LC, Shao YY, Kuo RN, et al. Hospital volume of percutaneous radiofrequency ablation is closely associated with treatment outcomes for patients with hepatocellular carcinoma. Cancer 2013;119:1210-6.
53. Amini N, Ejaz A, Spolverato G, et al. Temporal trends in liver-directed therapy of patients with intrahepatic cholangiocarcinoma in the United States: a population-based analysis. J Surg Oncol 2014;110:163-70.
54. Tan JC, Coburn NG, Baxter NN, et al. Surgical management of intrahepatic cholangiocarcinoma--a population-based study. Ann Surg Oncol 2008;15:600-8.
55. Salgia RJ, Singal AG, Fu S, et al. Improved post-transplant survival in the United States for patients with cholangiocarcinoma after 2000. Dig Dis Sci 2014;59:1048-54.
56. Kneuertz PJ, Kao LS, Ko TC, et al. Regional disparities affect treatment and survival of patients with intrahepatic cholangiocarcinoma--a Texas Cancer Registry analysis. J Surg Oncol 2014;110:416-21.
57. Berrino F, Estève J, Coleman MP. Basic issues in the
estimation and comparison of cancer patient survival. In: Berrino F, Sant M, Verdecchia A, et al. editors. Survival of cancer patients in Europe: the EUROCARE study (IARC Scientific Publications No 132). Lyon: International Agency for Research on Cancer (WHO), 1995:1-14.
58. Robinson D, Sankila R, Hakulinen T, et al. Interpreting international comparisons of cancer survival: the effects of incomplete registration and the presence of death certificate only cases on survival estimates. Eur J Cancer 2007;43:909-13.
59. Walters S, Maringe C, Coleman MP, et al. Lung cancer survival and stage at diagnosis in Australia, Canada, Denmark, Norway, Sweden and the United Kingdom: a population-based study, 2004-2007. Thorax 2013;68:551-64.
60. Maringe C, Walters S, Rachet B, et al. Stage at diagnosis and colorectal cancer survival in six high-income countries: a population-based study of patients diagnosed during 2000-7. Acta Oncol 2013;52:919-32.
61. Allemani C, Matsuda T, Di Carlo V, et al. Global surveillance of trends in cancer survival 2000–14 (CONCORD-3): analysis of individual records for 37,513,025 patients diagnosed with one of 18 cancers from 322 population-based registries in 71 countries. Lancet 2018;391:1023-75.
62. International Agency for Research and Cancer. Some traditional herbal medicines, some mycotoxins, naphthalene and styrene (IARC Monographs on the Evaluation of Carcinogenic Risks to Humans Volume 82). Lyon, France: IARC, 2002:171-300.
63. London WT, McGlynn KA. Liver cancer. In: Schottenfeld D, Fraumeni JF. editors. Cancer Epidemiology and Prevention. Oxford: Oxford University Press, 2006:763-86.
64. Anon. European Code Against Cancer. Lyon: International Agency for Research on Cancer, 2014.
doi: 10.21037/ace.2019.07.01Cite this article as: Bannon F, Di Carlo V, Harewood R, Engholm G, Ferretti S, Johnson CJ, Aitken JF, Marcos-Gragera R, Bonaventure A, Gavin A, Huws D, Coleman MP, Allemani C; CONCORD Working Group. Survival trends for primary liver cancer, 1995–2009: analysis of individual data for 578,740 patients from 187 population-based registries in 36 countries (CONCORD-2). Ann Cancer Epidemiol 2019;3:6.

Supplementary
Table S1 Adults (15–99 years) diagnosed with hepatocellular carcinoma or cholangiocarcinoma* during 1995–2009 in 36 countries: distribution (no., %) by sub-site
Region Total§ No.
Morphology†
Topography††
LiverIntrahepatic bile
ducts§
Hepatocellular§
Cholangiocarcinoma§
LiverIntrahepatic bile
ducts§ HCC CC HCC CC
No. % No. % No. % No. % % % % %
America (Central and South)
Colombia (Cali) 458 241 52.6 156 34.1 319 69.7 139 30.3 75.5 9.7 0.0 89.9
America (North)
Canada* 11,902 8,777 73.7 2,277 19.1 9,919 83.3 1,983 16.7 88.5 4.6 0.0 91.6
US registries 140,046 106,667 76.2 21,066 15.0 123,488 88.2 16,558 11.8 86.4 5.2 0.0 88.4
Asia
Chinese registries 10,569 6,870 65.0 800 7.6 9,920 93.9 649 6.1 69.1 2.7 2.0 81.7
Indonesia (Jakarta) 85 63 74.1 <5 4.7 83 97.6 <5 2.4 75.9 2.4 0.0 100.0
Japanese registries 19,882 17,483 87.9 1,648 8.3 18,228 91.7 1,654 8.3 95.9 0.8 0.4 90.7
Korea* 160,125 134,561 84.0 18,036 11.3 138,431 86.5 21,694 13.5 97.2 1.0 0.0 76.9
Malaysia (Penang) 814 615 75.6 110 13.5 728 89.4 86 10.6 82.8 6.5 14.0 73.3
Mongolia* 422 119 28.2 <5 0.9 421 99.8 <5 0.2 28.3 0.7 0.0 100.0
Taiwan* 99,383 89,109 89.7 7,941 8.0 91,659 92.2 7,724 7.8 97.2 0.8 0.0 93.0
Thai registries 1,614 406 25.2 1,088 67.4 674 41.8 940 58.2 60.2 30.4 0.0 93.9
Turkey (Izmir) 736 588 79.9 90 12.2 625 84.9 111 15.1 94.1 0.2 0.0 80.2
Europe
Austria* 9,184 6,162 67.1 1,656 18.0 7,309 79.6 1,875 20.4 84.3 3.8 0.0 73.5
Belgium* 2,958 2,163 73.1 607 20.5 2,341 79.1 617 20.9 92.4 1.2 0.0 94.0
Denmark* 3,519 1,838 52.2 945 26.9 3,157 89.7 362 10.3 58.1 20.7 1.4 80.1
Estonia* 609 277 45.5 154 25.3 433 71.1 176 28.9 64.0 3.9 0.0 77.8
Finland* 3,434 2,086 60.7 818 23.8 2,720 79.2 714 20.8 76.7 6.3 0.0 90.8
French registries 6,500 5,337 82.1 847 13.0 5,777 88.9 723 11.1 92.4 2.4 0.0 97.6
German registries 7,034 4,996 71.0 1,241 17.6 5,580 79.3 1,454 20.7 89.5 1.8 0.0 78.3
Ireland* 811 524 64.6 226 27.9 568 70.0 243 30.0 92.3 1.8 0.0 88.9
Italian registries 24,401 20,100 82.4 2,069 8.5 22,851 93.6 1,550 6.4 88.0 3.1 0.0 87.4
Malta* 66 24 36.4 19 28.8 45 68.2 21 31.8 53.3 4.4 0.0 81.0
Netherlands* 3,557 2,674 75.2 647 18.2 2,974 83.6 583 16.4 89.9 2.6 0.0 97.8
Norway* 1,583 1,099 69.4 376 23.8 1,194 75.4 389 24.6 92.0 0.0 0.0 96.7
Polish registries 5,553 2,749 49.5 1,607 28.9 4,926 88.7 627 11.3 55.6 22.0 1.3 83.1
Portugal* 3,285 2,337 71.1 580 17.7 2,827 86.1 458 13.9 82.7 7.2 0.0 82.1
Romania (Cluj) 142 106 74.6 28 19.7 112 78.9 30 21.1 94.6 2.7 0.0 83.3
Russia (Arkhangelsk) 119 55 46.2 29 24.4 98 82.4 21 17.6 56.1 11.2 0.0 85.7
Slovakia* 125 81 64.8 38 30.4 86 68.8 39 31.2 94.2 2.3 0.0 92.3
Slovenia* 1,086 758 69.8 218 20.1 877 80.8 209 19.2 86.4 5.7 0.0 80.4
Spanish registries 7,811 6,250 80.0 987 12.6 6,813 87.2 998 12.8 91.7 2.5 0.0 82.1
Sweden* 7,044 4,005 56.9 2,245 31.9 7,044 100.0 0 0.0 56.9 31.9
Swiss registries 3,095 2,536 81.9 403 13.0 2,717 87.8 378 12.2 93.3 2.2 0.0 91.0
United Kingdom* 29,912 15,159 50.7 13,143 43.9 16,180 54.1 13,732 45.9 93.7 1.0 <0.1 94.5
Oceania
Australian registries 8,845 6,316 71.4 2,145 24.3 6,625 74.9 2,220 25.1 95.3 0.6 0.0 94.8
New Zealand* 2,031 1,403 69.1 576 28.4 1,443 71.0 588 29.0 97.2 0.7 0.0 96.3§, microscopically confirmed (see text); *, data with 100% coverage of the national population;
†, hepatocellular carcinoma: ICD-O-3 morphology codes
8170–8175; cholangiocarcinoma: 8050, 8140–8141, 8160–8161, 8260, 8440, 8480–8500 and 8570–8572; ††
, liver: ICD-O-3 topography code C22.0; intrahepatic bile ducts C22.1.


![Parenchymal-sparing liver surgery in patients with ......stage have worse survival than those treated with chemotherapy alone[10]. Although maximizing the amount of residual liver](https://img.dokumen.tips/doc/110x75/60043be60f371959d82864d5/parenchymal-sparing-liver-surgery-in-patients-with-stage-have-worse-survival.jpg)