Embed Size (px)
Citation preview

Survey on statistical value 2013
Statistics Sweden (November 2013) Process Department Box 24 300 SE-104 51 Stockholm Inquiries Frank Weideskog, +46 8 506 946 89 [email protected]
1

Contents Summary ............................................................................................................................................... 3
1.1 Background ................................................................................................................................. 4
1.2 Objectives .................................................................................................................................... 4
1.3 Human resources used ................................................................................................................ 4
1.4 Description of the operation .......................................................................................................... 4
2 The Swedish Intrastat system............................................................................................................ 5
2.1 General description ..................................................................................................................... 5
2.2 Description of the present Swedish statistical value ............................................................. 6
2.2.1 Definitions ..................................................................................................................... 6
2.2.2 Earlier surveys of statistical value at Statistics Sweden ............................................... 7
2.2.3 Mapping and evaluation of the current conversion factors .................................................. 8
3 Project activities ................................................................................................................................. 9
3.1 Swedish survey on statistical value 2013 ............................................................................. 9
3.1.1 Procedure ............................................................................................................................ 9
3.1.2 Data in the survey .............................................................................................................. 11
3.1.3 Estimating conversion factors for statistical value ............................................................. 13
3.1.4 Results ............................................................................................................................... 16
3.2 Using supplementary auxiliary information from the Customs ................................................. 18
for the deliveries to the Swedish National Accounts department ................................................... 18
3.2.1 Deliveries of data to the Swedish National Accounts department ..................................... 19
4 Possible future development areas at Statistics Sweden .............................................................. 22
Appendix 1a ................................................................................................................................ 23
Terms of delivery (Incoterms) ..................................................................................................... 23
Appendix 1b ................................................................................................................................ 25
Appendix 2a ................................................................................................................................ 26
Appendix 2b ................................................................................................................................ 27
Appendix 3 .................................................................................................................................. 28
2

Summary
Statistical value is reported to the EU and used for publication of Swedish statistics on imports and exports of commodities. Enterprises required providing data in the Swedish Intrastat system today, for reasons of simplicity, report monthly data on invoiced value, but not monthly data on statistical value. Instead Statistics Sweden (SCB) estimates statistical value based on a specific sample survey from which conversion factors are calculated. The conversion factors used today are not new, and harmonization and quality standards of Eurostat have been made more stringent. These facts together with the requirement for improvements to national economic statistics makes implementation of the survey on statistical value important. This project deals mainly with a comprehensive survey of statistical value in Intrastat. Invoiced value refers to the amount invoiced inclusive of freight and insurance costs in cases where these are included in the invoice as set out in the terms of delivery. Statistical value is the value of a commodity inclusive of freight and insurance up to the Swedish border. For simplicity, only invoiced value is reported in the Intrastat system, whilst Eurostat requires delivery of statistical value. This survey aims at calculating the conversion factors (statistical value/invoiced value) which can then be used for estimating statistical value. Three surveys of this kind have been carried out earlier in Sweden and the survey was last carried out in 2007. The survey of 2013 covers compulsory enterprises with a threshold value corresponding to SEK 80 million (EUR 8.9 million) for arrivals and SEK 150 million (EUR 16.7) for dispatches. The threshold values should correspond to 70 percent of total arrivals and dispatches. This survey, however, has been supplemented by a selection of important enterprises with lower annual values than the threshold values, which should submit data on a voluntary basis. In this study Intrastat data for March 2013 was used as reference data for the survey, and was then supplemented by data on statistical value, mode of transport, and terms of delivery. The unweighted response rate (in terms of PSI’s) for compulsory data providers is 77 percent of the arrivals and 79 percent of the dispatches. In comparison with previous studies of the statistical value at Statistics Sweden, the 2013 study is based on responses received from the largest number of respondents (2,115). The weighted response rate (in terms of value) for the mandatory companies amounted to 82 percent of arrivals and 87 percent of dispatches. Almost 60 percent of the total trade value is collected within the study of 2013. The corresponding figure for 2007 years study is 66 percent. The smaller proportion of collected trade in the last study can be related to the possibility to report by the principle “Simplified reporting where only the largest transactions need to be reported”.
About 82 percent of the possible country and commodity code combinations for arrivals will be estimated by the total conversion factor for arrivals, and 18 % of the combinations will be estimated at less aggregated levels. For dispatches, these values are 72 and 28 percent respectively. The proportions of codes that can be allocated by country level in the estimates (CN2 or CN8) now have increased to 10.5 percent of the codes. Earlier (according to the study in 2007) this share was 2.7 percent. This should mean that we now could have better reliability of the estimates at country level than before. The total ratio of the arrivals is larger than 1 and the total ratio of the dispatches is smaller than 1. LT, LV and LU show the largest ratios in the arrivals. In the dispatches CY, GR, IT and RO show the smallest ratios. CN2-codes 06, 07 and 08 seem to show the largest ratios of arrivals. In the dispatches the lowest ratios can be found in chapter 28, 39, 48 and 58. As today we have access to voluntary reported invoice values on the import side of Extrastat. These data could be used to convert the statistical value in invoice value in Extrastat for the deliveries to the National Account department (NA). Moreover, we receive this data monthly from as many as 18,000 import companies, and the conversion factors could be based on much more data than the 2,100 Intrastat companies that we have today based on a study not very often made. In the same time our conversion factors here are based on Intrastat trade. After having studied our particular data and its quality in terms of reliability, we can suggest to utilize current Extrastat data monthly, instead of using fixed factors from Intrastat in the calculations of invoice value for the quarterly NA deliveries of the import figures.
3

1 Introduction
1.1 Background Data in the Swedish Intrastat system are collected on invoiced value instead of on statistical value, for reasons of simplicity. The invoiced value collected is then converted to statistical value using special conversion factors. The conversion factors are calculated using a sample survey carried out by Statistics Sweden. This survey was last carried out during the spring of 2007. Member states that choose to carry out sample surveys instead of continuous monthly collection of statistical value, in order to remain up-to-date, should carry out the study at least every other year. The conversion factors currently used are old. It is therefore time to carry out the study again.
1.2 Objectives
The overall objective of this project is to improve the accuracy of the conversion factors and to update them to enable the calculation of accurate statistical values. Another objective is to develop estimations for the statistical value of the underlying commodity groups. There are a large number of chapters for which there is not sufficient information at the current time for estimations via chapter-based conversion factors. "Rough" estimates are done instead for some of the chapters, using total flow-specific conversion factors.
1.3 Human resources used
The project began in January 2013 and was completed in November 2013. The work was carried out by Frank Weideskog (project leader) along with Can Tongur from the Method unit Enterprises and Organisations, Jennie Bergman, Ebba Hartzell, Kevin He and Runo Samuelsson at the Foreign Trade and Industry Indicators unit, Marie George at the Collection unit and Tord Axelsson from the IT department.
1.4 Description of the operation
The project can be divided into two different stages. Stage 1 refers to the period January 2013 – June 2013 and stage 2 refers to August 2013 – November 2013. An introductory administrative briefing meeting was held, followed by 10 project group meetings. During the project control meetings were also held between the project leader and the customer (head of Foreign Trade and Industry Indicators unit at Statistics Sweden).
The following main tasks have been carried out in the project: Outline and evaluate the conversion factors, and criteria for these, that are currently used in the Swedish estimation system for Intrastat.
Carry out a survey in which statistical values are collected from all larger respondents, combined with a sample of smaller enterprises.
Develop a control system for checking the collected survey data.
4

Investigate the possibility of using supplementary auxiliary information from the Customs for
improving the deliveries to the Swedish National Account department Improve and assure the quality of the conversion factors.
Improve the methods to provide the possibility of estimating the statistical value of more
commodity groups at lower levels than those currently used. Implement new routines and follow-up procedures.
Carry out the necessary changes to the national estimation system for Intrastat.
The project seeks to implement new and improved methods for estimating conversion factors and, thereby, the production of more accurate statistical values. Facilitate more reliable estimates at lower commodity group levels and indirectly contribute to making it possible to estimate the statistical value at company level.
2 The Swedish Intrastat system
2.1 General description
The Intrastat survey is a monthly collection of arrivals and dispatches of commodities within the European Union (EU). It takes the form of a ‘cut-off’ survey, in which 97 percent of the dispatches on goods and 95 percent of the arrivals on goods within the EU should be included and the rest should be estimated. From 2009, Sweden has threshold values of SEK 4.5 million (EUR 484,000) for both arrivals and dispatches. Coverage in the Swedish Intrastat system in 2012 (last figures) is 96.3 percent in the arrivals and 98.2 percent in the dispatches. The Intrastat threshold is defined as a continuous twelve-monthly value based on VAT data. An enterprise that is not required to report information can only be identified as such after delivery of VAT details from the Swedish National Tax Board. The enterprise will then be notified of its obligation to report and will receive information on what this involves.
The Intrastat data to be submitted are member state of arrivals/dispatches, nature of the transaction, statistical commodity code, supplementary unit, net mass and invoice value. It should be noted that supplementary unit and net mass are not required for some commodity codes.
Information can be submitted on a paper form, or via electronic media such as IDEP (Intrastat Data Entry Package). About 90 percent of the providers of statistical information (PSIs) currently report Intrastat electronically today. The last day for reporting is 10 working days after the end of the accounting period (month), in accordance with a specific timetable. Companies reporting via the electronic media have however one extra day to submit their information.
Intrastat data are expected from about 14,000 PSIs, or 12,000 individual companies, which are together responsible for more than 400,000 commodity items each month. Every year, about 72,000 VAT registered Swedish enterprises make some form of commodity transaction with another EU Member State, and 48,000 of these have regular EU trade every month. VAT data are supplied to Statistics Sweden from the National Tax Board once a week.
5

Aggregated Intrastat data are delivered to Eurostat about 27 days after the reporting month and detailed Intrastat data about 57 days after.
2.2 Description of the present Swedish statistical value
This section gives an overview of the present statistical value used in the Swedish Intrastat system. The statistical value is thus collected not on a monthly basis in the Swedish Intrastat system, but calculated from a sample survey based on earlier reported data for a given Intrastat month. The survey was last carried out in 2007.
2.2.1 Definitions
A. Definition of the requirement to submit data for the survey: Intrastat is based on international regulations (Commission Regulation no. 1982/2004, Regulation (EC) No. 638/2004 of the European Parliament and of the Council, and Statistics Sweden's national regulations (SCB-FS 2004-23). According to the regulations, each member state shall report statistical value to Eurostat on a monthly basis. In order to simplify collection for data providers, since 1997 Sweden has collected invoice value on a monthly basis, and then a sample survey where the statistical values are collected. The requirement to submit this data is laid down in Section 3 of SCB's Code of Statutes (SCB-FS 2004:23): ”Those obliged to provide data under Section 1, with annual dispatches of SEK 150 million (EUR 16.7 million) and annual arrivals of at least SEK 80 million (Euro 8.9 million), shall when requested by Statistics Sweden provide additional information for an earlier reported month on statistical values for the reported commodities.” The threshold values in Section 3 above follow the Eurostat User Guide that the survey should concern enterprises which in total make up 70 % of total arrivals and dispatches in Intrastat. B. Definition of the supplementary collection variables: The survey is based on a previously reported Intrastat period for which the information is to be supplemented with data on statistical value and variables such as terms of delivery and mode of transport. Invoiced value and statistical value Invoiced value refers to the amount invoiced inclusive of freight and insurance costs in cases where these are included in the invoice as set out in the terms of delivery. Statistics Sweden then converts, using special conversion factors, invoiced values into statistical values, which is the value of the commodity inclusive of freight and insurance up to the Swedish border. Concerning arrivals, statistical value = purchasing price + freight and insurance costs up to the Swedish border (i.e. CIF terms of delivery). For dispatches, statistical value = sales price + freight and insurance cost up to Swedish border (i.e. FOB terms of delivery). Statistical value includes freight and insurance costs, but only up to the Swedish border. Statistical value is calculated on the basis of the enterprise's terms of delivery. In such cases where the reporting enterprise bears the whole of the freight and insurance cost as per the terms of delivery, the enterprise must deduct that part of the cost concerning transport after the commodity has arrived (arrivals) and left (dispatches) the Swedish border.
6

The following simple rules of thumb can be applied according to freight and insurance costs connected to the invoice value/statistical value:
• If freight and insurance are not included in the invoiced value: statistical value > invoiced value
• If freight and insurance are included in the invoiced value:
statistical value < invoiced value
• If freight and insurance are included in the invoiced value, but only up to the Swedish border: statistical value = invoiced value.
Terms of delivery
The different terms of delivery used are specified in the Incoterm Rules according to the International Chamber of Commerce. The aim of Incoterms is to standardize the application of a number of international rules for the interpretation of the most common foreign trade terms, and terms of delivery in foreign trade. Uncertainty over the interpretations of such terms in different countries can thus be avoided or at least significantly reduced. It should be emphasized that the scope of Incoterms applies to the rights and obligations of the parties to a purchasing contract with respect to deliveries of sold commodities, which are physical products. The terms of delivery used are:
CFR, Cost and Freight CIF, Cost, Insurance, Freight CIP, Carriage and Insurance Paid To CPT, Carriage Paid To DAP, Delivered At Place DAT, Delivered At Terminal DDP, Delivered Duty Paid EXW, Ex Works FAS, Free Alongside Ship FCA, Free Carrier FOB, Free On Board A more detailed description of the different terms of delivery is given in Appendix 1a. Mode of transport The mode of transport, being the active mode of transport over the Swedish border, is a variable which can provide useful information when calculating the statistical value. The codes are specified in Appendix 1b.
2.2.2 Earlier surveys of statistical value at Statistics Sweden In order to simplify the process for data providers, and instead of continually collecting monthly data on statistical value, a sample survey was introduced in Sweden to calculate conversion factors between the statistical value and the invoice value. The threshold values applied to these providers required for reporting in this survey (see section 2.1.1) on statistical value in Sweden where in previous studies 60 million of SEK for arrivals (6.7 million EUR), and 100 million of SEK for dispatches (11.1 million EUR). In the study conducted in 2013 the thresholds have been increased to 80 million of SEK for arrivals (8.9 million EUR), and 150 million of SEK for dispatches (16.7 million EUR). These thresholds should correspond to 70 percent of total arrivals and dispatches in the Swedish Intrastat
7

trade. This survey was carried out the first time in 1997 and last time in 2007. In the 2007 and 2013 surveys both mandatory PSI’s and optional PSI’s were included in the surveys. Table 1: Previous surveys of statistical value conducted by Statistics Sweden
Previous surveys
Reference month Number of companies in the survey Response rate (PSI’s)
1997 August 1,189 36 % 2000 March 1,389 75 % 2007 March 3,304 (including optional PSI’s) 78 % (mandatory)
2.2.3 Mapping and evaluation of the current conversion factors
At present the following estimation levels are used for the conversion factors for different flows (arrivals/dispatches): - Total level - Chapter level - Commodity code level (CN8) The chapters and CN8-codes can then be distributed by partner country.
In Table 2, it can be seen that 74 percent of the possible country and commodity code combinations for arrivals will be estimated by the total conversion factor for arrivals, and 26 % of the combinations will be estimated at less aggregated levels. For dispatches, these values are 72 and 28 percent respectively. In total almost 8 percent of all possible codes were estimated at the commodity code level or the combination, commodity code and country code. Table 2 Distribution of estimation levels in the frame table
Level of estimation Arrivals Percent Dispatches Percent CN8 & Country 1,826 0.7 2,421 0.9 Chapter & Country 107 0.0 3,238 1.1 CN8 17,957 6.5 19,967 7.3 Chapter 51,564 18.8 50,117 18.3 Total level 202,974 74.0 198,685 72.4 Sum of total 274,428 100 % 274,428 100 %
8
3 Project activities
This chapter describes the main activities of the project. The most widespread activity described in this project report is the survey on statistical value 2013. Improving internal deliveries from the Foreign Trade Unit to the Swedish National Accounts are also covered in this section.
3.1 Swedish survey on statistical value 2013 This section describes the survey on statistical values for 2013. The reference period for the survey is March 2013.
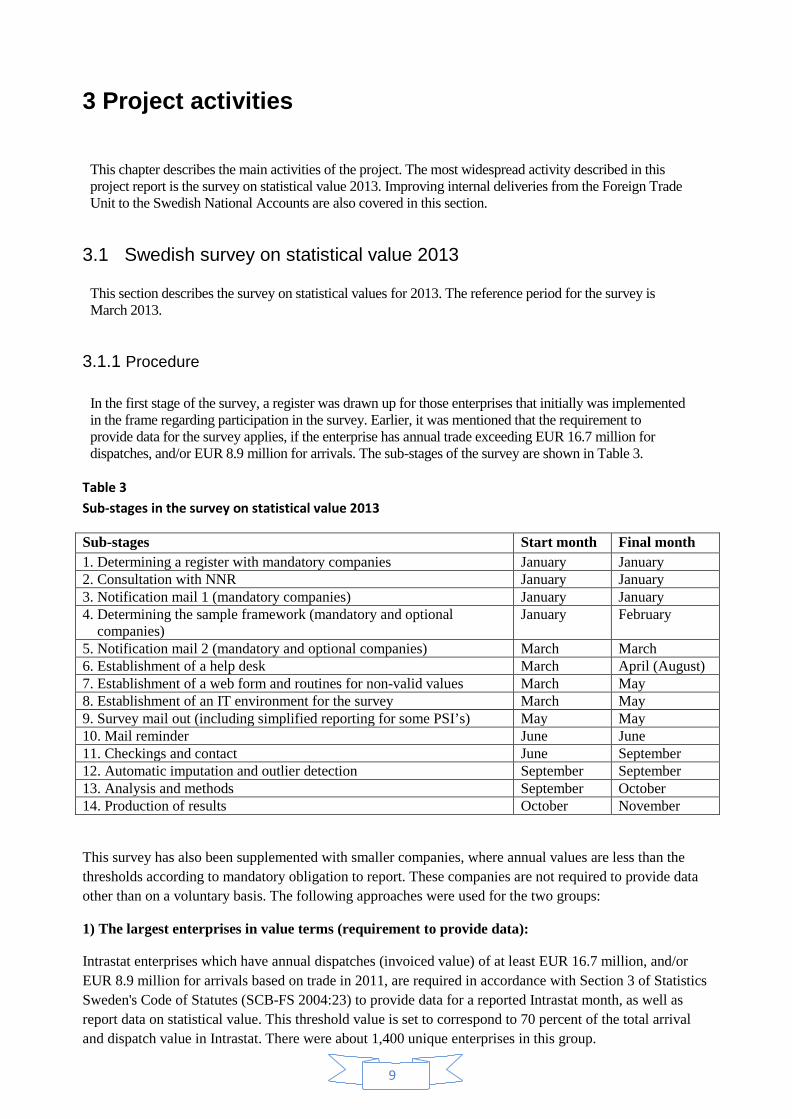
3.1.1 Procedure In the first stage of the survey, a register was drawn up for those enterprises that initially was implemented in the frame regarding participation in the survey. Earlier, it was mentioned that the requirement to provide data for the survey applies, if the enterprise has annual trade exceeding EUR 16.7 million for dispatches, and/or EUR 8.9 million for arrivals. The sub-stages of the survey are shown in Table 3.
Table 3 Sub-stages in the survey on statistical value 2013
Sub-stages Start month Final month 1. Determining a register with mandatory companies January January 2. Consultation with NNR January January 3. Notification mail 1 (mandatory companies) January January 4. Determining the sample framework (mandatory and optional companies)
January February
5. Notification mail 2 (mandatory and optional companies) March March 6. Establishment of a help desk March April (August) 7. Establishment of a web form and routines for non-valid values March May 8. Establishment of an IT environment for the survey March May 9. Survey mail out (including simplified reporting for some PSI’s) May May 10. Mail reminder June June 11. Checkings and contact June September 12. Automatic imputation and outlier detection September September 13. Analysis and methods September October 14. Production of results October November
This survey has also been supplemented with smaller companies, where annual values are less than the thresholds according to mandatory obligation to report. These companies are not required to provide data other than on a voluntary basis. The following approaches were used for the two groups:
1) The largest enterprises in value terms (requirement to provide data):
Intrastat enterprises which have annual dispatches (invoiced value) of at least EUR 16.7 million, and/or EUR 8.9 million for arrivals based on trade in 2011, are required in accordance with Section 3 of Statistics Sweden's Code of Statutes (SCB-FS 2004:23) to provide data for a reported Intrastat month, as well as report data on statistical value. This threshold value is set to correspond to 70 percent of the total arrival and dispatch value in Intrastat. There were about 1,400 unique enterprises in this group.
9
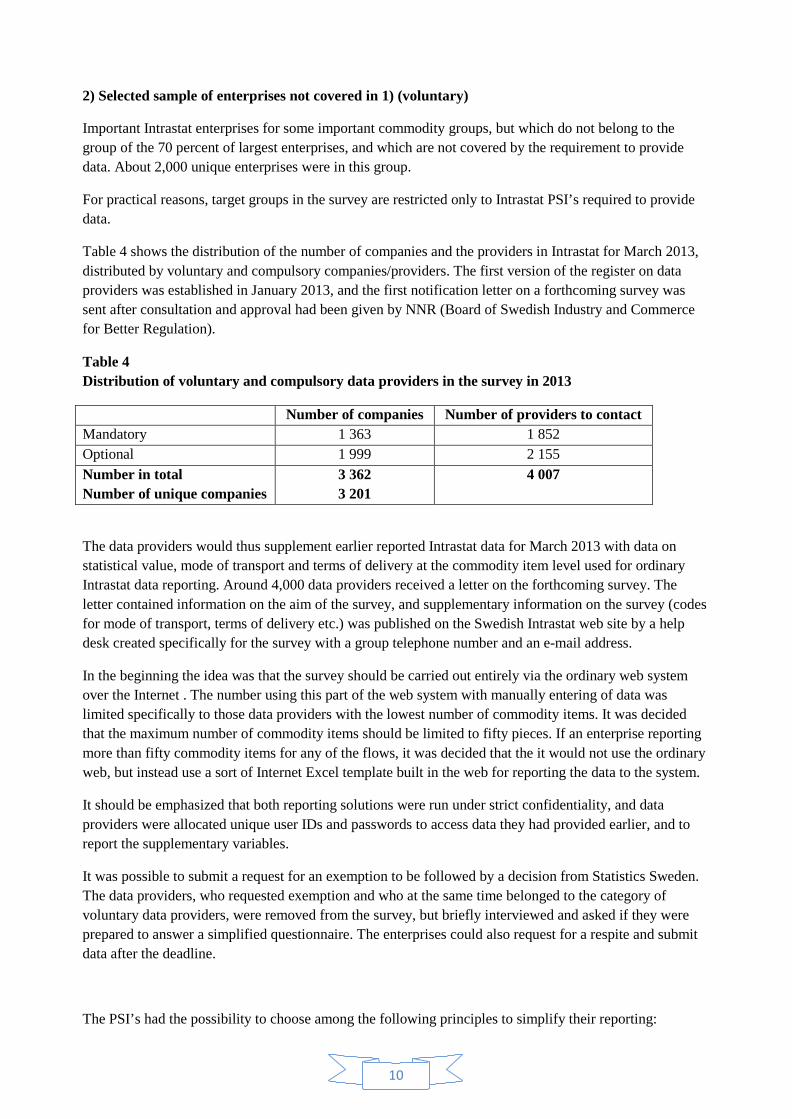
2) Selected sample of enterprises not covered in 1) (voluntary)
Important Intrastat enterprises for some important commodity groups, but which do not belong to the group of the 70 percent of largest enterprises, and which are not covered by the requirement to provide data. About 2,000 unique enterprises were in this group.
For practical reasons, target groups in the survey are restricted only to Intrastat PSI’s required to provide data.
Table 4 shows the distribution of the number of companies and the providers in Intrastat for March 2013, distributed by voluntary and compulsory companies/providers. The first version of the register on data providers was established in January 2013, and the first notification letter on a forthcoming survey was sent after consultation and approval had been given by NNR (Board of Swedish Industry and Commerce for Better Regulation).
Table 4 Distribution of voluntary and compulsory data providers in the survey in 2013
Number of companies Number of providers to contact Mandatory 1 363 1 852 Optional 1 999 2 155 Number in total Number of unique companies
3 362 3 201
4 007
The data providers would thus supplement earlier reported Intrastat data for March 2013 with data on statistical value, mode of transport and terms of delivery at the commodity item level used for ordinary Intrastat data reporting. Around 4,000 data providers received a letter on the forthcoming survey. The letter contained information on the aim of the survey, and supplementary information on the survey (codes for mode of transport, terms of delivery etc.) was published on the Swedish Intrastat web site by a help desk created specifically for the survey with a group telephone number and an e-mail address.
In the beginning the idea was that the survey should be carried out entirely via the ordinary web system over the Internet . The number using this part of the web system with manually entering of data was limited specifically to those data providers with the lowest number of commodity items. It was decided that the maximum number of commodity items should be limited to fifty pieces. If an enterprise reporting more than fifty commodity items for any of the flows, it was decided that the it would not use the ordinary web, but instead use a sort of Internet Excel template built in the web for reporting the data to the system.
It should be emphasized that both reporting solutions were run under strict confidentiality, and data providers were allocated unique user IDs and passwords to access data they had provided earlier, and to report the supplementary variables.
It was possible to submit a request for an exemption to be followed by a decision from Statistics Sweden. The data providers, who requested exemption and who at the same time belonged to the category of voluntary data providers, were removed from the survey, but briefly interviewed and asked if they were prepared to answer a simplified questionnaire. The enterprises could also request for a respite and submit data after the deadline.
The PSI’s had the possibility to choose among the following principles to simplify their reporting:
10

1) Reporting via a simplified questionnaire on delivery terms The PSI should report their estimated proportion EU trade per terms of delivery for March 2013. About 10 PSI’s used this reporting principle.
2) Simplified reporting where only the largest transactions need to be reported In order to decrease the number of observations to report, a routine with a company related threshold applied to coverage of at least 90 percent of the arrivals and dispatches of the 2011 EU trade was established. The required coverage for using this principle should then correspond to individual thresholds for each company for each flow. The principle could only be used for companies having at least 500 commodity rows to report. In total about 15 large PSI’s used this principle to report their figures.
3) Reporting of another (nearby) reference period than 201303 The principle was used by only one PSI.
After the deadline had passed, a reminder was sent out in the middle of June to those companies required to submit data, but which had not yet done so. Checking and imputation routines were developed during June-September, and a limited number of contacts were made with some of the data providers. During September and October the final stages of the work on analysis and methods were carried out and estimation levels decided on. The final phase of the survey was then carried out during October and November when final work on the project report was completed. 3.1.2 Data in the survey
In total the frame value in the survey of the actual collected in the ordinary Intrastat collection covers 82 percent of the arrivals and 83 percent of the dispatches. The proportion collected value in the survey related to actual collected Intrastat value for March 2013 at the time of first publication is 63 percent in the arrivals and 69 percent in the dispatches. In the same way for the same period, the percentage value collected in the survey related to the total Intrastat value (collected+ estimated trade) is 61 percent in the arrivals and 68 percent in the dispatches.
Tables 5 - 6 report the number of reported data providers and reported values in the survey, as well as their response rates, by media and type of data provider (mandatory/optional).
Table 5 Response rate in number and type of data providers by media
Media Mandatory Optional Total Web, arrivals 636 (77.2%) 392 (32.5 %) 1,028 (50.6 %) Web, dispatches 258 (80.9 %) 205 (32.2 %) 463 (48.5 %) Web, total 894 (78.2 %) 597 (32.4 %) 1,491 (50.0 %) Web_Excel, arrivals 347 (77.6 %) 14 (16.3 %) 361 (67.7 %) Web_Excel, dispatches 201 (76.7 %) 62 (27.3 %) 263 (53.8 %) Web_Excel, total 548 (77.3 %) 76 (24.3 %) 624 (61.1 %) Total, arrivals 983 (77.3 %) 406 (31.4 %) 1,389 (54.2 %) Total, dispatches 459 (79.0 %) 267 (30.9 %) 726 (50.3 %) Total, total 1,442 (77.9 %) 673 (31.2 %) 2,115 (52.8 %)
The response rate in the number of data providers in the survey amounted to a total of 53 percent, but what is perhaps most interesting to study is the response rate for compulsory data providers; for arrivals the
11
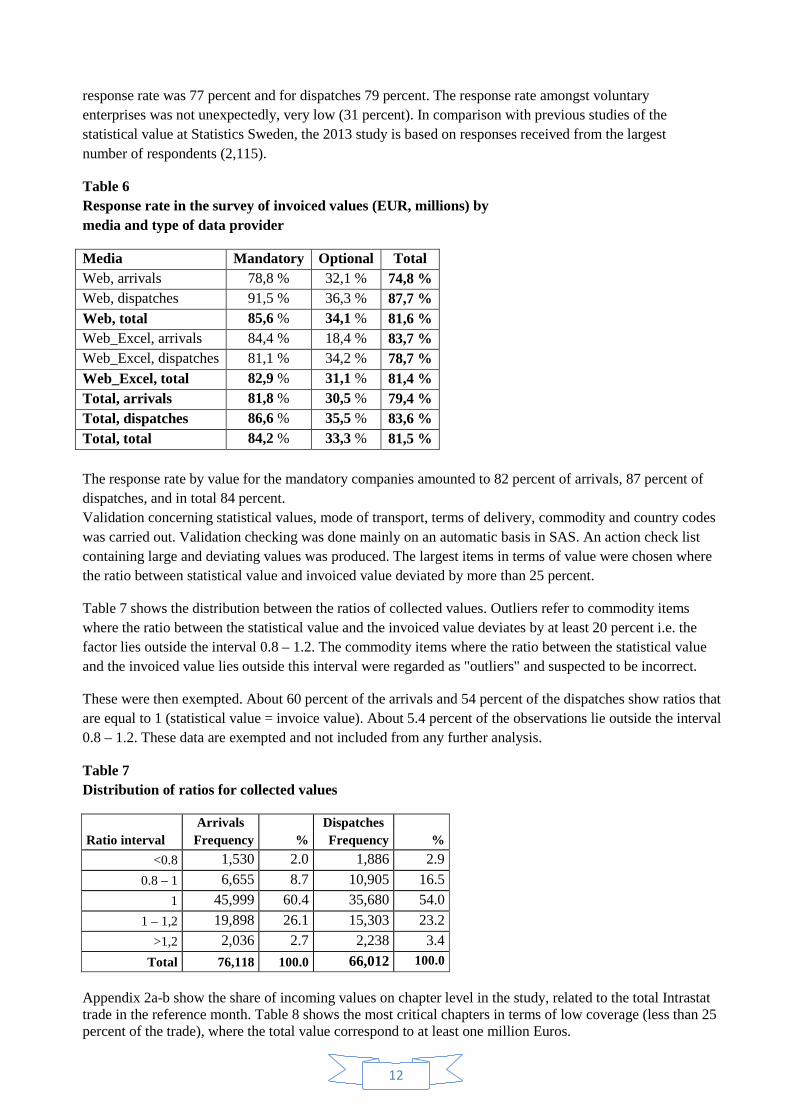
response rate was 77 percent and for dispatches 79 percent. The response rate amongst voluntary enterprises was not unexpectedly, very low (31 percent). In comparison with previous studies of the statistical value at Statistics Sweden, the 2013 study is based on responses received from the largest number of respondents (2,115).
Table 6 Response rate in the survey of invoiced values (EUR, millions) by media and type of data provider
Media Mandatory Optional Total Web, arrivals 78,8 % 32,1 % 74,8 % Web, dispatches 91,5 % 36,3 % 87,7 % Web, total 85,6 % 34,1 % 81,6 % Web_Excel, arrivals 84,4 % 18,4 % 83,7 % Web_Excel, dispatches 81,1 % 34,2 % 78,7 % Web_Excel, total 82,9 % 31,1 % 81,4 % Total, arrivals 81,8 % 30,5 % 79,4 % Total, dispatches 86,6 % 35,5 % 83,6 % Total, total 84,2 % 33,3 % 81,5 % The response rate by value for the mandatory companies amounted to 82 percent of arrivals, 87 percent of dispatches, and in total 84 percent. Validation concerning statistical values, mode of transport, terms of delivery, commodity and country codes was carried out. Validation checking was done mainly on an automatic basis in SAS. An action check list containing large and deviating values was produced. The largest items in terms of value were chosen where the ratio between statistical value and invoiced value deviated by more than 25 percent.
Table 7 shows the distribution between the ratios of collected values. Outliers refer to commodity items where the ratio between the statistical value and the invoiced value deviates by at least 20 percent i.e. the factor lies outside the interval 0.8 – 1.2. The commodity items where the ratio between the statistical value and the invoiced value lies outside this interval were regarded as "outliers" and suspected to be incorrect.
These were then exempted. About 60 percent of the arrivals and 54 percent of the dispatches show ratios that are equal to 1 (statistical value = invoice value). About 5.4 percent of the observations lie outside the interval 0.8 – 1.2. These data are exempted and not included from any further analysis.
Table 7 Distribution of ratios for collected values
Arrivals Dispatches Ratio interval Frequency % Frequency %
<0.8 1,530 2.0 1,886 2.9 0.8 – 1 6,655 8.7 10,905 16.5
1 45,999 60.4 35,680 54.0 1 – 1,2 19,898 26.1 15,303 23.2
>1,2 2,036 2.7 2,238 3.4 Total 76,118 100.0 66,012 100.0
Appendix 2a-b show the share of incoming values on chapter level in the study, related to the total Intrastat trade in the reference month. Table 8 shows the most critical chapters in terms of low coverage (less than 25 percent of the trade), where the total value correspond to at least one million Euros.
12

Table 8 Critical larger chapters according to a lower coverage
Flow CN2 Collected value in survey (1,000 EUR)
Total Intra value (1,000 EUR)
Coverage (%)
Arrivals 05 594 6,007 9.9 Arrivals 58 231 1,829 12.6 Arrivals 60 413 2 758 15.0 Arrivals 86 3,752 30,373 12.4 Arrivals 92 80 1,457 5.5 Dispatches 05 130 3,038 4.3 Dispatches 08 654 5,067 12.9 Dispatches 17 1,472 6,571 22.4 Dispatches 18 871 13,613 6.4 Dispatches 23 949 7,485 12.7 Dispatches 25 1,207 6,769 17.8 Dispatches 37 95 1,186 8.0 Dispatches 43 80 6,954 1.2 Dispatches 49 902 10,898 8.3 Dispatches 56 1,367 8,297 16.5 Dispatches 75 113 1,549 7.3 Dispatches 91 337 1,691 19.9
3.1.3 Estimating conversion factors for statistical value
This section covers the methodology applied to obtain the conversion factors for statistical value in the recent sample survey.
The conversion factor The target parameter of interest for this survey is the ratio gR between the surveyed statistical value gS
and the ordinarily collected invoiced value gF .
The ratio, or conversion factor, can be determined on several levels, i.e. in different domains/groupings g,
g
gg F
SR = , (i)
where each grouping belongs to a specific level of aggregation used in the foreign trade of goods survey, Gg ∈ . Since the survey of statistical value is sample based, the target parameter gR must be estimated in
most of the domains unless there is a complete enumeration in the sample of the corresponding grouping.
The goal of the survey of statistical value is to render conversion factors that may repeatedly, i.e. monthly, be used to convert the reported invoiced value to statistical value, hence the target statistic is the total monthly trade expressed in terms of statistical value.
13
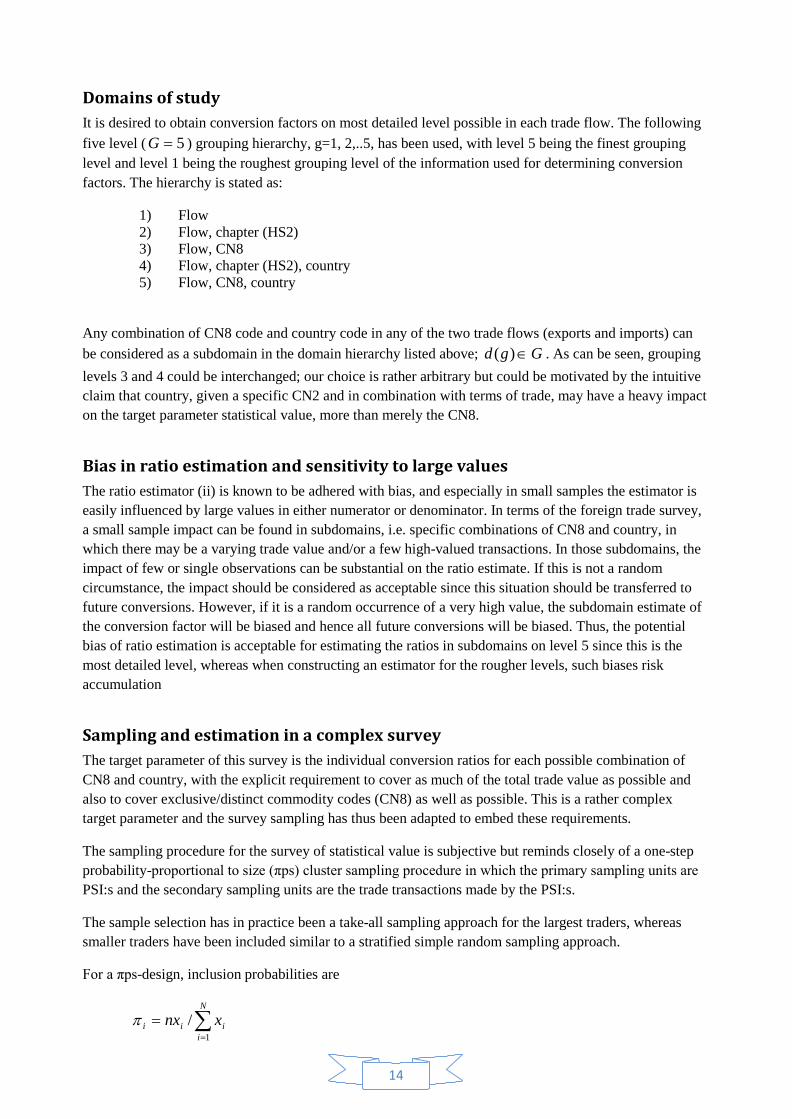
Domains of study It is desired to obtain conversion factors on most detailed level possible in each trade flow. The following five level ( 5=G ) grouping hierarchy, g=1, 2,..5, has been used, with level 5 being the finest grouping level and level 1 being the roughest grouping level of the information used for determining conversion factors. The hierarchy is stated as:
1) Flow 2) Flow, chapter (HS2) 3) Flow, CN8 4) Flow, chapter (HS2), country 5) Flow, CN8, country
Any combination of CN8 code and country code in any of the two trade flows (exports and imports) can be considered as a subdomain in the domain hierarchy listed above; Ggd ∈)( . As can be seen, grouping levels 3 and 4 could be interchanged; our choice is rather arbitrary but could be motivated by the intuitive claim that country, given a specific CN2 and in combination with terms of trade, may have a heavy impact on the target parameter statistical value, more than merely the CN8.
Bias in ratio estimation and sensitivity to large values The ratio estimator (ii) is known to be adhered with bias, and especially in small samples the estimator is easily influenced by large values in either numerator or denominator. In terms of the foreign trade survey, a small sample impact can be found in subdomains, i.e. specific combinations of CN8 and country, in which there may be a varying trade value and/or a few high-valued transactions. In those subdomains, the impact of few or single observations can be substantial on the ratio estimate. If this is not a random circumstance, the impact should be considered as acceptable since this situation should be transferred to future conversions. However, if it is a random occurrence of a very high value, the subdomain estimate of the conversion factor will be biased and hence all future conversions will be biased. Thus, the potential bias of ratio estimation is acceptable for estimating the ratios in subdomains on level 5 since this is the most detailed level, whereas when constructing an estimator for the rougher levels, such biases risk accumulation
Sampling and estimation in a complex survey The target parameter of this survey is the individual conversion ratios for each possible combination of CN8 and country, with the explicit requirement to cover as much of the total trade value as possible and also to cover exclusive/distinct commodity codes (CN8) as well as possible. This is a rather complex target parameter and the survey sampling has thus been adapted to embed these requirements.
The sampling procedure for the survey of statistical value is subjective but reminds closely of a one-step probability-proportional to size (πps) cluster sampling procedure in which the primary sampling units are PSI:s and the secondary sampling units are the trade transactions made by the PSI:s.
The sample selection has in practice been a take-all sampling approach for the largest traders, whereas smaller traders have been included similar to a stratified simple random sampling approach.
For a πps-design, inclusion probabilities are
∑=
=N
iiii xnx
1/π
14

where )( snEn = is the expected sample size and ix is the size variable available for each object in the frame (Särndal et al, 1992, p253). The ratio estimator is
∑=
=n
i ii
iig x
yR1 /
/ˆππ
(ii)
based on the gn sampled transactions belonging to a specific domain g, with iy and ix being the
surveyed statistical value and the corresponding invoiced value, respectively, for the transactions included in the sample survey. The corresponding inclusion probabilities iπ are due to the sample design. Since the sample contains objects both with π =1 and π <1, the estimator can be restated as
∑=
=gn
i ii
iig x
yR
1 //ˆππ (iii)
for the jn object that are sampled with certainty (i.e. the largest objects) and the in objects that are
sampled with uncertainty.
For rougher level groupings, i.e. aggregates of the finest-level groups, the conversion ratio can be presumed to vary more compared to within a specific combination of CN8 and country. In such a case, Särndal et al. (1992, p. 269) propose the separate ratio estimator
∑∑
∑=
=
==)(
1
1 ,
,
1 ,
,
,)(,ˆ
gd
gn
i gi
gi
n
i gi
gi
gFgdS g
g
F
S
tt
π
π, (iv)
which implies a weighing of subdomains )(gd belonging to same domain at any domain level Gg ∈ .
For the subdomains on the rougher levels (1-4) in the hierarchy, a slight modification of the estimator (iv) is proposed, in effect being a weighted arithmetic mean value of observations on level 5 that aggregate to the target subdomain )(gd on desired level. This is constructed as
1
1,
1
1,
1,
1,
1)(ˆ
−
==
=
=
==
×
= ∑∑∑
∑∑∑
g
g
g
g N
jmi
M
mmn
imi
n
imiN
jmi
M
mmgd FI
F
SFIr , (v)
where mI is an indicator function taking the value 1 if a level 5 subdomain m belongs to the target
subdomain )(gd of interest. This is a weighing of the conversion factor for all subdomains on level 5 that have reported statistical value and belong to the target subdomain, and the weight is the respective total trade observed on the specific level 5.
As an example, consider a specific CN2, denoted by )(gd . Trade transactions constitute combinations of CN8 and country, i.e. are a subdomain m on the finest level (=5) and at the same time, they belong to a specific CN2 due to the CN hierarchy. Each m is estimated as a ratio and is weighed with the subdomains’ total trade on level 5. The subdomain may or may not have been covered completely in the sampling.
15
These weighted ratios are then normalized to an average ratio of the obtained sample by division with the sum of weights, which the total trade of all the contributing domains m for the observed commodities in the sample survey.
Quality requirements in estimations Specific criteria have been set up to decide what level of estimation each reported item is sufficient for. Enterprises may have more than one commodity and a constant ratio, often one (=1) between statistical value and invoiced value. This may be due to terms of trade, or due to difficulties in separating the term of trade related cost for each item in their trade. These circumstances have been accounted for in estimations since such constant ratios may lack information for estimations on more detailed levels. On the lowest level 1, total arrivals or total dispatches, all observations are used for estimating the conversion.
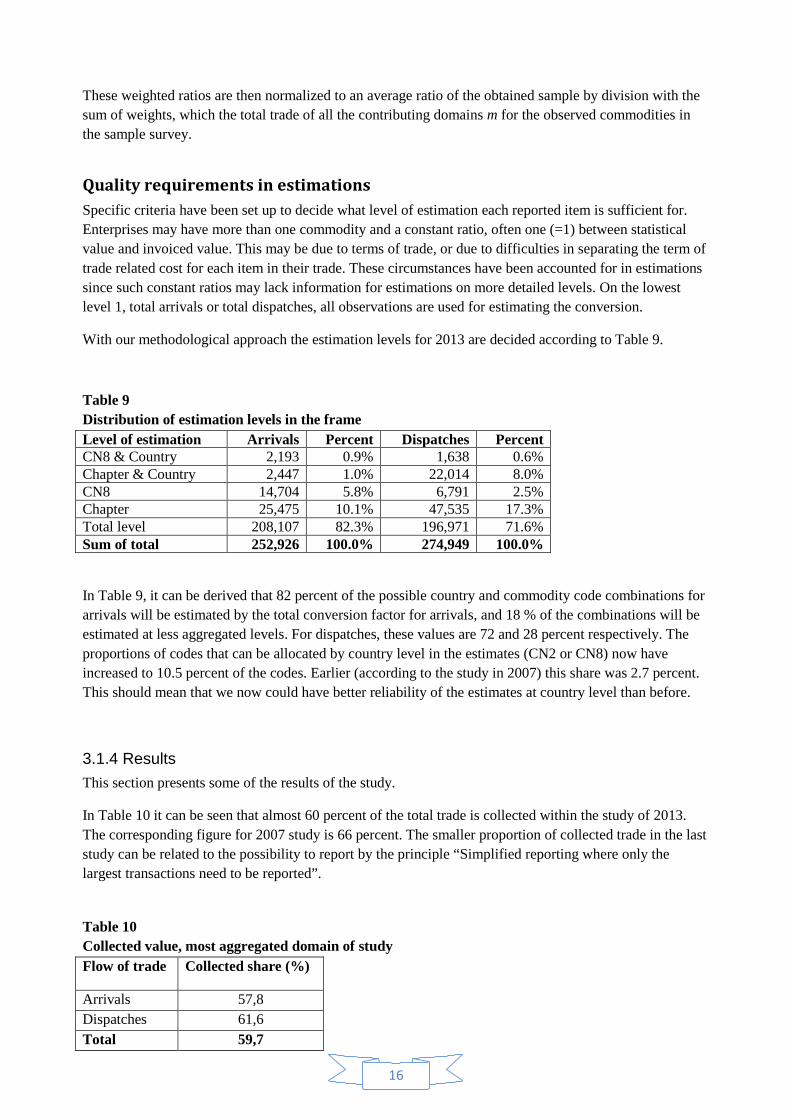
With our methodological approach the estimation levels for 2013 are decided according to Table 9. Table 9 Distribution of estimation levels in the frame Level of estimation Arrivals Percent Dispatches Percent CN8 & Country 2,193 0.9% 1,638 0.6% Chapter & Country 2,447 1.0% 22,014 8.0% CN8 14,704 5.8% 6,791 2.5% Chapter 25,475 10.1% 47,535 17.3% Total level 208,107 82.3% 196,971 71.6% Sum of total 252,926 100.0% 274,949 100.0%
In Table 9, it can be derived that 82 percent of the possible country and commodity code combinations for arrivals will be estimated by the total conversion factor for arrivals, and 18 % of the combinations will be estimated at less aggregated levels. For dispatches, these values are 72 and 28 percent respectively. The proportions of codes that can be allocated by country level in the estimates (CN2 or CN8) now have increased to 10.5 percent of the codes. Earlier (according to the study in 2007) this share was 2.7 percent. This should mean that we now could have better reliability of the estimates at country level than before.
3.1.4 Results This section presents some of the results of the study.
In Table 10 it can be seen that almost 60 percent of the total trade is collected within the study of 2013. The corresponding figure for 2007 study is 66 percent. The smaller proportion of collected trade in the last study can be related to the possibility to report by the principle “Simplified reporting where only the largest transactions need to be reported”.
Table 10 Collected value, most aggregated domain of study Flow of trade Collected share (%)
Arrivals 57,8 Dispatches 61,6 Total 59,7
16

The estimated ratios (conversion factors) at flow level are very close to the calculated factors in 2007 years study 1.00958 in the arrivals and 0.99538 in the dispatches (see Table 11).
Table 11 Total ratios Flow Ratio 2013 Ratio 2007
(current used) Arrivals 1.00958 1.01051 Dispatches 0.99538 0.99457 It is also interesting to determine the ratios for each term of delivery available in the sample to get a general view of the cost structure for enterprises. Estimating terms of delivery for the entire population and the non-response would be very difficult; population size for each term is unknown and the terms may vary both within and between commodities, countries and enterprises. If just sample ratios for each term of delivery were to be considered, ratios would be as follows in Table 12. In the table it can be seen that “FCA” shows the largest factor of arrival trade (1.025) and “DAP” seems to show the smallest factor of the dispatches (0.989).
Table 12 Sample ratio for terms of delivery Terms of delivery Ratio, arrivals Ratio, dispatches CFR 1.014 1.013 CIF 0.997 0.996 CIP 1.000 0.995 CPT 0.999 1.005 DAP 1.000 0.989 DAT 0.999 1.004 DDP 1.002 0.992 EXW 1.019 1.003 FAS *) *) FCA 1.025 1.001 FOB 1.009 1.000 *) Too few observations to display
Analysis of Tables 11-12 should be undertaken with care; in many cases, not much more than a few enterprises reported a specific term of delivery/mode of transport. Also, when enterprises have several arrivals or dispatches within a specific item in their declaration, the information collected will be biased towards the dominating terms of delivery and true ratio since this is how collection was performed.
Table 13 Ratios for mode of transport Mode of transport Ratio, arrivals Ratio, dispatches 1 = Sea transport 1.000 0.996 2 = Rail transport 1.004 0.989 3 = Road transport 1.007 0.996 4 = Air transport 1.008 0.999 5 = Postal consignment 1.001 1.000 7 = Fixed transport installations 1.026 1.000 8 = Inland waterway transport 1.000 n.a. 9 = Own propulsion 0.996 1.006
17
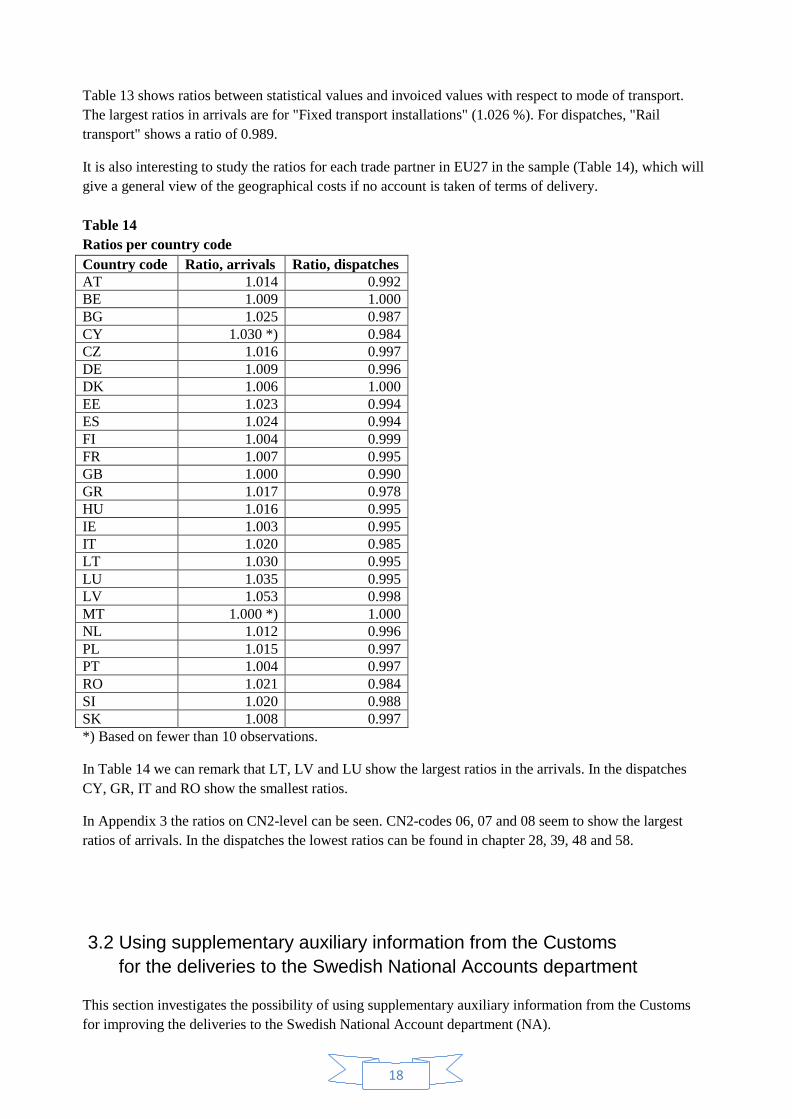
Table 13 shows ratios between statistical values and invoiced values with respect to mode of transport. The largest ratios in arrivals are for "Fixed transport installations" (1.026 %). For dispatches, "Rail transport" shows a ratio of 0.989.
It is also interesting to study the ratios for each trade partner in EU27 in the sample (Table 14), which will give a general view of the geographical costs if no account is taken of terms of delivery. Table 14 Ratios per country code Country code Ratio, arrivals Ratio, dispatches AT 1.014 0.992 BE 1.009 1.000 BG 1.025 0.987 CY 1.030 *) 0.984 CZ 1.016 0.997 DE 1.009 0.996 DK 1.006 1.000 EE 1.023 0.994 ES 1.024 0.994 FI 1.004 0.999 FR 1.007 0.995 GB 1.000 0.990 GR 1.017 0.978 HU 1.016 0.995 IE 1.003 0.995 IT 1.020 0.985 LT 1.030 0.995 LU 1.035 0.995 LV 1.053 0.998 MT 1.000 *) 1.000 NL 1.012 0.996 PL 1.015 0.997 PT 1.004 0.997 RO 1.021 0.984 SI 1.020 0.988 SK 1.008 0.997 *) Based on fewer than 10 observations.
In Table 14 we can remark that LT, LV and LU show the largest ratios in the arrivals. In the dispatches CY, GR, IT and RO show the smallest ratios.
In Appendix 3 the ratios on CN2-level can be seen. CN2-codes 06, 07 and 08 seem to show the largest ratios of arrivals. In the dispatches the lowest ratios can be found in chapter 28, 39, 48 and 58.
3.2 Using supplementary auxiliary information from the Customs for the deliveries to the Swedish National Accounts department
This section investigates the possibility of using supplementary auxiliary information from the Customs for improving the deliveries to the Swedish National Account department (NA).
18
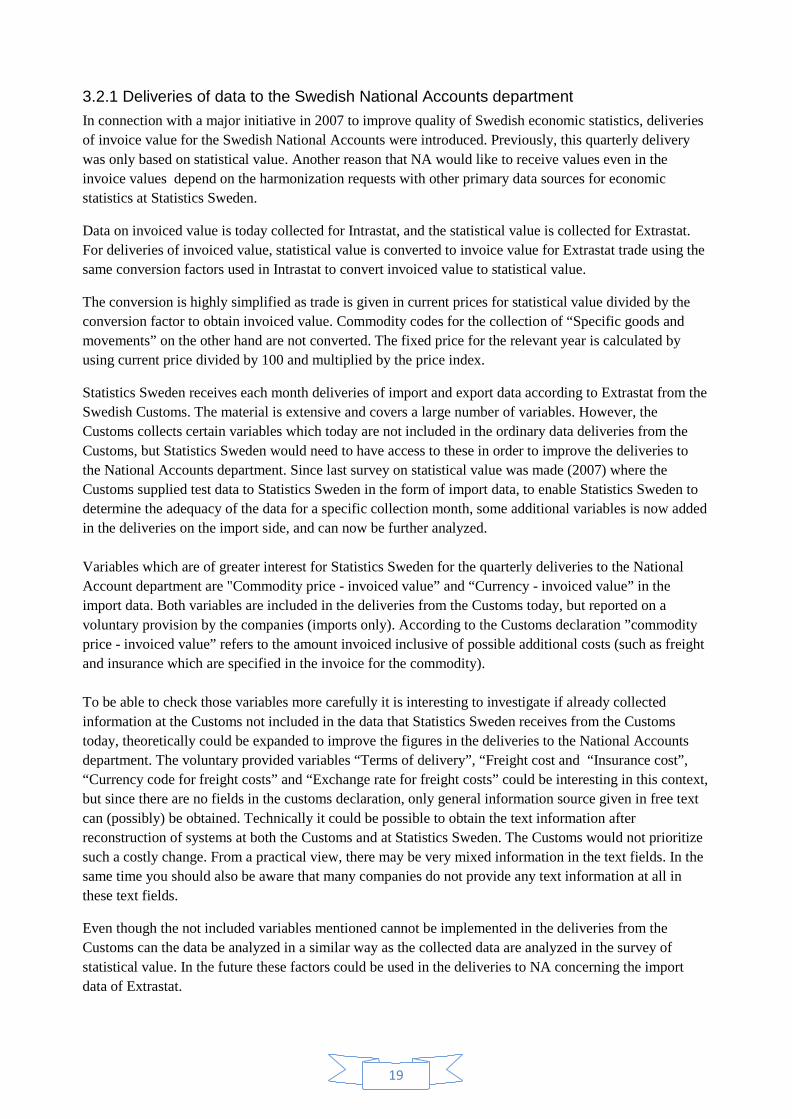
3.2.1 Deliveries of data to the Swedish National Accounts department In connection with a major initiative in 2007 to improve quality of Swedish economic statistics, deliveries of invoice value for the Swedish National Accounts were introduced. Previously, this quarterly delivery was only based on statistical value. Another reason that NA would like to receive values even in the invoice values depend on the harmonization requests with other primary data sources for economic statistics at Statistics Sweden.
Data on invoiced value is today collected for Intrastat, and the statistical value is collected for Extrastat. For deliveries of invoiced value, statistical value is converted to invoice value for Extrastat trade using the same conversion factors used in Intrastat to convert invoiced value to statistical value.
The conversion is highly simplified as trade is given in current prices for statistical value divided by the conversion factor to obtain invoiced value. Commodity codes for the collection of “Specific goods and movements” on the other hand are not converted. The fixed price for the relevant year is calculated by using current price divided by 100 and multiplied by the price index.
Statistics Sweden receives each month deliveries of import and export data according to Extrastat from the Swedish Customs. The material is extensive and covers a large number of variables. However, the Customs collects certain variables which today are not included in the ordinary data deliveries from the Customs, but Statistics Sweden would need to have access to these in order to improve the deliveries to the National Accounts department. Since last survey on statistical value was made (2007) where the Customs supplied test data to Statistics Sweden in the form of import data, to enable Statistics Sweden to determine the adequacy of the data for a specific collection month, some additional variables is now added in the deliveries on the import side, and can now be further analyzed. Variables which are of greater interest for Statistics Sweden for the quarterly deliveries to the National Account department are "Commodity price - invoiced value” and “Currency - invoiced value” in the import data. Both variables are included in the deliveries from the Customs today, but reported on a voluntary provision by the companies (imports only). According to the Customs declaration ”commodity price - invoiced value” refers to the amount invoiced inclusive of possible additional costs (such as freight and insurance which are specified in the invoice for the commodity). To be able to check those variables more carefully it is interesting to investigate if already collected information at the Customs not included in the data that Statistics Sweden receives from the Customs today, theoretically could be expanded to improve the figures in the deliveries to the National Accounts department. The voluntary provided variables “Terms of delivery”, “Freight cost and “Insurance cost”, “Currency code for freight costs” and “Exchange rate for freight costs” could be interesting in this context, but since there are no fields in the customs declaration, only general information source given in free text can (possibly) be obtained. Technically it could be possible to obtain the text information after reconstruction of systems at both the Customs and at Statistics Sweden. The Customs would not prioritize such a costly change. From a practical view, there may be very mixed information in the text fields. In the same time you should also be aware that many companies do not provide any text information at all in these text fields.
Even though the not included variables mentioned cannot be implemented in the deliveries from the Customs can the data be analyzed in a similar way as the collected data are analyzed in the survey of statistical value. In the future these factors could be used in the deliveries to NA concerning the import data of Extrastat.
19

Assumptions: 1) Only import data contains information on the invoiced value of our data from the Swedish Customs.
2) The invoiced value is specified in national currency and need to be converted in SEK.
3) Import information is provided on a voluntary basis and the data has to be checked.
Firstly the “Commodity price - invoiced value” has to be converged in SEK. This is made by downloading Eurostat’s monthly currency rates given in euros and then converge the values in SEK. Like in the case of the collection of statistical value in Intrastat, all data that correspond to ratios less than 0.8 or larger than >1.2 is exempted from further analysis.
Table 15 shows the distribution of ratios (statistical value/invoice value). In the table it can be seen that 4.7 percent regard ratios outside the interval 0.8-1.2, and will be exempted. In the case of the survey of the statistical value this figure was 5.4 percent. It is also of great interest to compare the share of ratios that are equal to 1; 20.6 percent of the Extrastat data and 60.4 percent in the survey of the statistical value.
As it is today Statistics Sweden has access to the invoice value in Extrastat on the import side. These data could be used to convert the statistical value to invoiced value of import in Extrastat for the deliveries to the National Account department. Moreover, these data are reported on voluntary basis from nearly 18,000 companies each month. The factors could be based on much more data than the 2,100 Intrastat companies that we have today based on a study not very often conducted. In the same time the conversion factors are based on Intrastat trade. We can now theoretically utilize current Extrastat data monthly, instead of using fixed factors from Intrastat in the calculations of invoice value for the quarterly NA deliveries of the import figures.
Table 15 Distribution of ratios for collected import values in Extrastat 201303
Ratio interval Frequency Percent <0.8 877 0.1
0.8 – 1 90,906 10.6 1 177,202 20.6
1 – 1,2 551,834 64.1 >1,2 39,640 4.6
Total 860,459 100.0
It would also be interesting to study the difference between the total conversion rate used today and the one that is supposed to be used from the publishing of 2014 (based on the 2013 survey), and a possible conversion factor based on actual data in Extrastat for March 2013. In Table 16 these factors are compared.
Table 16 Comparison of factors on total level for estimating the invoice value in the Extrastat trade Flow Current factor New Factor 2014 Factor based on Extra (201303) Imports 1.01051 1.00958 1.00266 Exports 0.99457 0.99538 n.a. The difference between the various factors on the overall level is small in the imports (Table 16); the percentage reduction to get to the invoiced value is theoretically 1.05 percentages as today, and will be
20

0.96 percentages from 2014. If on the other hand Extrastat information is used in the deliveries, the reduction will instead be 0.27. But these differences do not “speak the whole truth”; it only gives an overview or indication of the difference.
Table 17 shows the number of CN8-codes of the arrivals in the survey of statistical value of Intrastat and the corresponding number of CN8-codes that can be used in the monthly Extrastat trade for estimating the trade by conversion factors at CN8 (or CN8*country), according to the condition that at least 50 percent of the collected trade is covered.
Table 17 Percentage of CN8-codes with at least 50 percent coverage of the collected trade
Source Percent of CN8-codes (2013)
Survey on statistical value 2013 30,7 Monthly Extrastat trade 93,4 If we used Extrastat data to estimate the value of the invoice instead of the current factors based on the study on the statistical value of the Intrastat, would the share of CN8 codes with their own factors amount to about 93 percent, instead of about 31 percent that is the case of today.
After having calculated conversion factors on CN8 levels in Extrastat, we note that the quarterly difference between the results with current conversion factors from Intrastat and with potential new conversion factors from Extrastat exhibits an underestimation today with about 2,500,000 Euros for the first quarter of 2013. The largest differences on chapter-level using either the current ratios or factors calculated on the Extrastat trade can be obtained in Table 18.
Table 18 Percentage of CN8-codes with at least 50 percent coverage of the collected trade CN2 Ratio
Intrastat Ratio
Extrastat Difference
EUR Difference
Percent 03 1.01048 0.98677 136,046 2.41 27 1.00114 0.98995 276,388 1.13 94 1.01092 1.02951 -33,258 -1.81
21
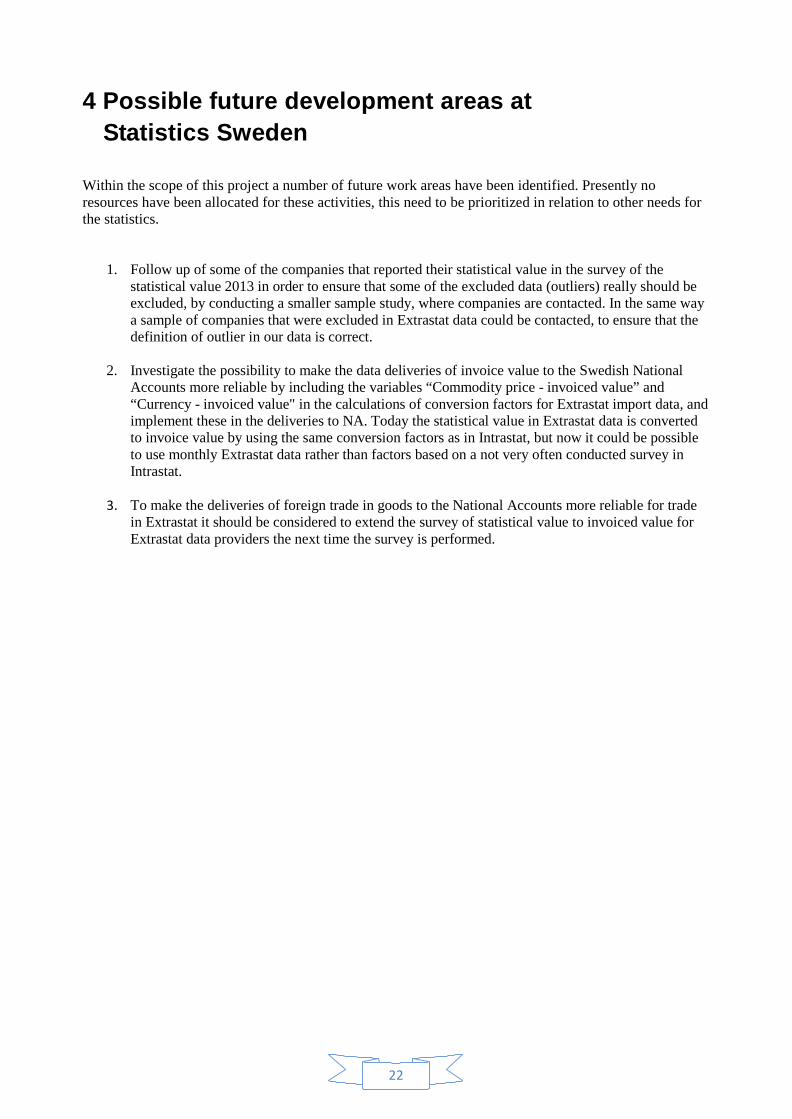
4 Possible future development areas at Statistics Sweden Within the scope of this project a number of future work areas have been identified. Presently no resources have been allocated for these activities, this need to be prioritized in relation to other needs for the statistics.
1. Follow up of some of the companies that reported their statistical value in the survey of the statistical value 2013 in order to ensure that some of the excluded data (outliers) really should be excluded, by conducting a smaller sample study, where companies are contacted. In the same way a sample of companies that were excluded in Extrastat data could be contacted, to ensure that the definition of outlier in our data is correct.
2. Investigate the possibility to make the data deliveries of invoice value to the Swedish National Accounts more reliable by including the variables “Commodity price - invoiced value” and “Currency - invoiced value" in the calculations of conversion factors for Extrastat import data, and implement these in the deliveries to NA. Today the statistical value in Extrastat data is converted to invoice value by using the same conversion factors as in Intrastat, but now it could be possible to use monthly Extrastat data rather than factors based on a not very often conducted survey in Intrastat.
3. To make the deliveries of foreign trade in goods to the National Accounts more reliable for trade
in Extrastat it should be considered to extend the survey of statistical value to invoiced value for Extrastat data providers the next time the survey is performed.
22

Appendix 1a Terms of delivery (Incoterms) CFR, Cost and Freight
The seller must pay the costs and freight required in bringing the goods to the named port of destination. The risk of loss or damage is transferred from seller to buyer when the goods pass over the ship's rail in the port of shipment. The seller is required to clear the goods for export. This term should only be used for sea or inland waterway transport.
CIF, Cost, Insurance, Freight
The seller has the same obligations as under CFR however he is also required to provide insurance against the buyer's risk of loss or damage to the goods during transit. The seller is required to clear the goods for export. This term should only be used for sea or inland waterway transport.
CIP, Carriage and Insurance Paid To
The seller has the same obligations as under CPT but has the responsibility of obtaining insurance against the buyer's risk of loss or damage of goods during the carriage. The seller is required to clear the goods for export however is only required to obtain insurance on minimum coverage. This term requires the seller to clear the goods for export and can be used across all modes of transport.
CPT, Carriage Paid To
The seller pays the freight for the carriage of goods to the named destination. The risk of loss or damage to the goods occurring after the delivery has been made to the carrier is transferred from the seller to the buyer. This term requires the seller to clear the goods for export and can be used across all modes of transport.
DAP, Delivered At Place
Seller delivers the goods when they are placed at the disposal of the buyer on the arriving means of transport ready for unloading at the named place of destination. Parties are advised to specify as clearly as possible the point within the agreed place of destination, because risks transfer at this point from seller to buyer. If the seller is responsible for clearing the goods, paying duties etc., consideration should be given to using the DDP term.May be used for all transport modes.
DAT, Delivered At Terminal
Seller delivers when the goods, once unloaded from the arriving means of transport, are placed at the disposal of the buyer at a named terminal at the named port or place of destination. "Terminal" includes quay, warehouse, container yard or road, rail or air terminal. Both parties should agree the terminal and if possible a point within the terminal at which point the risks will transfer from the seller to the buyer of the goods. If it is intended that the seller is to bear all the costs and responsibilities from the terminal to another point, DAP or DDP may apply. May be used for all transport modes.
23

DDP, Delivered Duty Paid
The seller is responsible for delivering the goods to the named place in the country of importation, including all costs and risks in bringing the goods to import destination. This includes duties, taxes and customs formalities. This term may be used irrespective of the mode of transport.
EXW, Ex Works
The buyer bears all costs and risks involved in taking the goods from the seller's premises to the desired destination. The seller's obligation is to make the goods available at his premises (works, factory, warehouse). This term represents minimum obligation for the seller. This term can be used across all modes of transport.
FCA, Free Carrier
The seller's obligation is to hand over the goods, cleared for export, into the charge of the carrier named by the buyer at the named place or point. If no precise point is indicated by the buyer, the seller may choose within the place or range stipulated where the carrier shall take the goods into his charge. When the seller's assistance is required in making the contract with the carrier the seller may act at the buyers risk and expense. This term can be used across all modes of transport. FAS, Free Alongside Ship
The seller has fulfilled his obligation when goods have been placed alongside the vessel at the port of shipment. The buyer is responsible for all costs and risks of loss or damage to the goods from that moment. The buyer is also required to clear the goods for export. This term should only be used for sea or inland waterway transport.
FOB, Free On Board Once the goods have passed over the ship's rail at the port of export the buyer is responsible for all costs and risks of loss or damage to the goods from that point. The seller is required to clear the goods for export. This term should only be used for sea or inland waterway transport.
24

Appendix 1b
Mode of transport
The mode of transport should be provided in the form of a single-digit code stating for the commonly used method of transportation up to the Swedish border. Should the mode of transport remains unknown then the most likely form of transportation must be provided. The definitions of codes are outlined as follows:
Code Explanation
1 Sea transport including cargo, vehicle or container on broad any vessels 2 Rail transport 3 Road transport 4 Air transport 5 Postal consignment 7 Fixed transport installations For instance, fixed transport installation can be a pipeline which is used to transport oil and gas over the border. 8 Inland waterway transport 9 Own propulsion transport With own propulsion, the object which can be either a vehicle or ship is transported to the border without the assistance of other machineries.
25
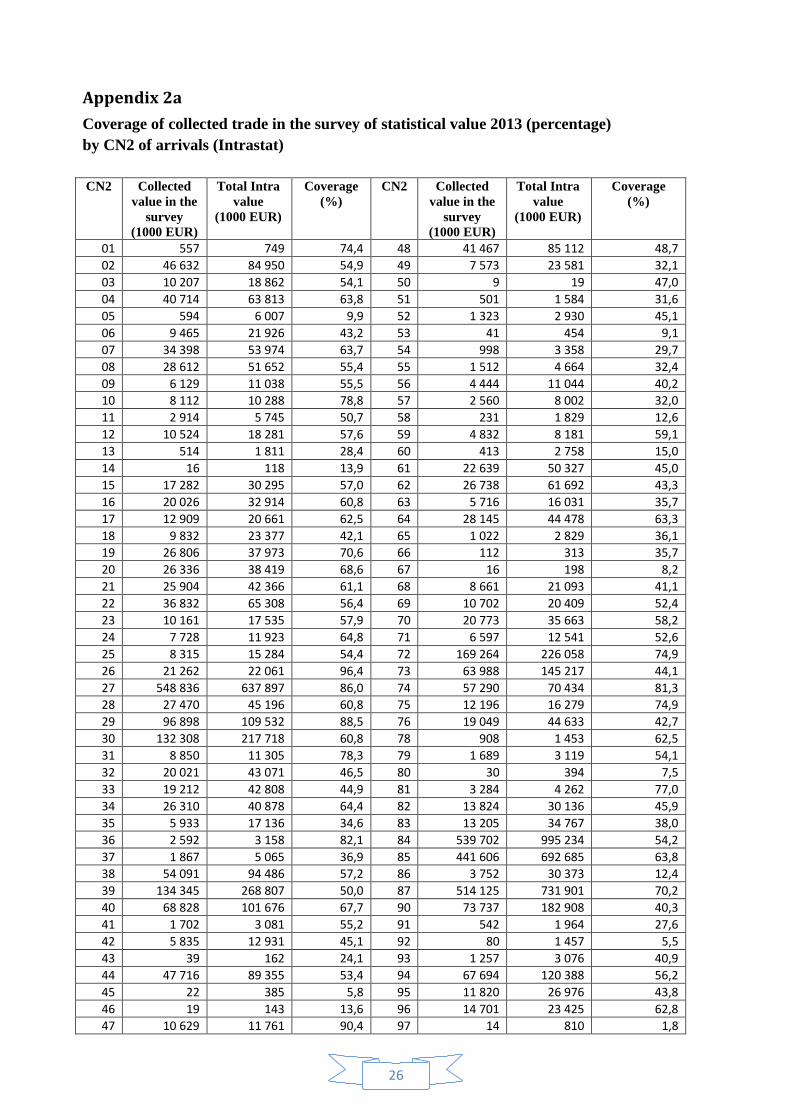
Appendix 2a Coverage of collected trade in the survey of statistical value 2013 (percentage) by CN2 of arrivals (Intrastat) CN2 Collected
value in the survey
(1000 EUR)
Total Intra value
(1000 EUR)
Coverage (%)
CN2 Collected value in the
survey (1000 EUR)
Total Intra value
(1000 EUR)
Coverage (%)
01 557 749 74,4 48 41 467 85 112 48,7 02 46 632 84 950 54,9 49 7 573 23 581 32,1 03 10 207 18 862 54,1 50 9 19 47,0 04 40 714 63 813 63,8 51 501 1 584 31,6 05 594 6 007 9,9 52 1 323 2 930 45,1 06 9 465 21 926 43,2 53 41 454 9,1 07 34 398 53 974 63,7 54 998 3 358 29,7 08 28 612 51 652 55,4 55 1 512 4 664 32,4 09 6 129 11 038 55,5 56 4 444 11 044 40,2 10 8 112 10 288 78,8 57 2 560 8 002 32,0 11 2 914 5 745 50,7 58 231 1 829 12,6 12 10 524 18 281 57,6 59 4 832 8 181 59,1 13 514 1 811 28,4 60 413 2 758 15,0 14 16 118 13,9 61 22 639 50 327 45,0 15 17 282 30 295 57,0 62 26 738 61 692 43,3 16 20 026 32 914 60,8 63 5 716 16 031 35,7 17 12 909 20 661 62,5 64 28 145 44 478 63,3 18 9 832 23 377 42,1 65 1 022 2 829 36,1 19 26 806 37 973 70,6 66 112 313 35,7 20 26 336 38 419 68,6 67 16 198 8,2 21 25 904 42 366 61,1 68 8 661 21 093 41,1 22 36 832 65 308 56,4 69 10 702 20 409 52,4 23 10 161 17 535 57,9 70 20 773 35 663 58,2 24 7 728 11 923 64,8 71 6 597 12 541 52,6 25 8 315 15 284 54,4 72 169 264 226 058 74,9 26 21 262 22 061 96,4 73 63 988 145 217 44,1 27 548 836 637 897 86,0 74 57 290 70 434 81,3 28 27 470 45 196 60,8 75 12 196 16 279 74,9 29 96 898 109 532 88,5 76 19 049 44 633 42,7 30 132 308 217 718 60,8 78 908 1 453 62,5 31 8 850 11 305 78,3 79 1 689 3 119 54,1 32 20 021 43 071 46,5 80 30 394 7,5 33 19 212 42 808 44,9 81 3 284 4 262 77,0 34 26 310 40 878 64,4 82 13 824 30 136 45,9 35 5 933 17 136 34,6 83 13 205 34 767 38,0 36 2 592 3 158 82,1 84 539 702 995 234 54,2 37 1 867 5 065 36,9 85 441 606 692 685 63,8 38 54 091 94 486 57,2 86 3 752 30 373 12,4 39 134 345 268 807 50,0 87 514 125 731 901 70,2 40 68 828 101 676 67,7 90 73 737 182 908 40,3 41 1 702 3 081 55,2 91 542 1 964 27,6 42 5 835 12 931 45,1 92 80 1 457 5,5 43 39 162 24,1 93 1 257 3 076 40,9 44 47 716 89 355 53,4 94 67 694 120 388 56,2 45 22 385 5,8 95 11 820 26 976 43,8 46 19 143 13,6 96 14 701 23 425 62,8 47 10 629 11 761 90,4 97 14 810 1,8
26

Appendix 2b Coverage of collected trade in the survey of statistical value 2013 (percentage) by CN2 of dispatches (Intrastat) CN2 Collected
value in the survey
(1000 EUR)
Total Intra value
(1000 EUR)
Coverage (%)
CN2 Collected value in the
survey (1000 EUR)
Total Intra value
(1000 EUR)
Coverage (%)
01 547 655 83,5 48 321 846 456 400 70,5 02 2 382 6 957 34,2 49 902 10 898 8,3 03 166 429 209 034 79,6 50 4 11 33,9 04 15 424 18 146 85,0 51 440 665 66,1 05 130 3 038 4,3 52 597 954 62,6 06 5 173 2,8 53 50 101 49,4 07 1 600 3 362 47,6 54 36 954 3,8 08 654 5 067 12,9 55 567 1 059 53,5 09 3 592 7 622 47,1 56 1 367 8 297 16,5 10 11 751 13 929 84,4 57 2 646 3 251 81,4 11 1 345 2 607 51,6 58 299 1 150 26,0 12 2 236 3 544 63,1 59 3 542 6 929 51,1 13 3 158 1,8 60 2 120 2 422 87,5 14 0 109 0,1 61 18 497 38 284 48,3 15 16 827 18 946 88,8 62 21 824 50 324 43,4 16 6 787 12 095 56,1 63 3 365 10 741 31,3 17 1 472 6 571 22,4 64 6 514 13 197 49,4 18 871 13 613 6,4 65 858 3 231 26,6 19 15 256 26 716 57,1 66 110 215 51,4 20 3 759 6 609 56,9 67 173 509 34,0 21 13 468 29 764 45,2 68 1 579 5 885 26,8 22 17 030 38 155 44,6 69 1 966 6 051 32,5 23 949 7 485 12,7 70 9 732 17 763 54,8 24 86 484 17,7 71 31 519 41 733 75,5 25 1 207 6 769 17,8 72 240 791 259 278 92,9 26 126 281 130 985 96,4 73 59 970 109 145 54,9 27 510 804 638 311 80,0 74 79 251 86 417 91,7 28 13 925 18 232 76,4 75 113 1 549 7,3 29 82 869 87 576 94,6 76 44 228 81 108 54,5 30 195 289 223 233 87,5 78 9 314 9 787 95,2 31 2 498 2 728 91,6 79 682 1 191 57,3 32 16 499 43 448 38,0 80 0 3 2,2 33 8 587 16 938 50,7 81 384 1 327 29,0 34 15 546 20 573 75,6 82 45 265 56 527 80,1 35 10 445 13 904 75,1 83 7 642 18 795 40,7 36 2 669 4 171 64,0 84 590 871 898 626 65,8 37 95 1 186 8,0 85 201 991 403 047 50,1 38 20 278 50 016 40,5 86 5 041 7 235 69,7 39 96 673 208 254 46,4 87 492 355 633 297 77,7 40 21 593 37 792 57,1 90 84 860 152 396 55,7 41 2 730 5 274 51,8 91 337 1 691 19,9 42 3 817 8 793 43,4 92 262 1 032 25,4 43 80 6 954 1,2 93 2 280 2 957 77,1 44 64 354 135 475 47,5 94 48 684 97 465 50,0 45 2 36 4,8 95 5 554 13 372 41,5 46 131 234 56,0 96 18 464 29 831 61,9 47 89 649 113 590 78,9 97 0 254 0,1
27

Appendix 3 Ratios between the statistical value and the invoice value by CN2 (Intrastat 201303) CN2 Ratio, arrivals Ratio, dispatches CN2 Ratio, arrivals Ratio, dispatches
01 1.000 1.000 *) 48 1.010 0.962 02 1.004 1.015 49 1.020 1.004 03 1.013 1.000 50 1.028 *) 1.000 *) 04 1.016 0.993 51 1.000 1.022 05 0.994 0.991 52 1.013 1.002 06 1.061 1.000 *) 53 1.004 1.011 07 1.053 1.002 54 1.000 1.014 08 1.051 1.017 55 1.001 1.019 09 1.034 1.000 56 1.006 1.007 10 1.012 1.018 57 1.026 1.013 11 1.012 0.978 58 1.005 0.966 12 1.012 1.000 59 1.020 0.981 13 1.000 0.975 *) 60 0.998 0.995 14 1.033 *) 1.000 *) 61 1.024 0.989 15 1.004 1.003 62 1.021 0.993 16 1.016 0.999 63 1.041 1.012 17 1.010 1.001 64 1.000 0.997 18 1.021 1.011 65 1.013 1.004 19 1.024 0.993 66 1.009 1.001 20 1.045 1.004 67 1.043 1.042 21 1.003 0.999 68 0.998 1.018 22 1.019 1.002 69 1.042 1.038 23 1.035 1.002 70 1.007 1.031 24 1.000 1.000 *) 71 1.005 1.001 25 1.002 1.008 72 1.018 1.004 26 1.000 1.003 73 1.012 1.002 27 0.997 0.999 74 1.000 1.002 28 1.005 0.959 75 1.001 0.987 29 1.003 1.014 76 1.006 0.998 30 1.000 1.000 78 1.007 1.007 31 1.007 0.983 79 0.996 1.000 32 1.004 1.001 80 1.012 *) 1.000 *) 33 1.004 1.000 81 1.000 0.999 34 1.013 0.998 82 1.015 0.994 35 0.998 0.989 83 1.017 1.003 36 1.022 0.989 84 1.009 0.999 37 1.002 0.991 85 1.006 0.999 38 1.006 0.992 86 0.999 1.006 39 1.000 0.968 87 1.009 1.002 40 1.014 1.013 90 1.006 1.003 41 1.005 1.001 91 1.004 1.005 42 1.006 0.999 92 1.008 1.005 43 1.005 1.057 93 1.001 1.000 44 1.033 0.927 94 1.043 1.024 45 1.048 1.001 95 1.019 1.001 46 1.000 1.028 96 1.006 1.000 47 1.031 0.992 97 1.005 *) 1.000 *)
*) Based on fewer than 10 observations
28