Embed Size (px)
Citation preview

00
Survey on Planned Capital Spending for Fiscal Years 2015, 2016 and 2017
August 4, 2016
Economic & Industrial Research Department
Fifth straight year of increase driven by enhancement of business infrastructure including for new products
Investment also continues for improvement of urban functions
(Conducted in June 2016)

1. Survey subjects(1) Planned capital spending
Carried out since 1956, the survey provides an overview of capital spending in Japan by analyzing capital spending activity by Japanese firms (domestic non-consolidated; domestic and overseas consolidated). Investment trends, motivating factors, and other items are examined industry by industry.
(2) Opinion pollThis survey is mainly designed to identify the attitude and perspective of firms on key current issues.This year’s survey focuses on corporate “investment in a broader sense,” including R&D and M&A as well as investment in tangible fixed assets.
2. Companies surveyedThe survey covers private corporations capitalized at JPY 1 billion or more, excluding those in the finance and insurance industries.(For the regional breakdowns, corporations with capital of JPY 100 million up to JPY 1 billion were added.)
3. Survey periodJune 24, 2016. Most of the responses to the questionnaire were obtained in June.
4. Response (questionnaire sent to 3,146 firms)Number of firms giving responses on domestic capital spending: 2,077 (response rate, 66.0%) Number of firms giving responses on overseas capital spending: 1,020 (response rate, 32.4%)Number of firms giving responses for the opinion poll: 1,243 (response rate, 39.5%)
5. Detailed resultsPlease visit http://www.dbj.jp/investigate/equip/index.html.
1
Outline of the Survey

2
Contents
Executive Summary
1. Trends in Domestic Capital Spending
2. Attitude toward “Investment in a Broader Sense”
2-1. Concept of “Investment in a Broader Sense”
2-2. Manufacturing R&D and Mother Plant Functions
2-3. Human Investment (Human Resource Development)
2-4. Capital Spending Overseas and M&A
2-5. Investment in Information Technology
2-6. Actions for Growth and Competitiveness
(Appendices)

Executive Summary1. Planned domestic capital spending in FY2016 by major firms (capitalized at JPY 1 billion or over) shows an increase for the fifth consecutive
year overall, up 10.9%, with positive growth expected in both the manufacturing (up 14.5%) and non-manufacturing (8.8%) sectors.
2. Characteristics of domestic capital spending in FY2016 identified from the survey results
(1) The increase in planned capital spending in the manufacturing sector is driven by investment for new models in transport equipment and investment in the development of business infrastructure, including for new materials in chemicals and for facility replacement/consolidation in iron & steel.
(2) Planned capital spending in the non-manufacturing sector is led by transportation and real estate for security, disaster prevention and the enhancement of urban functions in the run-up to the Tokyo Olympics/Paralympics, as well as railways for infrastructure development.
3. In the manufacturing sector (up 14.5%, contribution of 5.4%), spending is expected to rise in transport equipment for new automobile models leveraging new technology for environmental, safety and comfort considerations, and for production line renovation to improve efficiency. Increased spending in chemicals is driven by investment in pharmaceuticals, cosmetics and hygiene goods, and in R&D centers, while the iron & steel industry plans to increase investment in the development of business structure, including for coke oven relining, and facility replacement/consolidation to improve productivity and cost competitiveness. In addition, aircraft-related investment is expected to drive spending in multiple industries such as transport equipment and general machinery.
In the non-manufacturing sector (up 8.8%, contribution of 5.6%), spending is expected to increase in transportation for the speeding-up of railways, safety and disaster prevention, and the development of logistics facilities. Wholesale & retail, particularly supermarkets, shows an increase in investment in new and existing outlets, whereas large-scale development projects are expected to increase in real estate featuring international business hubs and disaster prevention functions mainly in the Tokyo metropolitan area, as per medium- and long-term plans.
4. This year, our opinion poll focuses on “investment in a broader sense,” including R&D, M&A and human investment, as well as investment in tangible fixed assets.
Asked about investment in a broader sense, many manufacturers responded that they are focusing on R&D and human investment, in addition to tangible fixed asset investment. An increasing number of firms are concerned about securing the necessary workforce, as many specifically cite shortage of young skilled labor to lead field workers. Under these circumstances, many emphasized on-the-job training and promotion of young skilled workers in the field as the focus of human investment. As regards investment in information technology, 70% of both manufacturers and non-manufacturers responded that it has been on the rise in recent years. Also, the responses indicated that 36% of manufacturers and 23% of non-manufacturers have closed at least one M&A deal since FY2010, mainly for the purpose of scaling up their business, increasing their market share or expanding their scope of business.
3

4
1. Trends in Domestic Capital Spending

-40
-30
-20
-10
0
10
20
30
90 95 00 05 10
(FY)
(Year-on-year, %)
FY2015(actual)
FY2016(planned)
(1,973 firms) (2,077 firms)
Total 4.8 10.9
[excluding electric power] [3.5] [10.9]
Manufacturing 8.8 14.5 (5.4)
Non-manufacturing 3.0 8.8 (5.6)[excluding electric power] [0.5] [8.6]
1-1. Trends in Domestic Capital Spending (Overview)
5
Figure 1-1. Domestic Capital Spending Figure 1-2. Growth in Capital Spending (FY1990-2016)
Note: Based on the DBJ Survey on Planned Capital Spending; the same applies hereinafter unless otherwise noted.
(Year-on-year, % Figures in parentheses are contribution ratios.)
14.510.98.8
Manufacturing
Non-manufacturing
Total
[Planned]
16[Planned]
15[Actual]
A 5th straight year of increase is planned, mainly to develop business infrastructure, including for new products.
The increase in planned capital spending in the manufacturing sector is driven by investment for new models in transport equipment and investment in the development of business infrastructure, including for new materials in chemicals and for facility replacement/consolidation in iron & steel.
Planned capital spending in the non-manufacturing sector is led by transportation and real estate for safety, disaster prevention and the enhancement of urban functions in the run-up to the Tokyo Olympics & Paralympics, as well as railways for infrastructure development.

82
84
86
88
90
92
94
96
98
100
2000 05 10 15
15.1 13.9
10.9
6.3 4.8
-20
-15
-10
-5
0
5
10
15
00 01 02 03 04 05 06 07 08 09 10 11 12 13 14 15 16
1-2. Planned vs. Actual Figures
6
Planned figures for the current fiscal year tend to be revised downward before being materialized as some of the planned projects do not go as planned due to revision or close examination of the plan or delay in construction works.
Figure 1-3. Planned vs. Actual Capital Spending Growth (Total)
Average for FY2011-15
Figure 1-4. Plan Realization Rate (Total)
(Actual/planned spending as of June, %)
(FY)
(Year-on-year, %)
Planned for current year
Actual
(FY)

1-3. Planned vs. Actual Figures (by Sector) (for reference)
7
[Manufacturing] [Non-manufacturing]
Figure 1-5. Pattern of Revision to Capital Spending Growth (Planned → Actual)
18.5
24.2
14.5
3.7
8.8
-40
-30
-20
-10
0
10
20
30
00 02 04 06 08 10 12 14 16
13.2 8.7
8.8
7.5 3.0
-40
-30
-20
-10
0
10
20
30
00 02 04 06 08 10 12 14 16
(Year-on-year, %) (Year-on-year, %)
(FY)(FY)
Planned for current year
Actual

0 20 40 60 80
製造業310社
非製造業329社
(1) Decline in current earnings
(2) Increased uncertainty of business environment
(3) Decline in expected medium- to long-term rate of return
(4) Change in investment plan at the request of client
(5) Leeway on budget during the planning phase
(6) Delay in construction schedule
(7) Cancellation/reduction of investment due to rising cost of construction
(8) Deterioration in the financing environment
(9) Other
0 20 40 60 80
製造業344社
非製造業353社
8
1-4. Factors for Downward Revision to Capital Spending in Previous Year
Figure 1-6. Factors for Downward Revision to Capital Spending Planned in Previous Year
Actual capital spending often fails to reach planned spending in both the manufacturing and non-manufacturing sectors largely due to leeway on budget during the planning phase, or closer examination or revision of the plan. In many cases, the gap is also attributable to delay in construction works.
(Response rate, %)
Note: Respondents may choose up to three answers. Data only covers the firms reporting less-than-planned capital spending. Option (6) was added in the FY2016 survey.
[FY2015 survey](for reference) [FY2016 survey]
(1) Decline in current earnings
(2) Increased uncertainty of business environment
(3) Decline in expected medium- to long-term rate of return
(4) Change in investment plan at the request of client
(5) Leeway on budget during the planning phase
(6) Closer examination of investment plan and removal of waste
(7) Delay in construction schedule
(8) Cancellation/reduction of investment due to rising cost of construction
(9) Deterioration in the financing environment
(10) Other
(Response rate, %)
Manufacturers (344firms)Non-manufacturers(353firms)
Manufacturers(310firms)
Non-manufacturers(329firms)

70.8
51.5
87.6
40
50
60
70
80
90
100
110
120
130
140
150
91 95 2000 05 10 15
(%)
1-5. Capital Spending/Cash Flow Ratio and DI on Sales & Operating Profit
9
Although domestic capital spending stays within the limit of cash flow, actual figures for FY2015 indicate a slight increase in the total capital spending/cash flow ratio.
The improvement in the diffusion index (DI) on operating profit slowed in FY2016 from the previous year. It should be noted that any further yen appreciation would exert stronger downward pressure on the operating profit of manufacturers.
Slight increase in capital spending/cash flow ratio
Note: Cash flow is calculated as operating profit/2 + depreciation expenses.(simplified formula assuming an effective corporate tax rate of 50%)
Total
Manufacturing
DI on sales DI on operating profit
FY2015actual
1,109 firms
FY2016planned
1,314 firms
FY2015actual
1,109 firms
FY2016planned
1,314 firms
Total 5.2 14.6 18.8 2.3
Manufacturing -5.0 8.6 7.0 3.8
Non-manufacturing 13.1 19.3 27.8 1.1
(Percentage points)
Note: DI on sales, DI on operating profit =
(“increased revenue/profit” – “decreased revenue/profit”)valid total responses .
Non-manufacturing
(FY)
Figure 1-7. Trend of Capital Spending/Cash Flow Ratio Figure 1-8. DI on Sales & Operating Profit
[Actual]

1-6. Macroeconomic Environment for Capital Spending
Concern about downside risk due to macroeconomic environment
Factors propping up capital spending in FY2016 include (1) economic stimulus package; (2) expectations for the effect of the growth strategy; (3) continued improvement in the employment and income conditions; (4) increased demand for materials and components in which Japanese firms maintain substantial global market shares; and (5) planned infrastructure development in the run-up to the Tokyo Olympics & Paralympics, among others.
The macroeconomic environment contains significant risk factors emanating from overseas, including (a) Brexit (the UK leaving the EU); (b) continued yen appreciation, and (e) the Chinese economy, marked by excessive production capacity.
Factors propping up capital spending Downside risks for capital spending1. Implementation of economic stimulus package in
support of business2. Progress in governmental growth strategy3. Continued improvement in employment and
income conditions4. Increased demand for specific materials and
components in which Japanese manufacturers maintain substantial global market shares
5. Planned infrastructure development in the run-up to Tokyo Olympics & Paralympics
a. Adverse effect of Brexit on the global economyb. Continued yen appreciation, affecting business
performancec. Slowdown in the US economy in the aftermath of
interest rate increasesd. Downswing in resource-rich economies due to
slumps in oil and other commodity pricese. Downswing in the Chinese economy, marked by
excessive production capacity
Figure 1-9. Macroeconomic Conditions Affecting Capital Spending
10

JPY 100 up to JPY 105
JPY 105 up to JPY 110
JPY 110 up to JPY 115
JPY 115 up to JPY 120
JPY 120 up to JPY 125
JPY 125 or over70
80
90
100
110
120
130
1
2012
4 7 10 1
13
4 7 10 1
14
4 7 10 1
15
4 7 10 1
16
4 7 10
1-7. Foreign Exchange Rate Assumed by Manufacturers
Most manufacturers assume a foreign exchange rate of USD 1 = JPY 110-115. In other words, their annual plans are built on the assumption of a weaker yen in comparison with the actual data for July. Thus, if the exchange rate stays at the level of July, it may trigger downward revisions to actual performance, particularly for firms with high overseas sales ratios.
Figure 1-10. Actual USD/JPY Rate
Source: Bank of Japan, monthly average of interbank rate at 17:00.
(monthly)Annual average
(JPY)
Stronger yen
Figure 1-11. USD/JPY Rate Assumed by Manufacturers (313 Firms)
Source: Development Bank of Japan, “Survey on Planned Capital Spending.”
(Response rate, %)
11
0 10 20 30 40 50
1
2
3
4
5
6

-10
0
10
20
30
40
0 10 20 30 40 50 60 70 80 90 100
1-8. Plan for FY2016 (Skyline Graph)
12
(Year-on-year, %)
Iron & steel14.5 (1.4) General machinery
8.5 (1.1)Electric machinery
0.9 (0.1)Transport equipment
14.3 (3.4)Other
18.6 (2.4)
-10
0
10
20
30
40
0 10 20 30 40 50 60 70 80 90 100
Construction29.7 (1.1)
Wholesale & retail15.5 (1.8)
Real estate10.1 (1.4)
Transportation15.1 (4.0)
Telecommunications & information-3.5 (-0.9)
Other4.2 (0.7)
(Share in manufacturing, %)
(Share in non-manufacturing, %)Note: Figures indicate changes in FY2016 on previous year. Figures in parentheses ( ) indicate contributions to the whole manufacturing or non-manufacturing sector. “Other”
includes electric power.
Figure 1-12. Composition and Growth of Capital Spending, by Major Industry (FY2016 Plan)
Paper & pulp11.4 (0.3)
Chemicals26.8 (3.7)
Food & beverages22.4 (1.1)
Manufacturingaverage14.5%
Non-manufacturingaverage8.8%
Services 24.1 (0.7)
Non-ferrous metals33.4 (1.0)
Precision machinery-0.5 (0.0)
(Year-on-year, %)

1-9. Trends in the Manufacturing Sector (Ⅰ)
13
Figure 1-13. Industries with the Greatest Contribution to Planned Capital Spendingfor FY2016 (Manufacturing)
Driven by chemicals, transport equipment, iron & steel
In the manufacturing sector, planned capital spending shows a decline in textiles and is almost constant in electric and precision machinery. Other industries plan robust growth. A double-digit increase in capital spending is planned in chemicals, as well as in heavy-weighted industries such as transport equipment and iron & steel.
(%) Year-on-year Contributionratio* Drivers for the increase/decrease
(1) Chemicals 26.8 3.7 Investment in pharmaceuticals, cosmetics, hygiene goods, R&D facilities, etc.
(2) Transport equipment 14.3 3.4New automobile models leveraging new technology for environmental, safety and comfort considerations, and production line renovation for improving efficiency
(3) Iron & steel 14.5 1.4Investment in maintenance and replacement, including for coke oven reliningInvestment for facility replacement/consolidation to improve productivity and cost competitiveness
Manufacturing total 14.5 *Contribution to growth in the whole manufacturing sector.

1-10. Trends in the Manufacturing Sector (Ⅱ)
14
Increased spending in materials, parts and other specific fields where Japanese manufacturers enjoy substantial global market shares
Although foreign manufacturers have substantial shares in the international market for many final goods, including aircraft, Japanese manufacturers remain highly competitive in materials, parts, intermediate goods, and capital goods required for producing those final goods.
The development of emerging economies is pushing up the demand for final goods such as aircraft. In some industries such as automobiles, Japan even has an edge over international competitors. Many Japanese firms have advantages or substantial global market shares in capital goods or specific parts and components. It is those firms that will increase capital spending in the years ahead.
Figure 1-14. Highlights of Planned Capital Spending for FY2016 in the Manufacturing Sector
[General machinery]
Industrial robots Automobiles
[Electric machinery][Chemicals][Cement, ceramics & glass][Iron & steel][Non-ferrous metals]
Machine tools
Electronic materials
Carbon fiber
High functional materials Electronic components, including for cars
Auto parts
Aircraft parts
[Transport equipment][Transport equipment]
Capital goods Materials/components Intermediate goods/parts Final goods/demand
Note: Production in Japan will go into full swing in the years ahead.
[General machinery]
Aircraft
High-grade steel stock
Industry
Product

1-11. Trends in the Non-manufacturing Sector (Ⅰ)
15
Driven by railways and development investment mainly in the Tokyo area
In the non-manufacturing sector, spending will increase in transportation, real estate and other infrastructure-related industries, and in wholesale & retail led by investment in new and existing supermarket outlets.
However, capital spending continues to decline in telecommunications & information due to a lull in spending for LTE base stations.
(%) Year-on-year Contribution ratio* Drivers for the increase/decrease
(1) Transportation 15.1 4.0Speeding-up and security measures in railways, logistics facilities in warehousing/cargo transport, ships in marine transportation
(2) Wholesale & retail 15.5 1.8 Investment in new/existing supermarket outlets, etc., recovery in convenience store outlet expansion
(3) Real estate 10.1 1.4Investment in large-scale urban center development projects featuring international business hubs and disaster prevention functions
Non-manufacturing total 8.8 *Contribution to growth in the whole non-manufacturing sector.
(Other) Telecommunications & information -3.5 -0.9 A lull in spending for mobile phone base stations
Figure 1-15. Industries with the Greatest Contribution to Planned Capital Spendingfor FY2016 (Non-manufacturing)

1-12. Trends in the Non-manufacturing Sector (Ⅱ)
16
Propped up by investment based on long-term planning, including in traffic/logistics infrastructure
In the non-manufacturing sector, the planned increase in capital spending is driven by the transportation and real estate industries with investment for safety; disaster prevention and speeding-up measures in railways; real estate development, mainly in urban centers; and logistics facility development.
Although the population decline continues to curb personal consumption, capital spending in the non-manufacturing sector is propped up by investment in response to the diversification of consumer spending and the emergence of e-commerce, as well as investment forinfrastructure development in the run-up to the 2020 Tokyo Olympics/Paralympics.
Figure 1-16. Backdrop of Capital Spending in the Non-manufacturing Sector
Diversification of consumer spending
Tokyo Olympics & Paralympicse-commerce Aging
population
Regeneration and upgrade of urban areas Inbound tourists/inward FDI
Transportation, etc.
Real estate
Retail
Services
Speeding-up and safety/ disaster prevention measures for railwaysLogistics facilities & distribution system
Development of urban centers, development of international business hubs and disaster prevention
functions
Convenience store outlet expansion, development of
commercial facilities
Improvement in employment
Aging urban infrastructure and safety/disaster prevention
measures
Development of emerging economies
Revitalization of regional
economies
Hotel refurbishment and rehabilitation
Aircraft equipment & airport buildings

17
Manufacturing○ Food & beverages (-5.0%→22.4%)
Spending will increase led by investment in production rationalization and new dairy and processed livestock products.
○ Chemicals (0.9%→26.8%) Spending shows an increase for the third consecutive year with increased investment in pharmaceuticals, cosmetics and hygiene goods, and the continued growth of R&D investment in a wide range of industries.
○ Petroleum (-20.4%→30.1%)Spending is expected to increase with investment in maintenance & repair, rationalization and power generation projects at refineries.
○ Cement, ceramics & glass (13.3%→13.6%)Despite a cutback in cement, spending shows the fourth consecutive year of positive growth, driven by a substantial spending increase in automobile components.
○ Iron & steel (-2.8%→14.5%) Spending is expected to record a double-digit increase led by coke oven relining and facility replacement/consolidation.
○ Non-ferrous metals (30.8%→33.4%)A double-digit increase is expected driven by capacity enhancement and maintenance/repair related to products for automobiles and electronic devices.
○ General machinery (11.6%→8.5%)Planned capital spending shows a continued increase with capacity enhancement in products for aircraft and automobiles, and widespread projects for plant automation and networking.
○ Electric machinery (32.5%→0.9%)Spending is expected to stay on a par despite product sophistication, mainly in electronic parts for automobiles, now that major capacityenhancement projects have been completed.
○ Precision machinery (22.5%→ -0.5%)Spending is expected to decline slightly despite increased investment in medical equipment for new products and R&D, due to cutbacks in semiconductor manufacturing devices and measuring instruments.
○ Automobiles (16.2%→14.2%) The fifth straight year of increased spending is expected driven by new models leveraging advanced technology for environmental, safety and comfort considerations, and product line renovation for greater production efficiency.
Non-manufacturing○ Wholesale & retail (-8.9%→15.5%)
Double-digit growth in spending is expected with investment in new and existing supermarket outlets and resumption of outlet expansion in convenience stores.
○ Real estate (6.1%→10.1%)Spending shows an increase for the fourth straight year, led by investment in large development projects in urban centers including the development of international business hubs and disaster prevention functions.
○ Transportation (13.1%→15.1%)The fifth straight year of spending increase is upcoming with projects for speeding-up and safety/disaster prevention in railways and continued development of logistics facilities.
○ Telecommunications & information (-13.8%→ -3.5%)Spending is expected to decline for the third consecutive year despite investment in data centers, due to continued cutbacks on fixed-line telecoms and LTE base station development.
○ Services (19.6%→24.1%) A double-digit spending increase is expected driven by the replacement and refurbishment of hotels and the development of new attractions in theme parks.
1-13. Planned Capital Spending for FY2016, by Industry
Note: Figures in parentheses ( ) indicate changes in capital spending in the industry concerned (FY2015 → FY2016).

32.0
31.8
42.8
23.1
22.8
28.3
24.3
16.2
16.7
12.3
16.4
16.2
14.6
18.6
10.5
8.3
6.2
8.8
8.2
10.8
9.5
17.1
14.7
10.0
11.5
12.4
9.8
10.2
9.4
14.8
16.6
25.6
25.9
21.6
24.3
14.8
13.7
12.1
14.6
14.6
14.9
13.2
1990
2000
07
13
14
15
16
1-14. Investment Motives (Manufacturing)
18
Figure 1-17. Trend of Investment Motives (Manufacturing)
“Expansion of production capacity” and “product development and upgrading” combined account for over 40% of the motives.
Looking at investment motives in the manufacturing sector for FY2015, the weight of “expansion of production capacity” rose on the previous year for the first time since the 2008 financial crisis, while that of “maintenance and repair” declined for the first time since FY2010.
In FY2016, the weight of “expansion of product capacity” declines slightly but that of “product development and upgrading” increases. Thus, the two motives combined maintain the level of FY2015, exceeding 40% of the investment motives. Despite the slight increase in the weight of “maintenance and repair,” the survey results indicate manufacturers’ forward-looking attitude toward investment.
Note: Share of each investment motive in total capital spending in terms of value.
(FY) (%)
[Planned]
Researchand
developmentProduct development
and upgradingExpansion of production capacity
Rationalization and labor saving
Maintenanceand repair Other

19
About 40% of manufacturers recognize the need to increase investment in maintenance and replacement
1-15. Current Situation of Primary Domestic Production Base
Figure 1-18. Recognition of Overall Situation of Domestic Production Base
Roughly 40% of manufacturers replied that they need to increase investment in maintenance and replacement, indicating the importance of spending on maintenance and replacement as facilities age. Also, over 10% of manufacturers felt that it was necessary to invest in the expansion of production capacity.
By industry, many recognized the necessity of maintenance and replacement investment in iron & steel and non-ferrous metals. Some also cited the necessity of consolidating or downscaling aged production sites, particularly in chemicals.
(Response rate, %)
Need to increase investment in maintenance and replacement
Need to invest in expansion of
production capacity
Investment already made in maintenance and replacement
with ample production capacity
Need to consolidate or downscale aged
sites
Other
(Response rate, %)
42.9
39.0
54.7
39.1
31.4
39.7
47.9
12.3
19.5
9.4
14.1
9.8
17.5
7.3
37.2
29.3
35.8
40.2
45.1
34.9
38.2
6.1
9.8
0.0
4.3
9.8
6.3
6.1
0 10 20 30 40 50 60 70 80 90 100
1
2
3
4
5
6
7
Manufacturing total (506 firms)Chemicals (82 firms)Iron & steel and non-ferrous metals (53 firms)General and precision machinery (92 firms)Electric machinery(51firms)Transport equipment(63 firms)Other (165 firms)

11
9
8
10
14
16
45
51
38
49
34
43
38
33
48
35
46
37
6
8
6
7
6
5
0 25 50 75 100
50:50 split in the recognition of capital spending level: high or controlled
1-16. Recognition of Capital Spending Level
Figure 1-19. Recognition of Domestic Capital Spending over the Last Three Years
(1) Manufacturing (2) Non-manufacturing
In both the manufacturing and non-manufacturing sectors, some 50% of the respondents considered that their capital spending was at a high level, while the remaining 50% saw it as controlled.
By industry, the percentage of “high level” is significantly high in transport equipment, while many electric machinery manufacturers reported “modestly controlled” or “extremely controlled” capital spending. In the non-manufacturing sector, the shares of “very high” and “modestly high” levels of capital spending are larger in electric power & gas than in the sector as a whole.
(Response rate, %)
Very high level
Modestly high level
Modestly controlled level
Extremely controlled
level
20
7
6
6
9
12
50
47
48
50
54
38
43
45
31
29
5
5
2
10
5
0 25 50 75 100
非製造業
(692社)
うち卸売・小売
(147社)
うち不動産
(104社)
うち運輸
(147社)
うち電力・ガス
(59社)
(Response rate, %)
Very high level
Modestly high level
Modestly controlled level
Extremely controlled
level
Manufacturing total(502 firms)
of which: Chemicals(79 firms)
of which: Iron & steel and non-ferrous metals (52 firms)
of which: General and precision machinery (92 firms)
of which: Electric machinery (50 firms)
of which: Transport equipment (63 firms)
(Comparison with profit level, business scale, pre-2008 financial crisis level etc.)
2
Non-manufacturing total(692 firms)
of which: Wholesale & retail (148 firms)
of which: Real estate (105 firms)
of which: Transportation (147 firms)
of which: Electric power & gas (59 firms)

Enhancing financial strength, risk aversion and reduced prospects for domestic market growth are major reasons for controlled investment.
1-17. Recognition of Capital Spending Level
In both the manufacturing and non-manufacturing sectors, primary reasons for controlling capital spending include priority given to enhancing financial strength (item 5 below) and reduced prospects for domestic market growth (item 1). Many manufacturers also cited risk-averse attitude (item 4).
21
(Response rate, %)Note: Up to two answers could be chosen.
33
19
3
38
40
9
21
4
3
5
67
20
0 10 20 30 40 50 60 70 80
1
2
3
4
5
6
製造業
(213社)
非製造業
(291社)
(1) Reduced prospects for domesticmarket growth
(2) Priority given to business operation overseas
(3) Priority given to M&A
(4) Risk-averse attitude
(5) Priority given to enhancing financial strength
(6) Other
Figure 1-20. Reasons for Controlling Capital Spending(Answers given by firms reporting controlled levels of capital spending in Figure 1-19)
Manufacturing (213 firms)
Non-manufacturing(291 firms)

2. Attitude toward “Investment in a Broader Sense”
22
2-1. Concept of “Investment in a Broader Sense”
23

2-1-1. Corporate Approach to Future
Corporate approach to future“Investment in a Broader Sense”
General actions for future corporate growth, survival and improvement of business valuation
Item Scale (by value) (annual amount for all corporations)
Characteristics/description
(1) Domestic tangible fixed asset investment (approx. JPY 60 trillion)
Acquisition of fixed assets necessary for maintaining and expanding production and sales activities
(2) Domestic intangible fixed asset investment (approx. JPY 10 trillion) Acquisition of software, patents, trademark
rights, etc.
(3) Overseas tangible fixed asset investment (approx. JPY 10 trillion) Investment in tangible fixed assets overseas
(4) M&A (domestic and overseas) (approx. JPY 15 trillion) Mergers and acquisitions to increase the scope and scale of business
(5) R&D expenditure (approx. JPY 13 trillion) Research activities for future technological advantages and product development
(6) Human investment (varies depending on definition) Human resource development and training to improve corporate competitiveness in general
Figure 2-1-1. Composition of Investment in a Broader Sense
24
Investment in a
narrow sense
Investment in a broader sense
Approx. JPY
50 trillion in total

0
10
20
30
40
50
60
国内での有形固定資産投資 海外での有形固定資産投資 研究開発費 M&A 人的投資 ソフトウェアなどの無形資産投資
鉄鋼・非鉄金属(53社)
化学(82社)
一般・精密機械(91社)
電気機械(53社)
輸送用機械(63社)
その他(161社)
40
21
42
23
46
8
0
10
20
30
40
50
60
国内での有形固定資産投資 海外での有形固定資産投資 研究開発費 M&A 人的投資 ソフトウェアなどの無形資産投資
Manufacturing total (503 firms)
Figure 2-1-2. Priority of “Investment in a Broader Sense”(1) Manufacturing: Total (2) Manufacturing: by Industry
Note: Up to two answers could be chosen.
(Response rate, %)
2-1-2. Priority of “Investment in a Broader Sense”
Three priorities: human investment, R&D and domestic tangible fixed asset investment Human investment, R&D and domestic tangible fixed asset investment are the three pillars of “investment in a
broader sense.” Among the key industries, iron & steel and non-ferrous metals give top priority to domestic tangible fixed asset
investment, while other industries including general and precision machinery, electric machinery and transport equipment prioritize R&D. Human investment is another priority across the board, particularly in iron & steel and non-ferrous metals.
(Response rate, %)
25
Iron & steel and non-ferrous metals(53 firms)
Chemicals (82 firms)
General and precision machinery (91 firms)
Electric machinery (53 firms)
Transport equipment (63 firms)
Other (161 firms)
(1) Domestictangible
fixed asset investment
(2)Overseas tangible
fixed asset investment
(3)R&D
(4)M&A
(5)Human
investment (HR
development)
(6)Intangible
asset investment
(1) Domestictangible
fixed asset investment
(2)Overseas tangible
fixed asset investment
(3)R&D
(4)M&A
(5) Human
investment (HR
development)
(6)Intangible
asset investment

2-2. Manufacturing R&D and Mother Plant Functions
26

Planned R&D expenditure for FY2016 (consolidated basis) shows an increase of 4.0% in total, and 3.9% in manufacturing. The 0.5% decline planned in electric machinery is more than offset by a continued increase of 4.9% in transport equipment
mainly for environmental and safety technology with pilot projects on advanced driving support systems. Planned R&D expenditure also shows an increase of 6.0% in chemicals led by priority segments including new material development and pharmaceuticals, and 5.8% in general machinery driven by environmental technology and medical equipment in addition to core businesses.
Figure 2-2-1. R&D Expenditure (Consolidated Basis)
2-2-1. R&D Expenditure
Note: For the purpose of this survey, R&D expenditure comprises all costs related to R&D, such as personnel cost, raw materials cost, depreciation cost and allocated overhead.
FY2015 (actual)year-on-year(709 firms)
FY2016 (planned)year-on-year(803 firms)
Composition ratio, FY2015
Total 4.2 4.0 100.0
Manufacturing total 4.3 3.9 98.5
Transport equipment 4.3 4.9 41.1
General machinery 3.9 5.8 9.3
Electric machinery 3.7 - 0.5 22.2
Chemicals 4.6 6.0 15.3
Non-manufacturing total 1.0 8.8 1.5
Robust growth continues.
27
8 58 21 1 13
0 20 40 60 80 100
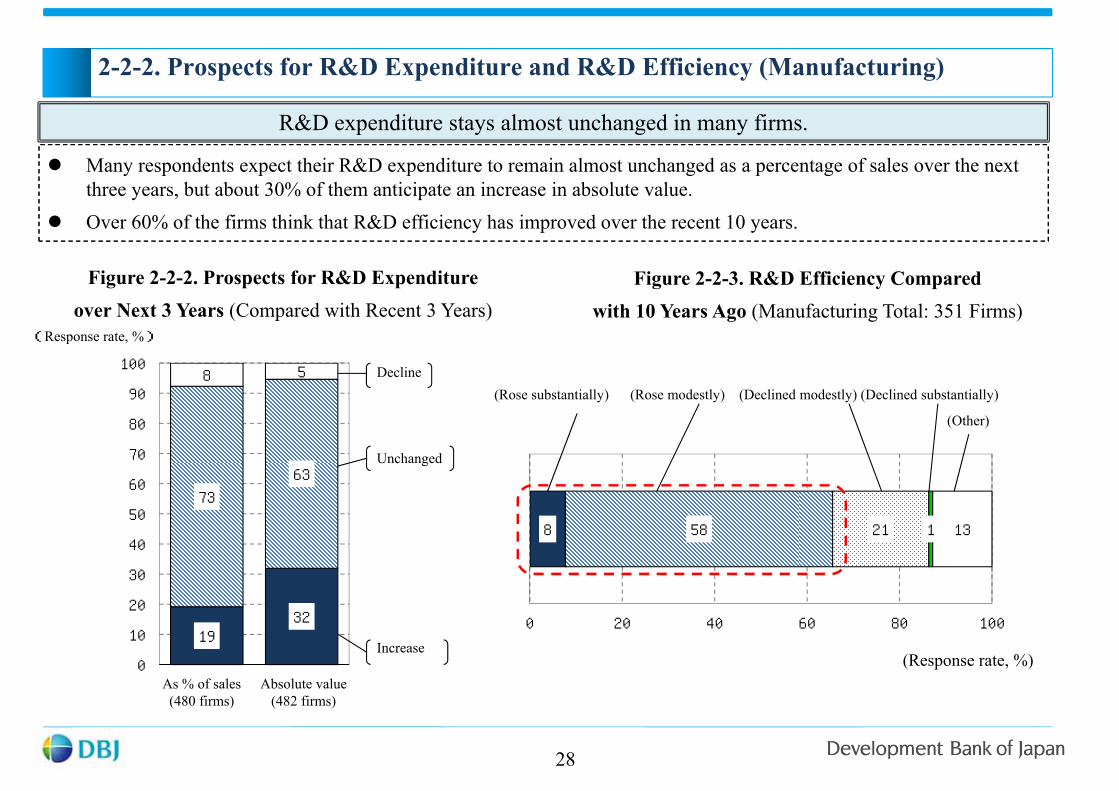
2-2-2. Prospects for R&D Expenditure and R&D Efficiency (Manufacturing)
28
Many respondents expect their R&D expenditure to remain almost unchanged as a percentage of sales over the next three years, but about 30% of them anticipate an increase in absolute value.
Over 60% of the firms think that R&D efficiency has improved over the recent 10 years.
Figure 2-2-2. Prospects for R&D Expenditureover Next 3 Years (Compared with Recent 3 Years)
R&D expenditure stays almost unchanged in many firms.
(Response rate, %)
Decline
Unchanged
Increase
(Rose substantially) (Rose modestly) (Declined modestly) (Declined substantially)
(Other)
(Response rate, %)
Figure 2-2-3. R&D Efficiency Compared with 10 Years Ago (Manufacturing Total: 351 Firms)
19 32
73
63
8 5
0
10
20
30
40
50
60
70
80
90
100
対売上高比
(480社)
金額水準
(482社)
As % of sales(480 firms)
Absolute value(482 firms)
26
30
56
14
3
3
4
19
1
0
1
0 10 20 30 40 50 60
研究開発効率上昇企業群(215社)
同上低下企業群(76社)
2-2-3. Factors for Reduced R&D Efficiency and Challenges (Manufacturing)
29
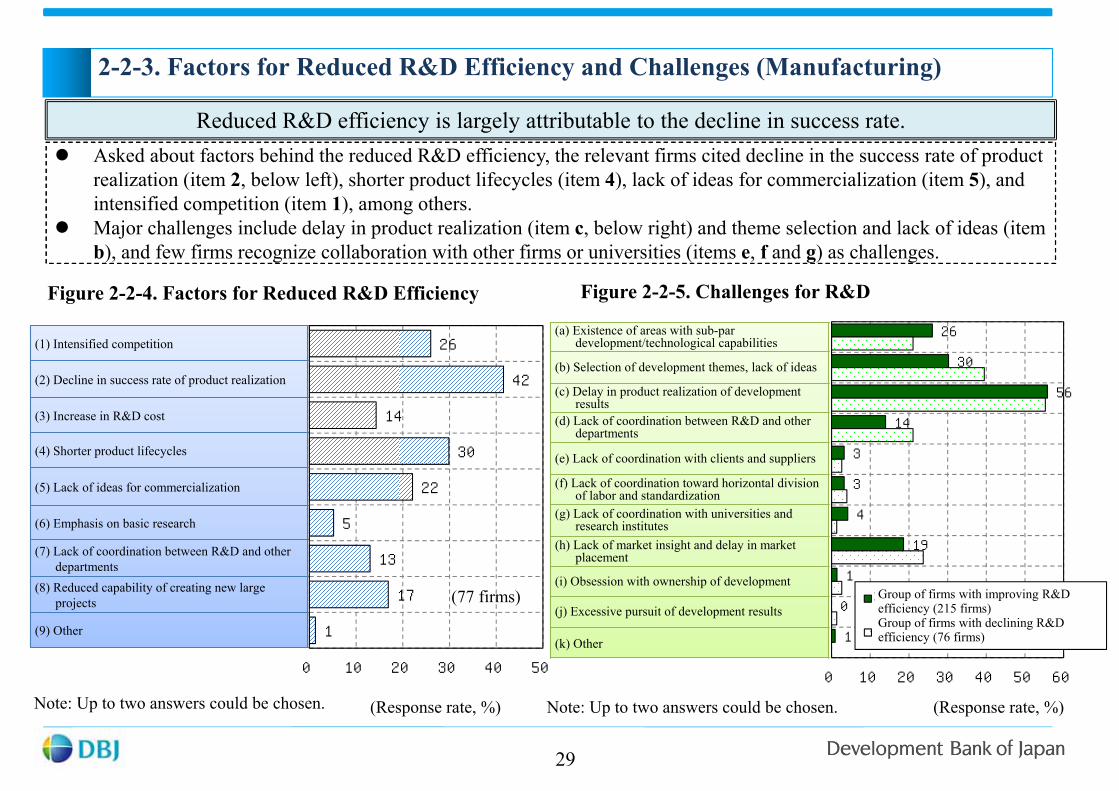
Asked about factors behind the reduced R&D efficiency, the relevant firms cited decline in the success rate of product realization (item 2, below left), shorter product lifecycles (item 4), lack of ideas for commercialization (item 5), and intensified competition (item 1), among others.
Major challenges include delay in product realization (item c, below right) and theme selection and lack of ideas (item b), and few firms recognize collaboration with other firms or universities (items e, f and g) as challenges.
Figure 2-2-4. Factors for Reduced R&D Efficiency
Reduced R&D efficiency is largely attributable to the decline in success rate.
(Response rate, %)
(1) Intensified competition
(2) Decline in success rate of product realization
(3) Increase in R&D cost
(4) Shorter product lifecycles
(5) Lack of ideas for commercialization
(6) Emphasis on basic research
(7) Lack of coordination between R&D and other departments
(8) Reduced capability of creating new large projects
(9) Other
Figure 2-2-5. Challenges for R&D
(Response rate, %)
(a) Existence of areas with sub-par development/technological capabilities
(b) Selection of development themes, lack of ideas
(c) Delay in product realization of development results
(d) Lack of coordination between R&D and other departments
(e) Lack of coordination with clients and suppliers
(f) Lack of coordination toward horizontal division of labor and standardization
(g) Lack of coordination with universities and research institutes
(h) Lack of market insight and delay in market placement
(i) Obsession with ownership of development
(j) Excessive pursuit of development results
(k) Other
26
42
14
30
22
5
13
17
1
0 10 20 30 40 50
(77 firms)
Note: Up to two answers could be chosen. Note: Up to two answers could be chosen.
Group of firms with improving R&D efficiency (215 firms)Group of firms with declining R&D efficiency (76 firms)

56
61
45
66
66
73
42
26
24
38
21
18
21
31
7
4
6
3
6
2
12
10
9
8
8
10
3
14
0 10 20 30 40 50 60 70 80 90 100
製造業合計(484社)
化学(76社)
鉄鋼・非鉄金属(53社)
一般・精密機械(90社)
電気機械(50社)
輸送用機械(62社)
その他(153社)
2-2-4. Evaluation of Key Domestic Production Sites, Mother Plant Functions (Manufacturing) (Ⅰ)
30
Asked about the emphasis placed on their key domestic production sites other than profitability, more than half of the respondents cited their functions as mother plants. Other answers included “continued employment of workers” and “contribution to the local economy from non-employment aspects.” Thus only 10% of the firms solely focused on profitability in their assessment.
Table 2-2-6. Non-employment Focus of Key Domestic Production Sites (Manufacturing)
Over half of the firms emphasize the function of key domestic production sites as mother plants.
(Response rate, %)
Functions as mother plantContinued
employment of workers
Contribution to local economy from non-employment aspects
Evaluation on profitability only
Other
Manufacturing total (484 firms)
Chemicals (76 firms)
Iron & steel and non-ferrous metals (53 firms)
General and precision machinery (90 firms)
Electric machinery (50 firms)
Transport equipment (62 firms)
Other (153 firms)

2-2-5. Evaluation of Key Domestic Production Sites, Mother Plant Functions (Manufacturing) (Ⅱ)
31
The most frequently cited advantages of mother plants over other factories include coordination with R&D sites and product development functions (item 3 below) and production capacity and volume scale (item 1). A fair number of respondents cited workers’ skill levels (item 7) and production of higher-valued added products (item 5). Few firms chose novelty of production facilities (item 2).
Mother plants are characterized by development functions and production capacity.
Figure 2-2-7. Advantages of Mother Plants over Other Factories (Manufacturing)
Note: Up to three answers could be chosen.
39
8
57
17
34
13
38
12
26
11
0
10
20
30
40
50
60
70
80
90
100
生産能力、数量 生産設備の新しさ 研究開発拠点との連携や新製品開発機能 新製品の初期量産への対応 高付加価値品の生産 新しい生産方式への対応 労働者の技能水準 生産可能な品目の多さ 総合的にみた生産性の高さ 他の工場の従業員への教育機能
製造業合計(361社) 一般・精密機械(72社) 電気機械(41社) 輸送用機械(51社) その他(197社)
(1)Production
capacity and volume scale
(2)Novelty of production facilities
(3)Coordination
with R&D sites and product development
functions
(4)Initial volume production of new products
(5)Production of higher value
added products
(6)Adaptation to
new manufacturing
system
(7)Workers’ skill
level
(8)Wide variety of
products that may be
produced
(9) High
productivity overall
(10)Function to
train employees of other factories
(Response rate, %)
Manufacturing total (361 firms)
General and precision machinery (72 firms)
Electric machinery (41 firms)
Transport equipment (51 firms) Other (197 firms)

2-3. Human Investment (Human Resource Development)
32

Not sufficient now
Sufficient for now
Concerned about future sufficiency
64.7
42.0 51.9
34.0
80.6
54.2
38.1
17.1
76.7
42.4
59.9
37.0
63.9
44.1
15.5
28.6
20.0
33.3
7.8
18.7
23.8
47.1
11.1
25.9
19.0
26.7
18.0
35.6
19.9 29.4 28.1 32.7
11.7
27.1 38.1 35.7
12.2
31.8 21.1
36.3
18.0 20.3
0
20
40
60
80
100
33
Securing workforce is a major concern, particularly in construction.
2-3-1. Labor Shortage (Non-manufacturing)
Figure 2-3-1. Labor Force Situation at Present and in Near Future (Non-manufacturing)
Many non-manufacturers are concerned about securing sufficient numbers of workers, particularly in construction. The concern about labor shortage is rising as a whole, in comparison with the result of last year’s survey.
(Response rate, %)
FY2015N=679
FY2016N=704
FY2015N=135
FY2016N=153
FY2015N=103
FY2016N=107
FY2015N=63
FY2016N=70
FY2015N=90
FY2016N=85
FY2015N=147
FY2016F=146
FY2015N=61
FY2016N=59
Non-manufacturing Total Wholesale & retail Real estate Construction Telecoms &
information Transportation Services

In the non-manufacturing sector, labor shortage is most acutely felt in young field workers (item 3, below left) in jobs in construction, transportation, bus driving, train operating and so forth, followed by senior skilled workers (item 2).
The most popular countermeasure is new-graduate and mid-career recruiting (item d, below right), followed by increased job opportunities for women and the elderly (item b). Far fewer respondents cited increased recruitment of foreign nationals (item c).
(1) Regular workers for lifetime employment
(2) Senior skilled field workers2
(3) Young field2 workers
(4) Highly skilled experts including in R&D
(5) Highly skilled professionals including in law and accounting
(6) Part-time and non-regular workers in the field
(7) Management/executive candidates
(8) Other
(Response rate, %)
Figure 2-3-2. Workers in Short Supply (Non-manufacturing)
Notes: 1. Up to three answers could be chosen.2. Workers engaging in tasks requiring specific
qualifications or training, such as skilled workers and operators on construction sites.
Skilled field workers are in short supply.
(Response rate, %)
Figure 2-3-3. Response to Labor Shortage (Non-manufacturing)
Note: Up to three answers could be chosen.
(a) Reduced turnover with better treatment
(b) Increased job opportunities for women and the elderly
(c) Increased recruitment of foreign nationals
(d) New-graduate and mid-career recruiting
(e) Overtime work and reallocation of existing workforce
(f) Curtailment of operating hours and reduction of business scale
(g) Labor-saving investment completed
(h) Labor-saving investment to be increased
(i) Outsourcing and contracting
(j) Increased productivity through operationalimprovements
(k) Other
2-3-2. Details of Labor Shortage and Countermeasures (Non-manufacturing)
34
34
31
50
12
29
25
16
2
0 10 20 30 40 50 60
(443 firms)
30
42
6
75
10
1
1
3
28
26
2
0 20 40 60 80
(445 firms)

45
23
17
12
42
5
0 20 40 60
1
2
3
4
5
6(619 firms)
74
22
35
1
0
4
36
1
1
0 20 40 60 80
1
2
3
4
5
6
7
8
9 (689 firms)
On-the-job training (item 1, below left) is the primary focus of human resource development, followed by mid-career recruitment of experienced workers (item 7).
As necessary labor-saving measures, many respondents cited development and advancement of software technology (item a, below right) and enhanced policy support (item e).
(1) On-the-job training
(2) Off-the-job group training
(3) Initiatives to increase active promotion and field experience of young employees
(4) Employees dispatched to graduate schools etc. in Japan
(5) Employees dispatched to graduate schools etc. overseas
(6) Personnel exchange with other companies, government agencies etc.
(7) Mid-career recruitment of experienced workers
(8) Recruitment of highly qualified skilled workers including graduate school leavers and national certificate holders
(9) Other
(Response rate, %)
Figure 2-3-4. Focus of Human Resource Developmentand Human Investment (Non-manufacturing)
Note: Up to two answers could be chosen.
OJT-focused HR development and labor-saving software development are the keys.
(Response rate, %)
Figure 2-3-5. Necessary Measures for Labor Savingthrough Capital Spending (Non-manufacturing)
Note: Up to two answers could be chosen.
2-3-3. HR Development and Capital Spending (Non-manufacturing)
35
(a) Development and advancement of softwaretechnology including AI
(b) Development and advancement of hardware technology including robots
(c) Standardization etc. combining the efforts of the government, trade organizations etc.
(d) Abolition of regulations, etc. that hinder replacement through capital spending
(e) Enhanced policy support including preferential lending and taxation for capital spending
(f) Other

55
55
32
23
8
11
19
31
3
1
0 20 40 60 80 100
(696 firms)
In order to improve productivity, many non-manufacturers are focusing on polyvalence of employees (item 1 below), personnel management skills including operational arrangements (item 2) and software investment and related initiatives (item 3). A smaller number of respondents cited labor saving and efficiency through capital spending (item 4).
(1) Improvement of productivity through enhanced employee training and polyvalence (i.e., the ability to assume different tasks at the same time)
(2) Labor saving and efficiency through personnel positioning and operational arrangements
(3) Improvement of efficiency through promotion of software investment and information technology
(4) Labor saving and efficiency through capital spending
(5) Improvement of efficiency by expanding business scale and pursuing economiesof scale through M&A etc.
(6) Enhanced collaboration with competitors and suppliers
(7) Improvement of average sale per client through differentiation and sophisticationof services offered
(8) Reduction of costs, including cost of merchandise and SGA
(9) Nothing in particular
(10) Other
(Response rate, %)
Figure 2-3-6. Focus of Efforts for Productivity Improvement (Non-Manufacturing)
Note: Up to three answers could be chosen.
Focus on skills and software to improve productivity
2-3-4.Focus of Efforts for Productivity Improvement (Non-manufacturing)
36

Not sufficient now
Sufficient for now
37
About 50% of manufacturers are concerned about how to secure workforce.
2-3-5. Labor Shortage (Manufacturing)
Figure 2-3-7. Labor Force Situation at Present and in Near Future (Manufacturing)
According to the FY2016 survey, 50% of manufacturers do not have a sufficient workforce or are concerned about future sufficiency. In comparison with the FY2015 survey, the result points to rising concern about how to secure workforce in general.
(Response rate, %)
Concerned about future sufficiency
71.4
49.6
84.4
64.2 72.0
45.8
68.9
43.4
61.0
41.3
69.9 48.8
10.0
20.8
5.6
16.0 8.0
16.7
18.0
26.4
15.3
28.6
8.8
19.7
18.6 29.6
10.0 19.8 20.0
37.5
13.1
30.2 23.7
30.2 21.3
31.5
0
20
40
60
80
100
FY2015N=531
FY2016N=510
FY2015N=90
FY2016N=81
FY2015N=25
FY2016N=24
FY2015N=61
FY2016N=53
FY2015N=59
FY2016N=63
FY2015N=296
FY2016N=289
ManufacturingTotal Chemicals Iron & steel Electric machinery Transport
equipment Other

In the manufacturing sector, the labor shortage is perceived to be particularly acute at production sites, as shortage of young factory engineers (item 3, below left) was cited most frequently, followed by senior workers (item 2) and R&D experts (item 4).
Key countermeasures include enhanced recruiting (item d, below right), followed by increased job opportunities for women and the elderly (item b). Far fewer respondents cited increased recruitment of foreign nationals (item c).
(Response rate, %)
Figure 2-3-8. Workers in Short Supply (Manufacturing)
Note: Up to three answers could be chosen.
Strong concern about the shortage of young engineers
(Response rate, %)
Figure 2-3-9. Response to Labor Shortage (Manufacturing)
Note: Up to three answers could be chosen.
2-3-6. Details of Labor Shortage and Countermeasures (Manufacturing)
38
(a) Reduced turnover with better treatment
(b) Increased job opportunities for women and the elderly
(c) Increased recruitment of foreign nationals
(d) New-graduate and mid-career recruiting
(e) Overtime work and reallocation of existing workforce
(f) Curtailment of operating hours and reduction of business scale
(g) Labor-saving investment completed
(h) Labor-saving investment to be increased
(i) Outsourcing and contracting
(j) Increased productivity through operationalimprovements
(k) Other
(1) Regular workers for lifetime employment
(2) Senior workers, including engineers, at factories
(3) Young workers, including engineers at factories
(4) Highly skilled experts, including in R&D
(5) Highly skilled professionals, including in law and accounting
(6) Part-time and non-regular workers in the field
(7) Management and executive candidates
(8) Other
18
32
66
30
28
24
15
1
0 10 20 30 40 50 60 70
(310 firms)
15
35
16
73
12
2
3
14
24
39
1
0 20 40 60 80
(311 firms)

2-4. Capital Spending Overseas and M&A
39

2-4-1. Capital Spending Overseas (Overview)
Figure 2-4-1. Trend of Capital Spending Overseas (Consolidated Basis)
Planned capital spending overseas (consolidated basis) shows a decline of 1.3% overall. In the manufacturing sector, spending is expected to turn up, largely driven by a substantial increase in chemicals,
despite continued cutbacks on spending in transport equipment and reduced investment in both general and electric machinery. Planned spending in the non-manufacturing sector shows the first decline in seven years, led by mining.
FY2015 (actual)(762 firms)
FY2016 (planned)(928 firms)
Total - 1.6 - 1.3
Manufacturing total - 3.0 4.7
Chemicals 7.4 30.3
General machinery 16.5 - 5.2
Electric machinery 17.7 - 0.2
Transport equipment - 9.0 - 1.1
Non-manufacturing total 1.8 - 13.2
Retail - 11.6 22.8
Real estate 64.0 20.1
Mining 0.0 - 29.1
(Year-on-year, %)
40

28.3
34.6
19.8
0
10
20
30
40
50
60
02 03 04 05 06 07 08 09 10 11 12 13 14 15 16
Manufacturing
Non-manufacturing
Total
(%)
2-4-2. Overseas Capital Spending Ratio
41
Figure 2-4-2. Trend of Overseas Capital Spending Ratio(Overseas/(Overseas + Domestic))
Capital spending overseas follows a downtrend as a percentage of total capital spending.
Figure 2-4-3. Overseas Capital Spending Ratio by Industry (Consolidated Basis)
Notes: Solid lines: consolidated overseas/(non-consolidated domestic + consolidated overseas)Dotted lines: consolidated overseas/(consolidated domestic + consolidated overseas)Data on consolidated domestic capital spending are available from the FY2010 and subsequent surveys.
Planned
(Planned)(FY)
The overseas capital spending ratio (consolidated basis) for FY2016 is 28.3% in total and 34.6% in manufacturing. A decline for the third consecutive year is planned in manufacturing due to the growth rate of domestic spending surpassing that of spending overseas.
By industry, a decline is planned in transport equipment, which carries a considerable weight, but the overseas capital spending ratio in the industry remains at a high level compared with other key industries.
36.9
46.2
15.5
31.1
40.1
34.6
43.1
15.6
31.2 34.8
0
10
20
30
40
50
60
製造業
輸送用機械
電気機械
化
学
一般機械
2015年度
2016年度
Manufacturing Transport equipment
Chemicals
(%)
FY2015
FY2016
Electric Machinery
General machinerytotal

0
100
200
300
400
500
600
02 03 04 05 06 07 08 09 10 11 12 13 14 15 16
(FY)
(FY2002 =100)
0
50
100
150
200
250
300
350
400
02 03 04 05 06 07 08 09 10 11 12 13 14 15 16
(FY)
(FY2002 = 100)
2-4-3. Trend of Capital Spending Overseas (Time Series)
42
Converted into US dollars using the foreign exchange rates assumed by the firms, capital spending in FY2015 (actual) contracted in both the manufacturing and the non-manufacturing sectors (down 11.5% and 6.7% respectively), largely due to the strong yen.
Capital spending for FY2016 (planned) shows an increase in both yen and dollar terms.
Figure 2-4-4. Trend of Capital Spending Overseas
[Manufacturing] [Non-manufacturing]PlannedPlanned
Notes: 1. Dotted line: Estimated figures in US dollars calculated using the trend of the dollar-yen rate.2. Assumed exchange rates obtained in the survey (USD 1 = JPY 112.8 for manufacturing, USD 1 = JPY 114.0 for non-manufacturing) are used for FY2016.
Domestic capital spending
Capital spending overseas(yen basis)
Capital spending overseas(dollar basis)
Domestic capital spending
Capital spending overseas(dollar basis)
Capital spending overseas(yen basis)

88 92
0
10
20
30
40
50
60
70
80
90
100
過去3年
(実績349社)
向こう3年
(見通し348社)
Return of investment
Actual and outlook data both indicate some 10% of investment returning to Japan. In view of the Abenomics-induced correction to the unbalanced exchange rates in favor of the yen, 12% of the firms have reportedly
brought back investment to Japan from abroad. The three-year outlook indicates that 8% of the companies will do so. However, 70% of the respondents consider that the return of investment will not drive domestic capital spending.
43
2-4-4. Return of Investment to Japan (Manufacturing)
Figure 2-4-5. Return of Investment to Japan (Manufacturing)
(Response rate, %)
Figure 2-4-6. Impact of Return of Investment to Japan on Capital Spending (Manufacturing)
Capital spending not increased by the return of production to Japan
Capital spending increased by the return of production to Japan
(4) No change in plan
(Response rate, %)
30 32
70 68
0
10
20
30
40
50
60
70
80
90
100
過去3年
(実績60社)
向こう3年
(見通し50社)
(1) Partial transfer of production to Japan
(2) Cancellation of production transfer overseas
(3) Partial production transfer to Japan and cancellation of production transfer overseas
Past 3 years(actual for 349 firms)
Coming 3 years(outlook for 348 firms)
Past 3 years(actual for 60 firms)
Coming 3 years(outlook for 50 firms)

44
Convenience is the key, including distance and logistics to where demand is.
2-4-5. Factors in Selecting Location for Capital Spending in Japan and Overseas(Manufacturing)
Figure 2-4-7. Factors in Determining Where to Place Capacity Investment
In deciding where to execute capital spending, firms give priority to the need to serve demand where it exists, as over 80% of the respondents emphasize convenience, including distance and logistics to reach where demand lies (item 1 below). Quite a few firms also cited low labor cost (item 4) and synergy with existing factories (item 7).
Notes: Up to two answers could be chosen. Data covers firms with production sites overseas.
(1) Convenience, including distance and logistics to where demand is
(2) Corporate tax, power charges and other costs
(3) Any restrictions and transparency of legislation
(4) Low labor cost
(5) Ease of securing workforce
(6) Ports, roads and other social infrastructure
(7) Synergy with existing factories
(8) Ease of securing suppliers
(9) Support available from local governments
(10) Availability of idle land and room for facility expansion
(11) Other
85
4
8
20
10
12
19
6
2
2
3
0 10 20 30 40 50 60 70 80 90
(331 firms)
(Response rate, %)

25.7
18.4
26.6
60.3
44.4 46.7
0
10
20
30
40
50
60
70
2011 12 13 14 15 16
Domestic supply capacity Overseas totalIncrease Maintain Decrease
Overseas
supply capacity
Increase 18.4 41.1 4.0 63.5
Maintain 5.1 26.6 1.7 33.4
Decrease 0.3 1.7 1.1 3.1
Domestic total 23.8 69.4 6.8 100.0
2-4-6. Domestic and Overseas Operation: Medium-term Outlook (Manufacturing)
45
Figure 2-4-8. Medium-Term (over approx. 3 years) Domestic and Overseas Supply Capacity (Manufacturing)
The share of manufacturers that are enhancing medium-term supply capacity overseas without increasing their domestic supply capacity has bottomed out, whereas the share of those enhancing both domestic and overseas supply capacity (item 2 below) in the medium term turned down, after following an uptrend that started in FY2013. The share of manufacturers maintaining both domestic and overseas supply capacity (item 3), meanwhile, continues to rise.
“Relative overseas enhancement” bottoms out, while “enhance, both domestically and overseas” loses weight.
(1) Relative overseas enhancement
(2) Enhance, both domestically and overseas
(3) Maintain, both domestically and overseas
(4) Relative domestic enhancement
(FY)
Distribution of responses in FY2016
(1) (1)
(1)
(2)
(3)
(3)
(4)
(4) (4)
(Response rate, %)
(Firms providing valid responses for the FY2016 survey numbered 353.)

[Electric machinery](41 firms gave valid responses to the FY2016 survey.)
[Automobiles](47 firms gave valid responses to the FY2016 survey.)
29.8
81.2 93.2
86.8
66.7
51.1
0
20
40
60
80
100
2011 12 13 14 15 16
66.7
46.3
0
20
40
60
80
100
2011 12 13 14 15 16
Domestic supply capacity Overseas totalIncrease Maintain Decrease
Overseas supply
capacity
Increase 17.0 42.6 6.4 66.0Maintain 2.1 29.8 2.1 34.0Decrease 0.0 0.0 0.0 0.0
Domestic total 19.1 72.3 8.5 100.0
Domestic supply capacity Overseas totalIncrease Maintain Decrease
Overseas supply
capacity
Increase 19.5 43.9 0.0 63.4Maintain 4.9 22.0 2.4 29.3Decrease 0.0 4.9 2.4 7.3
Domestic total 24.4 70.7 4.9 100.0
2-4-7. Domestic and Overseas Operation: Medium-term Outlook (Electric Machinery and Automobiles)
46
Figure 2-4-9. Medium-Term (over approx. 3 Years) Domestic and Overseas Supply Capacity (Electric Machinery and Automobiles)
(1) Relative overseas enhancement
(2) Enhance both domestically and overseas
(3) Maintain both domestically and overseas(4) Relative domestic enhancement
(1) (1)
(1) (3)(4)
(Response rate, %) (Response rate, %)
(1) Relative overseas enhancement
(2) Enhance both domestically and overseas
(3) Maintain both domestically and overseas
(4) Relative domestic enhancement
(FY) (FY)
(4) (4)
(4)(4) (4)
(2)(2)(1)
(1) (1)
(3)
(3)(3)

2-4-8. M&A Deals and Objectives(Ⅰ)
About one-third of manufacturers and just over 20% of non-manufacturers have closed M&A deals since FY2010.
Figure 2-4-10. M&A Deals (Actual for FY2010-15)
Many M&A deals are concluded for expansion of business scale or market share.
Note: Up to two answers could be chosen.
47
23 23
36
11 8
67
9
21
7
23
12
3
78
5
0
20
40
60
80
100
国内で実施 海外で実施 国内で交渉・検討したが不成立 海外で交渉・検討したが不成立 検討もしていない 事業売却を実施
製造業(477社) 非製造業(625社)
(1) Concluded in Japan
(2) Concluded overseas Concluded in Japan
or overseas
(3)Unsuccessful
negotiation in Japan
(4) Unsuccessful negotiation
overseas
(5)No deal considered
(6)Business sold
(Response rate, %)
Manufacturing (477 firms) Non-manufacturing (625 firms)

48
2-4-8. M&A Deals and Objectives(Ⅱ)
Primary objectives of M&A include expansion of business scale or market share (item 1, below right) and expansion of the scope of business (item 4). Quite a few manufacturers also cited acquisition of target company’s technology (item 2).
Many M&A deals are concluded for expansion of business scale or market share.
66
34
3
42
12 10
2
68
9 3
42
19
8 7
0
20
40
60
80
1 2 3 4 5 6 7
製造業(377社) 非製造業(372社)
(Response rate, %)Figure 2-4-11. Primary Objectives of M&A
(1) (2) (3) (4) (5) (6) (7)Expansion of
business scale or market share
Acquisition of target company’s
technology
Acquisition of target company’s
brand or trademark
Expansion of scopeof business
Penetration into areas with weak
presence
Acquisition of suppliers or clients
Other
Non-manufacturing (372 firms)Manufacturing (377 firms)
Note: Up to two answers could be chosen.

2-5. Investment in Information Technology
49

2-5-1. Trend of Investment in Information Technology
Planned IT investment for FY2016 is up 26.1% as a whole, with investment rising in both manufacturing (up 16.9%) and non-manufacturing (up 36.4%). Thus, it is the non-manufacturing sector that leads the substantial growth.
Many firms have been following this uptrend in IT investment in recent years, as 70% of the respondents constantly report a modest increase or substantial increase.
IT investment exhibits strong growth.
IndustryFY2015Actual
(939 firms)
FY2016Planned
(1,098 firms)
Total 17.1 26.1
Manufacturing total 10.4 16.9
General machinery - 6.4 19.0
Electric machinery 6.9 - 3.6
Transport equipment 12.5 16.4
Non-manufacturing total 23.1 36.4
Wholesale & retail 20.8 44.0
Transportation - 10.3 61.2
Electric power & gas 69.3 37.8
Figure 2-5-1. Plan for IT Investment (Year-on-year, %)
Note: IT investment includes costs of acquiring intangible assets and software recorded as expenses.
Modest increase
Figure 2-5-2. Trend of IT Investment in Recent Years(Comparison with Tangible Fixed Asset Investment)
(Response rate, %
)
Substantial increase
Modest reduction
Substantial reduction
50
8 5
62 66
26 25
3 4
0
10
20
30
40
50
60
70
80
90
100
製造業
(495社)
非製造業
(680社)Manufacturing
(495 firms)Non-manufacturing
(680 firms)
Already utilizing
Considering utilizing
No utilization planned despite rising interest among employees
No utilization planned, with little interest among employees
2-5-2. Drivers of IT Investment, Utilization of the Internet of Things
51
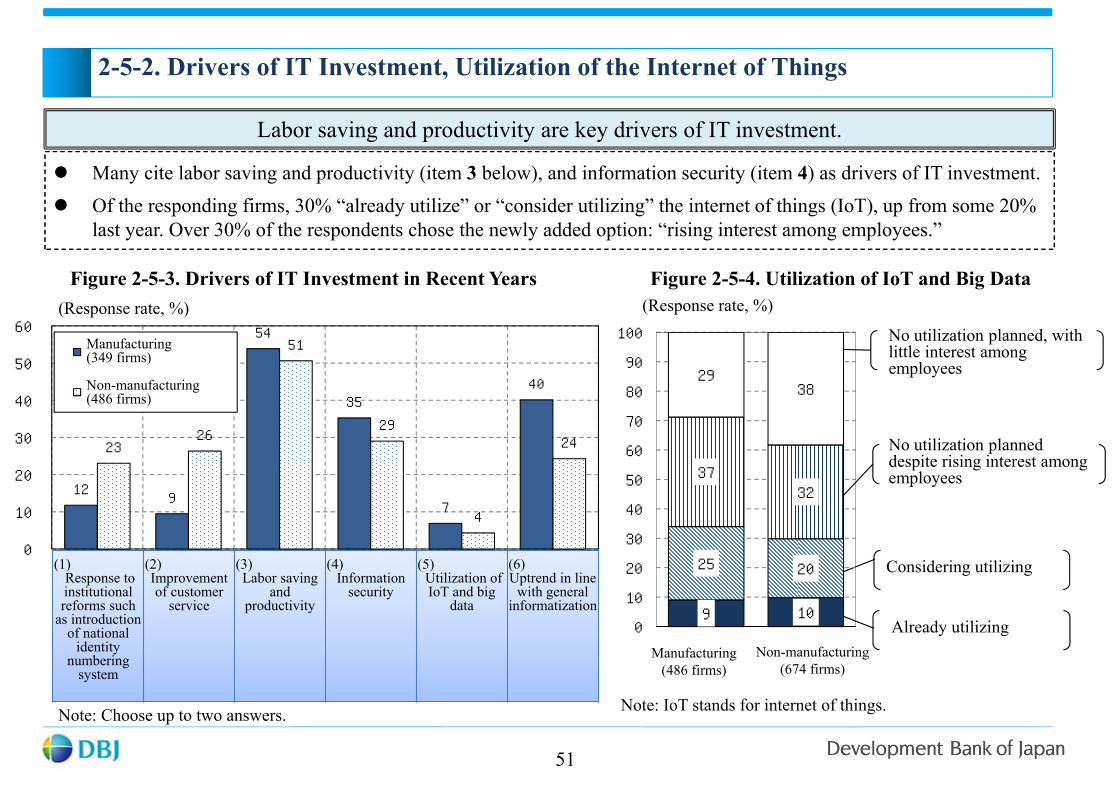
Many cite labor saving and productivity (item 3 below), and information security (item 4) as drivers of IT investment. Of the responding firms, 30% “already utilize” or “consider utilizing” the internet of things (IoT), up from some 20%
last year. Over 30% of the respondents chose the newly added option: “rising interest among employees.”
Labor saving and productivity are key drivers of IT investment.
Figure 2-5-3. Drivers of IT Investment in Recent Years
12 9
54
35
7
40
23 26
51
29
4
24
0
10
20
30
40
50
60
製造業(349社)
非製造業(486社)
(Response rate, %)
Figure 2-5-4. Utilization of IoT and Big Data(Response rate, %)
9 10
25 20
37 32
29 38
0
10
20
30
40
50
60
70
80
90
100
製造業
(486社)
非製造業
(674社)
Note: Choose up to two answers. Note: IoT stands for internet of things.
Manufacturing (349 firms)
Non-manufacturing(486 firms)
Manufacturing(486 firms)
Non-manufacturing(674 firms)
(1)Response to institutional reforms such
as introduction of national
identity numbering
system
(2)Improvement of customer
service
(3)Labor saving
and productivity
(4)Information
security
(5)Utilization of IoT and big
data
(6)Uptrend in line
with general informatization

2-6. Actions for Growth and Competitiveness
52

2-6-1. Exploration of Opportunities in Growth Markets (Ⅰ)
53
About 40% of manufacturers and non-manufacturers are exploring opportunities in medium-term growth markets.
Specific cases include medical care markets for chemicals and other manufacturing industries, as well as hotel operation in response both to the rising number of inbound tourists and to opportunities related to the liberalization of power supply in the non-manufacturing sector.
Figure 2-6-1. Exploration of Opportunitiesin Medium-Term Growth Markets
About 40% of the firms are exploring opportunities in medium-term growth markets.
(Response rate, %)
No plan, due to priority given to core business
Planned
Already in progress
Figure 2-6-2. Specific Examples of Potential Opportunities in Domestic Growth Markets
Industry Examples
Manufacturing
Chemicals Regenerative/cellular medicine, cancer treatment, generics, fine chemicals, methanol fuel cells, electronic materials
General machinery Medical equipment, 3D printers, hydrogen business, water treatment, long-term care, robotics
Electric machinery Medical care, power electronics, motors for electric vehicles, automated driving, next-generation energy
Transport equipment Components for medical care, motor drive parts, robotic support devices
Non-m
anufacturing
Transportation Condominium sales, plant factories, airport operation, seaport operation, tourism, elderly care business, childcare business
Wholesale & retail Independent power supply, elderly care business, telecommunications, e-commerce
Construction &real estate
Hotel operation, commercial operation, environmental business, agriculture, logistics
Note: Opportunity in growth market = Offering of any new business or service other than the existing core business.
35 32
8 9
58 59
0
20
40
60
80
100
製造業
(505社)
非製造業
(686社)
Note: Respondents include group subsidiaries of major firms and public-private joint ventures established for specific projects.
Non-manufacturing(686 firms)
Manufacturing(505 firms)

54
As reasons for exploring opportunities in growth markets, more respondents cited new pillar for future profit (item 1, below left) than synergy with existing business operation (item 6) and part of business diversification (item 2).
Figure 2-6-3. Reasons for Exploring New Market Opportunities or Business Operation
Exploration of opportunities in growth markets as a pillar for future profit
2-6-2. Exploration of Opportunities in Growth Markets (Ⅱ-ⅰ)
Note: Up to two answers could be chosen.
0
10
20
30
40
50
60
70
80
製造業(272社) 非製造業(314社)
(1)New pillar for future profit
(2)Part of business diversification
(3)Expectations for
growth from shareholders and investors
(4)Keeping pace
with competition
(5)Declining
profitability of existing business operation
(6)Synergy with
existing business operation
(7)Significant
growth potential
(8)Securing job
opportunities for employees
(9)Other
(Response rate, %)
Manufacturing (272 firms)
Non-manufacturing(314 firms)

55
As reasons for not exploring opportunities in growth markets, the largest number of respondents cited priority given to existing business operation (item 3, below right), followed by expected profitability or growth in existing business operation (item 1).
Exploration of opportunities in growth markets as a pillar for future profit
2-6-2. Exploration of Opportunities in Growth Markets (Ⅱ-ⅱ)
Note: Choose up to two answers.
0
10
20
30
40
50
60
70
80
1 2 3 4 5 6 7 8 9
製造業(210社) 非製造業(378社)
(1) (2) (3) (4) (5) (6) (7) (8) (9)Expected
profitability or growth in
existing business operation
Expected growth through overseas
operation
Priority on improving
profitability of existing business
operation
Labor shortage Lack of funds Priority to downscaling unprofitable
business
Pastunsuccessful experience
Business scope limited by
intention of parent or
shareholders
Other
Figure 2-6-4. Reasons for Not Exploring New Market Opportunities or Business Operation
(Response rate, %)
Non-manufacturing(378 firms)
Manufacturing (210 firms)

2-6-3. Growth Strategy of Non-manufacturers
56
Although future demand is likely to shrink in many of the non-manufacturing industries due to the decrease and aging of the Japanese population, many firms cited new business operation in Japan as the focus of their growth strategy.
By industry, a relatively large number of firms in construction, transportation and wholesale & retail responded that they focus on overseas operation. In addition, some wholesale & retail firms cited expansion of business to other parts of the country.
Figure 2-6-5. Focus of Non-manufacturers for Growth
Many non-manufacturers are focused on new business operation in Japan.
(Response rate, %)
Enhance & accelerate overseas operation
Expand business to other parts of Japan
Operate new business in Japan
Promote collaboration with selected competitors
Expect continued growth of owned market or demand
Other
19
29
24
9
27
11
10
6
20
6
11
7
39
40
35
40
27
48
8
7
8
16
7
6
14
7
7
17
17
17
10
10
7
13
10
11
0 10 20 30 40 50 60 70 80 90 100
非
製
建
設
卸
売
不
動
運
輸
そ
の
Non-manufacturing total (631 firms)
Construction (68 firms)
Wholesale & retail (143 firms)
Real estate (87 firms)
Transportation (135 firms)
Other (198 firms)

Appendices
57

58
(Appendix 1-1) Capital Spending in FY2015, 2016 and 2017
Appendix 1-1. Domestic Capital Spending in FY2015, 2016 and 2017
FY2015 (actual)
(1,973 firms)
FY2016 (planned)
(2,077 firms)
FY2017 (planned)
(883 firms)
FY2014Actual
FY2015Actual
Change2015/14
FY2015Actual
FY2016Planned
Change2016/15
FY2016Planned
FY2017Planned
Change2017/16
Total 171,043 179,236 4.8 157,862 175,128 10.9 35,896 33,856 - 5.7
(excluding electric power) 147,963 153,104 3.5 151,822 168,332 10.9 34,591 32,807 - 5.2
Manufacturing 53,090 57,743 8.8 58,196 66,642 14.5 13,888 13,142 - 5.4
Non-manufacturing 117,953 121,493 3.0 99,666 108,486 8.8 22,008 20,714 - 5.9
(excluding electric power) 94,873 95,361 0.5 93,626 101,690 8.6 20,703 19,665 - 5.0
(JPY 100 million, %)

-20
-10
0
10
20
30
40
0 10 20 30 40 50 60 70 80 90 100
-20
-10
0
10
20
30
40
0 10 20 30 40 50 60 70 80 90 100
(Appendix 1-2) Actual Performance in FY2015 (Skyline Graph)
59
(Year-on-year, %)
Notes: Figures indicate changes in FY2015 on previous year. Figures in parentheses ( ) indicate contributions to the whole manufacturing or non-manufacturing sector.
Chemicals0.9 (0.1)
Iron & steel-2.8 (-0.3)
General machinery11.6 (1.3)
Electric machinery32.5 (4.0)
Transport equipment13.4 (3.2)
Other-4.2 (-0.6)
Construction-13.8(-0.5)
Real estate6.1 (0.7) Transportation
13.1 (2.9)
Telecommunications & information
-13.8 (-3.3)Other
13.8 (3.8)
(Share in manufacturing, %)(Year-on-year, %)
(Share in non-manufacturing, %)
Manufacturing average8.8%
Non-manufacturing average3.0%
Wholesale & retail-8.9 (-1.0)
Appendix 1-2. Composition and Growth of Capital Spending, by Major Industry (Actual FY2015 Data)
Food & beverages-5.0 (-0.3)
Paper & pulp3.2 (0.1)
Services19.6 (0.4)
Non-ferrous metals30.8 (0.3) Precision machinery
25.5 (0.5)

11
18
28
0 4
10 9 13
11
6 9 9
0
10
20
30
40
50
製造業(500社)
非製造業(705社)
(Appendix 2) Impact of Kumamoto Earthquake
60
Regarding the impact of the Kumamoto Earthquake in April, many manufacturers cited disruption of supply chain (item 3 below) and disruption of logistics and transportation networks (item 2), indicating the existence of earthquake and other disaster preparedness problems that are larger than the incidents themselves and out of their control.
Appendix 2-1. Impact of Kumamoto Earthquake (Present Survey)
Manufacturers experienced supply chain disruption, among others.
(Number of firms affected/respondents, response rate %)
Manufacturing (500 firms)
Non-manufacturing(705 firms)
(1) (2) (3) (4) (5) (6)Damage to facilities halting production and sales activities
Disruption of logistics and
transportation networks, and
water/gas stoppage
Disruption of supply chain
Harmful rumors and reduction of tourists
Deterioration of consumer sentiment
and self-imposed check on demand
Increased demand for group companies due to reconstruction demand and alternate
production

Many expect hired foreign nationals to serve as regular workers equivalent to Japanese employees (item 2 below). Non-manufacturers often combined this role with that of future key persons at overseas offices (item 5). Also, a certain number of respondents cited temporary workforce (item 3) and temporary acceptance as trainees, etc. (item 4)
(Response rate, %)Note: Up to two answers could be chosen.
Foreign employees are expected to play the same roles as Japanese employees.
3
55
22
13
21
9
11
5
51
20
21
43
12
3
0 10 20 30 40 50 60
製造業(569社)
非製造業(453社)
Appendix 3-1. Expected Roles of Foreign Employees
(1) Management or executive candidates
(2) Regular workers equivalent to Japanese employees
(3) Temporary workforce including seasonal and part-time employees
(4) Temporary acceptance as trainees etc.
(5) Future key persons at overseas offices
(6) Experts including in R&D
(7) Other
(Appendix 3) Expected Roles of Foreign Nationals
61
Manufacturing (569 firms)Non-manufacturing(453 firms)

(Appendix 4) Serving Increased Number of Inbound Tourists (Non-manufacturing)
62
As actions to serve the increasing number of inbound tourists, many expressed the intention to meet the demand by enhancing advertising and public relations (item 6 below) and offering new products and services (item 4). Respondents in some industries also cited expansion of production capacity to meet the increased demand (item 1) and emphasis on workforce enhancement (item 2).
Appendix 4-1. Actions by Firms Expecting Business Impact from Increased Number of Inbound Tourists (Non-manufacturing)
Focus is on advertising, PR, new service offerings and multilingual support.
(Response rate, %)
17
8
14
27 29 28
18
11
0
10
20
30
40
50
来客数・販売数量増に伴う設備の増強 来客数・販売数量増に伴う人員の増強 他社や自治体等との連携強化 訪日外国人向けの新製品やサービスの検討・開発 外国語対応強化 訪日外国人客の取り込みのための宣伝、PRの強化 来客数の増加等が期待されるが、現状、特段の対応をしていない その他
非製造業合計(300社)
卸売・小売(61社)
サ-ビス(33社)
運輸(90社)
その他(116社)
Notes: Up to two answers could be chosen.Data on impact on business do not include those firms which said that the impact would be limited.
Non-manufacturing total (300 firms)
Wholesale & retail (61 firms)
Services (33 firms)
Transportation (90 firms)
Other (116 firms)
(1) (2) (3) (4) (5) (6) (7) (8)Capacity
enhancement in anticipation of increased footfall and
sales volume
Workforce enhancement in anticipation of increased footfall and
sales volume
Closer coordination with other
firms and local governments
Examination &development
of new products and services for
inbound tourists
Enhanced multilingual
services
Enhanced advertising and PR to capture
inbound tourists
No action in particular
Other

77
17
4 5
23
2
0
20
40
60
80
100
ビジネス上のチャンスであり、需要増加を積極的に取り込みたい 客数は増加しているが、必ずしも増益に結びついていない 日本人客からの苦情増など、負の影響もみられる 設備や人員面のキャパシティが限界に達しつつある 為替変動や東京五輪終了などを契機とした急減の可能性を懸念 その他
非製造業合計(264社)
卸売・小売(52社)
サ-ビス(28社)
運輸(80社)
その他(104社)
(Appendix 5) Awareness of Increase in Inbound Tourists (Non-manufacturing)
63
Almost 80% of the firms whose business is directly impacted by the increase in inbound tourists responded that they want actively to capture the increased demand (item 1 below). However, some respondents are concerned about a possible plunge in demand due to changes in exchange rates etc. (item 5).
Aggressive efforts to capture increased demand
(Response rate, %)
Note: Choose up to two answers.Data only include those firms reporting impact on their business.
Appendix 5-1. Situational Analysis by Firms Anticipating Impact from Increase in Inbound Tourists (Non-Manufacturing)
Non-manufacturing total (264 firms)
Wholesale & retail (52 firms)
Services (28 firms)
Transportation (80 firms)
Other (104 firms)
(1) (2) (3) (4) (5) (6)Want actively to capture increased
demand
Does not necessarily help increase profit
Also has negative impact such as
increased complaints from
Japanese customers
Physical and human capacities
are being extended to the limit.
Concerned about a possible plunge in
demand due to changes in
exchange rates, etc.
Other

(Appendix 6) Actual Capital Spending vs. Planned Spending for Previous and Current Years
64
Experience indicates that the year-on-year change in actual capital spending often approximates the year-on-year change in planned capital spending, thus providing a clue to predicting actual performance in the coming year.
Our data on the firms responding to the questions on planned capital spending for both FY2016 and FY2015 imply an increase of some 2% in planned, and hence actual, capital spending.
Appendix 6-1. Change in Actual and Planned Capital Spending on Previous Year
-10
-8
-6
-4
-2
0
2
4
6
8
10
12
2010 11 12 13 14 15 16-10
-8
-6
-4
-2
0
2
4
6
8
10
12
2010 11 12 13 14 15 16-10
-8
-6
-4
-2
0
2
4
6
8
10
12
2010 11 12 13 14 15 16
(Year-on-year, %) (Year-on-year, %) (Year-on-year, %)
(1) Total (2) Manufacturing (3) Non-manufacturing
Planned spendingCurrent/previous year
Actual spendingCurrent/previous year

65
(Appendix 7) Capital Spending, by Region (Planned for FY2016)
Planned capital spending by region for FY2016 (covering 5,159 companies: see Note) shows the fifth consecutive year of increase overall (up 11.1%), with positive growth observed in all regions except Hokuriku, led by transportation, transport equipment, wholesale & retail, chemicals and real estate.
Actual capital spending in FY2015 rose for the fourth consecutive year nationwide (up 4.5%), with the decline in North Kanto/Koshin and Kansai more than offset by the increase in the remaining eight regions.
Note: Our survey on capital spending by region covers medium-sized firms (capitalized at JPY 100 million up to JPY 1 billion), as well as large-sized companies.(11,203 firms in total, of which 5,159 firms responded to the questions on planned capital spending by region).
Difference from 2015/2014 in parentheses ( )(%)
Appendix 7-1. Change in Capital Spending, by Region, FY2016/FY2015
Appendix 7-2. Change in Capital Spending, by Region and by Sector, FY2016
Over 20.0%10.0-20.0%0.0-10.0% Hokkaido 9.8 (11.5)
Tohoku 11.4 (4.8)Hokuriku -2.1 (7.1)
Tokai 13.3 (11.8)Kansai 20.1 (-2.3)
Chugoku 27.4 (9.3)
Shikoku 21.7 (18.2)Kyushu 3.5 (6.6)
Under 0.0%
North Kanto and Koshin 10.9 (-0.1)
Tokyo metropolitan area 14.4 (4.3)
Nationwide 11.1 (4.5)
Total Manufacturing Non-manufacturing
Hokkaido 9.8 - 3.0 13.6Tohoku 11.4 20.8 1.2North Kantoand Koshin 10.9 6.8 22.3Tokyo met. area 14.4 25.5 11.6Hokuriku - 2.1 - 1.5 - 2.9Tokai 13.3 12.5 16.4Kansai 20.1 15.3 23.0Chugoku 27.4 31.0 17.8Shikoku 21.7 17.8 33.4Kyushu 3.5 2.9 4.2Nationwide 11.1 14.9 8.9

66
(Appendix 8) Trend of Capital Spending Overseas
-25
-15
-5
5
15
25
0 10 20 30 40 50 60 70 80 90 100
Total average-1.3%North America
14.0 (3.5)Europe
15.2 (1.9)
-25
-15
-5
5
15
25
0 10 20 30 40 50 60 70 80 90 100
Europe20.5 (2.4)
Asia-5.5 (-2.1)
Figure 8-1. Composition and Growth of Capital Spending, by Region (Actual for FY2015) (%)
Figure 8-2. Composition and Growth of Capital Spending, by Region (Planned for FY2016) (%)
Total average-1.6%North America
6.1 (1.5)
Other-13.1 (-3.3)
Asia-4.7 (-1.8)
Other-20.8 (-4.9)
(Year-on-year, %)
(Response rate, %)
(Response rate, %)
(Year-on-year, %)
Notes: Figures show changes of planned FY2016 spending vs. actual FY2015 performance. Figures in parentheses ( ) indicate contributions to the total. Asia includes China.
Notes: Figures show year-on-year changes of actual FY2015 performance vs. FY2014. Figures in parentheses ( ) indicate contributions to the total.

67
©Development Bank of Japan Inc. 2016
This material has been prepared solely for the purpose of providing information, and is not intended as a solicitation for any transaction
whatsoever. DBJ does not guarantee the feasibility of any transactions described herein. Although this material is based on information that
we find trustworthy, we do not warrant its accuracy or certainty. You are advised that any action by you based on this material is at your own
risk. This material is protected under the Copyright Act. Please contact us for reprinting or copying all or any part of this material, as such act
requires the authorization of the copyright owner. Any citation, reprint or copy pursuant to the Copyright Act should always be accompanied
by the explicit statement: “Source: Development Bank of Japan.”


