Embed Size (px)
Citation preview
Survey of Young Americans’ Attitudes towards Politics and Public Service 22nd Edition: September 19 - October 3, 2012
N=2,123 18-29 Year Olds in English and Spanish (with Knowledge Networks) Margin of Error for entire sample: 2.1% at the 95% level
Margin of Error for college students: 5.0% at the 95% level 1. With regard to school, are you currently enrolled at any of the following? Please select all that apply: Total: 4-Year 18-29 College High school .................................................... 3% - Trade/Vocational school ................................ 2% 1% 2-year junior college or community college .. 12% 3% 4-year college or university ........................... 22% 100% Graduate school ............................................. 4% - Business school or professional school.......... 2% - Not enrolled in college/university but taking at least one course .......................................... 1% - Not currently enrolled in any of these ............ 54% - Decline to answer ........................................... 1% - [If currently enrolled in a 4-year college, ask]
2. In which year of college are you?
Total: 4-Year
18-29 College (n=714) (n=470)
First year student/Freshman ........................... 26% 19% Second year student/Sophomore .................... 25% 20% Third year student/Junior ............................... 23% 27% Fourth year student/Senior ............................. 19% 24% Fifth year student or higher ............................ 7% 9% Decline to answer ........................................... - -

Harvard IOP Survey – Fall 2012 Page 2 of 28
3. We understand that plenty of young people are not registered to vote, but we are wondering if you are registered to vote?
Total: 4-Year 18-29 College Yes ................................................................. 67% 78% No ................................................................... 28% 20% Don’t know .................................................... 5% 2% Decline to answer ........................................... 1% - [If respondent was over 18 in 2008, ask Q4-Q5] The following are questions about voter registration and voting… 4. Which of the following statements best describes your voter registration status for the last presidential
election held on November 4th, 2008? Total: 4-Year 18-29 College (n=2,123) (n=470) I was registered .............................................. 47% 33% I thought about registering, but didn’t ........... 4% 4% I tried to register, but was unable to ............... 2% 3% I was not registered to vote on Nov. 4, 2008 . 39% 59% Not sure .......................................................... 7% 2% Decline to answer ........................................... 1% - 5. Which of the following statements best describes your voting in the last presidential election held on
November 4th, 2008? Total: 4-Year 18-29 College (n=1,797) (n=339) I voted at a polling place ................................ 33% 23% I voted early ................................................... 6% 6% I voted by absentee ballot .............................. 9% 10% I planned on voting, but wasn’t able to .......... 4% 6% I did not vote in this election.......................... 43% 54% I went to the polling place, but wasn’t allowed to vote ............................................... 2% - Decline to answer ........................................... 2% 1%

Harvard IOP Survey – Fall 2012 Page 3 of 28
[If respondent was over 18 in 2008, and “Voted” in Q5, ask]
6. For whom did you vote for president in 2008? Total: 4-Year 18-29 College (n=880) (n=134) Barack Obama ................................................ 58% 56% John McCain .................................................. 33% 28% Someone else ................................................. 3% 3% Don’t remember ............................................. 1% 2% Decline to answer ........................................... 4% 11% 7. When it comes to voting, with which party do you consider yourself to be affiliated? Total: 4-Year 18-29 College NET: Democrat ............................................ 36% 35% Strong Democrat ............................................ 18% 19% Not a very strong Democrat ........................... 17% 15% NET: Republican ......................................... 24% 31% Strong Republican .......................................... 11% 12% Not a very strong Republican ........................ 13% 19% NET: Independent ....................................... 37% 33% Refused .......................................................... 1% 2% 8. When it comes to most political issues, do you think of yourself as a…?
Total: 4-Year 18-29 College NET: Liberal ................................................ 37% 42% Liberal ............................................................ 25% 25% Moderate - Leaning Liberal .......................... 12% 16% Moderate ........................................................ 30% 25% NET: Conservative....................................... 33% 35% Conservative .................................................. 23% 24% Moderate – Leaning Conservative ................. 10% 10% Refused .......................................................... 4% 2%

Harvard IOP Survey – Fall 2012 Page 4 of 28
9. How likely is it that you will vote in the general election for President in November?
Total: 4-Year 18-29 College Definitely will be voting ................................ 48% 55% Probably will be voting .................................. 10% 14% 50-50 .............................................................. 16% 16% Probably won’t be voting ............................... 9% 7% Definitely won’t be voting ............................. 14% 6% Refused .......................................................... 3% 2% 10. How do you plan to vote in the November election? Total: 4-Year 18-29 College At a polling place ........................................... 43% 43% By absentee ballot .......................................... 14% 29% At a place set up for early voting .................. 6% 6% I do not plan on voting ................................... 20% 11% Don’t know .................................................... 14% 9% Refused .......................................................... 3% 2% 11. Do you consider yourself to be politically engaged or politically active?
Total: 4-Year 18-29 College Yes ................................................................. 25% 29% No ................................................................... 73% 69% Refused .......................................................... 2% 1%
Harvard IOP Survey – Fall 2012 Page 5 of 28
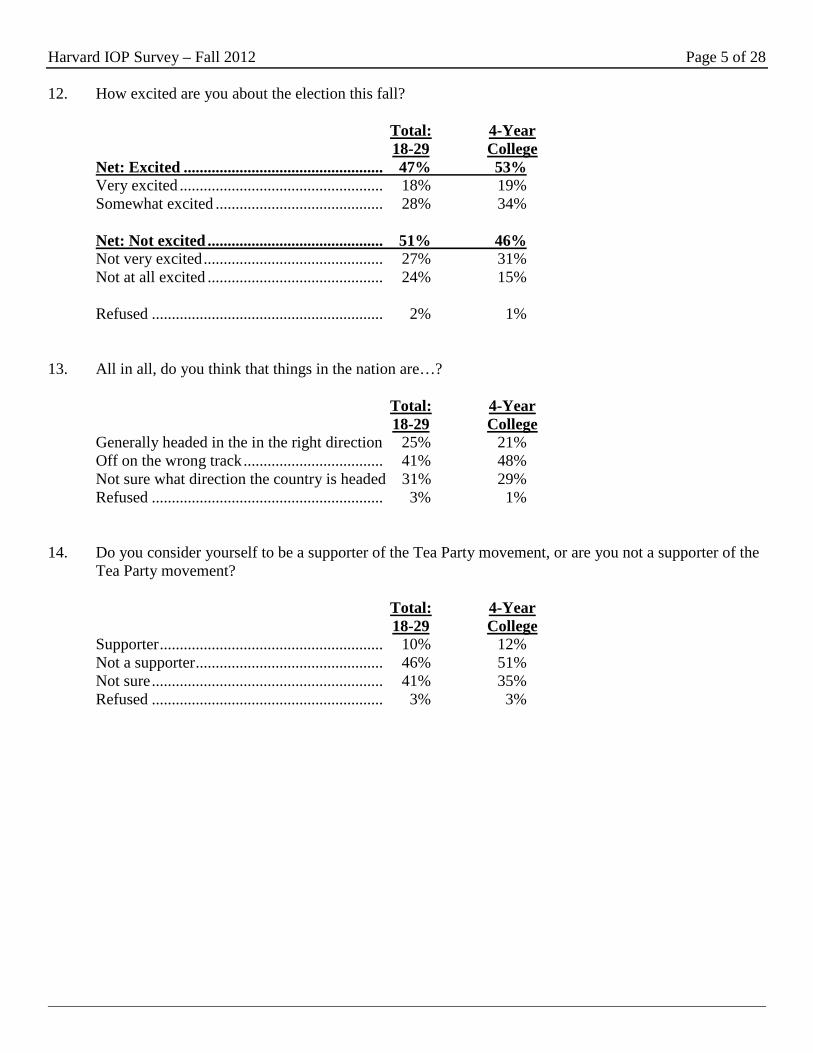
12. How excited are you about the election this fall?
Total: 4-Year 18-29 College Net: Excited .................................................. 47% 53% Very excited ................................................... 18% 19% Somewhat excited .......................................... 28% 34% Net: Not excited ............................................ 51% 46% Not very excited ............................................. 27% 31% Not at all excited ............................................ 24% 15% Refused .......................................................... 2% 1% 13. All in all, do you think that things in the nation are…? Total: 4-Year 18-29 College Generally headed in the in the right direction 25% 21% Off on the wrong track ................................... 41% 48% Not sure what direction the country is headed 31% 29% Refused .......................................................... 3% 1% 14. Do you consider yourself to be a supporter of the Tea Party movement, or are you not a supporter of the
Tea Party movement? Total: 4-Year 18-29 College Supporter ........................................................ 10% 12% Not a supporter ............................................... 46% 51% Not sure .......................................................... 41% 35% Refused .......................................................... 3% 3%
Harvard IOP Survey – Fall 2012 Page 6 of 28
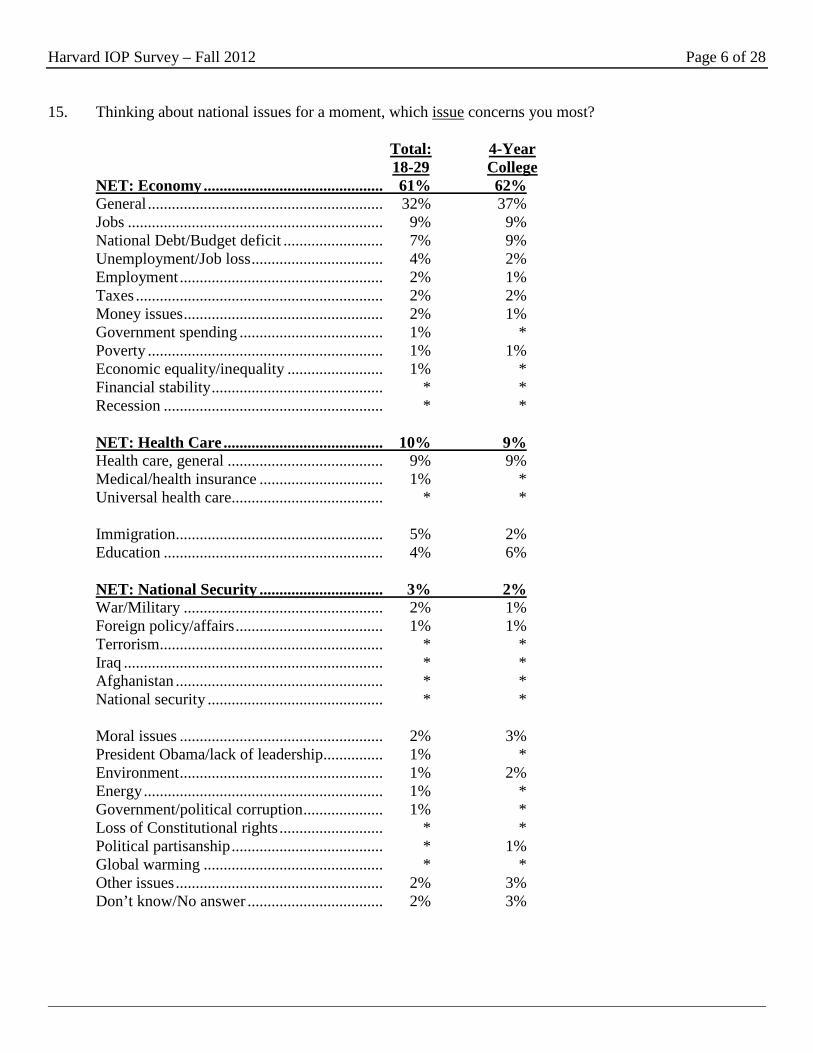
15. Thinking about national issues for a moment, which issue concerns you most? Total: 4-Year 18-29 College NET: Economy ............................................. 61% 62% General ........................................................... 32% 37% Jobs ................................................................ 9% 9% National Debt/Budget deficit ......................... 7% 9% Unemployment/Job loss ................................. 4% 2% Employment ................................................... 2% 1% Taxes .............................................................. 2% 2% Money issues .................................................. 2% 1% Government spending .................................... 1% * Poverty ........................................................... 1% 1% Economic equality/inequality ........................ 1% * Financial stability ........................................... * * Recession ....................................................... * * NET: Health Care ........................................ 10% 9% Health care, general ....................................... 9% 9% Medical/health insurance ............................... 1% * Universal health care...................................... * * Immigration.................................................... 5% 2% Education ....................................................... 4% 6% NET: National Security ............................... 3% 2% War/Military .................................................. 2% 1% Foreign policy/affairs ..................................... 1% 1% Terrorism........................................................ * * Iraq ................................................................. * * Afghanistan .................................................... * * National security ............................................ * * Moral issues ................................................... 2% 3% President Obama/lack of leadership............... 1% * Environment ................................................... 1% 2% Energy ............................................................ 1% * Government/political corruption .................... 1% * Loss of Constitutional rights .......................... * * Political partisanship ...................................... * 1% Global warming ............................................. * * Other issues .................................................... 2% 3% Don’t know/No answer .................................. 2% 3%

Harvard IOP Survey – Fall 2012 Page 7 of 28
In general, do you approve or disapprove of the job performance of: 16. Barack Obama as President Total: 4-Year 18-29 College Approve.......................................................... 52% 49% Disapprove ..................................................... 43% 47% Decline to answer ........................................... 5% 4% 17. The Democrats in Congress Total: 4-Year 18-29 College Approve.......................................................... 41% 41% Disapprove ..................................................... 54% 54% Decline to answer ........................................... 5% 4% 18. The Republicans in Congress Total: 4-Year 18-29 College Approve.......................................................... 23% 27% Disapprove ..................................................... 71% 68% Decline to answer ........................................... 5% 4% 19. If the election for President were held today and the candidates were Barack Obama, the Democrat, and
Mitt Romney, the Republican, for whom would you vote?
Total: 4-Year 18-29 College Obama ............................................................ 48% 44% Romney .......................................................... 26% 33% Don’t Know ................................................... 22% 20% Refused .......................................................... 3% 3% Among voters who say they will “definitely” be voting Total: 4-Year 18-29 College (n=1,026) (n=257) Obama ............................................................ 55% 48% Romney .......................................................... 36% 38% Don’t Know ................................................... 9% 14%
Harvard IOP Survey – Fall 2012 Page 8 of 28
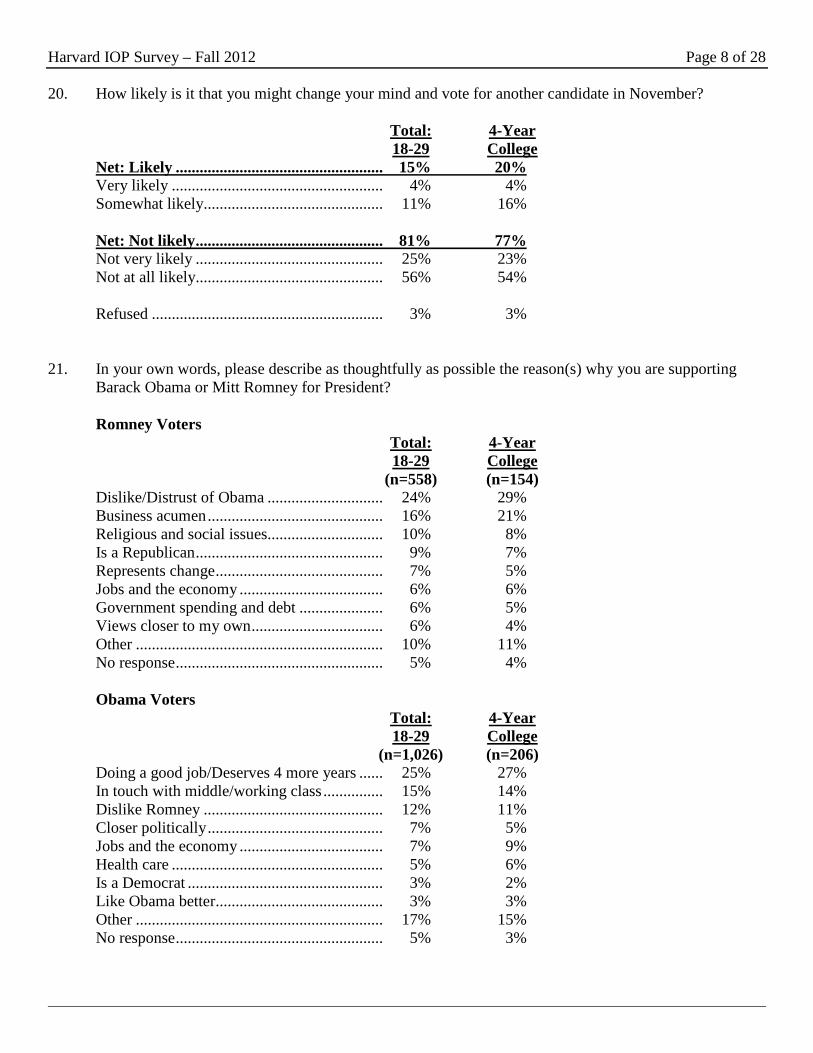
20. How likely is it that you might change your mind and vote for another candidate in November? Total: 4-Year 18-29 College Net: Likely .................................................... 15% 20% Very likely ..................................................... 4% 4% Somewhat likely............................................. 11% 16% Net: Not likely ............................................... 81% 77% Not very likely ............................................... 25% 23% Not at all likely............................................... 56% 54% Refused .......................................................... 3% 3% 21. In your own words, please describe as thoughtfully as possible the reason(s) why you are supporting
Barack Obama or Mitt Romney for President? Romney Voters
Total: 4-Year 18-29 College (n=558) (n=154) Dislike/Distrust of Obama ............................. 24% 29% Business acumen ............................................ 16% 21% Religious and social issues............................. 10% 8% Is a Republican ............................................... 9% 7% Represents change .......................................... 7% 5% Jobs and the economy .................................... 6% 6% Government spending and debt ..................... 6% 5% Views closer to my own ................................. 6% 4% Other .............................................................. 10% 11% No response .................................................... 5% 4%
Obama Voters Total: 4-Year 18-29 College (n=1,026) (n=206) Doing a good job/Deserves 4 more years ...... 25% 27% In touch with middle/working class ............... 15% 14% Dislike Romney ............................................. 12% 11% Closer politically ............................................ 7% 5% Jobs and the economy .................................... 7% 9% Health care ..................................................... 5% 6% Is a Democrat ................................................. 3% 2% Like Obama better.......................................... 3% 3% Other .............................................................. 17% 15% No response .................................................... 5% 3%

Harvard IOP Survey – Fall 2012 Page 9 of 28
22. How would you say that Mitt Romney’s choice of Paul Ryan as his running mate affects your likelihood to vote for him?
Total: 4-Year 18-29 College Net: More likely............................................ 30% 39% Much more likely ........................................... 9% 9% Somewhat more likely ................................... 22% 30% Net: Less likely ............................................. 62% 54% Somewhat less likely...................................... 23% 27% Much less likely ............................................. 40% 27% Refused .......................................................... 7% 7% 23. Regardless of which candidate your support – do you believe that Barack Obama will win or lose re-
election in 2012?
Total: 4-Year 18-29 College Win ................................................................. 52% 52% Lose ................................................................ 15% 17% Don’t know .................................................... 29% 29% Refused .......................................................... 4% 3% 24. Which party do you want to control Congress after this election?
Total: 4-Year 18-29 College Democrats ...................................................... 40% 39% Republicans .................................................... 25% 32% Each party controlling half............................. 30% 26% Refused .......................................................... 5% 3%
Harvard IOP Survey – Fall 2012 Page 10 of 28
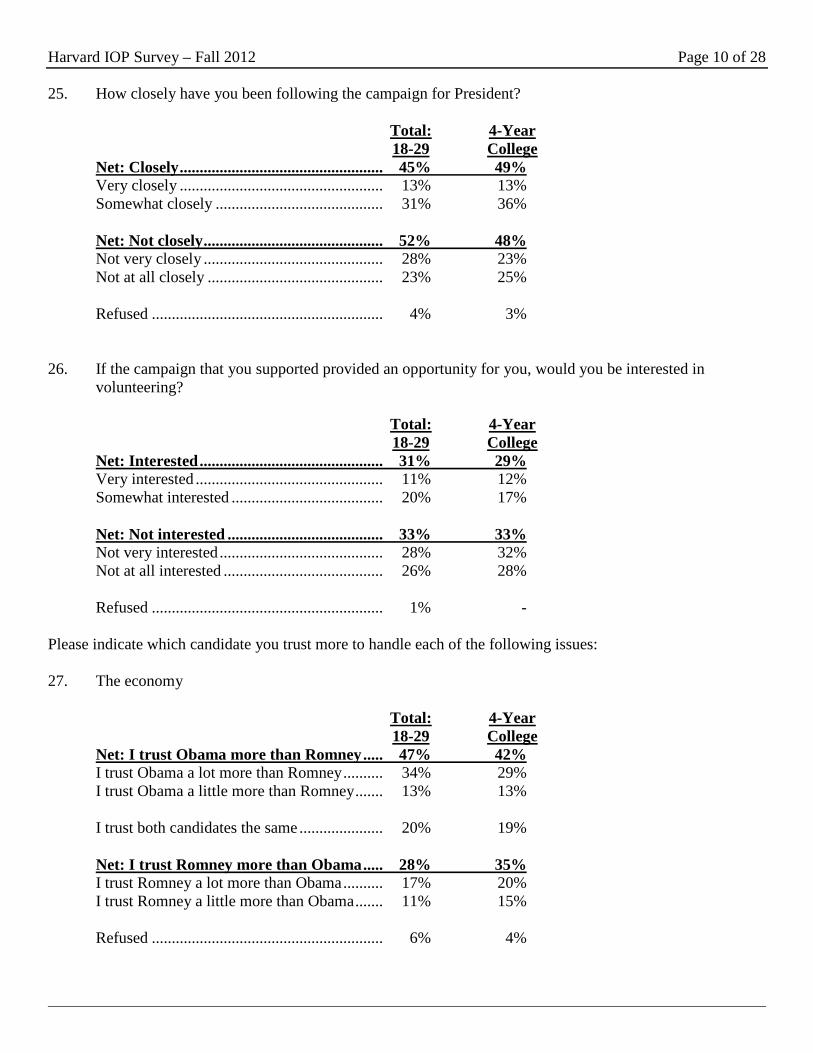
25. How closely have you been following the campaign for President? Total: 4-Year 18-29 College Net: Closely ................................................... 45% 49% Very closely ................................................... 13% 13% Somewhat closely .......................................... 31% 36% Net: Not closely ............................................. 52% 48% Not very closely ............................................. 28% 23% Not at all closely ............................................ 23% 25% Refused .......................................................... 4% 3% 26. If the campaign that you supported provided an opportunity for you, would you be interested in
volunteering? Total: 4-Year 18-29 College Net: Interested .............................................. 31% 29% Very interested ............................................... 11% 12% Somewhat interested ...................................... 20% 17% Net: Not interested ....................................... 33% 33% Not very interested ......................................... 28% 32% Not at all interested ........................................ 26% 28% Refused .......................................................... 1% - Please indicate which candidate you trust more to handle each of the following issues: 27. The economy Total: 4-Year 18-29 College Net: I trust Obama more than Romney ..... 47% 42% I trust Obama a lot more than Romney .......... 34% 29% I trust Obama a little more than Romney ....... 13% 13% I trust both candidates the same ..................... 20% 19% Net: I trust Romney more than Obama ..... 28% 35% I trust Romney a lot more than Obama .......... 17% 20% I trust Romney a little more than Obama ....... 11% 15% Refused .......................................................... 6% 4%
Harvard IOP Survey – Fall 2012 Page 11 of 28
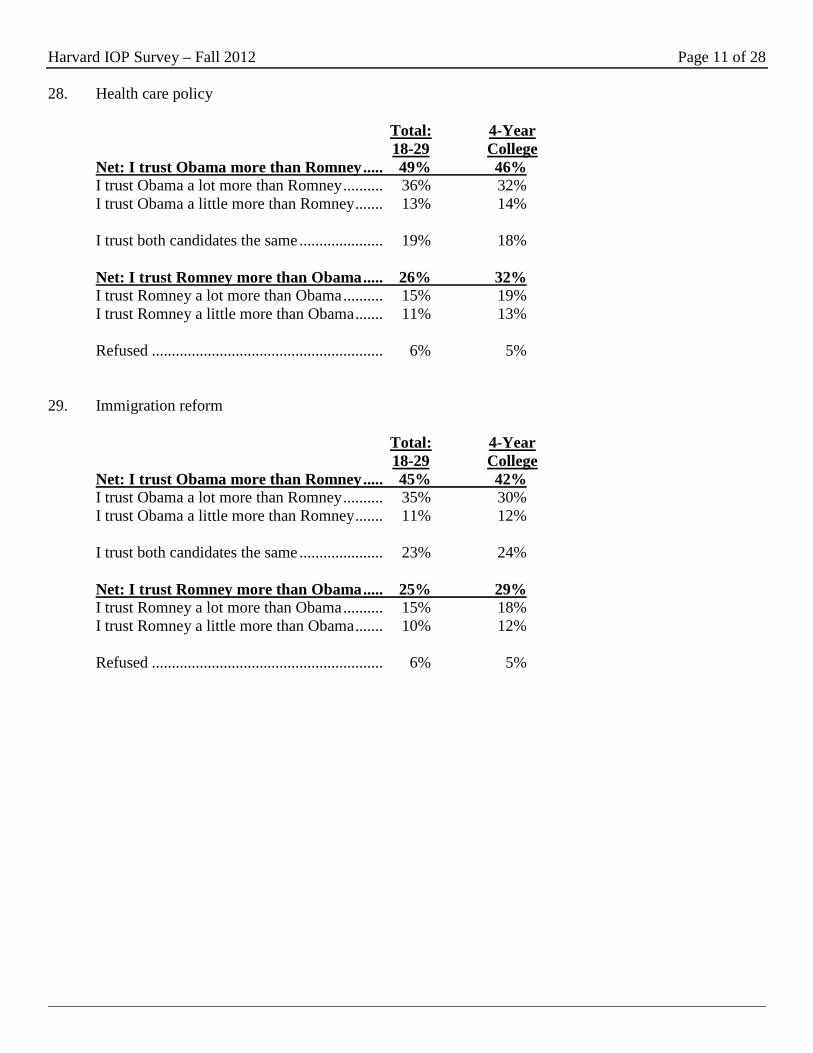
28. Health care policy Total: 4-Year 18-29 College Net: I trust Obama more than Romney ..... 49% 46% I trust Obama a lot more than Romney .......... 36% 32% I trust Obama a little more than Romney ....... 13% 14% I trust both candidates the same ..................... 19% 18% Net: I trust Romney more than Obama ..... 26% 32% I trust Romney a lot more than Obama .......... 15% 19% I trust Romney a little more than Obama ....... 11% 13% Refused .......................................................... 6% 5% 29. Immigration reform
Total: 4-Year 18-29 College Net: I trust Obama more than Romney ..... 45% 42% I trust Obama a lot more than Romney .......... 35% 30% I trust Obama a little more than Romney ....... 11% 12% I trust both candidates the same ..................... 23% 24% Net: I trust Romney more than Obama ..... 25% 29% I trust Romney a lot more than Obama .......... 15% 18% I trust Romney a little more than Obama ....... 10% 12% Refused .......................................................... 6% 5%

Harvard IOP Survey – Fall 2012 Page 12 of 28
30. Foreign policy
Total: 4-Year 18-29 College Net: I trust Obama more than Romney ..... 47% 44% I trust Obama a lot more than Romney .......... 35% 31% I trust Obama a little more than Romney ....... 11% 13% I trust both candidates the same ..................... 24% 23% Net: I trust Romney more than Obama ..... 24% 28% I trust Romney a lot more than Obama .......... 15% 18% I trust Romney a little more than Obama ....... 9% 10% Refused .......................................................... 6% 5% 31. Commander-in-Chief of the military
Total: 4-Year 18-29 College Net: I trust Obama more than Romney ..... 46% 41% I trust Obama a lot more than Romney .......... 35% 31% I trust Obama a little more than Romney ....... 11% 10% I trust both candidates the same ..................... 24% 26% Net: I trust Romney more than Obama ..... 24% 29% I trust Romney a lot more than Obama .......... 15% 18% I trust Romney a little more than Obama ....... 10% 11% Refused .......................................................... 6% 4%
Harvard IOP Survey – Fall 2012 Page 13 of 28
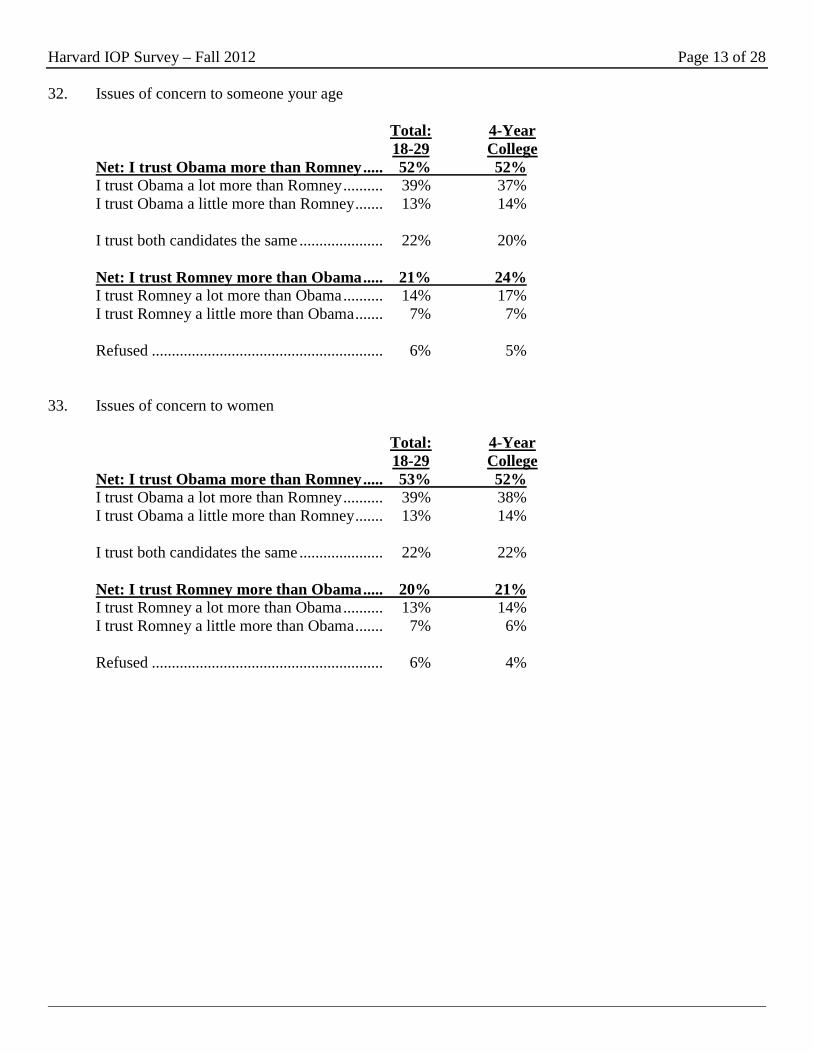
32. Issues of concern to someone your age
Total: 4-Year 18-29 College Net: I trust Obama more than Romney ..... 52% 52% I trust Obama a lot more than Romney .......... 39% 37% I trust Obama a little more than Romney ....... 13% 14% I trust both candidates the same ..................... 22% 20% Net: I trust Romney more than Obama ..... 21% 24% I trust Romney a lot more than Obama .......... 14% 17% I trust Romney a little more than Obama ....... 7% 7% Refused .......................................................... 6% 5% 33. Issues of concern to women
Total: 4-Year 18-29 College Net: I trust Obama more than Romney ..... 53% 52% I trust Obama a lot more than Romney .......... 39% 38% I trust Obama a little more than Romney ....... 13% 14% I trust both candidates the same ..................... 22% 22% Net: I trust Romney more than Obama ..... 20% 21% I trust Romney a lot more than Obama .......... 13% 14% I trust Romney a little more than Obama ....... 7% 6% Refused .......................................................... 6% 4%
Harvard IOP Survey – Fall 2012 Page 14 of 28
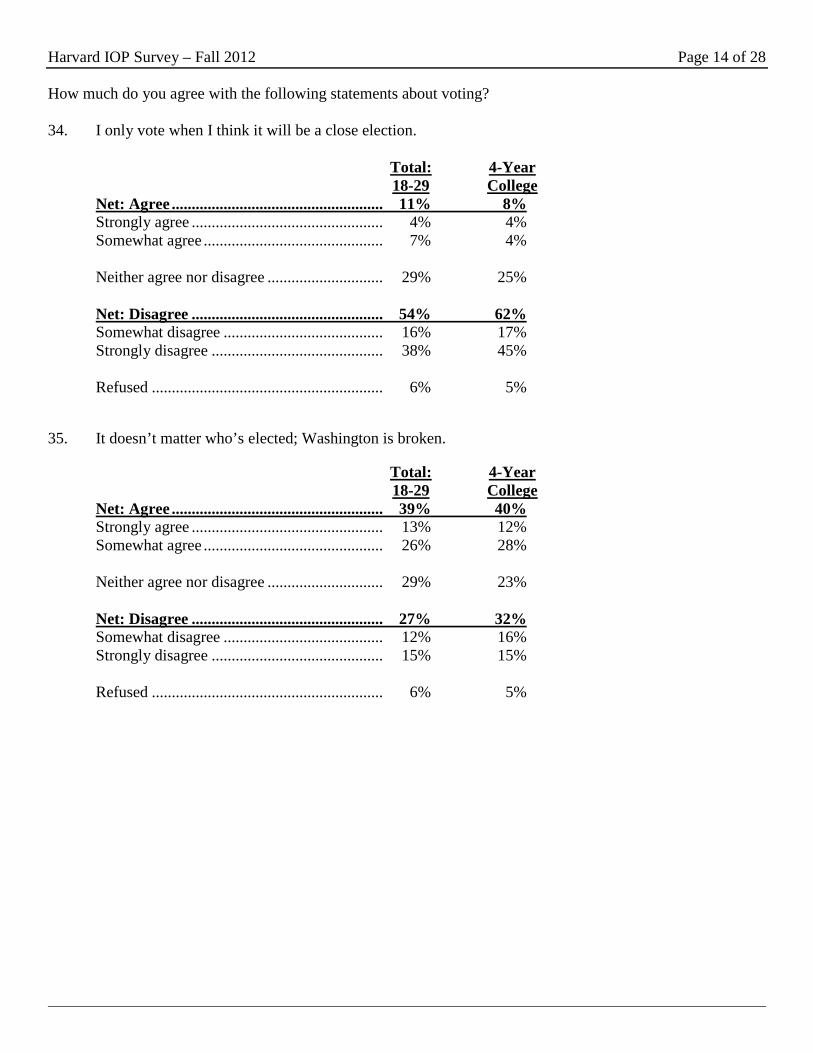
How much do you agree with the following statements about voting? 34. I only vote when I think it will be a close election.
Total: 4-Year 18-29 College Net: Agree ..................................................... 11% 8% Strongly agree ................................................ 4% 4% Somewhat agree ............................................. 7% 4% Neither agree nor disagree ............................. 29% 25% Net: Disagree ................................................ 54% 62% Somewhat disagree ........................................ 16% 17% Strongly disagree ........................................... 38% 45% Refused .......................................................... 6% 5% 35. It doesn’t matter who’s elected; Washington is broken.
Total: 4-Year 18-29 College Net: Agree ..................................................... 39% 40% Strongly agree ................................................ 13% 12% Somewhat agree ............................................. 26% 28% Neither agree nor disagree ............................. 29% 23% Net: Disagree ................................................ 27% 32% Somewhat disagree ........................................ 12% 16% Strongly disagree ........................................... 15% 15% Refused .......................................................... 6% 5%

Harvard IOP Survey – Fall 2012 Page 15 of 28
36. It doesn’t matter who is elected; the parties are more or less the same.
Total: 4-Year 18-29 College Net: Agree ..................................................... 22% 26% Strongly agree ................................................ 7% 4% Somewhat agree ............................................. 15% 22% Neither agree nor disagree ............................. 27% 23% Net: Disagree ................................................ 45% 47% Somewhat disagree ........................................ 19% 19% Strongly disagree ........................................... 26% 29% Refused .......................................................... 6% 4% 37. It doesn’t matter who’s elected; none of the candidates represent my views.
Total: 4-Year 18-29 College Net: Agree ..................................................... 24% 30% Strongly agree ................................................ 7% 7% Somewhat agree ............................................. 17% 23% Neither agree nor disagree ............................. 28% 22% Net: Disagree ................................................ 42% 43% Somewhat disagree ........................................ 22% 23% Strongly disagree ........................................... 20% 21% Refused .......................................................... 6% 5%

Harvard IOP Survey – Fall 2012 Page 16 of 28
38. Some elections are more important that others; I only vote when I think it’s important. Total: 4-Year 18-29 College Net: Agree ..................................................... 18% 18% Strongly agree ................................................ 5% 4% Somewhat agree ............................................. 13% 14% Neither agree nor disagree ............................. 29% 26% Net: Disagree ................................................ 48% 51% Somewhat disagree ........................................ 16% 16% Strongly disagree ........................................... 32% 35% Refused .......................................................... 6% 5% 39. I only vote when I am passionately for or against one of the candidates.
Total: 4-Year 18-29 College Net: Agree ..................................................... 19% 19% Strongly agree ................................................ 7% 6% Somewhat agree ............................................. 11% 13% Neither agree nor disagree ............................. 29% 25% Net: Disagree ................................................ 47% 51% Somewhat disagree ........................................ 17% 19% Strongly disagree ........................................... 30% 32% Refused .......................................................... 6% 4% 40. Which of the following comes closest to your view: Total: 4-Year 18-29 College The problems that President Obama inherited are so complex it takes more than four years to do the job .................................. 62% 64% Despite his best efforts, President Obama Has failed ....................................................... 33% 34% Refused .......................................................... 5% 2%

Harvard IOP Survey – Fall 2012 Page 17 of 28
41. The tax cuts that were passed in 2001 will expire this year if they are not continued. Which of the following best describes what you think Congress should do about the tax cuts?
Total: 4-Year 18-29 College Allow the tax cuts for people earning more than $250,000 to expire, but continue them for other people .............................................. 32% 29% Continue the tax cuts for everyone ................ 23% 25% Allow the tax cuts to expire for everyone ...... 10% 12% Declined to answer ......................................... 31% 30% Refused .......................................................... 5% 4% 42. On domestic issues, how different do you think Barack Obama’s policies are compared to Mitt
Romney’s?
Total: 4-Year 18-29 College NET: Different ............................................. 64% 73% Very different ................................................. 38% 39% Somewhat different ........................................ 26% 34% NET: Not Different ...................................... 7% 5% Not very different ........................................... 6% 4% Not at all different .......................................... 1% - I don’t know ................................................... 25% 19% Refused .......................................................... 4% 3%

Harvard IOP Survey – Fall 2012 Page 18 of 28
43. On foreign policy issues, how different do you think Barack Obama’s policies are compared to Mitt Romney?
Total: 4-Year 18-29 College NET: Different ............................................. 55% 64% Very different ................................................. 31% 30% Somewhat different ........................................ 24% 34% NET: Not Different ...................................... 12% 11% Not very different ........................................... 9% 9% Not at all different .......................................... 3% 2% I don’t know ................................................... 29% 22% Refused .......................................................... 4% 3% [Q44 and Q45 were asked of a split sample] 44. Do you approve or disapprove of the United States conducting missile strikes from pilotless aircrafts
called drones to target extremists in countries such as Pakistan, Yemen, and Somalia?
Total: 4-Year 18-29 College (n=1,091) (n=254) Approve.......................................................... 35% 37% Disapprove ..................................................... 24% 27% Don’t know .................................................... 42% 37% 45. Do you approve or disapprove of the United States conducting missile strikes from pilotless aircrafts
called drones to target extremists in countries such as Pakistan, Yemen, and Somalia – even if the targets include US citizens who are suspected terrorists?
Total: 4-Year 18-29 College (n=1,032) (n=221) Approve.......................................................... 30% 40% Disapprove ..................................................... 25% 31% Don’t know .................................................... 46% 39%
Harvard IOP Survey – Fall 2012 Page 19 of 28
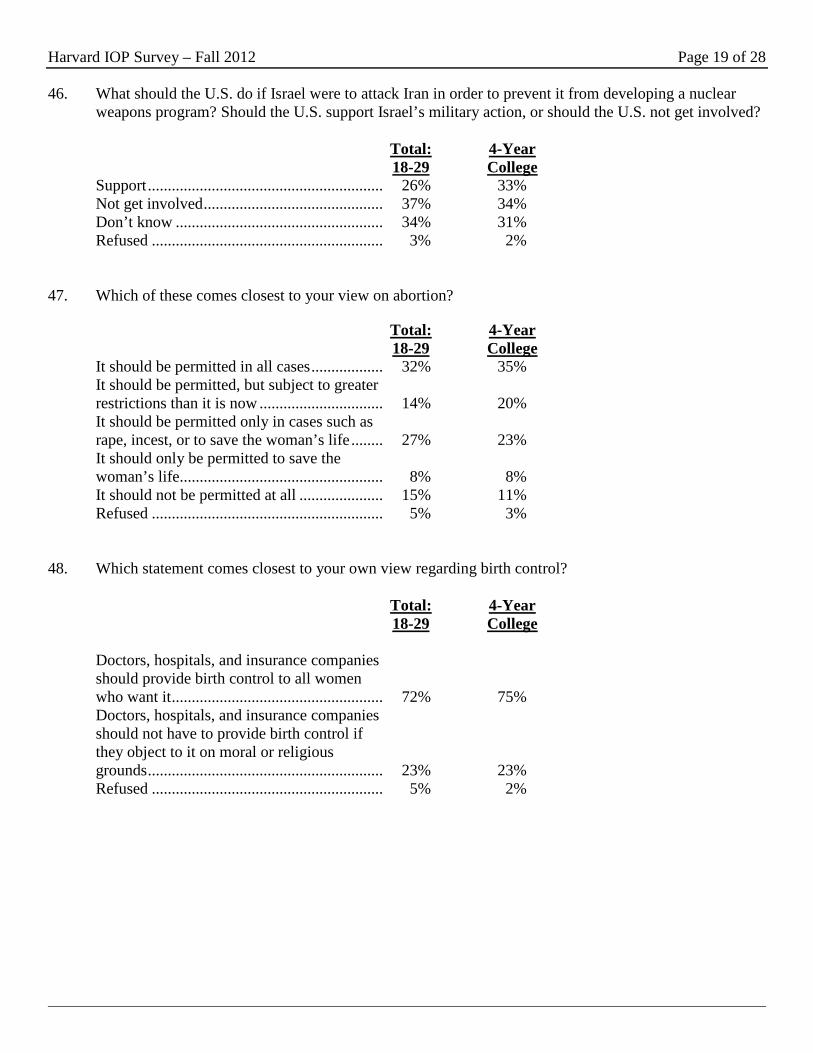
46. What should the U.S. do if Israel were to attack Iran in order to prevent it from developing a nuclear weapons program? Should the U.S. support Israel’s military action, or should the U.S. not get involved?
Total: 4-Year 18-29 College Support ........................................................... 26% 33% Not get involved ............................................. 37% 34% Don’t know .................................................... 34% 31% Refused .......................................................... 3% 2% 47. Which of these comes closest to your view on abortion?
Total: 4-Year 18-29 College It should be permitted in all cases .................. 32% 35% It should be permitted, but subject to greater restrictions than it is now ............................... 14% 20% It should be permitted only in cases such as rape, incest, or to save the woman’s life ........ 27% 23% It should only be permitted to save the woman’s life................................................... 8% 8% It should not be permitted at all ..................... 15% 11% Refused .......................................................... 5% 3% 48. Which statement comes closest to your own view regarding birth control? Total: 4-Year 18-29 College Doctors, hospitals, and insurance companies should provide birth control to all women who want it ..................................................... 72% 75% Doctors, hospitals, and insurance companies should not have to provide birth control if they object to it on moral or religious grounds ........................................................... 23% 23% Refused .......................................................... 5% 2%

Harvard IOP Survey – Fall 2012 Page 20 of 28
49. In general, which do you think is the better way to solve important issues facing the country- through political engagement or through community volunteerism?
Total: 4-Year 18-29 College Political engagement ...................................... 19% 25% Community volunteerism............................... 31% 33% Not sure .......................................................... 46% 40% Refused .......................................................... 4% 2% 50. Which one of these best describes your religious preference?
Total: 4-Year 18-29 College Catholic .......................................................... 20% 17% Protestant........................................................ 13% 21% Fundamentalist/ Evangelical Christian .......... 12% 11% Jewish ............................................................. 2% 3% LDS/ Mormon ................................................ 2% 3% Muslim ........................................................... - - Another religion ............................................. 8% 6% No religious presence ..................................... 24% 23% Not sure .......................................................... 4% 5% Decline to answer ........................................... 11% 8% Refused .......................................................... 4% 4% [If Catholic, Protestant, Fundamentalist/Evangelical, Jewish, LDS/Mormon, Muslim, or Another Religion in Q50, ask] 51. How important is religion in your own life?
Total: 4-Year 18-29 College (n=1,307) (n=306) Very important ............................................... 48% 46% Somewhat important ...................................... 33% 33% Not very important ......................................... 16% 20% Not sure .......................................................... 4% 1% Refused .......................................................... - -

Harvard IOP Survey – Fall 2012 Page 21 of 28
[If Catholic, Protestant, Fundamentalist/Evangelical, LDS/Mormon, or Another Religion in Q50, ask] 52. Do you consider yourself a born-again Christian? Total: 4-Year 18-29 College (n=1,266) (n=292) Yes ................................................................. 34% 33% No ................................................................... 50% 56% Not sure .......................................................... 11% 8% Decline to answer ........................................... 4% 3% 53. Switching topics, which one of these best describes your phone service at this time? (Multiple responses
allowed) Total: 4-Year 18-29 College Cell phone ...................................................... 85% 92% Landline phone service .................................. 22% 16% VOIP phone service ....................................... 2% 1% None of these ................................................. 5% 3% Refused .......................................................... 4% 3% 54. Is your college/university…? Total: 4-Year 18-29 College (n=714) (n=470) Public ............................................................. 78% 69% Private ............................................................ 20% 29% Refused .......................................................... 2% 2% 55. Is the college/university that you currently attend…?
Total: 4-Year 18-29 College (n=714) (n=470) In an urban or city area .................................. 49% 49% In a suburban area next to a city .................... 30% 30% In a small town or rural area .......................... 18% 19% Refused .......................................................... 3% 2%

Harvard IOP Survey – Fall 2012 Page 22 of 28
56. How many undergraduate students are enrolled in your college or university? Your best estimate is fine. Total: 4-Year 18-29 College (n=714) (n=470) Less than 1,000 .............................................. 7% 4% 1,000-4,000 .................................................... 32% 27% 5,000-9,999 .................................................... 20% 21% 10,000-19,999 ................................................ 18% 20% 20,000 or more ............................................... 20% 26% Refused .......................................................... 3% 3% 57. Where do you live while attending college?
Total: 4-Year 18-29 College (n=714) (n=470) In an on-campus dormitory ............................ 18% 25% In fraternity/sorority housing ......................... 1% 2% In a campus-owned apartment ....................... 5% 7% In an apartment/house that is not campus owned (not with parents) ............................... 31% 36% At home, with my parents .............................. 39% 24% Somewhere else ............................................. 5% 4% Refused .......................................................... 2% 2% 58. Are you a…?
Total: 4-Year 18-29 College (n=714) (n=470) Full-time student ............................................ 77% 88% Part-time student ............................................ 22% 11% Refused .......................................................... 1% 1% 59. Race/Ethnicity
Total: 4-Year 18-29 College White, Non-Hispanic ..................................... 58% 65% Black, Non-Hispanic ...................................... 13% 12% Other, Non-Hispanic ...................................... 7% 8% Hispanic ......................................................... 20% 13% 2+ Races ......................................................... 2% 2%

Harvard IOP Survey – Fall 2012 Page 23 of 28
60. Gender
Total: 4-Year 18-29 College Male ............................................................... 50% 49% Female ............................................................ 50% 51% 61. What is your age? Total: 4-Year 18-29 College 18.................................................................... 9% 15% 19.................................................................... 7% 16% 20.................................................................... 8% 18% 21.................................................................... 8% 18% 22.................................................................... 10% 14% 23.................................................................... 8% 4% 24.................................................................... 9% 3% 25.................................................................... 6% 2% 26.................................................................... 7% 1% 27.................................................................... 8% 4% 28.................................................................... 9% 3% 29.................................................................... 12% 4% 62. What is the highest level of school you have completed? Total: 4-Year 18-29 College Less than HS .................................................. 12% 1% HS .................................................................. 30% 27% Some college .................................................. 38% 67% Bachelor or higher.......................................... 21% 4%

Harvard IOP Survey – Fall 2012 Page 24 of 28
63. We would like to get a more accurate estimate of your total HOUSEHOLD income in the past 12 months before taxes. Was it …
Total: 4-Year 18-29 College Less than $5,000 ............................................ 3% 1% $5,000 to $7,499 ............................................ 1% * $7,500 to $9,999 ............................................ 1% * $10,000 to $12,499 ........................................ 2% 1% $12,500 to $14,999 ........................................ 3% 1% $15,000 to $19,999 ........................................ 4% 3% $20,000 to $24,999 ........................................ 5% 4% $25,000 to $29,999 ........................................ 6% 3% $30,000 to $34,999 ........................................ 4% 1% $35,000 to $39,999 ........................................ 5% 3% $40,000 to $49,999 ........................................ 9% 5% $50,000 to $59,999 ........................................ 10% 13% $60,000 to $74,999 ........................................ 10% 7% $75,000 to $84,999 ........................................ 7% 8% $85,000 to $99,999 ........................................ 9% 11% $100,000 to $124,999 .................................... 9% 15% $125,000 to $149,999 .................................... 5% 8% $150,000 to $174,999 .................................... 3% 5% $175,000 or more ........................................... 4% 8% 64. Are you now married, widowed, divorced, separated, never married, or living with a partner? Total: 4-Year 18-29 College Married ........................................................... 23% 9% Widowed ........................................................ * * Divorced ......................................................... 1% * Separated ........................................................ 1% * Never married ................................................ 59% 85% Living with partner ........................................ 15% 5% 65. Are you the household head? Total: 4-Year 18-29 College Yes ................................................................. 47% 27% No ................................................................... 53% 73%

Harvard IOP Survey – Fall 2012 Page 25 of 28
66. Including yourself, how many people currently live in your household at least 50% of the time? Please remember to include babies or small children, include unrelated individuals (such as roommates), and also include those now away traveling or in a hospital.
Total: 4-Year 18-29 College 1...................................................................... 8% 4% 2...................................................................... 21% 13% 3...................................................................... 25% 29% 4...................................................................... 24% 30% 5...................................................................... 12% 12% 6...................................................................... 6% 7% 7...................................................................... 2% 3% 8...................................................................... 1% 1% 9...................................................................... * * 10.................................................................... * * 67. How many members are there in each age group in your household? – Average Number Total: 4-Year 18-29 College 1 year old or younger (0-12 months) ............. .12 .04 2 to 5 years old ............................................... .22 .07 6 to 12 years old ............................................. .21 .19 13 to 17 years old ........................................... .23 .26 18 years old or older ...................................... 2.71 3.08 68. Which statement best describes you current employment status? Total: 4-Year 18-29 College NET: Working .............................................. 62% 63% Working – as a paid employee ....................... 58% 60% Working – self employed ............................... 4% 3% NET: Not Working ...................................... 38% 37% Not working – on a temporary layoff ............ 1% 23% Not working – looking for work .................... 20% * Not working - retired ..................................... * * Not working - disabled................................... 1% * Not working – other ....................................... 15% 13%
Harvard IOP Survey – Fall 2012 Page 26 of 28
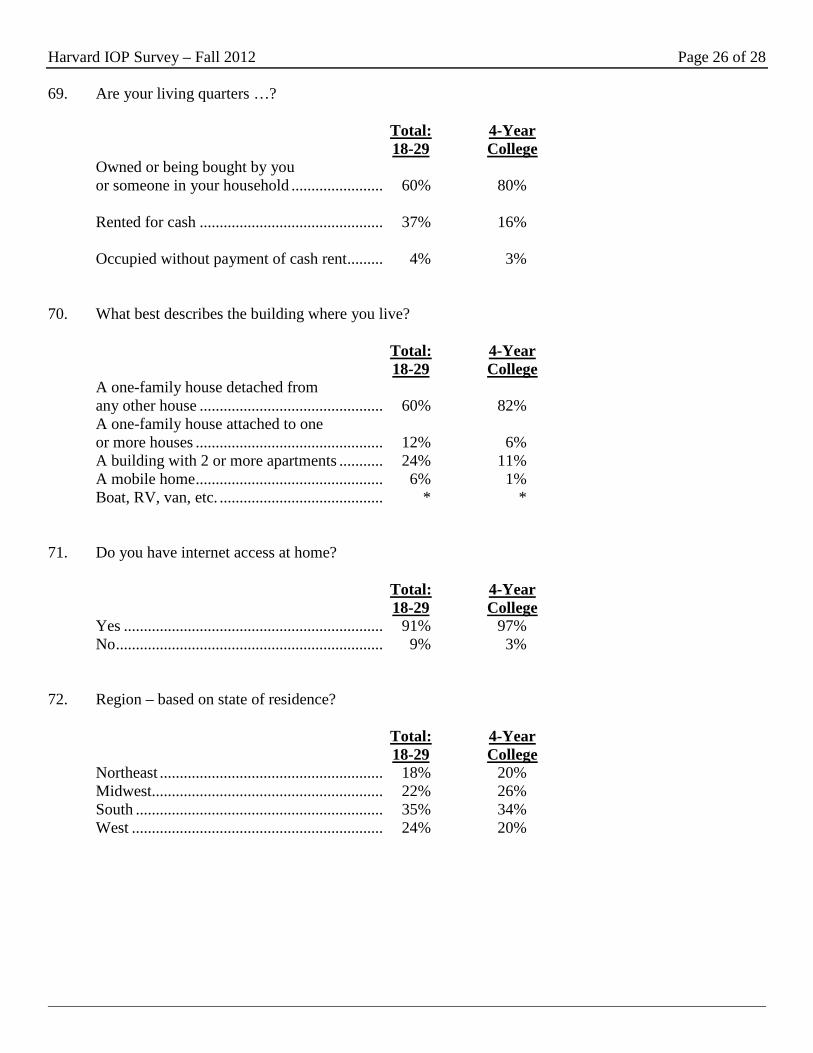
69. Are your living quarters …?
Total: 4-Year 18-29 College Owned or being bought by you or someone in your household ....................... 60% 80% Rented for cash .............................................. 37% 16% Occupied without payment of cash rent ......... 4% 3% 70. What best describes the building where you live? Total: 4-Year 18-29 College A one-family house detached from any other house .............................................. 60% 82% A one-family house attached to one or more houses ............................................... 12% 6% A building with 2 or more apartments ........... 24% 11% A mobile home ............................................... 6% 1% Boat, RV, van, etc. ......................................... * * 71. Do you have internet access at home? Total: 4-Year 18-29 College Yes ................................................................. 91% 97% No ................................................................... 9% 3% 72. Region – based on state of residence? Total: 4-Year 18-29 College Northeast ........................................................ 18% 20% Midwest.......................................................... 22% 26% South .............................................................. 35% 34% West ............................................................... 24% 20%

Harvard IOP Survey – Fall 2012 Page 27 of 28
73. Do you live in a metro or non-metro area? Total: 4-Year 18-29 College Metro .............................................................. 87% 88% Non-metro ...................................................... 13% 12%

Harvard IOP Survey – Fall 2012 Page 28 of 28
Weighting Methodology For this survey, a nationally representative sample of U.S. adults (18 to 29 years old) was selected. 2,123 respondents completed the survey, with 106 interviews conducted in Spanish. Responses were weighted to merge the Spanish-speakers with the overall panel, ensuring correct proportional fitting of Spanish-speaking members relative to other English-speaking Hispanic and non-Hispanic panel members. Data was also weighted to reflect known population density by gender, age, race/ethnicity, education, census region, metropolitan area, and Internet access. These adjustments, while minor, allow for us to draw conclusions about the population of 18-29 year olds, based on our sample. A word about the sub-samples. The college sub-sample is exclusively those students who reported that they were enrolled in a four-year degree program at the college level. The non-college sample is not currently enrolled in a four-year program but does represent varied educational backgrounds including high school students, community college and 2-year-college students, graduate programs students, students enrolled in other degree granting programs, and students not enrolled in any form of education at the time of the survey.


![Survey of Young Americans’ Attitudes toward Politics and ... · Harvard IOP Survey – Fall 2015 Page 2 of 34 ! [If respondent was over 18 in 2012, ask Q5-Q6] The following are](https://img.dokumen.tips/doc/110x75/5ed8608ba294ae057c67c880/survey-of-young-americansa-attitudes-toward-politics-and-harvard-iop-survey.jpg)

![Survey of Young Americans’ Attitudes toward Politics and Public … · 2020. 6. 16. · Harvard IOP Survey – Spring 2016 Page 2 of 47 [If respondent was over 18 in 2012, ask Q4-Q5]](https://img.dokumen.tips/doc/110x75/5fe2a7ca94cf9253ec673f20/survey-of-young-americansa-attitudes-toward-politics-and-public-2020-6-16.jpg)


