Embed Size (px)
Citation preview
Original Article
Received 13 September 2012, Revised 04 April 2013, Accepted 16 April 2013 Published online 26 July 2013 in Wiley Online Library
(wileyonlinelibrary.com) DOI: 10.1002/jrsm.1083
242
Survey of the methods and reportingpractices in published meta-analyses of
test performance: 1987 to 2009Issa J. Dahabreh,a Mei Chung,b Georgios D. Kitsios,b,c
Teruhiko Terasawa,d,e Gowri Raman,b Athina Tatsioni,b,f
Annette Tobar,g Joseph Lau,a Thomas A. Trikalinosa
and Christopher H. Schmida,h*
We performed a survey of meta-analyses of test performance to describe the evolution in their methodsand reporting. Studies were identified through MEDLINE (1966–2009), reference lists, and relevantreviews. We extracted information on clinical topics, literature review methods, quality assessment, andstatistical analyses. We reviewed 760 publications reporting meta-analyses of test performance, publishedbetween 1987 and 2009. Eligible reviews included a median of 18 primary studies that were used inquantitative analyses. Most common clinical areas were cardiovascular disease (21%) and oncology(25%); most common test categories were imaging (44%) and biomarker tests (28%). Assessment ofverification and spectrum bias, blinding, prospective study design, and consecutive patient recruitmentbecame more common over time (p< 0.001 comparing reviews published through 2004 vs 2005 onwards).These changes coincided with the increasing use of checklists to guide assessment of methodologicalquality. Heterogeneity tests were used in 58% of meta-analyses; subgroup or regression analyses wereused in 57%. Random effects models were employed in 57% of meta-analyses (38% through 2004 vs72% 2004–onwards; p<0.001). Use of bivariate models of sensitivity and specificity increased in recentyears (21% in 2008–2009 vs 7% in earlier years; p< 0.001). Methods employed in meta-analyses of testperformance have improved with the introduction of quality assessment checklists and the developmentof more sophisticated statistical methods. Copyright © 2013 John Wiley & Sons, Ltd.
Supporting information may be found in the online version of this article.
Keywords: diagnostic test; test performance; systematic review; meta-analysis; methods; reporting
Introduction
Diagnostic and predictive tests are an important component of medical care, and clinicians rely on test results toestablish diagnosis and guide patient management (Miettinen, 2001). Tests affect clinical outcomes indirectly,through their impact on physicians’ diagnostic thinking and therapeutic decision-making. Existing frameworksfor assessing the value of medical tests advocate a stepwise appraisal process, covering analytic validity, clinicalvalidity (diagnostic and prognostic performance), clinical utility (effect on clinical outcomes), and societal impact
aCenter for Evidence-based Medicine, Program in Public Health, Brown University, Providence, RI, USAbCenter for Clinical Evidence Synthesis, Institute for Clinical Research and Health Policy Studies, Tufts Medical Center, Boston, MA, USAcDepartment of General Internal Medicine, Lahey Clinic Medical Center, Burlington, MA, USAdDepartment of Internal Medicine, Fujita Health University Nanakuri Sanatorium, Fujita Health University School of Medicine, Tsu, Mie, JapaneClinical Research Center, National Hospital Organization Nagoya Medical Center, Nagoya, JapanfDepartment of Internal Medicine, University of Ioannina School of Medicine, Ioannina, GreecegDivision of Gastroenterology & Hepatology, Department of Medicine, University of Colorado, Aurora, CO, USAhDepartment of Biostatistics, Program in Public Health, Brown University, Providence, RI, USA*Correspondence to: Dr Christopher Schmid, PhD. Center for Evidence-based Medicine, Program in Public Health, Box G-S121-8, BrownUniversity, Providence, RI, USA.E-mail: [email protected]
Copyright © 2013 John Wiley & Sons, Ltd. Res. Syn. Meth. 2013, 4 242–255

I. J. DAHABREH ET AL.
(Lijmer et al., 2009). Primary studies that directly address all components of these assessment frameworks areuncommon. Therefore, systematic reviews of medical tests typically include separate syntheses ofnonoverlapping sets of studies for each component. The performance of medical tests is a crucial elementessential to synthesize in systematic reviews (Tatsioni et al., 2005). Meta-analysis can provide an ‘average’estimate of test performance as well as identify patient-related, disease-related, or test-related modifiers of testperformance (Gatsonis and Paliwal, 2006).
Meta-analyses of studies of test performance present particular challenges compared with those ofrandomized trials of therapeutic interventions. The studies reviewed are almost exclusively observational;sensitivity and specificity may be correlated (across studies) because of threshold effects, in which case univariatesummaries are misleading (Reitsma et al., 2005); and the performance measures reported vary across studies.Application of multivariate methods that model the correlation between sensitivity and specificity has onlyrecently become more common, aided by their implementation in readily available software (Rutter and Gatsonis,1995; Rutter and Gatsonis, 2001; van Houwelingen et al., 2002; van Houwelingen et al., 1993; Willis and Quigley,2011b). Furthermore, clinical heterogeneity is omnipresent because studies of test performance differ in theirclinical settings, disease spectra, and versions of the tests used. This diversity often manifests as substantialstatistical variation, which needs to be quantified and explored.
Another challenge for systematic reviews of tests is the assessment of study quality (Ransohoff and Feinstein,1978; Reid et al., 1995). A number of studies have investigated study design aspects that may affect estimated testperformance, but the evidence remains inconclusive (Lijmer et al., 1999; Rutjes et al., 2006; Westwood et al., 2005).Drawing on relevant empirical evidence and expert opinion, the Quality Assessment in Diagnostic AccuracyStudies (QUADAS) tool was developed and published in 2003 (Whiting et al., 2003; Whiting et al., 2004) andsubsequently validated for use in systematic reviews of diagnostic tests (Whiting et al., 2006). A reporting checklistfor primary studies of test performance, the Standards for the Reporting of Diagnostic Accuracy Studies (STARD)(Bossuyt et al., 2003a; Bossuyt et al., 2003b), was also published in 2003. Although STARD was intended as a guidefor the reporting of primary studies on diagnostic tests, systematic reviewers often use subsets of STARD items toguide quality assessment. Because both checklists have now been available for some time, it is reasonable toassess their impact on quality assessment methods in meta-analyses of medical tests.
To summarize the current status and longitudinal trends of the methods and reporting practices of publishedmeta-analyses of test performance, and to identify areas with opportunity for improvement, we systematicallyreviewed papers published before 2010.
Methods
This manuscript is based on a Methods Research Report prepared by the Tufts Evidence-based Practice Centerunder contract with the Agency for Healthcare and Research and Quality (AHRQ). The complete technical reportis available at http://www.effectivehealthcare.ahrq.gov/. The funder did not participate in the design, datacollection, analysis and interpretation of results, or the decision to submit for publication.
243
Search strategy and eligibility criteria
This project was conducted in two phases. First, we reviewed studies published before 2004 (Schmid et al., 2004);we subsequently updated our findings by reviewing studies published from 2004 to 2009. Searches for bothphases were performed in MEDLINE by using the same search strategy (a combination of key words relatedto test performance and meta-analysis, available online with the full technical report at http://www.effectivehealthcare.ahrq.gov/).
The abstract screening and full text selection criteria were the same for both phases of the project. Papers wereconsidered eligible when they reported the findings of systematic reviews (i.e. reviews using explicit methods toidentify, select, and extract information from primary research studies) that used quantitative synthesis (meta-analysis) methods to obtain summary estimates of diagnostic or prognostic performance (i.e. the ability of indextests to discriminate between the presence or absence of a disease or condition, as established by a referencestandard test) of medical tests (e.g., imaging, clinical, and genetic tests, but not risk instruments or prediction rules)that reported categorical or ordinal results. We excluded systematic reviews that did not report meta-analysesbecause one of our key aims was to assess the temporal evolution and current status of meta-analytic methodsfor synthesizing test performance data. We only included English language reviews published in full text. Weexcluded reviews reporting meta-analyses based on individual patient data because they have different design,analysis, and reporting considerations. We also excluded Health Technology Assessment documents, evidencereports produced by the AHRQ Effective Health Care Program, and Cochrane Diagnostic Test Accuracy Reviews.These documents are substantially longer than the typical systematic reviews published in journals and aresubject to reporting conventions determined by the respective entities. As a result, the final products are notrepresentative of reviews published in medical journals.
Copyright © 2013 John Wiley & Sons, Ltd. Res. Syn. Meth. 2013, 4 242–255
I. J. DAHABREH ET AL.
244
Data extraction
Nine reviewers extracted data in electronic data collection forms that included brief operational definitions foreach item. Forms were piloted using articles extracted independently by multiple reviewers and modificationswere made on the basis of the pilot results. Details of the quality control procedures used for data extractionare provided as supplementary material in the online Appendix. The final data extraction form is available onlinein the full technical report. For systematic reviews published during the updating part of the project (2004–2009),we extracted additional information; the additional extracted items are discussed below.
From all reviews, we extracted the following information: bibliographic information; number of index andreference standard tests, and number of studies included in quantitative analyses; medical subspecialty to which testswere pertinent; types of tests being assessed; details about the search strategies used; data extraction and qualityassessment methods; use of the STARD checklist (Bossuyt et al., 2003a) to guide quality assessment; statisticalmethods (assessment and exploration of heterogeneity, metrics used to assess test performance, meta-analysismodels employed, and graphical presentation of results); and assessment of comparative evidence on alternativeindex tests. All data items extracted during the first phase were also extracted from systematic review papersreviewed in the second phase. From systematic reviews reviewed in the second phase, we extracted additionalinformation on whether authors collected information on the following variables from each eligible study: blinding(specifically whether index test or reference standard assessors were blinded); use of the QUADAS checklist[first published in November 2003 (Whiting et al., 2003)] to guide quality assessment; spectrum bias; selection bias;number of withdrawals and indeterminate test results; independence of index and reference standard tests; timingof index test use in relation to the timing of the reference standard; and participants’ sex.
Statistical analysis
We calculated descriptive statistics, such as means and medians for continuous variables and proportions forcategorical variables, along with appropriate measures of dispersion. To detect trends over time in literaturereview, quality assessment, statistical analysis, and reporting characteristics of systematic reviews, we used logisticregression with each of the items of interest as the response variable and publication period as the explanatoryvariable. We present comparisons between the most recent 5 years covered by our searches (2005–2009) versus2004 or earlier; this cutoff separates the included studies into two roughly equal parts (58 and 42%, respectively)and corresponds to 1 year after the publication of STARD and QUADAS. Some of the figures present data only for1995 to 2009 and thus do not necessarily correspond directly to the regression results. Changes in the number ofstudies, index, and reference standard tests considered in each review between these time periods were assessedusing the Wilcoxon rank-sum test. Additional analyses (e.g., with a linear effect for publication year or usingalternative groupings of publication years) produced qualitatively similar results and are presented with the full textof the technical report. All analyses were conducted using Stata version SE/11.2 (StataCorp, College Station, TX).Statistical significance was defined as a two-sided p-value< 0.05 for all comparisons.
Results
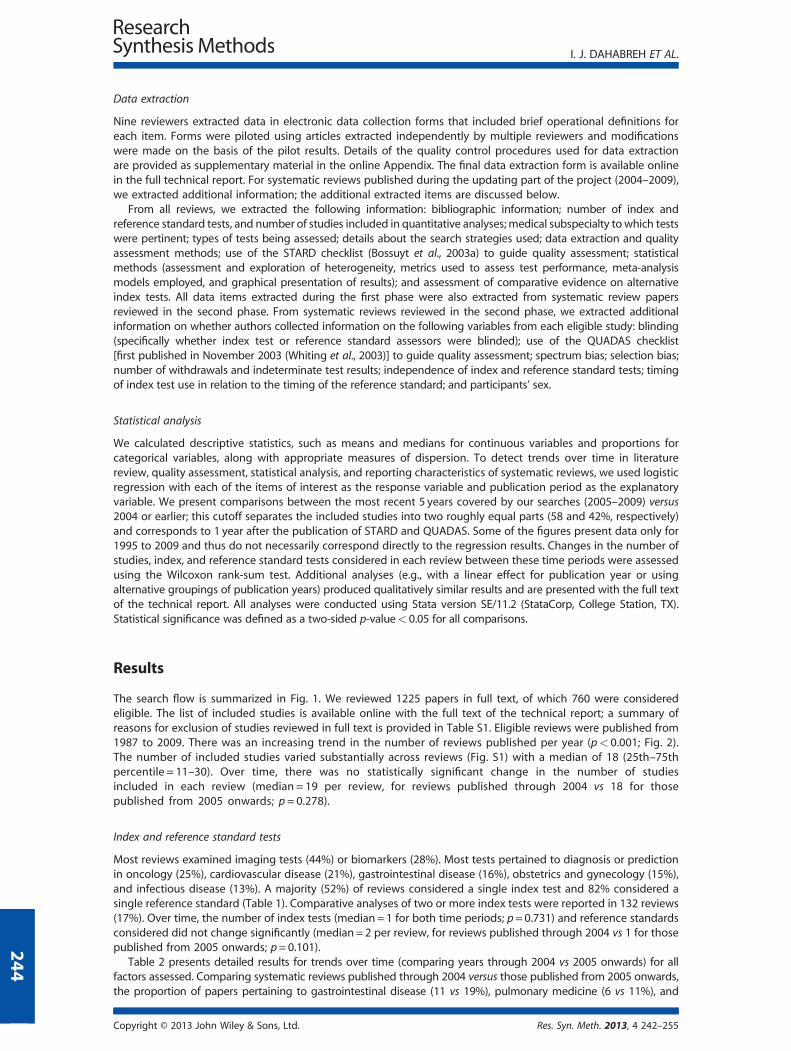
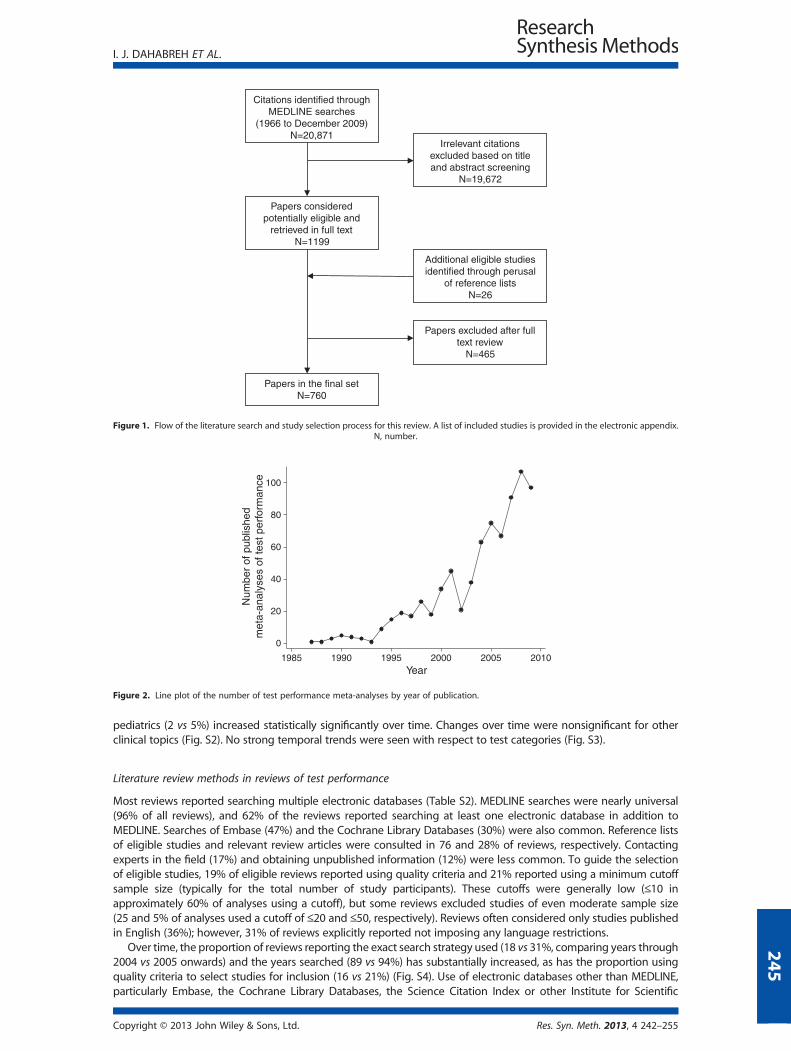
The search flow is summarized in Fig. 1. We reviewed 1225 papers in full text, of which 760 were consideredeligible. The list of included studies is available online with the full text of the technical report; a summary ofreasons for exclusion of studies reviewed in full text is provided in Table S1. Eligible reviews were published from1987 to 2009. There was an increasing trend in the number of reviews published per year (p< 0.001; Fig. 2).The number of included studies varied substantially across reviews (Fig. S1) with a median of 18 (25th–75thpercentile = 11–30). Over time, there was no statistically significant change in the number of studiesincluded in each review (median = 19 per review, for reviews published through 2004 vs 18 for thosepublished from 2005 onwards; p = 0.278).
Index and reference standard tests
Most reviews examined imaging tests (44%) or biomarkers (28%). Most tests pertained to diagnosis or predictionin oncology (25%), cardiovascular disease (21%), gastrointestinal disease (16%), obstetrics and gynecology (15%),and infectious disease (13%). A majority (52%) of reviews considered a single index test and 82% considered asingle reference standard (Table 1). Comparative analyses of two or more index tests were reported in 132 reviews(17%). Over time, the number of index tests (median= 1 for both time periods; p=0.731) and reference standardsconsidered did not change significantly (median = 2 per review, for reviews published through 2004 vs 1 for thosepublished from 2005 onwards; p=0.101).
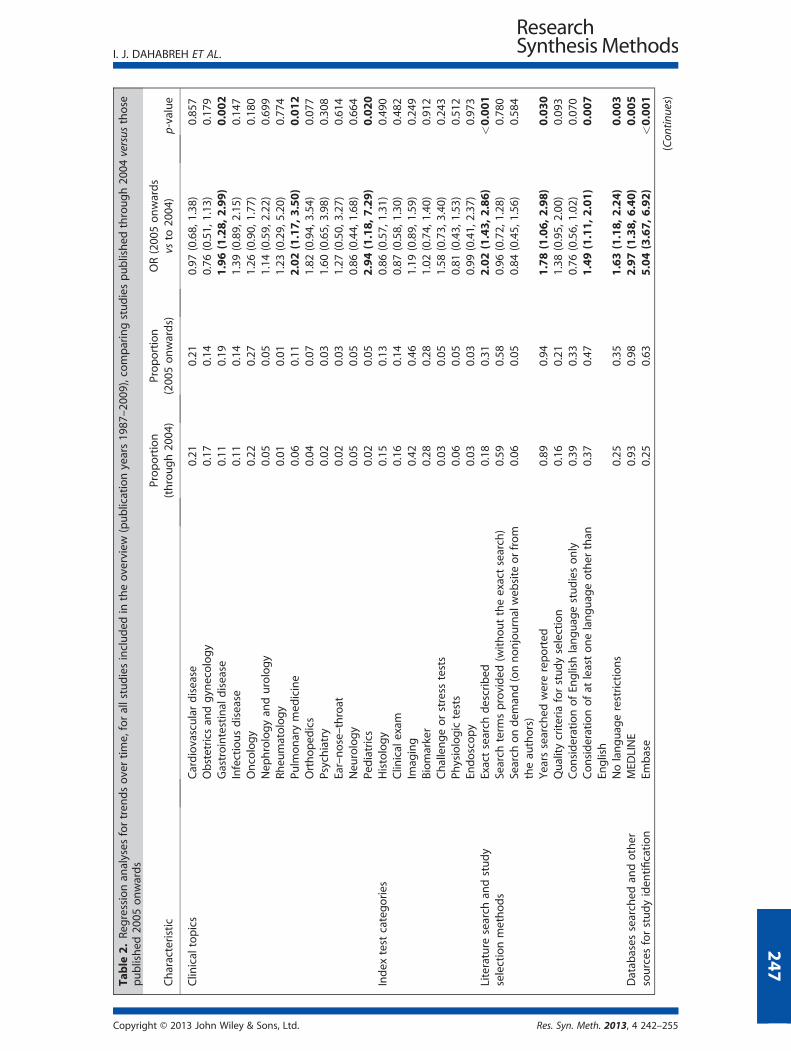
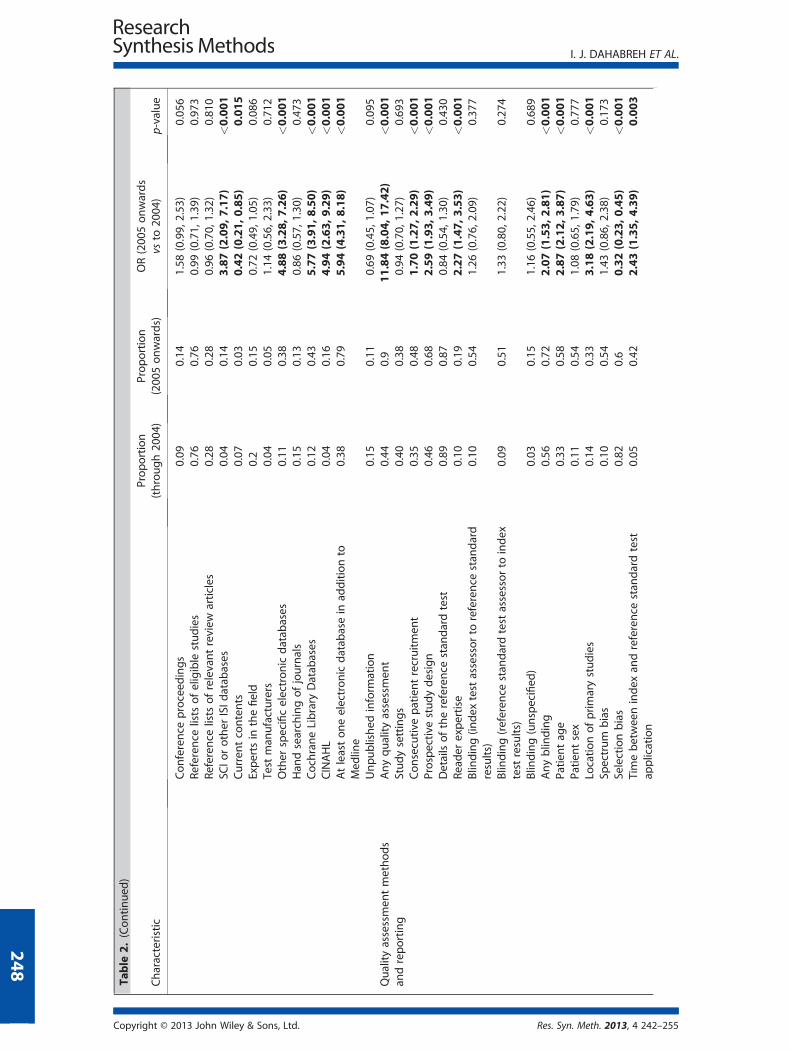
Table 2 presents detailed results for trends over time (comparing years through 2004 vs 2005 onwards) for allfactors assessed. Comparing systematic reviews published through 2004 versus those published from 2005 onwards,the proportion of papers pertaining to gastrointestinal disease (11 vs 19%), pulmonary medicine (6 vs 11%), and
Copyright © 2013 John Wiley & Sons, Ltd. Res. Syn. Meth. 2013, 4 242–255
Citations identified through MEDLINE searches
(1966 to December 2009)N=20,871
Papers considered potentially eligible and
retrieved in full textN=1199
Irrelevant citations excluded based on title and abstract screening
N=19,672
Papers in the final setN=760
Papers excluded after full text review
N=465
Additional eligible studies identified through perusal
of reference listsN=26
Figure 1. Flow of the literature search and study selection process for this review. A list of included studies is provided in the electronic appendix.N, number.
0
20
40
60
80
100
Num
ber
of p
ublis
hed
met
a-an
alys
es o
f tes
t per
form
ance
1985 1990 1995 2000 2005 2010Year
Figure 2. Line plot of the number of test performance meta-analyses by year of publication.
I. J. DAHABREH ET AL.
pediatrics (2 vs 5%) increased statistically significantly over time. Changes over time were nonsignificant for otherclinical topics (Fig. S2). No strong temporal trends were seen with respect to test categories (Fig. S3).
245
Literature review methods in reviews of test performance
Most reviews reported searching multiple electronic databases (Table S2). MEDLINE searches were nearly universal(96% of all reviews), and 62% of the reviews reported searching at least one electronic database in addition toMEDLINE. Searches of Embase (47%) and the Cochrane Library Databases (30%) were also common. Reference listsof eligible studies and relevant review articles were consulted in 76 and 28% of reviews, respectively. Contactingexperts in the field (17%) and obtaining unpublished information (12%) were less common. To guide the selectionof eligible studies, 19% of eligible reviews reported using quality criteria and 21% reported using a minimum cutoffsample size (typically for the total number of study participants). These cutoffs were generally low (≤10 inapproximately 60% of analyses using a cutoff), but some reviews excluded studies of even moderate sample size(25 and 5% of analyses used a cutoff of ≤20 and ≤50, respectively). Reviews often considered only studies publishedin English (36%); however, 31% of reviews explicitly reported not imposing any language restrictions.
Over time, the proportion of reviews reporting the exact search strategy used (18 vs 31%, comparing years through2004 vs 2005 onwards) and the years searched (89 vs 94%) has substantially increased, as has the proportion usingquality criteria to select studies for inclusion (16 vs 21%) (Fig. S4). Use of electronic databases other than MEDLINE,particularly Embase, the Cochrane Library Databases, the Science Citation Index or other Institute for Scientific
Copyright © 2013 John Wiley & Sons, Ltd. Res. Syn. Meth. 2013, 4 242–255
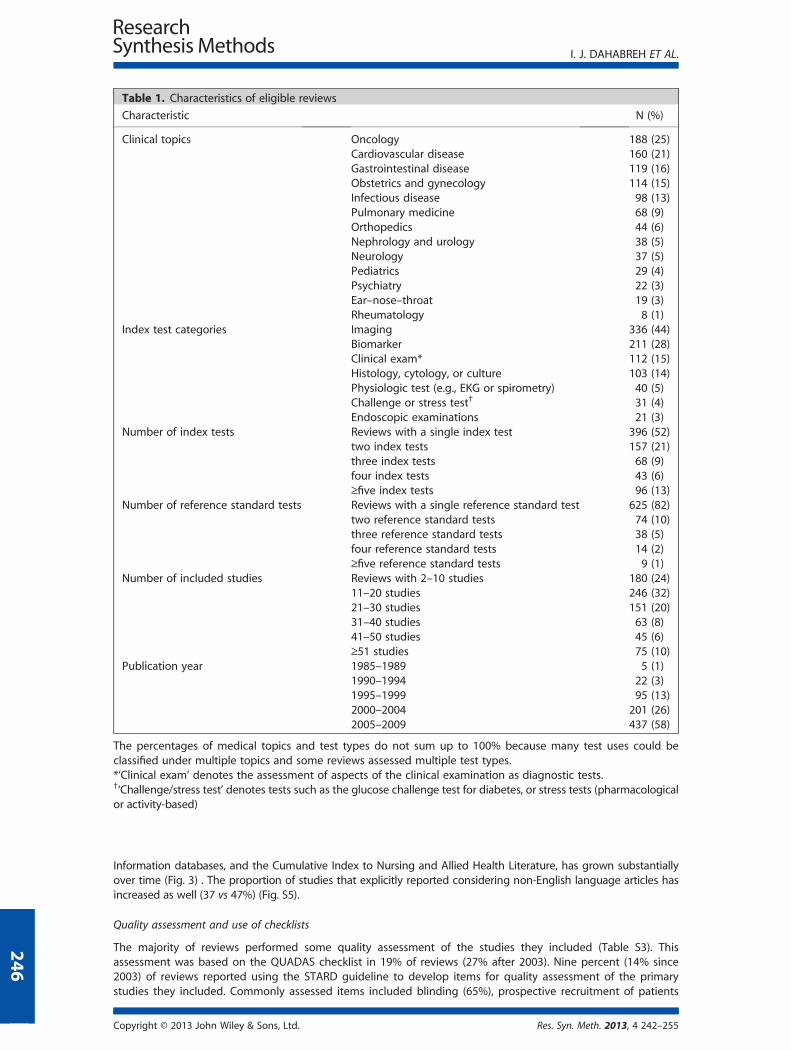
Table 1. Characteristics of eligible reviews
Characteristic N (%)
Clinical topics Oncology 188 (25)Cardiovascular disease 160 (21)Gastrointestinal disease 119 (16)Obstetrics and gynecology 114 (15)Infectious disease 98 (13)Pulmonary medicine 68 (9)Orthopedics 44 (6)Nephrology and urology 38 (5)Neurology 37 (5)Pediatrics 29 (4)Psychiatry 22 (3)Ear–nose–throat 19 (3)Rheumatology 8 (1)
Index test categories Imaging 336 (44)Biomarker 211 (28)Clinical exam* 112 (15)Histology, cytology, or culture 103 (14)Physiologic test (e.g., EKG or spirometry) 40 (5)Challenge or stress test† 31 (4)Endoscopic examinations 21 (3)
Number of index tests Reviews with a single index test 396 (52)two index tests 157 (21)three index tests 68 (9)four index tests 43 (6)≥five index tests 96 (13)
Number of reference standard tests Reviews with a single reference standard test 625 (82)two reference standard tests 74 (10)three reference standard tests 38 (5)four reference standard tests 14 (2)≥five reference standard tests 9 (1)
Number of included studies Reviews with 2–10 studies 180 (24)11–20 studies 246 (32)21–30 studies 151 (20)31–40 studies 63 (8)41–50 studies 45 (6)≥51 studies 75 (10)
Publication year 1985–1989 5 (1)1990–1994 22 (3)1995–1999 95 (13)2000–2004 201 (26)2005–2009 437 (58)
The percentages of medical topics and test types do not sum up to 100% because many test uses could beclassified under multiple topics and some reviews assessed multiple test types.*‘Clinical exam’ denotes the assessment of aspects of the clinical examination as diagnostic tests.†‘Challenge/stress test’ denotes tests such as the glucose challenge test for diabetes, or stress tests (pharmacologicalor activity-based)
I. J. DAHABREH ET AL.
246
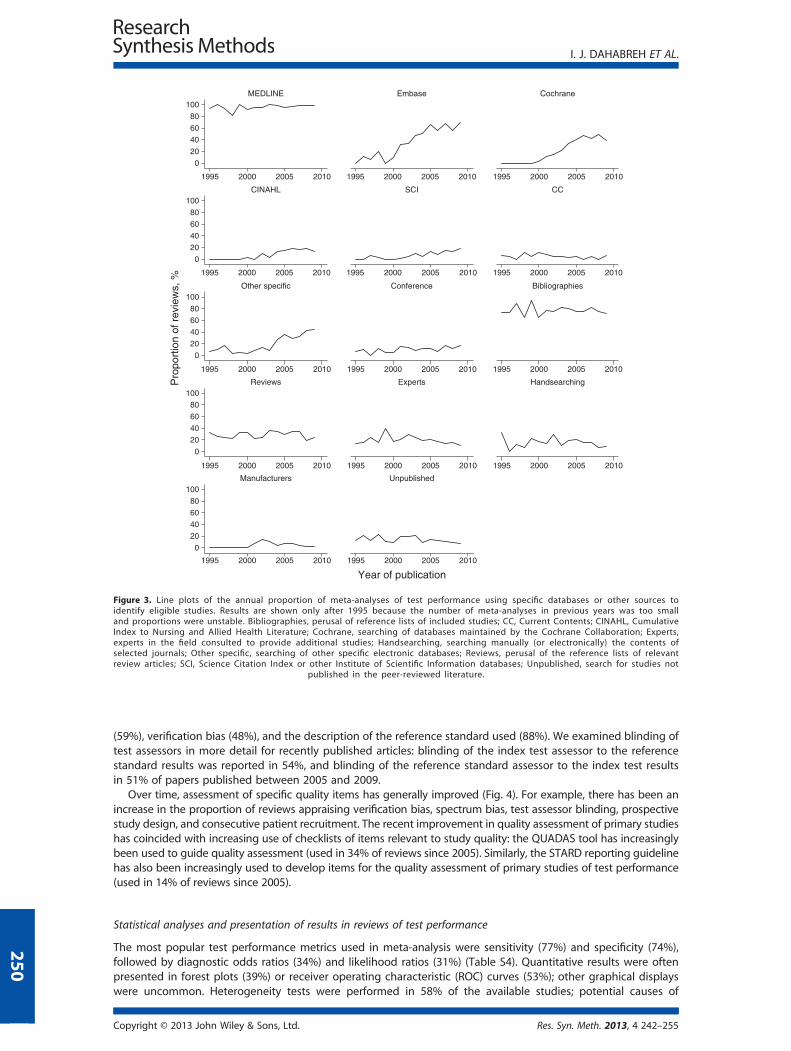
Information databases, and the Cumulative Index to Nursing and Allied Health Literature, has grown substantiallyover time (Fig. 3) . The proportion of studies that explicitly reported considering non-English language articles hasincreased as well (37 vs 47%) (Fig. S5).
Quality assessment and use of checklists
The majority of reviews performed some quality assessment of the studies they included (Table S3). Thisassessment was based on the QUADAS checklist in 19% of reviews (27% after 2003). Nine percent (14% since2003) of reviews reported using the STARD guideline to develop items for quality assessment of the primarystudies they included. Commonly assessed items included blinding (65%), prospective recruitment of patients
Copyright © 2013 John Wiley & Sons, Ltd. Res. Syn. Meth. 2013, 4 242–255
Table
2.Re
gressionan
alyses
fortren
dsovertime,forallstudiesincluded
intheoverview
(publicationyears19
87–20
09),comparingstudiespublished
through20
04versus
those
published
2005
onwards
Characteristic
Proportion
(through20
04)
Proportion
(200
5onwards)
OR(200
5onwards
vsto
2004
)p-value
Clin
ical
topics
Cardiovasculardisease
0.21
0.21
0.97
(0.68,
1.38
)0.85
7Obstetrics
andgyn
ecology
0.17
0.14
0.76
(0.51,
1.13
)0.17
9Gastrointestinal
disease
0.11
0.19
1.96(1.28,
2.99)
0.002
Infectiousdisease
0.11
0.14
1.39
(0.89,
2.15
)0.14
7Oncology
0.22
0.27
1.26
(0.90,
1.77
)0.18
0Nep
hrologyan
durology
0.05
0.05
1.14
(0.59,
2.22
)0.69
9Rh
eumatology
0.01
0.01
1.23
(0.29,
5.20
)0.77
4Pu
lmonarymed
icine
0.06
0.11
2.02(1.17,
3.50)
0.012
Orthoped
ics
0.04
0.07
1.82
(0.94,
3.54
)0.07
7Psychiatry
0.02
0.03
1.60
(0.65,
3.98
)0.30
8Ear–nose–throat
0.02
0.03
1.27
(0.50,
3.27
)0.61
4Neu
rology
0.05
0.05
0.86
(0.44,
1.68
)0.66
4Pe
diatrics
0.02
0.05
2.94(1.18,
7.29)
0.020
Index
test
categories
Histology
0.15
0.13
0.86
(0.57,
1.31
)0.49
0Clin
ical
exam
0.16
0.14
0.87
(0.58,
1.30
)0.48
2Im
aging
0.42
0.46
1.19
(0.89,
1.59
)0.24
9Biomarker
0.28
0.28
1.02
(0.74,
1.40
)0.91
2Challengeorstress
tests
0.03
0.05
1.58
(0.73,
3.40
)0.24
3Ph
ysiologictests
0.06
0.05
0.81
(0.43,
1.53
)0.51
2En
doscopy
0.03
0.03
0.99
(0.41,
2.37
)0.97
3Literature
search
andstudy
selectionmethods
Exactsearch
described
0.18
0.31
2.02(1.43,
2.86)
<0.001
Search
term
sprovided
(withouttheexactsearch)
0.59
0.58
0.96
(0.72,
1.28
)0.78
0Search
ondem
and(onnonjournalweb
site
orfrom
theau
thors)
0.06
0.05
0.84
(0.45,
1.56
)0.58
4
Yearssearched
werereported
0.89
0.94
1.78(1.06,
2.98)
0.030
Qualitycriteria
forstudyselection
0.16
0.21
1.38
(0.95,
2.00
)0.09
3ConsiderationofEn
glishlanguag
estudiesonly
0.39
0.33
0.76
(0.56,
1.02
)0.07
0Considerationofat
leastonelanguag
eother
than
English
0.37
0.47
1.49(1.11,
2.01)
0.007
Nolanguag
erestrictions
0.25
0.35
1.63(1.18,
2.24)
0.003
Datab
ases
searched
andother
sources
forstudyiden
tification
MED
LINE
0.93
0.98
2.97(1.38,
6.40)
0.005
Embase
0.25
0.63
5.04(3.67,
6.92)
<0.001
(Con
tinues)
I. J. DAHABREH ET AL.
Copyright © 2013 John Wiley & Sons, Ltd. Res. Syn. Meth. 2013, 4 242–255
247
Table
2.(Continued
)
Characteristic
Proportion
(through20
04)
Proportion
(200
5onwards)
OR(200
5onwards
vsto
2004
)p-value
Conference
proceed
ings
0.09
0.14
1.58
(0.99,
2.53
)0.05
6Re
ference
lists
ofeligible
studies
0.76
0.76
0.99
(0.71,
1.39
)0.97
3Re
ference
lists
ofrelevantreview
articles
0.28
0.28
0.96
(0.70,
1.32
)0.81
0SC
Iorother
ISId
atab
ases
0.04
0.14
3.87(2.09,7.17)
<0.001
Curren
tcontents
0.07
0.03
0.42(0.21,0.85)
0.015
Experts
inthefield
0.2
0.15
0.72
(0.49,
1.05
)0.08
6Test
man
ufacturers
0.04
0.05
1.14
(0.56,
2.33
)0.71
2Other
specificelectronicdatab
ases
0.11
0.38
4.88(3.28,7.26)
<0.001
Han
dsearchingofjournals
0.15
0.13
0.86
(0.57,
1.30
)0.47
3CochraneLibrary
Datab
ases
0.12
0.43
5.77(3.91,8.50)
<0.001
CINAHL
0.04
0.16
4.94(2.63,9.29)
<0.001
Atleastoneelectronicdatab
asein
additionto
Med
line
0.38
0.79
5.94(4.31,8.18)
<0.001
Unpublished
inform
ation
0.15
0.11
0.69
(0.45,
1.07
)0.09
5Qualityassessmen
tmethods
andreporting
Anyqualityassessmen
t0.44
0.9
11.84(8.04,17.42)
<0.001
Studysettings
0.40
0.38
0.94
(0.70,
1.27
)0.69
3Consecutive
patientrecruitmen
t0.35
0.48
1.70(1.27,2.29)
<0.001
Prospective
studydesign
0.46
0.68
2.59(1.93,3.49)
<0.001
Detailsofthereference
stan
dardtest
0.89
0.87
0.84
(0.54,
1.30
)0.43
0Re
ader
expertise
0.10
0.19
2.27(1.47,3.53)
<0.001
Blin
ding(in
dex
testassessorto
reference
stan
dard
results)
0.10
0.54
1.26
(0.76,
2.09
)0.37
7
Blin
ding(referen
cestan
dardtestassessorto
index
test
results)
0.09
0.51
1.33
(0.80,
2.22
)0.27
4
Blin
ding(unspecified
)0.03
0.15
1.16
(0.55,
2.46
)0.68
9Anyblin
ding
0.56
0.72
2.07(1.53,2.81)
<0.001
Patien
tag
e0.33
0.58
2.87(2.12,3.87)
<0.001
Patien
tsex
0.11
0.54
1.08
(0.65,
1.79
)0.77
7Lo
cationofprimarystudies
0.14
0.33
3.18(2.19,4.63)
<0.001
Spectrum
bias
0.10
0.54
1.43
(0.86,
2.38
)0.17
3Selectionbias
0.82
0.6
0.32(0.23,0.45)
<0.001
Timebetweenindex
andreference
stan
dardtest
application
0.05
0.42
2.43(1.35,4.39)
0.003
(Con
tinues)
I. J. DAHABREH ET AL.
Copyright © 2013 John Wiley & Sons, Ltd. Res. Syn. Meth. 2013, 4 242–255
248

Table
2.(Continued
)
Characteristic
Proportion
(through20
04)
Proportion
(200
5onwards)
OR(200
5onwards
vsto
2004
)p-value
Test
indep
enden
ce0.04
0.41
3.26(1.70,6.26)
<0.001
Indeterminatetest
results
0.03
0.39
22.00(11.03,43.86)
<0.001
Withdrawals
0.02
0.37
31.12(13.56,71.43)
<0.001
Verificationbias
0.30
0.62
3.77(2.77,5.12)
<0.001
QUADAS
<0.01
0.34
163.22(22.69,1173.97)
<0.001
STARD
0.02
0.14
8.25(3.51,19.35)
<0.001
Statisticala
nalysisan
dpresentation
ofquan
titative
results
Random
effectsused
0.38
0.72
4.10(3.02,5.57)
<0.001
Bayesianan
alyses
0.02
0.02
1.06
(0.40,
2.81
)0.91
1OR
0.20
0.44
3.20(2.30,4.46)
<0.001
Sensitivity
0.70
0.81
1.89(1.34,2.65)
<0.001
Specificity
0.67
0.79
1.83(1.32,2.54)
<0.001
Likelih
oodratios
0.22
0.38
2.15(1.55,2.99)
<0.001
Accuracy
0.07
0.05
0.66
(0.35,
1.22
)0.18
5Pred
ictive
values
0.12
0.14
1.17
(0.76,
1.81
)0.47
9Q*
0.06
0.01
0.21(0.08,0.53)
0.001
AUC
0.07
0.04
0.47(0.25,0.91)
0.024
Anygraphicaldisplayofan
alysis(syn
thesis)results
0.61
0.83
3.13(2.24,4.37)
<0.001
Forest
plots
0.17
0.56
6.03(4.27,8.51)
<0.001
ROCspaceplots
0.47
0.58
1.55(1.16,2.07)
0.003
Heterogen
eity
testing
0.35
0.75
5.60(4.09,7.67)
<0.001
Univariate
analyses
0.93
0.82
0.32(0.19,0.52)
<0.001
Comparativean
alyses
0.19
0.16
0.83
(0.57,
1.21
)0.34
3Advancedsynthesismethods
0.04
0.15
3.93(2.16,7.13)
<0.001
Anyexplorationofheterogen
eity
0.46
0.64
2.04(1.52,2.74)
<0.001
Provides
dataforrean
alyses
0.65
0.54
0.64(0.48,0.87)
0.004
Resultsarelim
ited
to20
04onwardsforthefollowingvariab
les:blin
ding(in
dex
test
assessorto
reference
stan
dardresults,orreference
stan
dardassessorto
index
test
results,or
unspecified
);selectionbias;
spectrum
bias;
extractionofdataonparticipan
ts’sex;
withdrawals;
indeterminatetest
results;
timing;test
indep
enden
ce.Th
eSTARD
andQUADAS
checklistswerefirstpublished
inJanuary20
03an
dNovember
2003
,respectively.Statisticallysignificantresultsareshownin
bold
type.AUC,areaunder
thecurve;CINAHL,Cumulative
Index
toNursingan
dAllied
HealthLiterature;ISI,Institute
forScientificInform
ation;OR,
oddsratio;QUADAS,
QualityAssessm
entofDiagnostic
Accuracy
Studies;RO
C,receiver
operatingcharacteristic;SCI,Science
citationindex;STA
RD,StandardsforRe
portingofDiagnosticAccuracy.
I. J. DAHABREH ET AL.
Copyright © 2013 John Wiley & Sons, Ltd. Res. Syn. Meth. 2013, 4 242–255
249
0
20
40
60
80
100
1995 2000 2005 2010
MEDLINE
1995 2000 2005 2010
Embase
1995 2000 2005 2010
Cochrane
0
20
40
60
80
100
1995 2000 2005 2010
CINAHL
1995 2000 2005 2010
SCI
1995 2000 2005 2010
CC
0
20
40
60
80
100
1995 2000 2005 2010 1995 2000 2005 2010
Conference
1995 2000 2005 2010
Bibliographies
0
20
40
60
80
100
1995 2000 2005 2010
Reviews
1995 2000 2005 2010
Experts
1995 2000 2005 2010
Handsearching
0
20
40
60
80
100
1995 2000 2005 2010
Manufacturers
1995 2000 2005 2010
Unpublished
Pro
port
ion
of r
evie
ws,
%
Year of publication
Figure 3. Line plots of the annual proportion of meta-analyses of test performance using specific databases or other sources toidentify eligible studies. Results are shown only after 1995 because the number of meta-analyses in previous years was too smalland proportions were unstable. Bibliographies, perusal of reference lists of included studies; CC, Current Contents; CINAHL, CumulativeIndex to Nursing and Allied Health Literature; Cochrane, searching of databases maintained by the Cochrane Collaboration; Experts,experts in the field consulted to provide additional studies; Handsearching, searching manually (or electronically) the contents ofselected journals; Other specific, searching of other specific electronic databases; Reviews, perusal of the reference lists of relevantreview articles; SCI, Science Citation Index or other Institute of Scientific Information databases; Unpublished, search for studies not
published in the peer-reviewed literature.
I. J. DAHABREH ET AL.
250
(59%), verification bias (48%), and the description of the reference standard used (88%). We examined blinding oftest assessors in more detail for recently published articles: blinding of the index test assessor to the referencestandard results was reported in 54%, and blinding of the reference standard assessor to the index test resultsin 51% of papers published between 2005 and 2009.
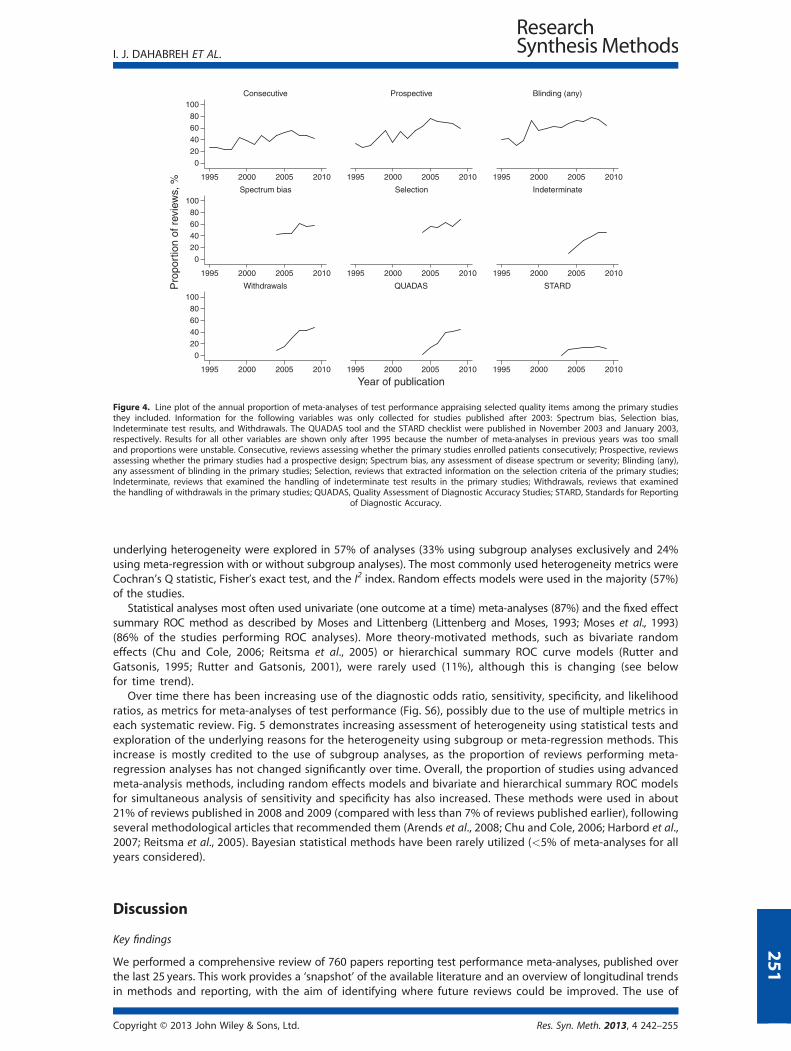
Over time, assessment of specific quality items has generally improved (Fig. 4). For example, there has been anincrease in the proportion of reviews appraising verification bias, spectrum bias, test assessor blinding, prospectivestudy design, and consecutive patient recruitment. The recent improvement in quality assessment of primary studieshas coincided with increasing use of checklists of items relevant to study quality: the QUADAS tool has increasinglybeen used to guide quality assessment (used in 34% of reviews since 2005). Similarly, the STARD reporting guidelinehas also been increasingly used to develop items for the quality assessment of primary studies of test performance(used in 14% of reviews since 2005).
Statistical analyses and presentation of results in reviews of test performance
The most popular test performance metrics used in meta-analysis were sensitivity (77%) and specificity (74%),followed by diagnostic odds ratios (34%) and likelihood ratios (31%) (Table S4). Quantitative results were oftenpresented in forest plots (39%) or receiver operating characteristic (ROC) curves (53%); other graphical displayswere uncommon. Heterogeneity tests were performed in 58% of the available studies; potential causes of
Copyright © 2013 John Wiley & Sons, Ltd. Res. Syn. Meth. 2013, 4 242–255
0
20
40
60
80
100
1995 2000 2005 2010
Consecutive
1995 2000 2005 2010
Prospective
1995 2000 2005 2010
Blinding (any)
0
20
40
60
80
100
1995 2000 2005 2010
Spectrum bias
1995 2000 2005 2010
Selection
1995 2000 2005 2010
Indeterminate
0
20
40
60
80
100
1995 2000 2005 2010
Withdrawals
1995 2000 2005 2010
QUADAS
1995 2000 2005 2010
STARDPro
port
ion
of r
evie
ws,
%
Year of publication
Figure 4. Line plot of the annual proportion of meta-analyses of test performance appraising selected quality items among the primary studiesthey included. Information for the following variables was only collected for studies published after 2003: Spectrum bias, Selection bias,Indeterminate test results, and Withdrawals. The QUADAS tool and the STARD checklist were published in November 2003 and January 2003,respectively. Results for all other variables are shown only after 1995 because the number of meta-analyses in previous years was too smalland proportions were unstable. Consecutive, reviews assessing whether the primary studies enrolled patients consecutively; Prospective, reviewsassessing whether the primary studies had a prospective design; Spectrum bias, any assessment of disease spectrum or severity; Blinding (any),any assessment of blinding in the primary studies; Selection, reviews that extracted information on the selection criteria of the primary studies;Indeterminate, reviews that examined the handling of indeterminate test results in the primary studies; Withdrawals, reviews that examinedthe handling of withdrawals in the primary studies; QUADAS, Quality Assessment of Diagnostic Accuracy Studies; STARD, Standards for Reporting
of Diagnostic Accuracy.
I. J. DAHABREH ET AL.
underlying heterogeneity were explored in 57% of analyses (33% using subgroup analyses exclusively and 24%using meta-regression with or without subgroup analyses). The most commonly used heterogeneity metrics wereCochran’s Q statistic, Fisher’s exact test, and the I2 index. Random effects models were used in the majority (57%)of the studies.
Statistical analyses most often used univariate (one outcome at a time) meta-analyses (87%) and the fixed effectsummary ROC method as described by Moses and Littenberg (Littenberg and Moses, 1993; Moses et al., 1993)(86% of the studies performing ROC analyses). More theory-motivated methods, such as bivariate randomeffects (Chu and Cole, 2006; Reitsma et al., 2005) or hierarchical summary ROC curve models (Rutter andGatsonis, 1995; Rutter and Gatsonis, 2001), were rarely used (11%), although this is changing (see belowfor time trend).
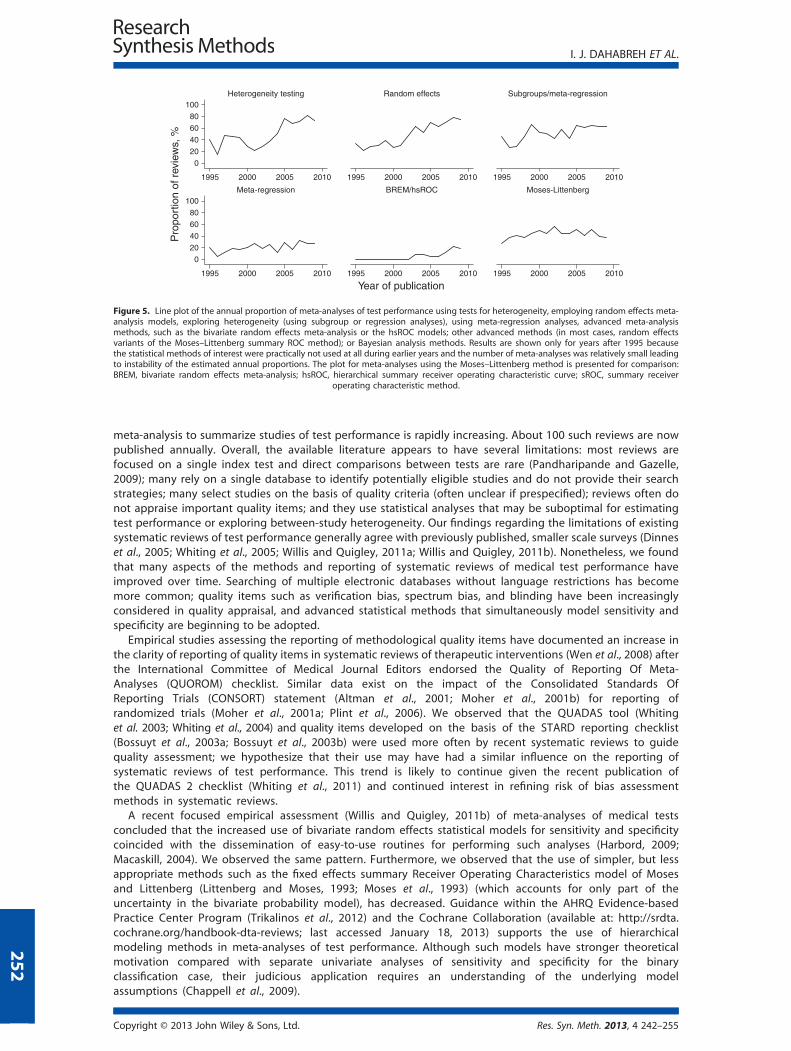
Over time there has been increasing use of the diagnostic odds ratio, sensitivity, specificity, and likelihoodratios, as metrics for meta-analyses of test performance (Fig. S6), possibly due to the use of multiple metrics ineach systematic review. Fig. 5 demonstrates increasing assessment of heterogeneity using statistical tests andexploration of the underlying reasons for the heterogeneity using subgroup or meta-regression methods. Thisincrease is mostly credited to the use of subgroup analyses, as the proportion of reviews performing meta-regression analyses has not changed significantly over time. Overall, the proportion of studies using advancedmeta-analysis methods, including random effects models and bivariate and hierarchical summary ROC modelsfor simultaneous analysis of sensitivity and specificity has also increased. These methods were used in about21% of reviews published in 2008 and 2009 (compared with less than 7% of reviews published earlier), followingseveral methodological articles that recommended them (Arends et al., 2008; Chu and Cole, 2006; Harbord et al.,2007; Reitsma et al., 2005). Bayesian statistical methods have been rarely utilized (<5% of meta-analyses for allyears considered).
251
Discussion
Key findings
We performed a comprehensive review of 760 papers reporting test performance meta-analyses, published overthe last 25 years. This work provides a ‘snapshot’ of the available literature and an overview of longitudinal trendsin methods and reporting, with the aim of identifying where future reviews could be improved. The use of
Copyright © 2013 John Wiley & Sons, Ltd. Res. Syn. Meth. 2013, 4 242–255
0
20
40
60
80
100
1995 2000 2005 2010
Heterogeneity testing
1995 2000 2005 2010
Random effects
1995 2000 2005 2010
Subgroups/meta-regression
0
20
40
60
80
100
1995 2000 2005 2010
Meta-regression
1995 2000 2005 2010
BREM/hsROC
1995 2000 2005 2010
Moses-Littenberg
Pro
port
ion
of r
evie
ws,
%
Year of publication
Figure 5. Line plot of the annual proportion of meta-analyses of test performance using tests for heterogeneity, employing random effects meta-analysis models, exploring heterogeneity (using subgroup or regression analyses), using meta-regression analyses, advanced meta-analysismethods, such as the bivariate random effects meta-analysis or the hsROC models; other advanced methods (in most cases, random effectsvariants of the Moses–Littenberg summary ROC method); or Bayesian analysis methods. Results are shown only for years after 1995 becausethe statistical methods of interest were practically not used at all during earlier years and the number of meta-analyses was relatively small leadingto instability of the estimated annual proportions. The plot for meta-analyses using the Moses–Littenberg method is presented for comparison:BREM, bivariate random effects meta-analysis; hsROC, hierarchical summary receiver operating characteristic curve; sROC, summary receiver
operating characteristic method.
I. J. DAHABREH ET AL.
252
meta-analysis to summarize studies of test performance is rapidly increasing. About 100 such reviews are nowpublished annually. Overall, the available literature appears to have several limitations: most reviews arefocused on a single index test and direct comparisons between tests are rare (Pandharipande and Gazelle,2009); many rely on a single database to identify potentially eligible studies and do not provide their searchstrategies; many select studies on the basis of quality criteria (often unclear if prespecified); reviews often donot appraise important quality items; and they use statistical analyses that may be suboptimal for estimatingtest performance or exploring between-study heterogeneity. Our findings regarding the limitations of existingsystematic reviews of test performance generally agree with previously published, smaller scale surveys (Dinneset al., 2005; Whiting et al., 2005; Willis and Quigley, 2011a; Willis and Quigley, 2011b). Nonetheless, we foundthat many aspects of the methods and reporting of systematic reviews of medical test performance haveimproved over time. Searching of multiple electronic databases without language restrictions has becomemore common; quality items such as verification bias, spectrum bias, and blinding have been increasinglyconsidered in quality appraisal, and advanced statistical methods that simultaneously model sensitivity andspecificity are beginning to be adopted.
Empirical studies assessing the reporting of methodological quality items have documented an increase inthe clarity of reporting of quality items in systematic reviews of therapeutic interventions (Wen et al., 2008) afterthe International Committee of Medical Journal Editors endorsed the Quality of Reporting Of Meta-Analyses (QUOROM) checklist. Similar data exist on the impact of the Consolidated Standards OfReporting Trials (CONSORT) statement (Altman et al., 2001; Moher et al., 2001b) for reporting ofrandomized trials (Moher et al., 2001a; Plint et al., 2006). We observed that the QUADAS tool (Whitinget al. 2003; Whiting et al., 2004) and quality items developed on the basis of the STARD reporting checklist(Bossuyt et al., 2003a; Bossuyt et al., 2003b) were used more often by recent systematic reviews to guidequality assessment; we hypothesize that their use may have had a similar influence on the reporting ofsystematic reviews of test performance. This trend is likely to continue given the recent publication ofthe QUADAS 2 checklist (Whiting et al., 2011) and continued interest in refining risk of bias assessmentmethods in systematic reviews.
A recent focused empirical assessment (Willis and Quigley, 2011b) of meta-analyses of medical testsconcluded that the increased use of bivariate random effects statistical models for sensitivity and specificitycoincided with the dissemination of easy-to-use routines for performing such analyses (Harbord, 2009;Macaskill, 2004). We observed the same pattern. Furthermore, we observed that the use of simpler, but lessappropriate methods such as the fixed effects summary Receiver Operating Characteristics model of Mosesand Littenberg (Littenberg and Moses, 1993; Moses et al., 1993) (which accounts for only part of theuncertainty in the bivariate probability model), has decreased. Guidance within the AHRQ Evidence-basedPractice Center Program (Trikalinos et al., 2012) and the Cochrane Collaboration (available at: http://srdta.cochrane.org/handbook-dta-reviews; last accessed January 18, 2013) supports the use of hierarchicalmodeling methods in meta-analyses of test performance. Although such models have stronger theoreticalmotivation compared with separate univariate analyses of sensitivity and specificity for the binaryclassification case, their judicious application requires an understanding of the underlying modelassumptions (Chappell et al., 2009).
Copyright © 2013 John Wiley & Sons, Ltd. Res. Syn. Meth. 2013, 4 242–255
I. J. DAHABREH ET AL.
Strengths and weaknesses of the study
Our study improves upon previous reviews in several dimensions. Generally, previous assessments of systematicreviews of diagnostic tests have assessed much smaller numbers of studies (Irwig et al. 1994; Moher et al., 2007), havebeen limited to a single clinical topic (e.g., oncology (Mallett et al., 2006)), have focused on a subset of the reporting oranalysis methods [e.g., handling of heterogeneity (Dinnes et al., 2005) or quality assessment (Whiting et al., 2005)], orhave restricted their assessment to high quality reviews (Willis and Quigley, 2011a; Willis and Quigley, 2011b).Furthermore, with few exceptions (Willis and Quigley, 2011a; Willis and Quigley, 2011b), no previous overview hasincluded an adequate number of studies spread over several years that would allow the exploration of trends over time.
Our work has several limitations that need to be considered when interpreting our results. First, we relied onsearches using methodological filters for identifying reports of systematic reviews of medical test performancestudies, and we only considered English language publications (Wilczynski and Haynes, 2009). Second, we reliedon MEDLINE searches, supplemented by screening of the reference lists of eligible studies and those of relevantreview articles, to identify eligible reviews. More comprehensive searches would have required the examination ofa much larger number of abstracts with little expected incremental yield. Third, we focused on meta-analysesusing aggregate published data and excluded individual patient data analyses. Although the latter represent aminority of all published meta-analyses, they provide additional flexibility in exploring between-studyheterogeneity due to patient level factors (Berlin et al., 2002). Fourth, we did not perform double extraction forall eligible studies, and data extraction was performed in two steps. However, we implemented several proceduresfor standardizing the definition of the extracted variables during data extraction and performed extensive qualitycontrol of the final dataset. Further, a substantial proportion of eligible articles were extracted in duplicate. Finally,it is often not possible to disentangle poor reporting from poor study quality when reviewing published papers.We have generally erred on the side of caution by emphasizing that our findings pertain to reporting rather thanstudy quality.
Implications for future research
This comprehensive survey of systematic reviews including meta-analyses of test performance highlights the currentstatus and the temporal evolution of a complex research field. Available reviews of medical tests have severallimitations in regard to methodological approaches and reporting characteristics; however, over time, authors haveincreasingly performedmore comprehensive assessments of study quality and have usedmore appropriate statisticalmethods addressing the particular challenges relevant to reviews of test performance. The large and rapidlyexpanding number of available systematic reviews identified by this survey reflects the growing interest in‘evidence-based diagnosis’ (Fowler, 1997; Whiting et al., 2008). The empirical data we collected could be used toinform the development of future methodological standards for the conduct of reviews of medical tests. Increasinguse of checklists is expected to facilitate further improvements in the quality assessment of primary studies includedin systematic reviews of medical tests. Similarly, increasing diffusion of methodological advances, availability ofsoftware to perform advanced statistical analyses, and clear guidelines for the conduct and reporting have thepotential to lead to further improvements in the practice of systematic reviews of medical tests (Deeks, 2001; Devilleet al., 2002; Irwig et al., 1994; Tatsioni et al., 2005; Macaskill et al., 2010).
Competing interests
The authors have no financial conflict of interest. IJD, TAT, JL, and CHS are involved in the development ofsoftware to perform meta-analysis (including meta-analysis of diagnostic test data) under contract with AHRQ.The software and its source code is freely available online (http://www.cebm.brown.edu/open_meta).
Acknowledgements
All authors have completed the Unified Competing Interest form at http://www.icmje.org/coi_disclosure.pdf(available on request from the corresponding author) and have declared: this work was funded by grant R01HS013328 and contract HHSA 290 2007 10055 I, both from the AHRQ, U.S. Department of Health and HumanServices. The authors of this report are responsible for its content. Statements in the report should not beconstrued as endorsement by the AHRQ or the U.S. Department of Health and Human Services.
253
References
Altman DG, Schulz KF, Moher D, Egger M, Davidoff F, Elbourne D, Gotzsche PC, Lang T. 2001. The revised CONSORTstatement for reporting randomized trials: explanation and elaboration. Annals of Internal Medicine 134(8): 663–694.
Copyright © 2013 John Wiley & Sons, Ltd. Res. Syn. Meth. 2013, 4 242–255

I. J. DAHABREH ET AL.
254
Arends LR, Hamza TH, van Houwelingen JC, Heijenbrok-Kal MH, Hunink MG, Stijnen T. 2008. Bivariate randomeffects meta-analysis of ROC curves. Medical Decision Making 28(5): 621–638.
Berlin JA, Santanna J, Schmid CH, Szczech LA, Feldman HI. 2002. Individual patient- versus group-level data meta-regressions for the investigation of treatment effect modifiers: ecological bias rears its ugly head. Statistics inMedicine 21(3): 371–387.
Bossuyt PM, Reitsma JB, Bruns DE, Gatsonis CA, Glasziou PP, Irwig LM, Lijmer JG, Moher D, Rennie D, de Vet HC.2003a. Towards complete and accurate reporting of studies of diagnostic accuracy: the STARD initiative. Annalsof Internal Medicine 138(1): 40–44.
Bossuyt PM, Reitsma JB, Bruns DE, Gatsonis CA, Glasziou PP, Irwig LM, Moher D, Rennie D, de Vet HC, Lijmer JG.2003b. The STARD statement for reporting studies of diagnostic accuracy: explanation and elaboration. Annalsof Internal Medicine 138(1): W1–12.
Chappell FM, Raab GM, Wardlaw JM. 2009. When are summary ROC curves appropriate for diagnostic meta-analyses? Statistics in Medicine 28(21): 2653–2668.
Chu H, Cole SR. 2006. Bivariate meta-analysis of sensitivity and specificity with sparse data: a generalized linearmixed model approach. Journal of Clinical Epidemiology 59(12): 1331–1332.
Deeks JJ. 2001. Systematic reviews in health care: systematic reviews of evaluations of diagnostic and screeningtests. BMJ 323(7305): 157–162.
Deville WL, Buntinx F, Bouter LM, Montori VM, de Vet HC, van der Windt DA, Bezemer PD. 2002. Conductingsystematic reviews of diagnostic studies: didactic guidelines. BMC Medical Research Methodology 2: 9.
Dinnes J, Deeks J, Kirby J, Roderick P. 2005. A methodological review of how heterogeneity has been examined insystematic reviews of diagnostic test accuracy. Health Technology Assessment 9(12): 1–113, iii.
Fowler PB. 1997. Evidence-based diagnosis. Journal of Evaluation in Clinical Practice 3(2): 153–159.Gatsonis C, Paliwal P. 2006. Meta-analysis of diagnostic and screening test accuracy evaluations: methodologic
primer. AJR. American Journal of Roentgenology 187(2): 271–281.Harbord RM. 2009. metandi: meta-analysis of diagnostic accuracy using hierarchical logistic regression. In Sterne J
(ed.), Meta-Analysis: An Updated Collection from the Stata Journal. Stata Press, College Station, TX.Harbord RM, Deeks, JJ, Egger M, Whiting P, Sterne JA. 2007. A unification of models for meta-analysis of diagnostic
accuracy studies. Biostatistics 8(2): 239–251.Irwig L, Tosteson AN, Gatsonis C, Lau J, Colditz G, Chalmers TC, Mosteller F. 1994. Guidelines for meta-analyses
evaluating diagnostic tests. Annals of Internal Medicine 120(8): 667–676.Lijmer JG, Leeflang M, Bossuyt PM. 2009. Proposals for a phased evaluation of medical tests. Medical Decision
Making 29(5): E13–E21.Lijmer JG, Mol BW, Heisterkamp S, Bonsel GJ, Prins MH, van der Meulen JH, Bossuyt PM. 1999. Empirical evidence
of design-related bias in studies of diagnostic tests. JAMA: The Journal of the American Medical Association282(11): 1061–1066.
Littenberg B, Moses LE. 1993. Estimating diagnostic accuracy from multiple conflicting reports: a new meta-analytic method. Medical Decision Making 13(4): 313–321.
Macaskill P. 2004. Empirical Bayes estimates generated in a hierarchical summary ROC analysis agreed closely withthose of a full Bayesian analysis. Journal of Clinical Epidemiology 57(9): 925–932.
Macaskill P, Gatsonis C, Deeks J, Harbord R, Takwoingi Y. 2010. Chapter 10: analysing and presenting results. InDeeks JJ, Bossuyt PM, Gatsonis C (eds), Cochrane Handbook for Systematic Reviews of Diagnostic Test AccuracyVersion 1.0. The Cochrane Collaboration, 2010. Available from: http://srdta.cochrane.org/.
Mallett S, Deeks JJ, Halligan S, Hopewell S, Cornelius V, Altman DG. 2006. Systematic reviews of diagnostic tests incancer: review of methods and reporting. BMJ 333(7565): 413.
Miettinen OS. 2001. The modern scientific physician: 3. Scientific diagnosis. Canadian Medical Association Journal165(6): 781–782.
Moher D, Jones A, Lepage L. 2001a. Use of the CONSORT statement and quality of reports of randomized trials:a comparative before-and-after evaluation. JAMA: The Journal of the American Medical Association285(15): 1992–1995.
Moher D, Schulz KF, Altman DG. 2001b. The CONSORT statement: revised recommendations for improving thequality of reports of parallel-group randomized trials. Annals of Internal Medicine 134(8): 657–662.
Moher D, Tetzlaff J, Tricco AC, Sampson M, Altman DG. 2007. Epidemiology and reporting characteristics ofsystematic reviews. PLoS Medicine 4(3): e78.
Moses LE, Shapiro D, Littenberg B. 1993. Combining independent studies of a diagnostic test into a summary ROCcurve: data-analytic approaches and some additional considerations. Statistics in Medicine 12(14): 1293–1316.
Pandharipande PV, Gazelle GS. 2009. Comparative effectiveness research: what it means for radiology. Radiology253(3): 600–605.
Plint AC, Moher D, Morrison A, Schulz K, Altman DG, Hill C, Gaboury I. 2006. Does the CONSORT checklist improvethe quality of reports of randomised controlled trials? A systematic review. The Medical Journal of Australia185(5): 263–267.
Ransohoff DF, Feinstein AR. 1978. Problems of spectrum and bias in evaluating the efficacy of diagnostic tests. TheNew England Journal of Medicine 299(17): 926–930.
Copyright © 2013 John Wiley & Sons, Ltd. Res. Syn. Meth. 2013, 4 242–255
I. J. DAHABREH ET AL.
Reid MC, Lachs MS, Feinstein AR. 1995. Use of methodological standards in diagnostic test research. Getting betterbut still not good. JAMA: The Journal of the American Medical Association 274(8): 645–651.
Reitsma JB, Glas AS, Rutjes AW, Scholten RJ, Bossuyt PM, Zwinderman AH. 2005. Bivariate analysis of sensitivity andspecificity produces informative summary measures in diagnostic reviews. Journal of Clinical Epidemiology58(10): 982–990.
Rutjes AW, Reitsma JB, Di NM, Smidt N, van Rijn JC, Bossuyt PM. 2006. Evidence of bias and variation in diagnosticaccuracy studies. Canadian Medical Association Journal 174(4): 469–476.
Rutter CM, Gatsonis CA. 1995. Regression methods for meta-analysis of diagnostic test data. Academic Radiology2(Suppl 1): S48–S56.
Rutter CM, Gatsonis CA. 2001. A hierarchical regression approach to meta-analysis of diagnostic test accuracyevaluations. Statistics in Medicine 20(19): 2865–2884.
Schmid CH, Chung M, Chew P, Lau J. 2004. Survey of diagnostic test meta-analyses. 12th Cochrane Colloquium.Tatsioni A, Zarin DA, Aronson N, Samson DJ, Flamm CR, Schmid C, Lau J. 2005. Challenges in systematic reviews of
diagnostic technologies. Annals of Internal Medicine 142(12 Pt 2): 1048–1055.Trikalinos TA, Balion CM, Coleman CI, Griffith L, Santaguida PL, Vandermeer B, Fu R. 2012. Chapter 8: meta-analysis
of test performance when there is a “gold standard”. Journal of General Internal Medicine 27(Suppl 1): S56–66.van Houwelingen HC, Arends LR, Stijnen T. 2002. Advanced methods in meta-analysis: multivariate approach and
meta-regression. Statistics in Medicine 21(4): 589–624.van Houwelingen HC, Zwinderman KH, Stijnen T. 1993. A bivariate approach to meta-analysis. Statistics in Medicine
12(24): 2273–2284.Wen J, Ren Y, Wang L, Li Y, Liu Y, Zhou M, Liu P, Ye L, Li Y, Tian W. 2008. The reporting quality of meta-analyses
improves: a random sampling study. Journal of Clinical Epidemiology 61(8): 770–775.Westwood ME, Whiting PF, Kleijnen J. 2005. How does study quality affect the results of a diagnostic meta-
analysis? BMC Medical Research Methodology 5: 20.Whiting P, Harbord R, de Salis I, Egger M, Sterne J. 2008. Evidence-based diagnosis. Journal of Health Services
Research & Policy 13(Suppl 3): 57–63.Whiting P, Rutjes AW, Dinnes J, Reitsma J, Bossuyt PM, Kleijnen J. 2004. Development and validation of methods
for assessing the quality of diagnostic accuracy studies. Health Technology Assessment 8(25): iii, 1-234.Whiting P, Rutjes AW, Dinnes J, Reitsma JB, Bossuyt PM, Kleijnen, J. 2005. A systematic review finds that diagnostic
reviews fail to incorporate quality despite available tools. Journal of Clinical Epidemiology 58(1): 1–12.Whiting P, Rutjes AW, Reitsma JB, Bossuyt PM, Kleijnen J. 2003. The development of QUADAS: a tool for the quality
assessment of studies of diagnostic accuracy included in systematic reviews. BMC Medical ResearchMethodology 3: 25.
Whiting PF, Rutjes AW, Westwood ME, Mallett S, Deeks JJ, Reitsma JB, Leeflang MM, Sterne JA, Bossuyt PM. 2011.QUADAS-2: a revised tool for the quality assessment of diagnostic accuracy studies. Annals of Internal Medicine155(8): 529–536.
Whiting PF, Weswood ME, Rutjes AW, Reitsma JB, Bossuyt PN, Kleijnen J. 2006. Evaluation of QUADAS, a tool forthe quality assessment of diagnostic accuracy studies. BMC Medical Research Methodology 6: 9.
Wilczynski NL, Haynes RB. 2009. Consistency and accuracy of indexing systematic review articles and meta-analyses in MEDLINE. Health Information and Libraries Journal 26(3): 203–210.
Willis BH, Quigley M. 2011a. The assessment of the quality of reporting of meta-analyses in diagnostic research: asystematic review. BMC Medical Research Methodology 11: 163.
Willis BH, Quigley M. 2011b. Uptake of newer methodological developments and the deployment of meta-analysisin diagnostic test research: a systematic review. BMC Medical Research Methodology 11: 27.
Copyright © 2013 John Wiley & Sons, Ltd. Res. Syn. Meth. 2013, 4 242–255
255