Embed Size (px)
Citation preview

TECHNOLOGY EVALUATION AND DEVELOPMENT SUB-PROGRAM
SURVEY OF MOISTURE DISTRIBUTION BETWEEN TILEDRAINAGE LATERALS AND ITS RELATIONSHIP TO
COMPACTION AND ROOTING DEPTH IN FLAT CLAY SOILS
FINAL REPORT
December, 1990
Prepared by: STRATA ENGINEERING CORPORATIONDon Mills, Ontario
Under the Direction of: ECOLOGICAL SERVICES FOR PLANNING LIMITED,Guelph, Ontario - Subprogram Manager For TED
On Behalf of: AGRICULTURE CANADA RESEARCH STATION, HARROW, ONTARIO N0R 1G0
Disclaimer: The views contained herein do not necessarily reflect the views ofthe Government of Canada or the SWEEP ManagementCommittee.


EXECUTIVE SUMMARY
Three tile drained farms on flat, poorly drained Brookston clay soil in northern EssexCounty were studied with respect to soil moisture distribution between drainage lateralsand its relationship to compaction, root growth, crop development, and yields. The surveytype study was carried out under uncontrolled conditions in order not to interfere with thecropping program and schedule of the three farmer cooperators.
No significant increase in soil density (and hence compaction) was observed on one farmwhich had tomatoes in its rotation the year before the study. Mean dry densities were loweron this farm than on the other farms studied.
Information from this study suggests that a soil moisture content of 20% representsoptimum conditions for soil compaction on Brookston clay, and that agricultural equipmentand implement traffic should be avoided at or near this moisture content, if possible. It wasnoted that soil moisture contents at harvest time are generally below 20%. Therefore,harvesting equipment and loaders for intensive cropping (tomatoes) should not pose a soilcompaction problem on Brookston clay soil, unless there is a wetter than normal harvestingseason.
Marked soil cracking was observed on all farms during the summer months. Principallybecause of these cracks, summer rains percolate very quickly below tile drain invert level.This tendency for relatively quick drainage during summer months is felt to be limitingadequate wetting of the root zone, and may also be contributing to undesirable removal ofsoil nutrients.
Due to the small number of farms and the overview scope of this study, firm conclusionscould not be drawn for all parameters studied. Some observed trends require confirmationthrough further specific dedicated research, under controlled conditions, as outlined in therecommendations given in this report.


i
TABLE OF CONTENTS
COVER
EXECUTIVE SUMMARY
TABLE OF CONTENTS (I) - (iii)
LIST OF TABLES (iv)
LIST OF FIGURES (v)
1.0 INTRODUCTION 11.1 Terms of Reference 11.2 Scope of Study 2
2.0 STUDY OBJECTIVES 3
3.0 LITERATURE REVIEW 33.1 Previous and Related Studies 33.2 Soil Compaction 43.3 Hydraulic Conductivity 53.4 Tile Drainage Formulae 63.5 Soil Cracking 73.6 Mole Drainage 73.7 Soil Moisture Tension 8
4.0 SITE AND GEOLOGY 84.1 Location 84.2 Geology 84.3 Soil 84.4 Drainage 9
5.0 STUDY METHODOLOGY 95.1 Farm Selection 9
5.1.1 Selection Criteria 95.1.2 Soil Type and Crop 95.1.3 Cropping and Cultivation 11

ii
TABLE OF CONTENTS - continued
5.2 Drainage Characterization 125.2.1 Tile Lateral Spacing 125.2.2 Survey Lines and Experimental Areas 125.2.3 Site Mapping/Surveying 135.2.4 Laterals, Gradients 135.2.5 Piezometers 135.2.6 Tensiometers 145.2.7 Rain Gauges 14
5.3 In Situ Measurements 155.3.1 Nuclear Moisture-Density Meter 15
5.4 Field Studies 155.4.1 Visits, Observations and Measurements 155.4.2 Precipitation 155.4.3 In Situ Moisture-Density 155.4.4 Crop Condition and Growth 165.4.5 Field Soil Sampling 165.4.6 Hydraulic Conductivity Measurements 165.4.7 Crop Harvesting 165.4.8 Root Development 175.4.9 Measurement of Soil Cracking 17
5.5 Laboratory Studies 175.5.1 Moisture Contents 175.5.2 Atterberg Limits 185.5.3 Densities and Specific Gravity 185.5.4 Root Development 185.5.5 Soil Cracking 18
6.0 STUDY RESULTS 196.1 Approach and Expectations of Research 196.2 Field Measurements 19
6.2.1 Moisture Content Determinations 196.2.2 Density Measurements 246.2.3 Groundwater Levels 28

iii
TABLE OF CONTENTS - continued
6.2.4 Soil Cracking 286.2.5 Crop Yields/Plants Heights 316.2.6 Tensiometers 316.2.7 Hydraulic Conductivity 35
6.3 Laboratory Tests 356.3.1 Moisture, Density, Shrinkage 356.3.2 Densities and Compaction 356.3.3 Root Growth 356.3.4 Harvest Yields 356.3.5 Soil Cracking 36
7.0 DISCUSSION OF RESULTS 377.1 Study Approach 377.2 Relationships 37
7.2.1 Moisture Density-Compaction 377.2.2 Yields-Density-Compaction, Variety 387.2.3 Yields - Tile Spacing, Plant Height 457.2.4 Yields - Cropping History/Cultivation/Plant Height 457.2.5 Moisture - Precipitation - Water Levels 457.2.6 Root Growth Measurements 487.2.7 Troxler Data Reliability 487.2.8 Soil Crack Measurements and Shrinkage 52
7.3 Drainage Effectiveness 527.4 Significance of Results 56
8.0 OBSERVATIONS 57
9.0 RECOMMENDATIONS 59
10.0 CLOSURE 61
11.0 REFERENCES CITED 62
APPENDIX

iv
LIST OF TABLES
5.1 Initial Farm Selection Criteria 10
5.2 Revised Farm Selection Criteria 10
5.3 Farms Selected for Study 10
5.4 Textural Classification of Farms Selected for Study 11
5.5 Cropping Histories of Farms Studied 11
6.1 Mean Moisture Contents (% Dry Weight) 1989 20
6.2 Comparison of Mean Moistures (Troxler) at Two Depths, 1989 20
6.3 Mean Dry Density (kg/m3 x 1000), 1989 24
6.4 Mean Dry Density (kg/m3 x 1000), 1989, by Depth 24
6.5 Mean Dry Density over Tiles and at Midpoints (kg/m3 x 1000) , 1989 26
6.6 Moisture Content, Net Soil Air, Soil Physical Characteristics 31
6.7 Root Measurements, 1989 36
6.8 Average Farm Yields 36
7.1 Average Optimum Moisture Contents (%) 37
7.2 Yield Comparisons/Pioneer 9202 Soy Bean Variety 44
7.3 Commercial Yields 44
7.4 Depths, Spacings and Gradients of Laterals 56

v
LIST OF FIGURES
6.1 Moisture Content along Survey Lines, Farm 1 21
6.2 Moisture Content along Survey Lines, Farm 2 22
6.3 Moisture Content along Survey Lines, Farm 3 23
6.4 1990: Mean Moisture Content (Troxler) 25
6.5 1990: Mean Dry Density (Troxler) 27
6.6 Farm 1 - Comparison of Rainfall and Groundwater Elevations, 1990 29
6.7 Farm 1 - Water Levels in Piezometers at tiles and midpoints 30
6.8 1990: Time Variation of Farm Averaged Crack Volume and Moisture Content 32
6.9 Farm 1: Comparison of Soil Tension and Rainfall at Tile Location - 1990 33
6.10 Farm 1: Comparison of Soil Tension and Rainfall at Midpoint - 1990 34
7.1 Dry Density vs. Moisture Content - Troxler - 1989 39
7.2 Dry Density vs. Moisture Content - Laboratory - 1989 40
7.3 Farm 1: Laboratory 1990 Dry Density vs, Moisture Content 41
7.4 Shrinkage vs. Moisture Content-Laboratory 1989 (All Farms) & 1990 (Farm 1) 42
7.5 Yield vs. Mean Dry Density, Farms 1, 2, 3 43
7.6 Yield vs. Tile Spacing, Farms 1, 2, 3 46
7.7 Plant Height vs. Tile Spacing, Farms 1, 2, 3 47
7.8 1990: Dry Density - Laboratory vs. Troxler 49

vi
7.9 Farm 1: Moisture Content - Laboratory vs. Troxler - 1990 50
7.10 1990: Farm Means of Dry Density & Moisture Content 51- Troxler & Laboratory
7.11 Dry Density vs. Crack Volume - Laboratory 1990 53
7.12 April-July 1990: Crack Volume vs. Laboratory Moisture Content 54
7.13 Change in Dry Density due to Shrinkage vs. Initial Moisture Content: 55Lab 1990

1
SURVEY OF MOISTURE DISTRIBUTION BETWEEN TILE DRAINAGE LATERALSAND ITS RELATIONSHIP TO COMPACTION AND ROOTING DEPTH IN FLAT CLAY
SOILSTechnology Evaluation and Development (TED) Subprogram of the
Soil and Water Environmental Enhancement Program (SWEEP)Agriculture Canada - Supply and Services Canada
DSS File No. 02 SE 01686-8-TED-19
1.0 INTRODUCTION
Agriculture Canada, through Supply and Services Canada, has awarded Strata EngineeringCorporation a contract to execute a survey of soil moisture distribution between tile drainagelaterals and to investigate its relationship to compaction and rooting depth in flat clay soils insouthwestern Ontario. The study forms part of the Technology Evaluation and Development (TED)sub-program of the Soil and Water Environmental Enhancement Program (SWEEP). This reportis submitted in fulfilment of the requirements of SWEEP-TED Contract 01686-9-0063.
1.1 Terms of Reference
The primary purpose of this study was to assess the effect of soil moisture content on soilcompaction and crop rooting depth in the flat clay soils of southwestern Ontario.
At the start up meeting with the Scientific Authority from Agriculture Canada, experts fromEcological Services for Planning (ESP), and field officers from the Ontario Ministry of Agricultureand Food (OMAF), the terms of reference were agreed to cover the relationships, if any, betweensoil moisture, soil compaction and location of tile drainage laterals, and their influence on rootgrowth, crop development, and yields. It was agreed that root development would be visuallydetermined. Plants were to be harvested for biomass determinations and yield measurements.
Soy beans were selected as the index crop for all experimental sites.
A draft final report was submitted to Agriculture Canada in March, 1990. The report pointed outdeficiencies in data due to lateness of start of the project. Therefore, a minor extension of the studywas granted to evaluate spring 1990 conditions.
The results of more recent field observations and additional soil cracking laboratory simulationstudies are incorporated in this final report.

2
1.2 Scope of study
The scope of the work undertaken included:
! Extensive literature review;
! Selection of farm sites and farmer cooperators for measurement of certain variables;
! Development of survey methods and appropriate experimental design and measurementof interacting variables such as:
- compaction;- moisture content, soil moisture tension;- soil physical characteristics, including soil cracking;- drain type, spacing, gradient and depth; - hydraulic conductivity;- water table levels;- plant height;- varietal information;- root development;- crop yields;- rainfall;
! Recording of previous and current crop rotation, cultivation and management procedures(cropping history);
! Reporting procedures, including the completion of two quarterly reports, a preliminary anda draft final report;
! Farmer cooperator selection, contacts, and ongoing liaison;
! Crop harvesting, and selection of plants for root development study;
! Analysis of experimental results;
! Determination of relationships between variables and trends observed;
! Recommendations for further work based on the data and analyses.
3
2.0 STUDY OBJECTIVES
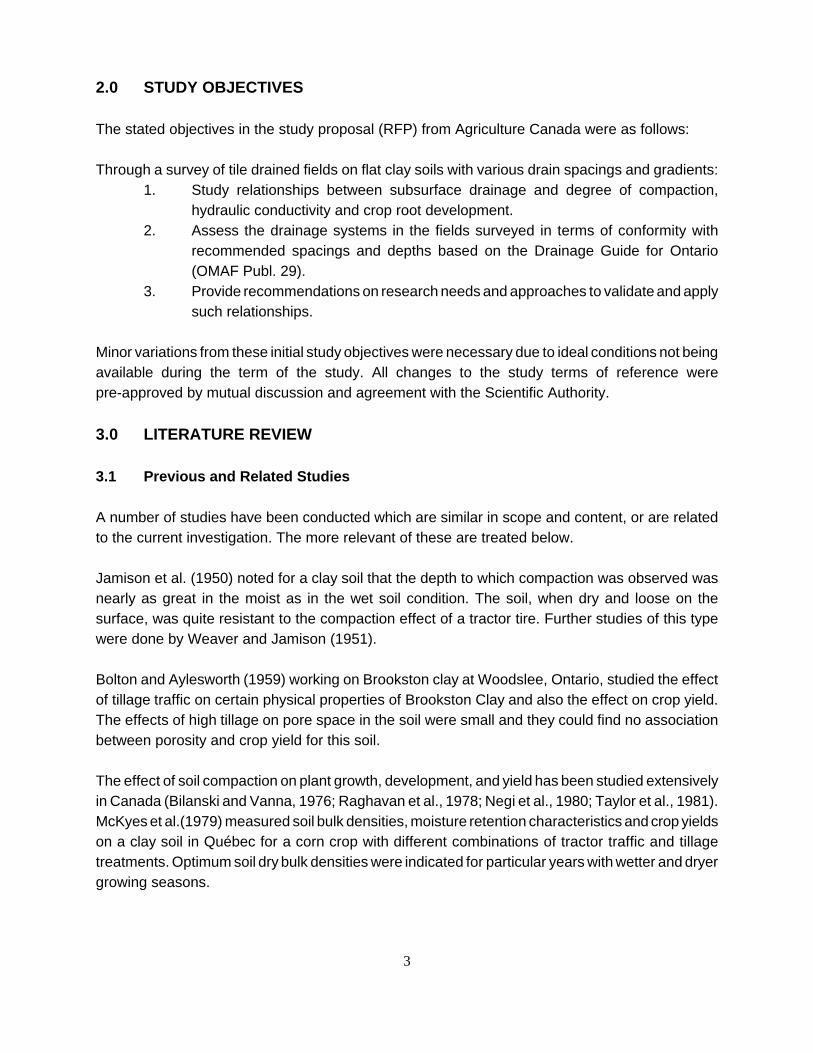
The stated objectives in the study proposal (RFP) from Agriculture Canada were as follows:
Through a survey of tile drained fields on flat clay soils with various drain spacings and gradients:1. Study relationships between subsurface drainage and degree of compaction,
hydraulic conductivity and crop root development.2. Assess the drainage systems in the fields surveyed in terms of conformity with
recommended spacings and depths based on the Drainage Guide for Ontario(OMAF Publ. 29).
3. Provide recommendations on research needs and approaches to validate and applysuch relationships.
Minor variations from these initial study objectives were necessary due to ideal conditions not beingavailable during the term of the study. All changes to the study terms of reference werepre-approved by mutual discussion and agreement with the Scientific Authority.
3.0 LITERATURE REVIEW
3.1 Previous and Related Studies
A number of studies have been conducted which are similar in scope and content, or are relatedto the current investigation. The more relevant of these are treated below.
Jamison et al. (1950) noted for a clay soil that the depth to which compaction was observed wasnearly as great in the moist as in the wet soil condition. The soil, when dry and loose on thesurface, was quite resistant to the compaction effect of a tractor tire. Further studies of this typewere done by Weaver and Jamison (1951).
Bolton and Aylesworth (1959) working on Brookston clay at Woodslee, Ontario, studied the effectof tillage traffic on certain physical properties of Brookston Clay and also the effect on crop yield.The effects of high tillage on pore space in the soil were small and they could find no associationbetween porosity and crop yield for this soil.
The effect of soil compaction on plant growth, development, and yield has been studied extensivelyin Canada (Bilanski and Vanna, 1976; Raghavan et al., 1978; Negi et al., 1980; Taylor et al., 1981).McKyes et al.(1979) measured soil bulk densities, moisture retention characteristics and crop yieldson a clay soil in Québec for a corn crop with different combinations of tractor traffic and tillagetreatments. Optimum soil dry bulk densities were indicated for particular years with wetter and dryergrowing seasons.

4
Raghavan and McKyes (1983) found that growth performance of corn plants on clay soil was bestin moderately compacted plots. Yields increased with increasing tire contact pressure, reached apeak, then rapidly decreased with further increase. A similar relationship was observed betweenyield and dry bulk density.
Gameda et al. (1985) produced a comprehensive review paper on subsoil compaction and cropresponse.
A paper on subsoil compaction in a clay soil (Gameda et al, 1987) showed that soil moisturecontents during compaction significantly affected clay soil bulk density distribution under high axleloads. Fall tillage and over-wintering removed the effect that soil loading under dry conditions hadon topsoil bulk densities, but they were not as effective in reducing topsoil bulk densities resultingfrom loading under wet soil conditions.
Compaction and the surface structure of Brookston clay loam was studied by Stone (1987) byexamining the cumulative contribution of surface soil compaction to soil structural deterioration andits relationship to corn and soy bean productivity. Fall vehicle compaction of the surface soil at soilmoisture contents suitable for tillage did not significantly cause soil structural deterioration orlimitation of productivity for the two crops studied.
Irwin et al. (1987) performed analysis of tile drainage discharge data to evaluate a drainagecoefficient for Brookston clay soil. The probability of an annual drainage coefficient of 11.5 mm/daywas found to be 50%.
Larney et al. (1988) investigated the effects of subsurface drain spacing on the soil moistureregime of naturally poorly drained Clermont silt loam. The data indicated that a drain spacing of 20m resulted in a drier soil moisture regime than 40 m spacing, but was not substantially differentfrom 5 m or 10 m drain spacings.
3.2 Soil Compaction
Theories of soil compaction have been advanced for a number of years in the soil mechanicsdiscipline for civil engineering applications, such as road building, compacted earth fill dams andother earth structures.
The standard measure of soil compaction throughout the world is the Proctor density, named afterR.R. Proctor (1933). The American Society for Testing and Materials (ASTM) recognizes twostandards, known as the Standard Proctor and the Modified Proctor (respective ASTM designationsare: D 698 and D 1557). The compaction of any soil can be measured relative to these standards.
A representative sample of the soil whose field compaction is to be measured is mixed at differentmoisture contents (dry weight basis) and compacted with a standard energy in a standard mould.The moisture content (x-axis) is then plotted against dry density (y-axis). The resultant curve is

5
parabolic in shape. The dry density of the soil increases with increasing moisture content to a valueknown as the optimum moisture content.
At moisture contents in excess of the optimum, the dry density decreases. Proctor (1933) attributedthe shape of the moisture-density relationship curve to effects of capillarity at the lower moisturecontents and lubrication at moisture contents above the optimum.
Hogentogler (1936) advanced an alternative theory of soil compaction to that proposed by Proctorand named it the "viscous water theory". This theory stated that the first layer of water adsorbedon to the surface of the soil particle was more viscous than the second layer, and so on. At lowmoisture contents, the closely bound soil particles would offer greater resistance to compaction,whereas at the higher moisture contents the soil would shear readily due to lower viscosity of thewater between soil particles.
Lambe (1960) attempted to explain the shape of the moisture-density curve in terms of surfacechemical theories. As more water is added the electrolyte concentration decreases in the porewater, thus causing a general repulsion of clay mineral particles by the formation of stronger doublelayers.
Olson (1963) postulated an "effective stress" theory of soil compaction, basing it on principles bythen well developed in the field of soil mechanics.
In agricultural applications the effects of tillage and cultivation equipment on soil compaction havebeen reported by several researchers (Gill and Reaves, 1956; Soehne, 1958; Rao et al., 1960;Lyles and Woodruff, 1963; Van Doren et al., 1964; Arndt and Rose, 1966; Djokoto et al., 1970;Feldman and Domier, 1970; Soane, 1970; Barnes et al., 1971; Amir et al., 1976). The generalconsensus is that traffic from agricultural implements and equipment does affect crop growth andyield on several types of soils studied.
The measurement of soil compaction in agricultural applications has been by means ofpenetrometers of various design and complexity (Waelti et al., 1963; Freitag, 1968), and themeasurement of pore volume and porosity by oxygen diffusion and similar measurements (Lemonand Erickson, 1952).
Developments following WW II led to the refinement and production of nuclear devices formeasuring both soil moisture and in-situ dry or wet densities. This subject is discussed in moredetail later in this report.
3.3 Hydraulic Conductivity
The determination of hydraulic conductivity is an important factor in determination of soil drainagecharacteristics. Hydraulic conductivity can be empirically estimated from pore or grainsizedistribution of the soil. As yet, such methods do not appear to be universally reliable. Hence,hydraulic conductivity must be measured experimentally. The laboratory and field methods for

6
determining hydraulic conductivity are extensively reviewed in the literature (American Society ofAgricultural Engineers, 1962; Bouwer and Jackson, 1974; Daniel, 1989).
The auger hole test for hydraulic conductivity (Maasland and Haskey, 1958) is a widely usedprocedure. The single auger hole method has been used satisfactorily to determine hydraulicconductivity for the design of subsurface drains in Québec (Shady et al., 1976).
Unsaturated hydraulic conductivity of a tilled clay soil has been determined in Québec (Douglas etal., 1980). Field measurements of hydraulic conductivity have also been made by infiltrationthrough artificial crusts (Bouma et al., 1971) and by an internal drainage method (Hillel et al.,1972).The Guelph Permeameter (Reynolds and Elrick, 1985) provides a cost effective, easily portableand convenient method of measuring hydraulic conductivity in the field.
Measurements of field saturated hydraulic conductivity by the Guelph and velocity Permeametershave been compared by Kanwar et al. (1989). For selected test sites and conditions, bothpermeameters provided reasonably similar values. The field measured hydraulic conductivityvalues tended to be much lower than laboratory values.
A comparison has been made of field hydraulic conductivity on two Ohio Soils by Dorsey et al.(1989) using various techniques for such measurements in situ. The three techniques used werethe Guelph Permeameter, velocity permeameter and a pumping test method. The GuelphPermeameter, although convenient and easy to use, was found to produce lower permeabilityresults than the other techniques, on heavy clay soils.
It is important to note that even on fields that are considered homogeneous, localised variationsin hydraulic conductivity are common (Tabrizi and Skaggs, 1982).
3.4 Tile Drainage Formulae
Drain spacing equations generally describe the relationship between the physical characteristicsof the soil, depth and spacing of subsurface drains, and the fall of the water table at themid-spacing of the drains.
A number of such equations have been published. The more popular of these include Hooghoudt(1940); Guyon (1967); Kirkham (1958); Ernst (1956); Glover-Dumm (Dumm 1954, 1964); VanSchilfgaarde (1963, 1964); Bouwer and Van Schilfgaarde (1963); and Hammad (1962).
The Hooghoudt equation is quoted in the Ontario Drainage Guide, (Irwin, 1986) as the steady statedrain spacing formula which is the most widely accepted and often used in practice in Ontario.
A field comparison has been made of transient drain spacing equations in a southern Albertalacustrine soil (Buckland et al., 1987). The Bouwer and Van Schilfgaarde equation (IntegratedHooghoudt), using a C Factor of 1.0%, was found to most closely predict the measured
7
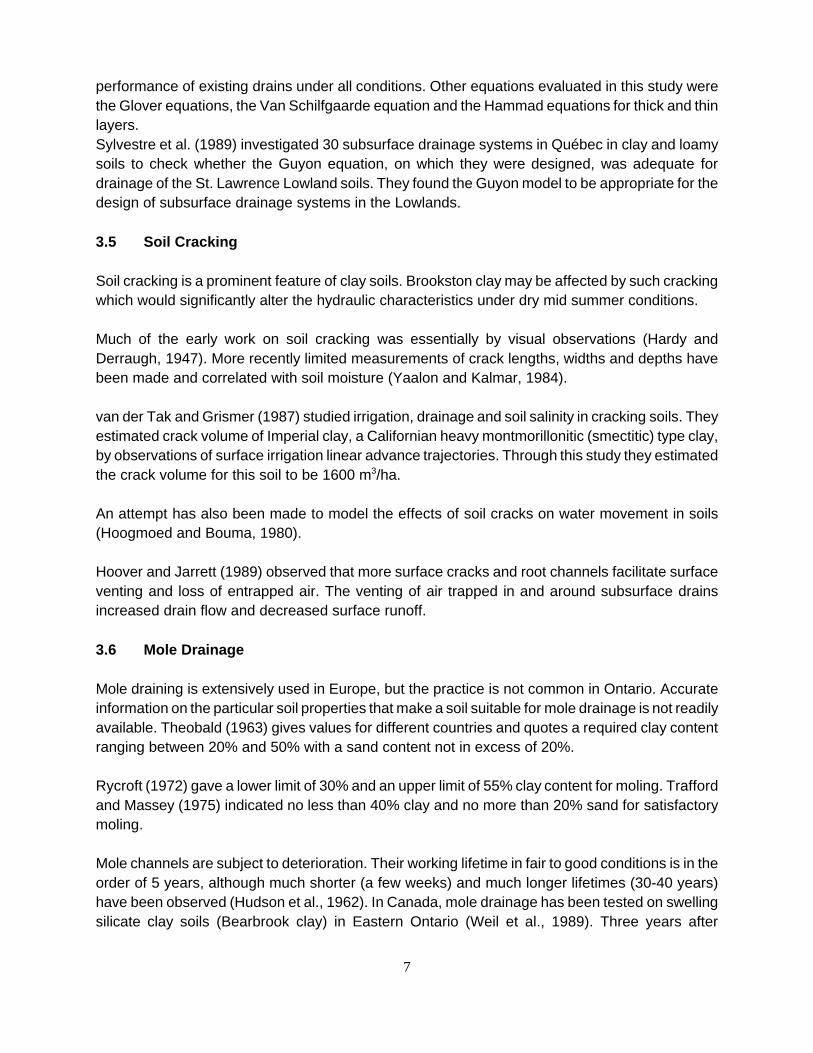
performance of existing drains under all conditions. Other equations evaluated in this study werethe Glover equations, the Van Schilfgaarde equation and the Hammad equations for thick and thinlayers.Sylvestre et al. (1989) investigated 30 subsurface drainage systems in Québec in clay and loamysoils to check whether the Guyon equation, on which they were designed, was adequate fordrainage of the St. Lawrence Lowland soils. They found the Guyon model to be appropriate for thedesign of subsurface drainage systems in the Lowlands.
3.5 Soil Cracking
Soil cracking is a prominent feature of clay soils. Brookston clay may be affected by such crackingwhich would significantly alter the hydraulic characteristics under dry mid summer conditions.
Much of the early work on soil cracking was essentially by visual observations (Hardy andDerraugh, 1947). More recently limited measurements of crack lengths, widths and depths havebeen made and correlated with soil moisture (Yaalon and Kalmar, 1984).
van der Tak and Grismer (1987) studied irrigation, drainage and soil salinity in cracking soils. Theyestimated crack volume of Imperial clay, a Californian heavy montmorillonitic (smectitic) type clay,by observations of surface irrigation linear advance trajectories. Through this study they estimatedthe crack volume for this soil to be 1600 m3/ha.
An attempt has also been made to model the effects of soil cracks on water movement in soils(Hoogmoed and Bouma, 1980).
Hoover and Jarrett (1989) observed that more surface cracks and root channels facilitate surfaceventing and loss of entrapped air. The venting of air trapped in and around subsurface drainsincreased drain flow and decreased surface runoff.
3.6 Mole Drainage
Mole draining is extensively used in Europe, but the practice is not common in Ontario. Accurateinformation on the particular soil properties that make a soil suitable for mole drainage is not readilyavailable. Theobald (1963) gives values for different countries and quotes a required clay contentranging between 20% and 50% with a sand content not in excess of 20%.
Rycroft (1972) gave a lower limit of 30% and an upper limit of 55% clay content for moling. Traffordand Massey (1975) indicated no less than 40% clay and no more than 20% sand for satisfactorymoling.
Mole channels are subject to deterioration. Their working lifetime in fair to good conditions is in theorder of 5 years, although much shorter (a few weeks) and much longer lifetimes (30-40 years)have been observed (Hudson et al., 1962). In Canada, mole drainage has been tested on swellingsilicate clay soils (Bearbrook clay) in Eastern Ontario (Weil et al., 1989). Three years after

8
installation, mole drains were found to have remained functioning and still open, with a fewexceptions. Freeze-thaw cycles did not appear to have a detrimental effect.
3.7 Soil Moisture Tension
Soil matric potential has been measured for a Clermont silt loam by Larney et al. (1988). Theyfound a general trend of increase in soil matric potential with increased distance from subsurfacedrains on this soil.
Kanwar (1989) investigated the effect of tillage systems on the variability of soil water tension andsoil water. More variability in the soil water tension data was observed within the same tillagesystem than among the four different tillage systems tested in the study. This conclusion suggestedthat the variability in the soil water tension data could easily overshadow the tillage induced effectson soil water tension.
4.0 SITE AND GEOLOGY4.1 Location
The site of all experimental work reported in this study was Essex County. The County is boundedby Lake St. Clair to the north, the Detroit River to the west and Lake Erie to the south. See FigureA4.l in the Appendix for location of the experimental farms.
The farms on which the current studies took place are all in the Stoney Point, Tilbury, and St.Joachim areas of northern Essex County.
4.2 Geology
Pleistocene geology has influenced the parent materials on which Essex County soil are formed.Unsorted stoney materials were laid down by the glaciers in this area. Considerable amounts ofcoarse sediment and outwash materials were deposited by ablation as the ice melted and the icefront retreated.
The bedrock underlying Essex County is mainly limestone of Devonian age. The drift over all theCounty contains considerable limestone as well as significant amounts of shale. Some igneousrock material is also present.
4.3 Soil
The soils of Essex County have been grouped on a textural basis (Ontario Ministry of Agricultureand Food, 1939). The distribution of heavy, medium and light textured soils in Essex County isshown in the Appendix in Figure A4.l, which illustrates their natural drainage characteristics.

9
Poorly drained soils occupy a considerable area of the County and consequently their managementis of extreme importance.
The current investigation was carried out on Brookston clay, a soil formed from lacustro-morainicmaterials and which exhibits poor natural drainage.
4.4 Drainage
Figure A4.2 in the Appendix is an outline map of the County illustrating the natural drainagesystem.
Essex County is predominantly flat in character with scattered sandy ridges and hillocks. A numberof small rivers and streams drain into the lakes and rivers which form the County boundaries.
The largest rivers in the area of this study are the Ruscom and the Belle which flow northward intoLake St. Clair.
Owing to the flat topography and the predominantly heavy textured soils, surface and subsurfacedrainage techniques are in extensive use throughout the study area in order to increaseproductivity. A number of farms have tile drain systems installed, many of which outlet into anetwork of open ditches and drainage canals which complement the County's natural streams andwatercourses.
5.0 STUDY METHODOLOGY5.1 Farm Selection 5.1.1 Selection Criteria
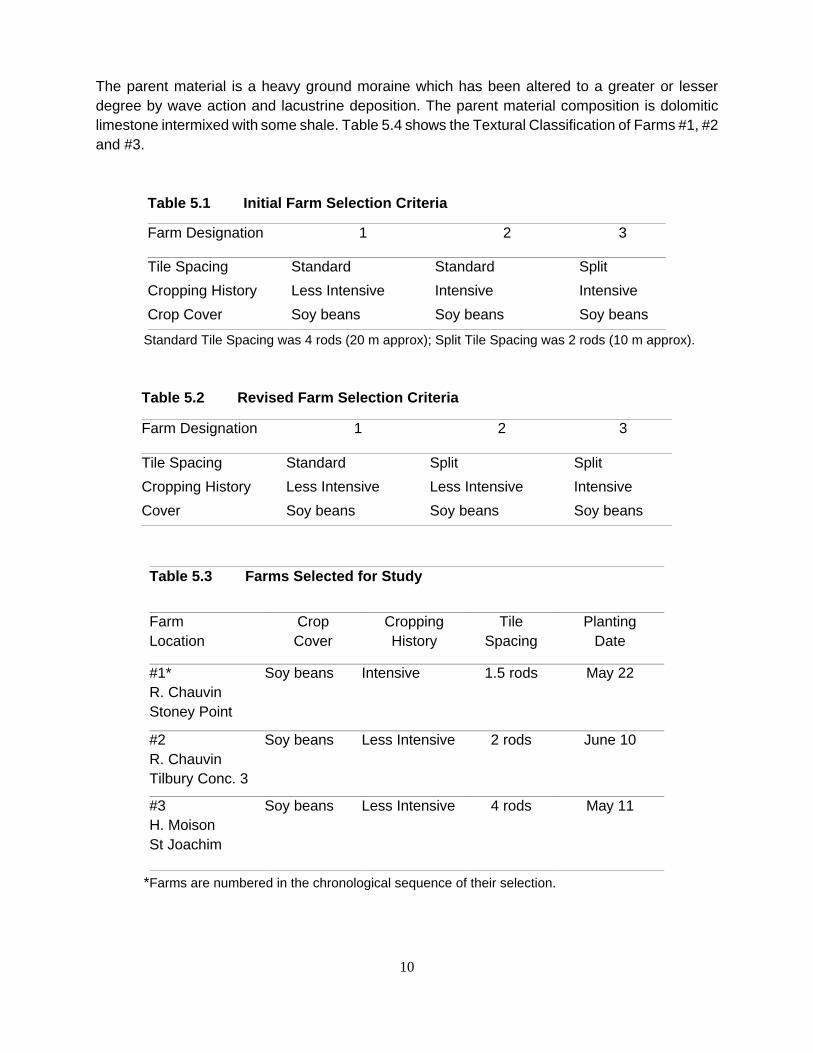
Criteria for experimental farm site selection were discussed and approved at a project start upmeeting at Harrow Research Station on 1989 05 31. Three farm site selections were agreed upon,with the criteria given in Table 5.l.
The criteria for intensive cropping was the presence on the experimental site of an intensive cashcrop (eg. tomatoes) the year before the study (i.e., 1988).
Due to difficulty in obtaining a farm site with standard tile spacing (4 rods) and intensive cropping(tomatoes) the originally approved criteria were modified as shown in Table 5.2.
Final farm selections and planting dates were as indicated in Table 5.3.
5.1.2 Soil Type & Crop
The soil type on each farm was Brookston clay loam (clayey, mixed mesic Typic Haplaquoll).TheBrookston series is part of the group of soils formed from Lacustro-Morainic material.
10
The parent material is a heavy ground moraine which has been altered to a greater or lesserdegree by wave action and lacustrine deposition. The parent material composition is dolomiticlimestone intermixed with some shale. Table 5.4 shows the Textural Classification of Farms #1, #2and #3.
Table 5.1 Initial Farm Selection Criteria
Farm Designation 1 2 3
Tile Spacing Standard Standard Split
Cropping History Less Intensive Intensive Intensive
Crop Cover Soy beans Soy beans Soy beans
Standard Tile Spacing was 4 rods (20 m approx); Split Tile Spacing was 2 rods (10 m approx).
Table 5.2 Revised Farm Selection Criteria
Farm Designation 1 2 3
Tile Spacing Standard Split Split
Cropping History Less Intensive Less Intensive Intensive
Cover Soy beans Soy beans Soy beans
Table 5.3 Farms Selected for Study
FarmLocation
CropCover
CroppingHistory
TileSpacing
PlantingDate
#1*R. ChauvinStoney Point
Soy beans Intensive 1.5 rods May 22
#2R. ChauvinTilbury Conc. 3
Soy beans Less Intensive 2 rods June 10
#3H. MoisonSt Joachim
Soy beans Less Intensive 4 rods May 11
*Farms are numbered in the chronological sequence of their selection.

11
Table 5.4 Textural Classification of Farms Selected for Study
Farm # Sand* % Silt% Clay% USDA Classification
1 25 40 35 Clay Loam
2 28 37 35 Clay Loam
3 29 38 33 Clay Loam
* Includes particles larger than 4.75 mm
On all three farms, the cover crop for the duration of the 1989 study was soy beans which, byagreement, was selected as the common index crop.
During the limited studies carried out on Farm #1 in 1990, the cover crop was winter wheat.
5.1.3 Cropping and Cultivation
Cropping histories previous to 1989 for each farm are shown in Table 5.5.
Table 5.5 Cropping Histories of Farms Studied
Farm # History Tile Spacing Rotation
1989 1988 1987 1986
1 Intensive 1.5 rods S T W S
2 Less Intensive 2 rods S S C C
3 Less Intensive 4 rods S C W S
S = Soy bean W = Wheat C = Corn T = Tomatoes
12
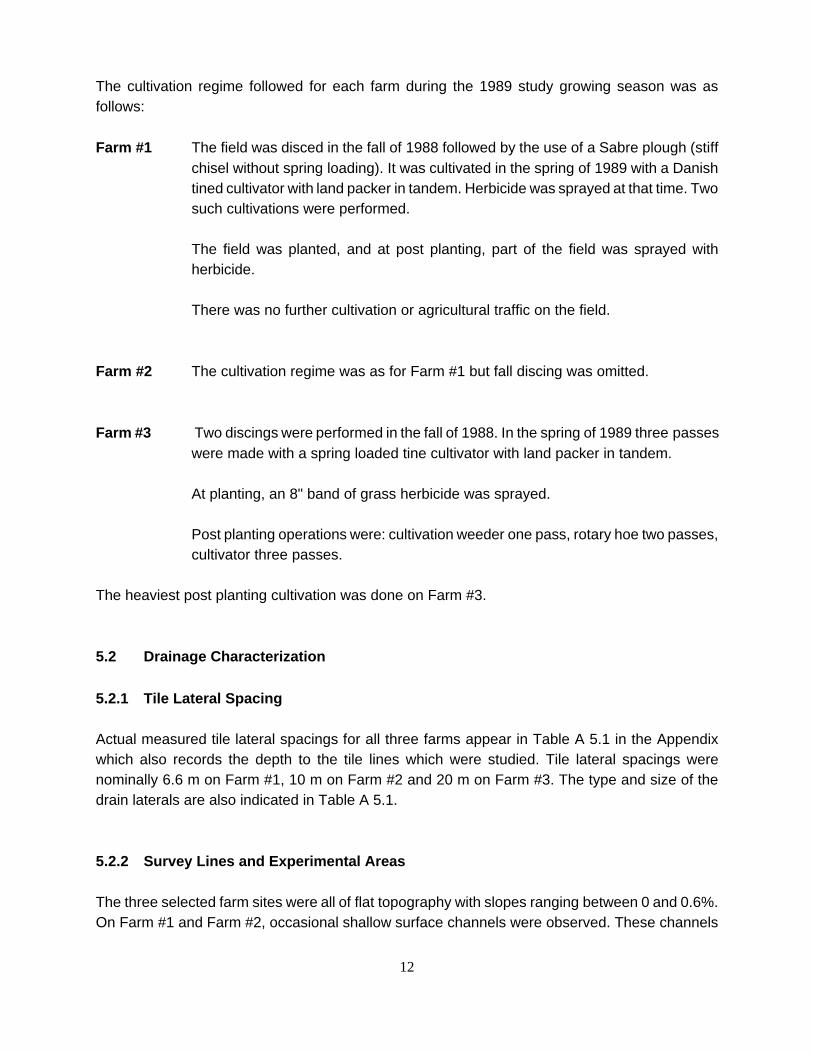
The cultivation regime followed for each farm during the 1989 study growing season was asfollows:
Farm #1 The field was disced in the fall of 1988 followed by the use of a Sabre plough (stiffchisel without spring loading). It was cultivated in the spring of 1989 with a Danishtined cultivator with land packer in tandem. Herbicide was sprayed at that time. Twosuch cultivations were performed.
The field was planted, and at post planting, part of the field was sprayed withherbicide.
There was no further cultivation or agricultural traffic on the field.
Farm #2 The cultivation regime was as for Farm #1 but fall discing was omitted.
Farm #3 Two discings were performed in the fall of 1988. In the spring of 1989 three passeswere made with a spring loaded tine cultivator with land packer in tandem.
At planting, an 8" band of grass herbicide was sprayed.
Post planting operations were: cultivation weeder one pass, rotary hoe two passes,cultivator three passes.
The heaviest post planting cultivation was done on Farm #3.
5.2 Drainage Characterization
5.2.1 Tile Lateral Spacing
Actual measured tile lateral spacings for all three farms appear in Table A 5.1 in the Appendixwhich also records the depth to the tile lines which were studied. Tile lateral spacings werenominally 6.6 m on Farm #1, 10 m on Farm #2 and 20 m on Farm #3. The type and size of thedrain laterals are also indicated in Table A 5.1.
5.2.2 Survey Lines and Experimental Areas
The three selected farm sites were all of flat topography with slopes ranging between 0 and 0.6%.On Farm #1 and Farm #2, occasional shallow surface channels were observed. These channels

13
would presumably drain localised wet spots. On Farm #3 none of these channels were present inthe vicinity of the experimental area.
On each farm, three adjacent tile laterals were located with individual outlets to a collector ditchrather than to a subsurface main. Two survey lines, designated SL1 and SL2, were laid out acrossthe three tile laterals so selected. The survey lines were chosen far enough from the edge of thefields to avoid boundary effects and the effect of machinery turning on headlands.
The distance of the first survey line was set at 15 m from the mid point of the collector drain onFarms #1 and #2, and 34 m on Farm #3. Ground elevations, land gradient and other similarmeasurements were made at each farm site and along the survey lines.
In 1990 a supplementary survey line SL3 was set out on Farm #1 at 5 m from the mid point of thecollector drain to cater for the study of moisture characteristics.
5.2.3 Site Mapping/Surveying
Surveys were made of the experimental areas to establish the location of the drainage laterals, totie in the survey lines in relation to the outlet ditches and to record other site features, such asgradients, roads, drainage structures and the like.
Plans of each 1989 experimental area are shown in the Appendix (Drawing Nos. S89257-A,S89257-B, S89275-C) along with the 1990 experimental area (Drawing No. S89257-D).
5.2.4 Laterals, Gradients
On each farm, levels were taken at every selected tile outlet and survey line for the three lateralsunder study. Using this information, gradients were computed for each tile line, and are given inTable A5.2 in the Appendix.
5.2.5 Piezometers
Piezometers were installed at each site in 1989, and on Farm #1 in 1990.
In 1989, on Farms #1 and #2, installation was completed on July 6 and 7, and on Farm #3 on July27. Installation was delayed on Farm #3 due to difficulty in the final selection of this farm.
The piezometers were installed in 100 mm diameter holes drilled to an average depth of 0.8 m to0.9 m below ground surface, and at least 100 mm below the invert level of the drain lateral.Extremely hard clay conditions (due to a preceding dry spell) made boring of the holes difficult,even with power auger equipment.

14
Each piezometer was nominal 1.5" (37.5 mm) diameter PVC pipe with the lowest 100 mm lengthbeing slotted and wrapped with geotextile fabric. These slotted standpipes were installed on a 25mm thick bed of coarse to medium sand placed at the bottom of each augered borehole which wasthen backfilled with medium sand to at least 100 mm above the level of the uppermost perforation(slot). A bentonite seal was placed over the backfilled sand for a minimum thickness of 100 mm.The seal was then hand-tamped into place, following which the remaining hole was backfilled withnative soil. The top of each piezometer pipe was taped to prevent direct entry of rain. The generalarrangement is shown in Sketch S89257-SK-1 in the Appendix.
The piezometers were installed across three tile lines along the two survey lines on each farmimmediately adjacent to, and also at the mid point of the tile lines.
A total of 10 piezometers was installed at each farm in 1989. The general arrangement of thesurvey lines and piezometers is shown on Drawings S89257-A, -B and -C in the Appendix.
On 1990/04/25, on Farm #1, four piezometers were installed across three tile lines along a newsurvey line, SL3, close to the collector drain. The arrangement of this group of piezometers isshown on Drawing S89257-D in the Appendix.
5.2.6 Tensiometers
On 1990 04 25, four Tensiometers (model 2725 Jet Fill, by Soil Moisture Equipment Corp.) wereinstalled along survey line SL3 on Farm #1 as shown on Drawing S89257-D.
Tensiometers T1, and T2 were installed at the mid point between two drain laterals while T3 and T4
were placed immediately adjacent to one lateral. T1 and T2 were installed 200 mm deep and T2 andT4 300 mm deep.
5.2.7 Rain Gauges
Rainfall information was collected on each site by the farmer cooperators. Simple, locally availablepoint rainfall type rain gauges were used on each site. These gauges have a nominal 125 mmcapacity and are typically suitable for ground or aerial post mounting. The gauges were located farenough away from buildings, trees, and other obstructions, in accordance with standard practice,to ensure accuracy of readings.
The accuracy of these gauges is ±2 mm. One such rain gauge was installed at Farm #2, whileexisting instrumentation was already present on Farms #1 and #3.
A new gauge was also installed in close proximity to the Tensiometers and Piezometers on surveyline SL3 for the studies in 1990.

15
5.3 In situ Measurements5.3.1 Nuclear Moisture-Density Meter
In situ moisture content and dry density measurements were made with a Troxler Model 3440Series Moisture-Density gauge. This instrument is designed to measure moisture content, densityand compaction of soils, aggregates, and asphalt. The instrument complies with ASTM StandardsD 2922, D 2950 and D 3017.
The Troxler Model 3440 has a single probe with a radioactive source at its tip and a detector in thebody of the gauge. Measurements are taken by inserting the probe into the soil and reading theamount of radioactivity reaching the detector at the surface.
The attenuation of mono-energetic gamma radiation passing through the soil is related to both bulkdensity and moisture content. These values are indicated on the instrument's digital type display.The instrument is factory calibrated. Further details on its principles of operation and use appearin the Appendix.
The effectiveness of the instrument for soil moisture and density measurements has beenevaluated by Gameda et al. (1987).
5.4 Field Studies5.4.1 Visits, Observations and Measurements
Visits were made to the project area for meetings, farm selection, installation of instrumentation,field measurements, collection of farmer cooperator data, and harvesting. A schedule of visitsmade, including the reason for each visit, is included in the Appendix.
During 1989 visual observations and measurements were made of crop height and water tablelevels in the piezometer standpipes at each field visit.
In 1990 measurements at two day intervals were made of water table levels and tensiometerreadings on Farm #1.
5.4.2 Precipitation
Precipitation data was collected by farmer cooperators and the recorded amounts were collectedby Strata personnel at monthly intervals.
5.4.3 In Situ Moisture-Density
Moisture content and density determinations with the Nuclear Moisture Density meter were madeat two depths, 100 mm (4") and 200 mm (8") along Survey Lines 1 and 2 on each farm.

16
These readings were taken at spatial intervals along each survey line of approximately 3.3 m onFarms #1 and #3, and 5 m on Farm #2. During 1990, moisture content and density determinationswere made along Survey line 3 on Farm #1 and also at two non cultivated control points on thisfarm.
5.4.4 Crop Condition and Growth
On each field visit in 1989, observations were made of crop growth and plant height. Plant heightwas measured from the soil surface to the top of the last fully developed leaf. Supplementaryinformation was obtained on crop condition through a crop specialist from the Stoney PointFarmers Cooperative. His report is reproduced in the Appendix.
5.4.5 Field Soil Sampling
Bulk soil samples were taken by hand along Survey Lines at each site corresponding to the depthand location of randomly selected individual Nuclear Moisture Density meter reading sites. Five orsix such samples were taken at each visit from each farm .
Bulk soil samples were also taken from each site for Proctor Density determinations.
In all cases, soil samples taken from the field were transferred to moisture proof plastic bags orcontainers, sealed and immediately transported to the laboratory for .further testing.
5.4.6 Hydraulic Conductivity Measurements
Hydraulic Conductivity measurements were made on Farm #1 only in 1989. The GuelphPermeameter was used. Four different locations were randomly selected in close proximity toSurvey Line 1 on Farm #1. Two sets of readings were taken at each of these locations, usingrecommended procedures for this permeameter.
In 1990, similar measurements were made on Farm #3 again at four random locations in closeproximity to the previous position of Survey line 1 on that farm. Two sets of readings were takenat each of these locations.
It was not possible to take hydraulic conductivity readings on Farm #2 because of a change intenancy of that farm.
5.4.7 Crop HarvestingHarvesting of the experimental areas had to be conducted to suit each farmer cooperator'sharvesting schedule. As a consequence, the three farm sites were harvested on different datesimmediately before or at the time of farmer harvest.

17
Farm #3 was harvested on 1989 09 28, and Farms #1 and #2 on 1989/10/02. On each farm, aswath 1 m wide was marked out along each survey line, covering the distance between three tilelines i.e. the swath covered the approximate length between the 5 piezometer installations on eachsurvey line.
In each case, all plants were hand harvested and the entire mass of harvested material weighedby a hand held hook type scale. The harvested material was threshed by a small plot harvester(Hege Model 125B) provided by the Harrow Research Station. Weights of threshed grain from eachexperimental area were taken and the grain was sent to Harrow Research Station for moisturecontent and further yield determinations.
At harvesting, all experimental equipment, stakes, and piezometer standpipes were removed.
5.4.8 Root Development
Individual soy bean plants along the survey lines at each farm site were carefully removed with soiland roots intact, for root development determinations in the laboratory.
5.4.9 Measurement of Soil Cracking
A simple but effective field method was devised to measure the volume of soil cracking in the upper0 to 200 mm of the soil on Farm #1. The method consisted of carefully removing a cylinder (300mm diameter, 200 mm deep) of soil sufficiently large to include cracks. This soil was then weighedimmediately in the field. Soil volume was determined by lining the resulting excavation with a thinplastic film pressed tightly against the side and bottom of the excavation. Water poured from ameasuring cylinder to the level of the original ground surface indicated the volume of the hole (orthe soil removed). The plastic liner and the contained water were carefully removed and weighedto verify the volume obtained by the measuring cylinder. Samples were taken from the cylinder ofexcavated soil for laboratory determinations of moisture content, porosity, bulk density and unitweights.
This procedure was performed at two locations near Survey Line 3 on Farm #1 in each of themonths of April, June, and July, 1990, to compare spring (non cracked) with summer (cracked) soilconditions.
5.5 Laboratory Studies5.5.1 Moisture Contents
Natural moisture content determinations were made on soil samples taken from the Survey Lineson each farm site. Portions of the samples were weighed, oven dried then weighed again forcomputation of gravimetric moisture content.

18
5.5.2 Atterberg Limits
Atterberg limit tests to determine the Liquid and Plastic Limits and Plasticity Index were performedin accordance with ASTM Standards D 423 and D 424. The results are plotted on Figure A6.1 inthe Appendix.
5.5.3 Densities and Specific Gravity
Laboratory density determinations were made on field samples for correlation with nuclearmoisture-density meter measurements. Density determinations were made on irregular shaped soilsamples using a wax coating method. Specific gravity determinations were also made for soilsamples at different depths (ASTM D 854).
Proctor Density tests were performed on the bulk soil samples obtained from each farm. BothStandard Proctor (25 blows per layer, 3 layers, 12.5 kg hammer) and a "Modified" method usingonly 10 blows per layer with the same hammer, were performed.
5.5.4 Root Development
Plant specimens collected from each farm were visually examined in the laboratory and rootlengths and diameters measured with calipers.
5.5.5 Soil Cracking
Laboratory observations were made of the commencement and extent of cracking of a crushed andsieved combined sample of soil from the farms. The soil was mixed to initial moisture contents inthe order of 35 - 50%, and allowed to cure in an enclosed plastic container for a week. The wet soilwas then placed in non-stick baking dishes to a thickness of 10 mm ± and allowed to air dry untilcracking occurred. After crack development ceased, the pan and soil were dried in an oven toconstant weight for determination of initial, intermediate, and final moisture contents. Photographsillustrating the laboratory experiments are included in the Appendix.

19
6.0 STUDY RESULTS
6.1 Approach and Expectations of Research
This study was conducted on farms, rather than on an experimental scale or in a controlledmanner, and as such, there was no control over treatments, eg. variety of crop grown,management, cultivation procedures, planting dates, and management practices. The dates ofharvesting were decided in each case by the farmer's harvesting schedule. All field experimentalequipment had to be removed at harvesting in order not to disrupt any of the farmer's fall tillageschedule. Consequently, post harvest information could not be obtained. Precipitation readingswere taken by the farmer at each site. On at least one date in 1989, there was no measurementof precipitation given on two farms, although visits to each site indicated measurable rainfall, basedon the observed wetness of the ground.
Experimental observations for the 1989 study commenced in the summer, well after seeding. Thus,observations of drainage characteristics, soil moisture, soil cracking, and the prevailinggroundwater conditions could not be made in the spring of 1989.
Limited information on late spring moisture characteristics was obtained in 1990 following anextension of the study. Piezometers and tensiometers were installed on Farm #1. Measurementsat two day intervals were taken of water levels and soil water tension. Moisture content, density andpreliminary soil cracking studies were also pursued. Rainfall recording was better organised toimprove the reliability of the data collected.
Bearing in mind the above, the approach taken in this study has been to measure as manyinteracting variables as possible within time and budget constraints, and to analyze these for trendsand relationships. These qualifications and limitations must therefore be factored into the researchresults and the conclusions reached.
6.2 Field Measurements6.2.1 Moisture Content Determinations
Moisture content values, as determined in the field during 1989 site visits using the Troxler NuclearGauge, are given in Table A6.1 in the Appendix. Values of moisture content on Farm #1 in 1990are reported in Table A6.2.
The moisture content values (Troxler) show considerable variation, no doubt related to differencesin precipitation over the study period. The values obtained in 1989 vary between 11.5% and 27.1%(all farms). Higher mean moisture contents were observed on Survey Line 1 for Farms #1 and #2but not on Farm #3 where the equivalent Survey Line was further from the drainage outlets.
The Troxler measured mean moisture content values are shown in Table 6.1.
20
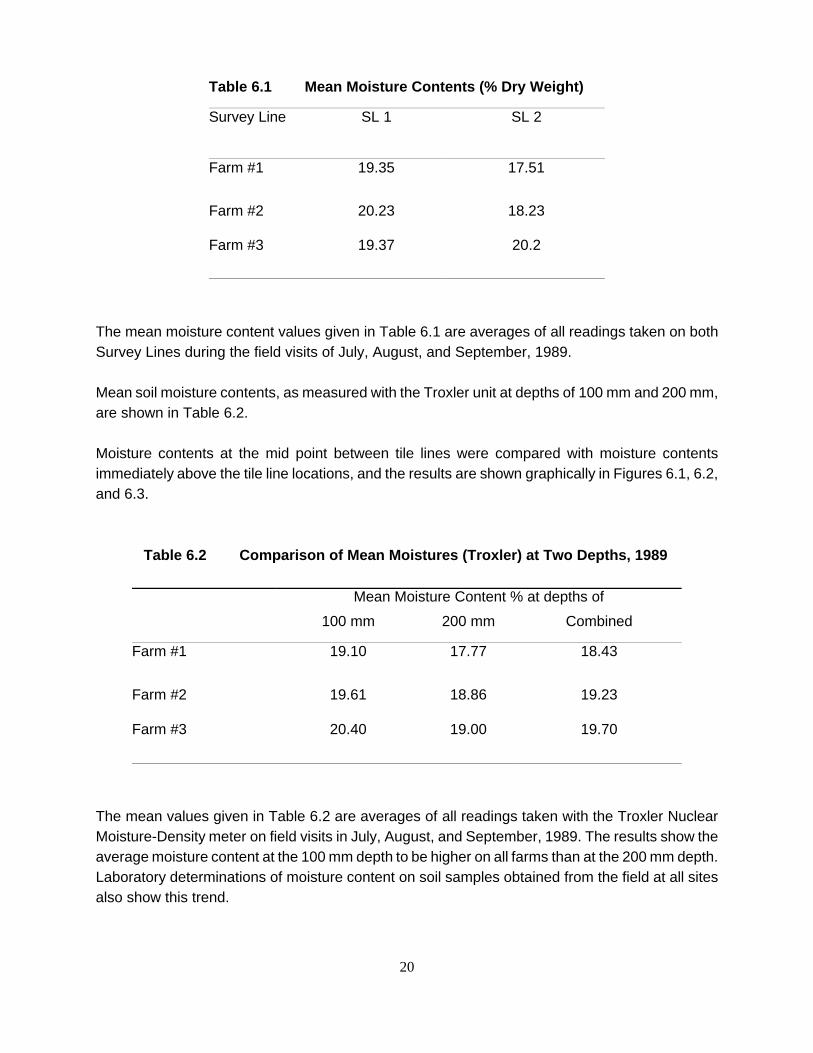
Table 6.1 Mean Moisture Contents (% Dry Weight)
Survey Line SL 1 SL 2
Farm #1 19.35 17.51
Farm #2 20.23 18.23
Farm #3 19.37 20.2
The mean moisture content values given in Table 6.1 are averages of all readings taken on bothSurvey Lines during the field visits of July, August, and September, 1989.
Mean soil moisture contents, as measured with the Troxler unit at depths of 100 mm and 200 mm,are shown in Table 6.2.
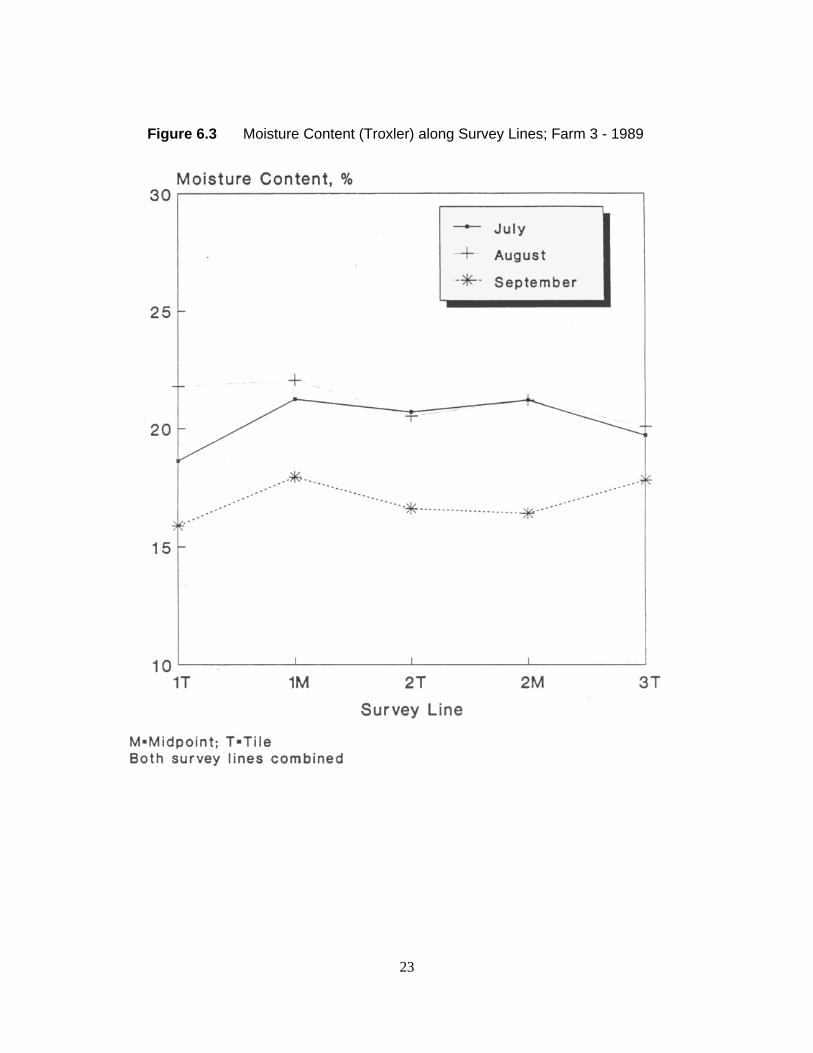
Moisture contents at the mid point between tile lines were compared with moisture contentsimmediately above the tile line locations, and the results are shown graphically in Figures 6.1, 6.2,and 6.3.
Table 6.2 Comparison of Mean Moistures (Troxler) at Two Depths, 1989
Mean Moisture Content % at depths of
100 mm 200 mm Combined
Farm #1 19.10 17.77 18.43
Farm #2 19.61 18.86 19.23
Farm #3 20.40 19.00 19.70
The mean values given in Table 6.2 are averages of all readings taken with the Troxler NuclearMoisture-Density meter on field visits in July, August, and September, 1989. The results show theaverage moisture content at the 100 mm depth to be higher on all farms than at the 200 mm depth.Laboratory determinations of moisture content on soil samples obtained from the field at all sitesalso show this trend.

21
Figure 6.1 Moisture Content (Troxler) along Survey Lines; Farm 1 - 1989

22
Figure 6.2 Moisture Content (Troxler) along Survey Lines; Farm 2 - 1989
23
Figure 6.3 Moisture Content (Troxler) along Survey Lines; Farm 3 - 1989

24
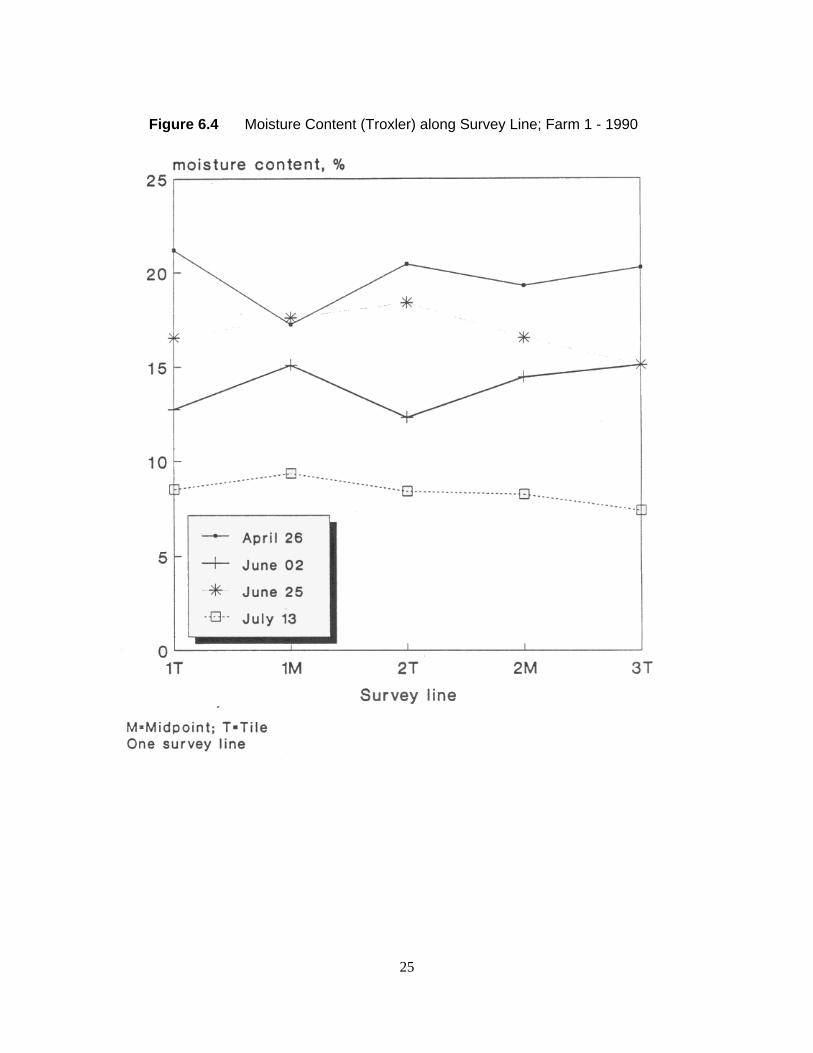
In 1990, Troxler measured mean moisture content readings on Farm #1 were 15.25% at 100 mmand 14.15% at 200 mm (combined mean value of 14.70%). These means were calculated fromreadings taken along Survey Line 3 (S.L.3) on field visits in April, June, and July of that year.
Moisture Content profiles for Farm #1 along Survey Line 3 in 1990 are shown on Figure 6.4.
6.2.2 Density Measurements
Troxler density measurements for all farms are reported in Table A6.3.
Density Measurements (Troxler) between Survey Lines were compared for each farm. The resultsare shown in Table 6.3.
On all farms the mean dry density was higher along Survey Line 1 than along Survey Line 2.
Troxler Mean Dry Densities were also compared at the 100 mm (4") and 200 mm (8") depths withresults as given in Table 6.4.
Table 6.3 Mean Dry Density (kg/m3 x 1000), 1989, by Survey Line
Farm # SL 1 SL 2 Combined Farm
1 1.45 1.36 1.41
2 1.46 1.45 1.46
3 1.50 1.45 1.48
Table 6.4 Mean Dry Density (kg/m3 x 1000), 1989, by Depth
100 mm 200 mm Combined Farm
Farm #1 1.36 1.45 1.41
Farm #2 1.42 1.49 1.46
Farm #3 1.43 l.53 1.48
25
Figure 6.4 Moisture Content (Troxler) along Survey Line; Farm 1 - 1990

26
Dry densities at the 200 mm depth are consistently higher on all farms than at the 100 mm depth.Dry densities were also highest on Farm #3 at 1480 kg/m3, and lowest on Farm #1 at 1410 kg/m3.
Troxler measurements of mean dry density in 1990 on Survey Line 3 on Farm #1 yielded valuesof 1385 kg/m3 and 1475 kg/m3 respectively at the 100 mm and 200 mm depths. The average forSurvey Line 3, based on all readings taken in 1990, was 1430 kg/m3. The field densitymeasurements are given in Table A6.2.
The trend of higher density at the 200 mm depth was again borne out by all 1990 measurements.Densities were also measured at non cultivated control points on the various field visits. These noncultivated control points had average dry densities of 1450 kg/m3 at the 100 mm depth and 1550kg/m3 at the 200 mm depth.
Figure 6.5 shows a density profile along Survey Line 3 on Farm #1 representative of densitymeasurements taken in April, June, and July, 1990.
Comparison of density differences over the tile locations and at the mid point between tiles werealso made. Averages of Troxler density measurements made in July, August and September 1989at the tiles and mid points are shown in Table 6.5.
Table 6.5 Mean Dry Density over Tiles and at Mid Points (kg/m3 x 1000), 1989
100 mm depthFarm #
200 mm depthFarm #
1 2 3 1 2 3
Over Tile 1.33 1.43 1.45 1.43 1.49 1.54
At Mid point 1.40 1.41 1.43 1.48 1.49 1.51
Farm #1 showed higher density at the mid point between tiles than over the tiles. Farms #2 and #3either have equal or higher densities over the tiles than at the mid point between tiles. There wastherefore no general trend of density measurements over the tile and at the mid point for thesefarms.
For all farms the average density at 100 mm was 1405 kg/m3 over the tile and 1413 kg/m3 at themid point. Correspondingly at 200 mm the average densities were 1489 kg/m3 and 1494 kg/m3 overtile and at mid point respectively.

27
Figure 6.5 Dry Density (Troxler) along Survey Line; Farm 1 - 1990

28
6.2.3 Groundwater Levels
Water levels were measured in each piezometer in 1989 on the dates shown below:
Farm #1 July 7, 13, 27, August 17, 31, September 24Farm #2 July 7, 13, 27, August 18, 31, September 25Farm #3 August 18, 30, September 24
These dates coincided with those on which in situ Troxler measurements were made of density andmoisture, and when bulk soil samples were taken from each site. The piezometer readings indicatethat water levels were generally below tile drain invert levels during the period of study.
On 1989/07/27, significant rainfall (50 mm to 62.5 mm) on the day before and the day of fieldmeasurement yielded water level readings in the piezometers at or close to ground level on Farm#1 and #2. No measurements were possible on Farm #3 on that date as piezometer installationswere still being completed. On 1989/08/30, measurable water levels were observed on Farm #3after a total of 37.5 mm of rain had fallen on the farm on 1989/08/28 and 1989/08/29. Groundwaterlevels were found to be between 0.69 m and 0.78 m below ground surface or at approximately tileinvert level.
Results of 1989 piezometers water level observations appear in Table A6.4. Precipitation datareported by farmer cooperators is given in Table A6.5.
Late spring and summer 1990 water levels were measured in the piezometers installed on Farm#1. The results of these observations are given in Table A6.6.
Figure 6.6 is a graphical representation of piezometer water levels in relation to rainfall recorded.Figure 6.7 shows the water level profile at tiles and mid points in the spring of 1990.
6.2.4 Soil Cracking
Visual observations were made of soil cracking which was very evident at all experimental sites.Photographs were taken in typical areas (see Appendix). Little in the way of measurement of soilcracking was carried out in 1989.
Observations on Farm #1 in late April, 1990, showed minimal evidence of soil cracking. Somehairline cracks were present and crack depths of the order of 25-30 mm were noted at laboratorydetermined field moisture contents between 27% and 29%.
In June and July of the same year (1990) crack depths on the same farm varied from a low of 125mm to 450 mm+, while crack widths up to 40 mm were quite common. This striking crackdevelopment occurred at laboratory determined field moisture contents ranging between 12% and18%.

29
Figure 6.6 Farm 1: Comparison of Rainfall & Groundwater Elevations 1990

30
Figure 6.7 Farm 1: Water Levels in Piezometers at tiles and midpoints - 1990
31
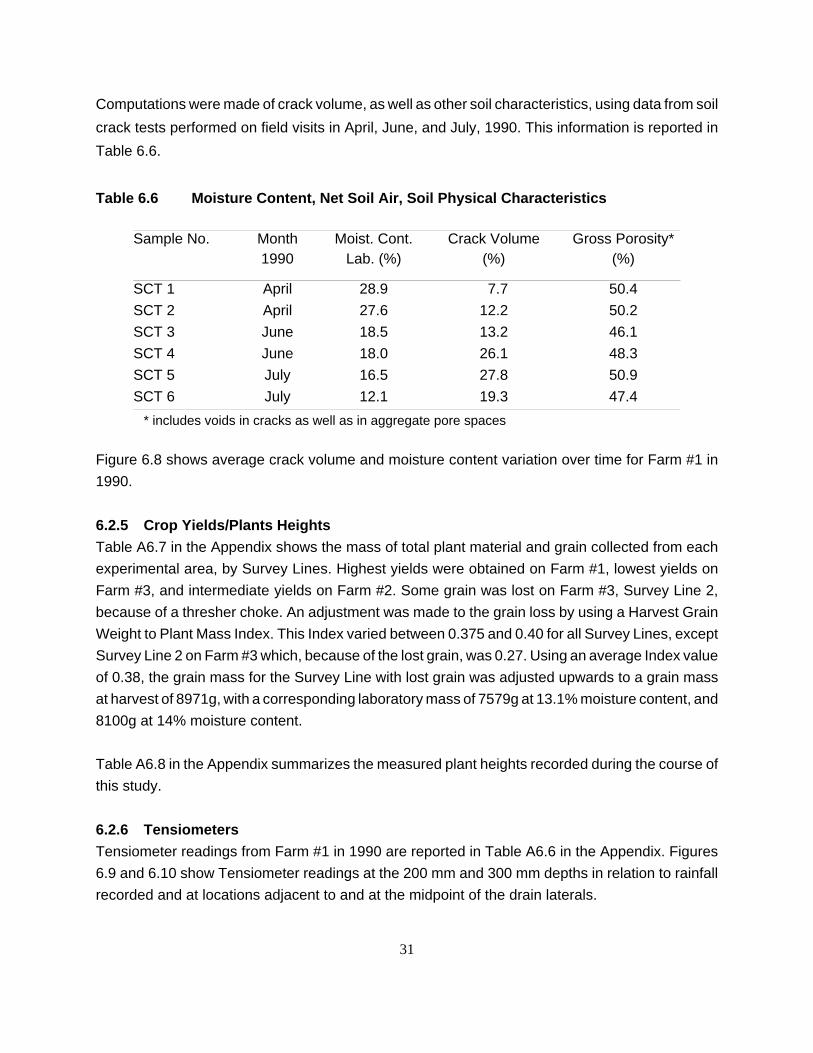
Computations were made of crack volume, as well as other soil characteristics, using data from soilcrack tests performed on field visits in April, June, and July, 1990. This information is reported inTable 6.6.
Table 6.6 Moisture Content, Net Soil Air, Soil Physical Characteristics
Sample No. Month1990
Moist. Cont.Lab. (%)
Crack Volume(%)
Gross Porosity*(%)
SCT 1 April 28.9 7.7 50.4SCT 2 April 27.6 12.2 50.2SCT 3 June 18.5 13.2 46.1SCT 4 June 18.0 26.1 48.3SCT 5 July 16.5 27.8 50.9SCT 6 July 12.1 19.3 47.4
* includes voids in cracks as well as in aggregate pore spaces
Figure 6.8 shows average crack volume and moisture content variation over time for Farm #1 in1990.
6.2.5 Crop Yields/Plants HeightsTable A6.7 in the Appendix shows the mass of total plant material and grain collected from eachexperimental area, by Survey Lines. Highest yields were obtained on Farm #1, lowest yields onFarm #3, and intermediate yields on Farm #2. Some grain was lost on Farm #3, Survey Line 2,because of a thresher choke. An adjustment was made to the grain loss by using a Harvest GrainWeight to Plant Mass Index. This Index varied between 0.375 and 0.40 for all Survey Lines, exceptSurvey Line 2 on Farm #3 which, because of the lost grain, was 0.27. Using an average Index valueof 0.38, the grain mass for the Survey Line with lost grain was adjusted upwards to a grain massat harvest of 8971g, with a corresponding laboratory mass of 7579g at 13.1% moisture content, and8100g at 14% moisture content.
Table A6.8 in the Appendix summarizes the measured plant heights recorded during the course ofthis study.
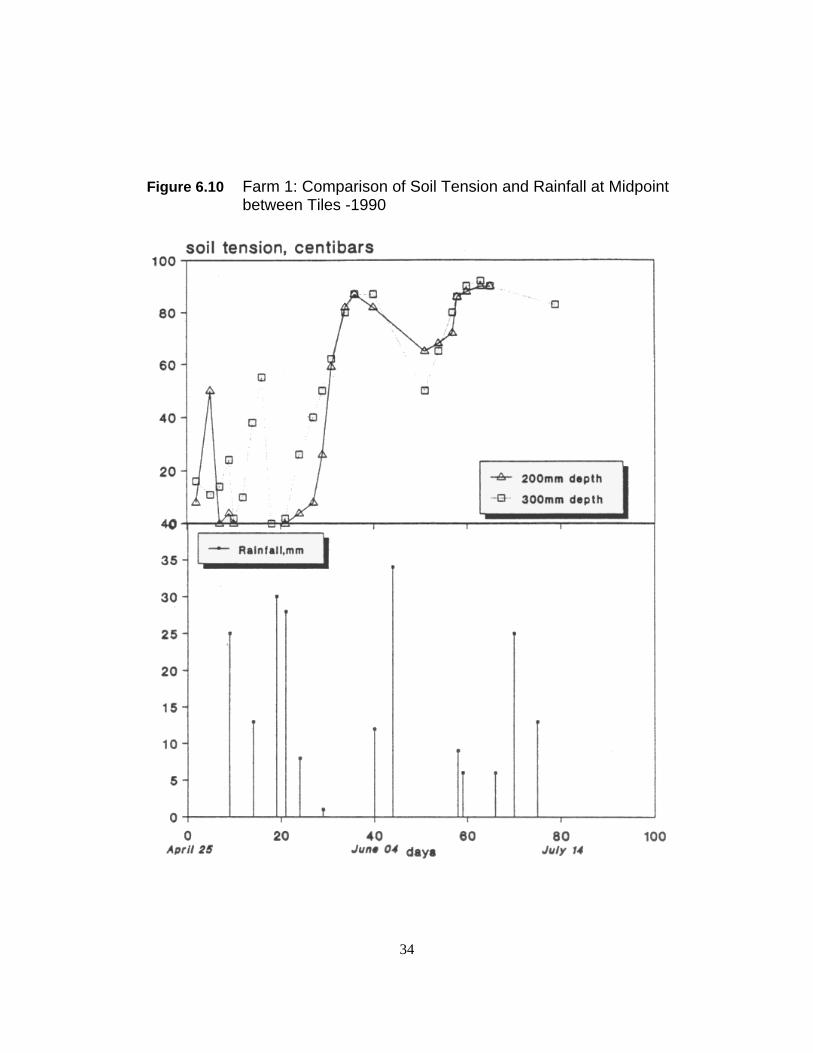
6.2.6 TensiometersTensiometer readings from Farm #1 in 1990 are reported in Table A6.6 in the Appendix. Figures6.9 and 6.10 show Tensiometer readings at the 200 mm and 300 mm depths in relation to rainfallrecorded and at locations adjacent to and at the midpoint of the drain laterals.

32
Figure 6.8 1990: Time Variation of Farm Average Crack Volume andMoisture Content (Lab)

33
Figure 6.9 Farm 1: Comparison of Soil Tension and Rainfall at Tile Location -1990
34
Figure 6.10 Farm 1: Comparison of Soil Tension and Rainfall at Midpointbetween Tiles -1990

35
6.2.7 Hydraulic Conductivity
The hydraulic conductivity value obtained from the measurements made on Farm #1 in August,1989, was 1.78 x 10⁻⁶ m/sec. This value was obtained by assuming log-normal distribution ofhydraulic conductivity measurements at four locations with a standard deviation of 2.93.
On Farm #3, in July 1990, Guelph Permeameter measurements yielded an average hydraulicconductivity value of 2.78 x 10⁻⁶ m/sec.
A computation of hydraulic conductivity on Farm #1 was made using water level data from the fourpiezometers installed on this farm in the spring of 1990. The Hvorslev (1949) slug test method wasused to calculate the hydraulic conductivity. The average value obtained under these more saturatedsoil conditions was 8.8 x 10⁻⁹ m/sec.
6.3 Laboratory Tests6.3.1 Moisture, Density, Shrinkage
Moisture content, density, and soil shrinkage results of field bulk samples tested in the laboratoryin 1989 are given in Table A6.9 in the Appendix. Troxler and laboratory determined values formoisture and density are given in Table A6.10.
Similarly, shrinkage data for 1990 measurements on Farm #1, appear in Table A6.11.
6.3.2 Densities and Compaction
The soil Atterberg limits are shown in Table A6.12 and Fig. A6.1 in the Appendix. Density andspecific gravity information appear in Table A6.13. Laboratory Proctor density test results are givenin Table A6.14. It will be noted that the optimum moisture content is very close to the plastic limit ofthe soil, an observation well known in soil mechanics for most clay type soils.
6.3.3 Root Growth
The results of measurement of root characteristics of randomly selected healthy plant specimenson each site are reported in Table 6.7.
6.3.4 Harvest Yields
Table A6.7 in the Appendix shows grain yields in kg/ha adjusted to 14% moisture content based ongrain mass and moisture contents provided by Harrow Research Station. The average farm yieldsare given in Table 6.8.

36
Table 6.7 Root Measurements, 1989.
Farm No. Maximum RootDiameter (mm)
Root Length(mm)
PenetrationDepth (mm)
1 6.9 112 96 2 5.9 117 108 3 6.1 103 96
Note: Measurements reported above are mean values from four plant specimens (two along eachsurvey line) on each farm. Penetration depth is the vertical projection from ground surfacelevel to the tip of the main plant root.
Table 6.8 Average Farm Yields
Farm No. Yield (kg/ha) Remarks
1 3545
2 2820 3 1355
1625(unadjusted)
(adjusted for loss)
6.3.5 Soil Cracking
The photographs in the Appendix show development of soil cracking as simulated under laboratoryconditions. The crack patterns are very similar to those observed in the field, and of a similar sizein plan.
These laboratory experiments were not a part of this research study, but were attemptednonetheless for future possible studies into soil cracking. In-house research work will be continued,using student surplus help, as and when available to the Firm.

37
7.0 DISCUSSION OF RESULTS
7.1 Study Approach
A number of relationships between interacting variables are developed for discussion purposes.Comments are also made on drainage effectiveness on the three sites and on the reliability ofTroxler nuclear measurements of soil moisture and density by in-situ techniques.
It should be recognized that the relationships discussed below are based on regression analysesfrom field observations and laboratory tests. In some cases, the number of data points is so low thatany inference as to validity of the conclusions indicated in this report must be tempered accordingly.Wherever possible, the discussion reflects this limitation.
7.2 Relationships7.2.1 Moisture Density-Compaction
Table 7.1 shows the average optimum moisture contents obtained from the Proctor tests.
Table 7.1 Average Optimum Moisture Contents (%)*
Farm No. Standard Proctor(25 blows)
"Modified" Proctor(10 blows)
1 20.1 22.1
3 19.3 20.5
Composite 18.5 20.0
* Obtained from Proctor Tests
The moisture-density relationship is given for most soils by a parabolic curve (convex side up),indicating increasing density with increasing moisture content to a maximum value for that particularsoil and for the particular energy of compaction used. By definition, the optimum moisture contentis that moisture content at which the particular soil achieves its maximum density under a givenenergy of compactive effort. As compaction energy increases, the optimum moisture contentdecreases, while the dry density increases. Thus, the parabolic curve moves upwards and to the leftof the moisture (x-axis) vs. dry density (y-axis) plot with increasing energy of compaction.
The results of Table 7.1 show the optimum moisture content of the Brookston soil to be about 20%.The number of blows (25 or 10) applied with a standard 2.5 kg hammer reflects the energy levelsused in compacting the soil.
38
In the above case, a "Modified"1 compaction energy (10 blows applied to each of 3 layers, with a 2.5kg hammer freely falling 305 mm), lower than that used in the Standard Proctor Test (25 blows perlayer), has also been applied, since farm equipment induced compaction energy levels are felt tobe much lower than those used in civil construction works.
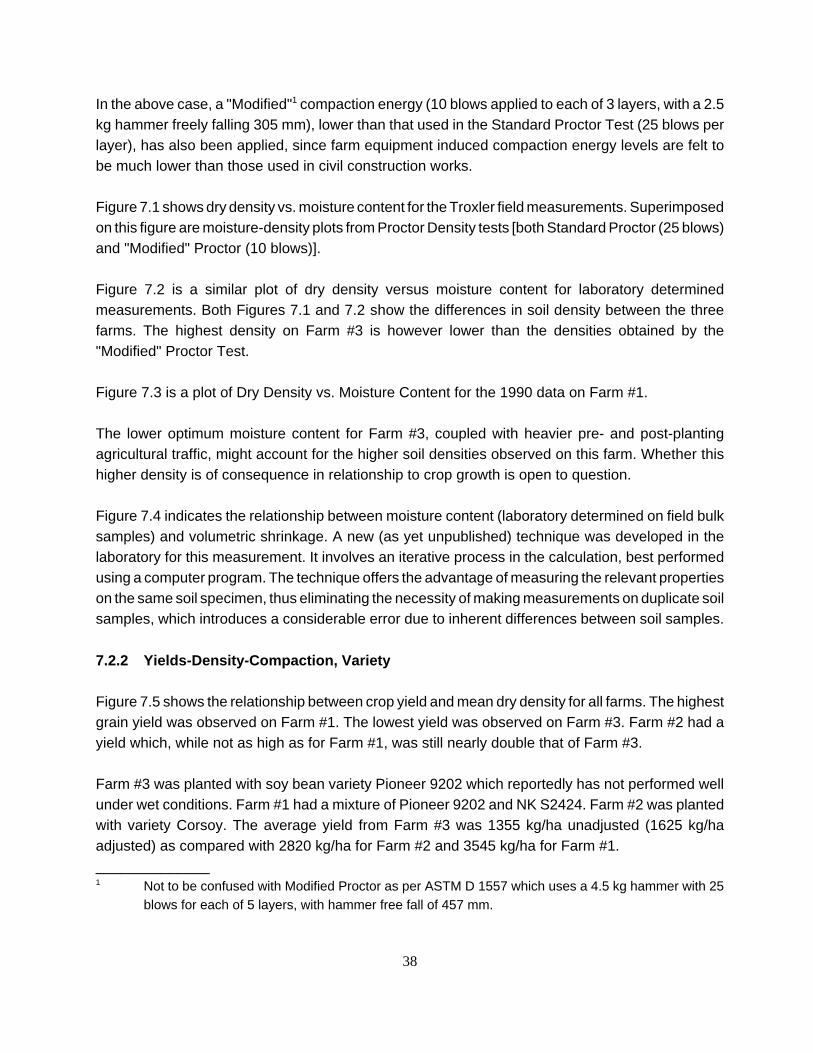
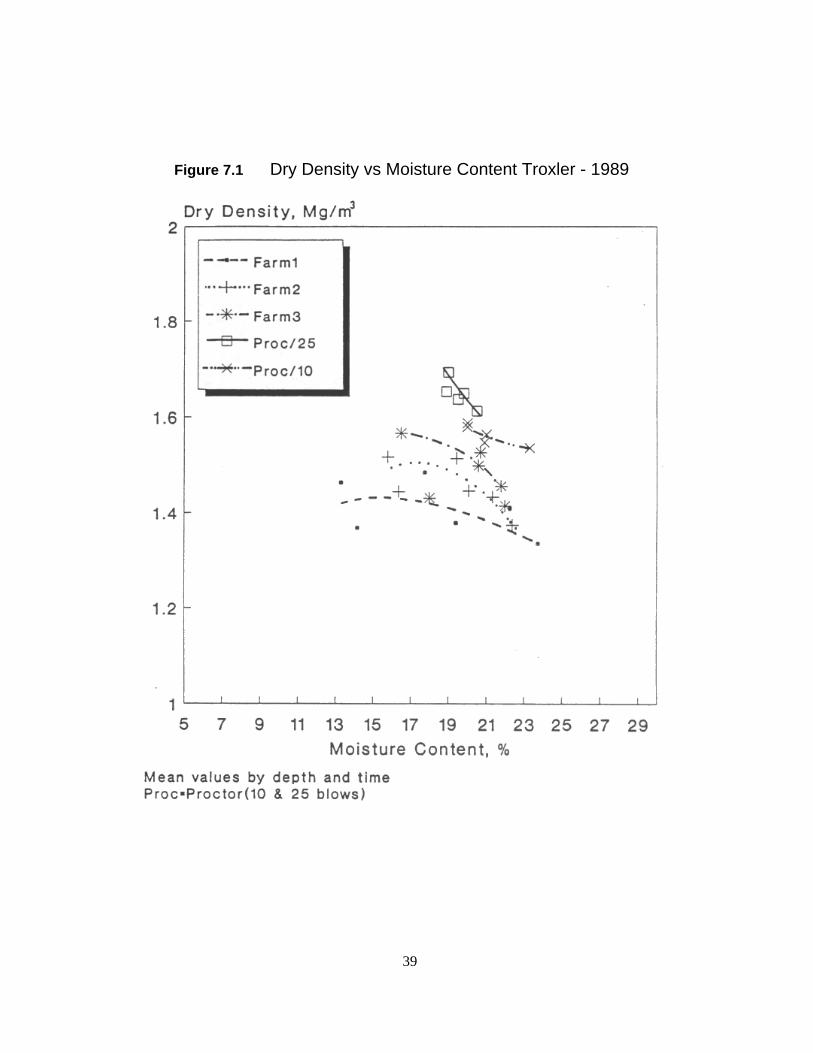
Figure 7.1 shows dry density vs. moisture content for the Troxler field measurements. Superimposedon this figure are moisture-density plots from Proctor Density tests [both Standard Proctor (25 blows)and "Modified" Proctor (10 blows)].
Figure 7.2 is a similar plot of dry density versus moisture content for laboratory determinedmeasurements. Both Figures 7.1 and 7.2 show the differences in soil density between the threefarms. The highest density on Farm #3 is however lower than the densities obtained by the"Modified" Proctor Test.
Figure 7.3 is a plot of Dry Density vs. Moisture Content for the 1990 data on Farm #1.
The lower optimum moisture content for Farm #3, coupled with heavier pre- and post-plantingagricultural traffic, might account for the higher soil densities observed on this farm. Whether thishigher density is of consequence in relationship to crop growth is open to question.
Figure 7.4 indicates the relationship between moisture content (laboratory determined on field bulksamples) and volumetric shrinkage. A new (as yet unpublished) technique was developed in thelaboratory for this measurement. It involves an iterative process in the calculation, best performedusing a computer program. The technique offers the advantage of measuring the relevant propertieson the same soil specimen, thus eliminating the necessity of making measurements on duplicate soilsamples, which introduces a considerable error due to inherent differences between soil samples.
7.2.2 Yields-Density-Compaction, Variety
Figure 7.5 shows the relationship between crop yield and mean dry density for all farms. The highestgrain yield was observed on Farm #1. The lowest yield was observed on Farm #3. Farm #2 had ayield which, while not as high as for Farm #1, was still nearly double that of Farm #3.
Farm #3 was planted with soy bean variety Pioneer 9202 which reportedly has not performed wellunder wet conditions. Farm #1 had a mixture of Pioneer 9202 and NK S2424. Farm #2 was plantedwith variety Corsoy. The average yield from Farm #3 was 1355 kg/ha unadjusted (1625 kg/haadjusted) as compared with 2820 kg/ha for Farm #2 and 3545 kg/ha for Farm #1.______________1 Not to be confused with Modified Proctor as per ASTM D 1557 which uses a 4.5 kg hammer with 25
blows for each of 5 layers, with hammer free fall of 457 mm.
39
Figure 7.1 Dry Density vs Moisture Content Troxler - 1989

40
Figure 7.2 Dry Density vs Moisture Content Laboratory - 1989

41
Figure 7.3 Farm 1: Laboratory 1990. Dry Density vs Moisture Content

42
Figure 7.4 Shrinkage vs Moisture Content - Laboratory 1989 (all farms) &1990 (farm 1)

43
Figure 7.5 Yield vs Mean Dry Density Farms 1, 2,3.
44
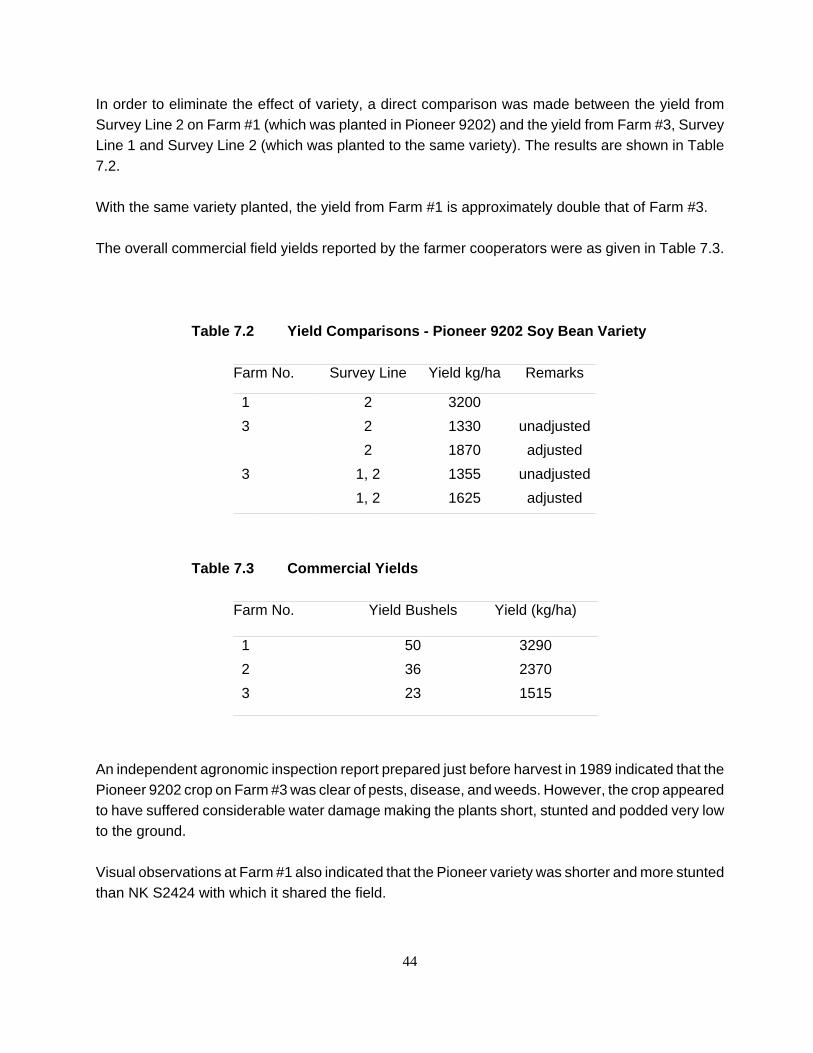
In order to eliminate the effect of variety, a direct comparison was made between the yield fromSurvey Line 2 on Farm #1 (which was planted in Pioneer 9202) and the yield from Farm #3, SurveyLine 1 and Survey Line 2 (which was planted to the same variety). The results are shown in Table7.2.
With the same variety planted, the yield from Farm #1 is approximately double that of Farm #3.
The overall commercial field yields reported by the farmer cooperators were as given in Table 7.3.
Table 7.2 Yield Comparisons - Pioneer 9202 Soy Bean Variety
Farm No. Survey Line Yield kg/ha Remarks
1 2 3200 3 2 1330 unadjusted
2 1870 adjusted 3 1, 2 1355 unadjusted
1, 2 1625 adjusted
Table 7.3 Commercial Yields
Farm No. Yield Bushels Yield (kg/ha)
1 50 3290 2 36 2370 3 23 1515
An independent agronomic inspection report prepared just before harvest in 1989 indicated that thePioneer 9202 crop on Farm #3 was clear of pests, disease, and weeds. However, the crop appearedto have suffered considerable water damage making the plants short, stunted and podded very lowto the ground.
Visual observations at Farm #1 also indicated that the Pioneer variety was shorter and more stuntedthan NK S2424 with which it shared the field.
45
It appears that even allowing for variations in rainfall, management, and cultivation practices, thedifference in yield between Pioneer 9202 on Farm #1 and Farm #3 is considerable and significant.
It may be that the large differences in measured yield of this variety at the two experimental locationsis a direct result of the efficiency of the respective drainage systems. Less water damage occurredon the farm with the narrower lateral spacing (Farm 1). This statement is made without the benefitof observation of the moisture regime during and immediately after seeding in late May, 1989. Inaddition, record rainfall was received in Essex County in July, 1989.
In such a wet growing season it would be expected that better results would be obtained from aheavily drained farm.
7.2.3 Yields - Tile Spacing, Plant Height
Figure 7.6 shows Farm Yields and Tile Spacing. The best yield was obtained on the farm with theleast lateral spacing (Farm #1).
Tile spacing and mean plant height at harvest are shown on Figure 7.7. The decrease in plant heightwith the increase in tile spacing may be the result of the more heavily drained farms having bettersoil water characteristics, resulting in taller, more vigorous, and better yielding plants, even afterallowing for varietal, cultivation, and crop management differences.
7.2.4 Yields - Cropping History/Cultivation/Plant Height
From the limited observations made on this project there appears to be no reduction in yield withintensive cropping (tomatoes) in the rotation. In fact, the highest yields were obtained on the farmwith the most intensive treatment. It should be noted also that post planting cultivation on both Farms#1 and #2 was virtually nil.
Both pre- and post-planting cultivation on Farm #3 was greater than on Farms #1 and #2. Soildensities on this farm were found to be marginally higher than on the others but this may not besignificant in crop development.
7.2.5 Moisture - Precipitation - Water Levels
The rainfall data collected by farmer cooperators in 1989 must be considered somewhat unreliablebased on observations made by Strata personnel. In addition, the infrequent readings of piezometricwater levels did not allow appropriate conclusions to be made about water table levels and theefficiency of the drainage systems on the three farms. It was not possible therefore to arrive at anymeaningful relationships with these variables in that year.

46
Figure 7.6 Yield vs Tile Spacing Farms 1, 2, 3

47
Figure 7.7 Plant Height vs Tile Spacing Farms 1, 2, 3

48
In 1990, water levels above tile drain elevations were only measurable in late spring. As seen fromFigure 6.7, rainfall in early June, 1990, of as much as 35 mm, was insufficient to raise thegroundwater levels above the tile drain invert levels. In fact, the water table remained below the draininverts up to the end of experimentation in mid-July, 1990, when all piezometers had to be removedto allow harvesting of the crop.
7.2.6 Root Growth Measurements
The root growth measurements reported in Table 6.5 were not used to infer any relationships withother parameters.
Major root development appeared to be concentrated in the top 125 mm of soil in all cases. It wasconsidered that larger numbers of plant specimens would have to be measured in order to producedata which would be meaningful. This time consuming option was discarded in favour of themeasurement of other variables such as crop yield and plant height.
7.2.7 Troxler Data Reliability
The Troxler nuclear meter was extensively used to obtain field measurements of density andmoisture content on all sites.
The Troxler readings were compared with laboratory determined moisture contents and densitiesof samples taken from the same location and nominal depth.
The data from field observations and laboratory tests are shown in Figures 7.8, 7.9 and 7.10. Thefollowing trends are worthy of note:
1. Laboratory determined densities are generally higher than those measured with the TroxlerUnit (Figures 7.8 and 7.10);
2. Laboratory determined moisture contents are also generally higher than Troxler values(Figures 7.9 and 7.10);
3. At Farm #1, the Troxler moisture contents on uncultivated control areas are generally closerin value to laboratory determined moisture contents than to those on cultivated farm land(Figure 7.9);
4. Troxler measured dry density in the spring seems to be more representative of laboratorydetermined densities than those measured in the summer (Figure 7.8);
5. Despite variations from laboratory determined values, Troxler measurements show similartrends and are therefore representative of relative changes in measured values. Figures 7.1and 7.2 show moisture-density data (both Troxler and laboratory determined) for all Farms,and illustrate this conclusion.

49
Figure 7.8 Farm 1: Dry Density Laboratory vs Troxler - 1990

50
Figure 7.9 Farm 1: Moisture Content Laboratory vs Troxler - 1990

51
Figure 7.10 1990: Farm Means of Dry Density and Moisture Content; Troxlerand Laboratory

52
It appears that Troxler densities in the summer are influenced by the incidence of soil cracks andmacropores to a much greater extent than laboratory measurements which are performed onaggregate samples.
Statistical correlations of Troxler and laboratory measurements were not made as these would haveto be specific to each site and seasonal period. Sufficient laboratory tests were carried out andcompared with Troxler readings to ascertain that the latter measurements could be used for makingvalid comparisons of densities and moisture contents.
7.2.8 Soil Crack Measurements and Shrinkage
Figure 7.11 shows a relationship between dry density and crack volume from data collected in 1990on Farm #1. This plot shows a trend towards increasing soil density as crack volume increases. Itshould be noted that the density in each case is laboratory determined from aggregates.
Figure 7.12 shows a similar plot of crack volume against laboratory determined moisture content.As expected, this relationship shows increasing crack volume with decreasing moisture content.Figure 7.13 shows the change in dry density due to shrinkage as affected by initial soil moisturecontent.
In general these relationships show the following trends:
1. Shrinkage of the soil due to moisture loss leads to increasing soil cracking;2. Dry density changes appear to be marked at moisture contents ranging between 28% and
16% and reduce thereafter. It would be assumed that the majority of crack developmentwould take place within this moisture content range.
7.3 Drainage Effectiveness
The depth and spacing of tile laterals at the three farm sites were examined for compliance with therecommendations in the Ontario Drainage Guide (Irwin, 1986). Brookston clay is described in theDrainage Guide as having a finer textured B horizon varying from 600-900 mm in depth whichinhibits drainage. Drains should be installed in the B horizon for best results.
Recommended drain spacing in the Guide for this soil type and profile, for cash crops, is 6 m to 15m, and for small grains and forage crops, 12 m to 20 m. The recommended tile drain depth is 600mm to 700 mm. Surface drains are recommended as being necessary. The recommended DrainageCoefficients are 9 mm/24 hr for improved forage and general grain crops and 12 mm/24 hr for cashcrops. Minimum recommended grades for laterals in the OMAF Guide vary between 0.05% forsmooth 100 mm diameter pipe and 0.08% for corrugated 100 mm diameter pipe. These gradientsapply to drains not subject to sediment accumulation.

53
Figure 7.11 Aggregate Dry Density(Laboratory) vs Crack Volume (Field) -1990

54
Figure 7.12 April to July 1990: Crack Volume vs Laboratory Moisture Content

55
Figure 7.13 Change in Dry Density due to Shrinkage vs Initial MoistureContent: Lab 1990

56
The three farms had average depths, spacings and gradients of tile drains as shown in Table 7.4for the areas studied.
Farm #3, with the widest lateral spacing, is marginally outside the Drainage Guiderecommendations.
The measured gradients were quite variable, even on the same farm. On Farm #1, a negativegradient was detected on the more recently laid plastic pipe. This may well be inaccurate sinceplastic tubing will deform by approximately 10% and the distance from the soil surface to the top ofthe pipe was used in the gradient computation.
Table 7.4 Depths, Spacings and Gradients of Laterals
Farm No AverageDepth(mm)
AverageSpacing
(m) Lateral
AverageGradient (%)*
1 2** 3**
1 625 6.5 0.47 negative negative
2 667 10.5 0.15 0.82 0.00
3 750 21.1 0.79 0.14 0.53
* Plastic drains, Laterals 2 and 3, Farm #1 only.** Measured between Survey Line outlet only.
On Farm #2, there was no gradient detected on one of the laterals. In all other cases, gradientsequalled or exceeded the minimum recommended in the OMAF Guide.
7.4 Significance of Results
Mean moisture contents have been used in some relationships. It is considered that the relativelysmall difference between farms of the means of field measured moisture contents, is not significantbecause of precipitation differences, the inherent error in such determinations, and the variability andrange of measured moisture contents (from 11.5% to 27.1%).
Analysis of variance was applied to the means of moisture contents for the measurements made inJuly, August and September, 1989, on the three farms. No significant differences were foundbetween the means, reinforcing the above conclusion.

57
The same technique was applied to mean dry density measurements (Troxler) made in July, August,and September, 1989, on each farm. The farm means were 1.41, 1.45 and 1.48 Mg/m3 for Farms#1, #2 and #3 respectively. A significant difference was found between the means of Farms #2 and#1 and between Farms #3 and #1, but not between Farms #2 and #3. The density data used in thisanalysis were themselves averages of readings taken on monthly field visits along the survey lines,and with a variability range of 1.2 - 1.6 Mg/m3
8.0 OBSERVATIONSIt is difficult to draw conclusions within the limitations of a survey type study conducted underuncontrolled conditions, and with comparisons made only between three farms. This is particularlyso where these farms had different cropping practices, management, tillage, planting dates andvarieties.
Certain trends have been observed in this study, and these will have to be validated by furtherexperimentation or data collection. The information listed below is not necessarily in order ofimportance.
1. Considerable yield differences were noted between the study farms. It is not possible toclearly link these yield differences with tile spacing and/or crop rotation because of farmconditions, soy bean variety, planting date and other management factors. In addition theseyield differences were observed in an atypical growing season when record rainfall occurredin the study area in July 1989.
2. There was no significant increase in density in the top 200 mm of soil on Farm #1 which hadtomatoes in its rotation. In fact, mean dry densities on this farm were lower than on the otherfarms. Stone (1987), working on Brookston clay loam with corn and soybean crops observedno increasing trend in bulk density to a depth of 250 mm, over a three year period after thissoil was subjected to fall and spring compaction. He suggested that the absence of acumulative increase in bulk density over the duration of his study indicated that if the soilstructure is indeed detrimentally affected by surface compaction, this is occurring only slowly.The observed densities on Farm #1 would tend to bear out the above conclusion.
3. A soil moisture content of 19.5%± presents optimum conditions for soil compaction on allthree farms, as measured by Standard Proctor tests. "Modified" (lower energy) Proctor Testsindicate that significant compaction can occur at moisture contents up to 23%. Soil moisturecontents at harvest below these values therefore results in a reduction of compaction byharvesters and trailed equipment. Stone (1987) working on Brookston clay loam hassuggested moisture contents suitable for tillage falling in the range between 20.9% and27.6%. When moisture is at the upper end of this range, agricultural traffic should be lessharmful to soil structure. It is recognised that at moisture contents beyond the tillage range

58
and up to the Liquid Limit (i.e. 28% up to 40%±), traction problems, wheel slip and smearingwill rise in proportion to any soil moisture increase.
4. The highest average soil density was measured on the farm with the widest tile drain lateralspacing. The lowest density was observed on the farm with the narrowest tile drain lateralspacing. Intermediate soil density was observed on the farm with intermediate tile drainspacing. All densities were below those obtained in Standard (25 blows) and "Modified" (10blows) Proctor tests and were not excessive. Higher densities were observed at the 200 mmdepth than at the 100 mm depth at all farm sites.
5. For the sites studied, no marked difference was observed when comparisons were made ofsurface soil density immediately over the tile and in the region between the laterals. Therewould therefore be no particular benefit in limiting agricultural traffic to specific regions in thefield based on tile location and any associated density differences.
6. The groundwater was below tile drain invert level during most of the summer and early fallof 1989, despite it being a wet growing season. This trend was also noted in the summer of1990.
7. Rains of 25 mm ± in the summer are frequently insufficient to raise water levels above tiledrain level. Subsurface drains are therefore considered to be largely non functional duringthe summer months.
8. Observations indicate extensive cracking of the soil during dry months. These cracks wouldserve to conduct rain water downward into the soil profile and to drain tile invert levelsrelatively quickly. Limited measurements show cracks can take up to 25% of the volume ofthe upper 200 mm of surface soil during mid summer.
9. Differences in hydraulic conductivity have been noted under spring (saturated) and summer(unsaturated) conditions. Piezometer calculations indicate a hydraulic conductivity of 4.7 -9.2 x 10⁻⁹ m/sec in the spring. Guelph Permeameter measurements indicate hydraulicconductivities in the range of 1.8-2.8 x 10⁻⁶ m/sec in the summer. In addition to the differencein degree of saturation, extensive cracking in the upper levels of the soil profile probablycontributes to the significantly higher hydraulic conductivities observed under dry conditions.
10. Farms #1 and #2 both have tile drain spacings which fall within the Drainage System criteriafor Brookston clay as set out in the Drainage Guide for Ontario. Farm #3 is drainedmarginally outside these guidelines. Some of the tile drains on Farms #1 and #2 appear tobe installed with doubtful gradients. In so stating, it is recognised that gradientmeasurements were made on these sites over relatively short distances. Over longerdistances, the average gradients may be quite satisfactory. In addition, deformation of plasticdrain tubing would affect the gradient computations on Farm #1.

59
11. Laboratory studies show a definite relationship between shrinkage and moisture content.Analysis of this relationship indicates that at higher moisture contents, a greater degree ofshrinkage can be expected. The studies would seem to indicate that for wetter initial soilconditions, a greater degree of soil cracking could be expected upon drying than for a soilwith low initial moisture content. This hypothesis should be field tested.
9.0 RECOMMENDATIONS
The recommendations given below are based on the results obtained from this study and thetentative conclusions reached.
1. Trends have been observed towards lower soil densities and higher yields on farms withmore closely spaced laterals. Based on the limited nature of the study, these trends appearto be independent of intensive cropping in the rotation. These trends need to be confirmedor negated by controlled plot type or farm scale experiments before such a conclusion canbe defended.
2. Controlled experiments are required to test the efficacy of tile drain blockage.
Indications are that soil cracking alters the hydraulic characteristics of the soil. Such crackstend to promote quick downward movement of rain water to tile drain level. Water table levelsalso appear to be consistently below tile drain invert level during the summer.
Rainfall therefore appears to be removed from a field before it can uniformly wet the soilprofile, due to rapid transport of water through soil cracks and macropores into subsurfacedrainage or to levels below the drain system. This observation tends to be borne out bycontinued high soil tension readings during the summer even after significant measurablerainfall.
Dissolved agricultural chemicals may quickly find their way into collection ditches and naturalwatercourses after large summer rainfall events. At such times there may be a case forcontrolling the outflow from tile drains. Such a practice would help improve soil moistureretention and reduce nutrient or pesticide discharge.
Field relationships between crack volume, soil moisture and hydraulic conductivity (van derTak and Grismer, 1987) should be studied in greater detail. Such a study would improve theirrigation-drainage management of Brookston clay soils.

60
For example, soil profile wetting and leaching might be improved by frequent irrigation whencracks are deep enough to enhance water application uniformity and soil aeration but not sodeep as to limit the wetting and leaching of the root zone.
3. Limited information has been obtained on natural water levels under late spring conditions.Further information on water characteristics, including hydraulic conductivity, should beobtained for this soil at a number of locations.
4. Mole drainage may be an alternative treatment which could be considered for these soils ofhigh clay content and plasticity. Mole drain trials are therefore recommended for these soils.
5. A study of the County with Brookston clay soil should be conducted at the macro level toobtain data on existing tile drain spacing and crop yields. This should be basically aninformation gathering exercise. Statistical treatment of the data, from about 50 to 60 farmsites, should suppress varietal and other differences and may yield an indication of theeffectiveness of different tile drain spacings.
6. Measurements of the optimum moisture content for compaction on Brookston clay loam(based on Proctor density tests) indicate that traffic on this soil should be avoided at moisturecontents between 19% and 23%. From field observations made in this study, the majority ofharvesting traffic occurs at moisture contents below those quoted above. Compaction effectsof harvesting equipment for intensive crops, eg. tomatoes, should therefore be minimal,except in "wet" harvesting years. Measured soil densities at depths down to 200 mm on theexperimental sites do not appear to be excessive. Densities at depths greater than 200 mmwere not measured. It is possible that these subsoil densities could have an effect on cropyields, for crops with roots penetrating such depths. This therefore represents an area forfurther study.

61
10.0 CLOSURE
Strata Engineering Corporation gratefully acknowledges the cooperation and assistance of Dr. W.Findlay of Agricultural Canada, Harrow Research Station. Important inputs and advice were alsoprovided by Messrs. David Charlton and George Schell of Ecological Services for Planning Ltd.,Guelph.
Farmer cooperators, Messrs. Robert Chauvin and Hermas Moison of Essex County are thanked forproviding the experimental sites and for collecting rainfall data.
The assistance of OMAF personnel, and in particular Mr. Ed Tomacek, in supplying farmer's namesfor site selection, is gratefully recognized.
Respectfully Submitted:STRATA ENGINEERING CORPORATION
M. J. Percy, P.Eng. C. Mirza, P.Eng.Project Leader Project Manager


62
11.0 REFERENCES CITED
American Society of Agricultural Engineers. 1962. Measuring saturated hydraulic conductivityof soils. ASAE, St. Joseph, Mich.
Amir, I., Raghavan, G. S. V., McKyes, E. and Broughton, R.S. 1976. Soil compaction as a functionof contact pressure and soil moisture content. Can. Agr. Eng. 18 (1): 54-57.
Arndt, W. and Rose, C.W. 1966. Traffic compaction of soil and tillage requirements. J. Agr. Eng.Res. 11(3): 170-187.
Barnes, K. K., Carleton, W. M., Taylor, H. M., Throckmorton, R. I. and Vandenberg, G. E. 1971.Compaction of agricultural soils. Trans. Amer. Soc. Agr. Eng. pp:30-37, 190-198.
Bilanski, W. K. and Varma R. K. 1976. Effect of bulk density and moisture tension on corn shootgrowth. Trans. Amer. Soc. Agr. Eng. 19 (2): 337-340.
Bolton, E. F. and Aylesworth, J. W. 1959. Effect of tillage traffic on certain physical properties andcrop yields on a Brookston clay soil. Can. J. Soil Sci. 39 (2): 98-102.
Bouma, J., Hillel, D. I., Hole F. D., and Amerman, C. R. 1971. Field measurement of unsaturatedhydraulic conductivity by infiltration through artificial crusts. Soil Sci. Amer. Proc. 35 (2): 362-364.
Bouwer, H. and Van Schilfgaarde, J. 1963. Simplified method of predicting fall of water table indrained land. Trans. Amer. Soc. Agr. Eng. 6 (4): 288-291, 296.
Bouwer, H. and Jackson, R. D. 1974. Determining soil properties. Drainage for Agriculture ASAMonograph 17. J. Van Schilfgaarde (Ed), Amer. Soc. Agronomy.
Buckland, G. D., Sommerfeldt, T. G. and Harker, D. B. 1987. A field Comparison of TransientDrain Spacing Equations in a Southern Alberta Lacustrine Soil. Trans. Amer. Soc. Agr. Eng. 30(1):137-142.
Daniel, D. E. 1989. In situ hydraulic conductivity tests for compacted clay. J. Geotechnical Eng. Div.Amer. Soc. Civil Eng. 115 (9): 1205-1226.
Djokoto, I.K., Bigsby, F. W., and Lai, R. 1971. Soil compaction by agricultural land packers andmodels. Can. Agr. Eng. 13 (2):46-50.
Dorsey, J. D., Ward, A. and Fausey, N. 1989. A comparison of field hydraulic conductivitymeasurement techniques on two Ohio soils. Paper No. 892190. ASAE/CSAE International Meeting,Québec, Canada.
Douglas, E., McKyes, E., Taylor, F., Negi, S. and Raghavan, G. S. V. 1980. Unsaturatedhydraulic conductivity of a tilled clay soil. Can. Agr. Eng. 22 (2): 153-161.

63
Dumm, L. D. 1964. Transient flow concept in subsurface drainage: Its validity and use. Trans. Amer.Soc. Agr. Eng. 7 (2): 142-146, 151.
Ernst, L. F. 1956. Calculation of the steady flow of groundwater in vertical cross sections.Netherlands J. Agr. Sci. 4: 126-131.
Feldman, M. and Domier, K. W. 1970. Wheel traffic effects on soil compaction and growth of wheat.Can. Agr. Eng. 12 (1): 8-11.
Freitag, D. R. 1968. Penetration tests for soil measurements. Trans. Amer. Soc. Agr. Eng. 11 (6):750-753.
Gameda, S., Raghavan, G. S. V., McKyes, E. and Theriault, R. 1985. A review of subsoilcompaction and crop response. Proc. Int. Conf. on Soil Dynamics. Auburn, Alabama, 5: 970-978.
__________. 1987. Subsoil compaction in a clay soil: I. Cumulative effects. Soils & TillageResearch. 10: 113-122.
__________. 1987. Single and dual probes for soil density measurement. Trans. Amer. Soc. Agr.Eng. 30 (4): 932-934, 944.
Gill, R. and Reaves, C. A. 1956. Compaction patterns of smooth rubber tires. Agr. Eng. 37:637-680, 684.
Guyon, G. 1967. Considerations sur l'hydraulique du drainage des nappes. Bull. Tech du GenieRural No. 70, Antony, France.
Hammad, H. Y. 1962. Depth and spacing of tile drain systems. J. Irrigation and Drainage Div., Amer.Soc. Civil Eng. 88: 15-34.
Hardy, F. and Derraugh, L. F. 1947. The water and air relations of some Trinidad sugar-cane soils.Tropical Agriculture, 24: 76-87.
Hillel, D., Krentos V. D., and Styllianou, Y. 1972. Procedure and test of an internal drainagemethod for measuring soil hydraulic characteristics in situ. Soil Sci. 114 (5): 395-400.
Hogentogler, C. A. 1936. Essentials of soil compaction. Proc. Highway Res. Board, National Res.Council, Washington, D.C., pp: 309-316.
Hooghoudt, S. B. 1940. Bijdragen tot de kennis van enige natuurkundige grootheden van de grond,No. 7. Versl. Landbouwk, Onderz, 46: 515-707.
Hoogmoed, W. B. and Bouma, J. 1980. A simulation model for predicting infiltration into crackedclay soil. J. Soil Sci. Soc. Amer. 44: 458-461.
64
Hoover, J. R. and Jarrett, A. R. 1989. Field evaluation of shallow subsurface drains to vent soil air,improve infiltration, and reduce runoff. Trans. Amer. Soc. Agr. Eng. 32 (4): 1358-1364.
Hudson, A. W., Hopenwell, H. G., Bowler, D. G. and Cross, M. W. 1962. The Draining of FarmLands. Massey Agricultural College, University of New Zealand. Palmerston. 2nd. Rev. Ed., 319 pp.
Hvorslev, M. J. 1949. Subsurface Exploration and Sampling of Soil for Civil Engineering Purposes.The Engineering Foundation, New York, N.Y. 521 p.
Irwin, R. W. 1986. Drainage Guide for Ontario. Ontario Ministry of Agriculture and Food, Publication29. Published by Information Branch OMAF, Legislative Building, Toronto.
Irwin, R. W., Bryant, G. J., Toombs, M. R. and Stone, J. A. 1987. Evaluation of a drainagecoefficient for Brookston clay soil. Trans. Amer. Soc. Agr. Eng. 30 (5): 1343-1346.
Jamison, V. C., Weaver, H. A. and Reed, I. F. 1950. Distribution of tractor tire compaction effectsin Cecil clay. Proc. Soil Sci. Soc. Amer. 15: 34-37.
Kanwar, R. S. 1989. Effect of tillage systems on the variability of soil water tensions and soil watercontent. Trans. Amer. Soc. Agr. Eng. 32 (2): 605-610.
Kanwar, R. S., Rizvi, H. A., Ahmed, M. and Horton, R. 1989. Measurement of field saturatedhydraulic conductivity by using Guelph and Velocity permeameters. Trans. Amer. Soc. Agr. Eng. 32(6): 1885-1890.
Kirkham, D. 1958. Seepage of steady rainfall through soil into drains. Trans. Amer. GeophysicalUnion, 39: 892-908.
Lambe, T. W. 1960. Structure of compacted clay. Trans. Amer. Soc. Civil Eng. 125: 682-705.
Larney, F. J., Kladivko, E. J. and Monke, E. J. 1988. Subsurface drain spacing effects on soilmoisture regime of Clermont silt loam. Trans. Amer. Soc. Agr. Eng. 31 (4): 1128-1134.
Lemon, E. R. and Erickson, A. E. 1952. The measurement of oxygen diffusion in the soil with aplatinum microelectrode. Proc. Soil Sci. Soc. Amer. 16: 160-164.
Lyles, L. and Woodruff, N. P. 1963. Effects of moisture and soil packers on consolidation andcloddiness of soil. Trans. Amer. Soc. Agr. Eng. 6: 273-275.
Maasland, M. and Haskey, H. C. 1958. The auger hole method of measuring the hydraulicconductivity of soil and its application to tile drainage problems. Paper presented at InternationalCommission on Irrigation and Drainage. Third Congress, San Francisco, California.
McKyes, E., Negi, S., Douglas, E., Taylor, F. and Raghavan, G. S. V. 1979. The effect ofmachinery traffic and tillage operations on the physical properties of a clay and on yield of silagecorn. J. Agr. Eng. Res. 24: 143-148.
65
Negi, S., McKyes, E., Taylor, F., Douglas, E. and Raghavan, G. S. V. 1980. Crop performanceas affected by traffic and tillage in clay soil. Amer. Soc. Agr. Eng. Trans. 23 (6): 1364-1368.
Olson, R. W. 1963. Effective stress theory of soil compaction. J. Soil Mechanics and FoundationsDiv. Amer. Soc. Civil Eng. 89 (SM 2): 27-45.
Ontario Ministry of Agriculture and Food. 1939 (Reprinted March 1989). Richards N. R.,Caldwell, A. G. and Morwick, F. F., Soil Survey of Essex County. Report No. 11 of the Ontario SoilSurvey, OMAF.
Proctor, R. R. 1933. Fundamental principles of soil compaction. Engineering News-Record,McGraw-Hill Publ. Co. Inc. New York, N.Y., vol. 111, p. 286.
Raghavan, G. S. V., McKyes, E., Gendron, G., Borgium, B. K., and Le, H. H. 1978. Effects of tirecontact pressure on corn yield. Can. Agr. Eng. 20: 34-37.
Raghavan, G. S. V. and McKyes, E. 1983. Physical and hydraulic characteristics in compacted claysoils. J. Terramechanics, 19 (4): 235-242.
Rao, S. A. A., Hay, R. C. and Bateman, H. P. 1960. Effect of minimum tillage on physical propertiesof soils and crop response. Trans. Amer. Soc. Agr. Eng. 3 (2): 8-10.
Reynolds, W. D. and Elrick, D. E. 1985. Measurement of field saturated hydraulic conductivity,sorptivity and the conductivity-pressure head relationship using the "Guelph Permeameter". Proc.National Water Well Association Conf. on Characterization and Monitoring of the Vadose(Unsaturated) Zone. Denver, Colorado, 25 pp.
Rycroft, D. W. 1972. A review of literature on mole drainage. Technical Bulletin 72/10. FieldDrainage Experimental Unit, Cambridge, U.K.
Shady, A. M., Broughton, R. W., Bernier, Y., Delisle, U. and Sylvestre, G. 1976. Experience withproduction scale field measurements of hydraulic conductivity. Third National Drainage SymposiumProceedings, Amer. Soc. Agr. Eng.
Soane, B. D. 1970. The effect of traffic and implements on soil compaction. J. Proc. Inst. Agr. Eng.25: 115-126.
Soehne, W. 1958. Fundamentals of pressure distribution and soil compaction under tractor tires.Agr. Eng. 39: 276-281, 290.
Stone, J. A. 1987. Compaction and the surface structure of a poorly drained soil. Trans. Amer. Soc.Agr. Eng. 30: 374-378.
Sylvestre, G., Boudreau, A. and Bernier. Y. 1989. Subsurface drainage design field performance.Paper No. 89-2065, ASAE/CSAE Meeting, Québec, Canada.

66
Tabrizi, A. N. and Skaggs, R. W. 1982. Variation of saturated hydraulic conductivity within a soilseries. Amer. Soc. Agr. Eng. Paper No. 83-2044.
Taylor, F., Raghavan, G. S. V., McKyes, E., Negi, S. and Stemshorn, E. 1981. Soil structureandcorn yields. Trans. Amer. Soc. Agr. Eng. 24 (6): 1408-1411.
Theobald. G. H. 1963. Methods and machines for tile and other tube drainage. FAO, U.N. Agr. Dev.Paper No. 78, 104 pp.
Trafford, B. D. and Massey, W. 1975. A design philosophy for heavy soils. Tech. Bull. 75/5, FieldDrainage Experimental Unit, Cambridge, U.K.
van der Tak, L. D. and Grismer, M. E. 1987. Irrigation, drainage and soil salinity in cracking soils.Trans. Amer. Soc. Agr. Eng. 30 (3): 740-744.
Van Doren, D. M., Jr., Brown, W. N. and Johnson, W. H. 1964. Soil compaction and crop growth.Ohio Agr. Eng. Sta. June.
Van Schilfgaarde, J. 1963. Design of tile drainage for falling water tables. J. Irrigation and DrainageDiv. Amer. Soc. Civil Eng. 89: 1-11.
_______________. 1964. Closure, Design of tile drainage for falling water tables. J. Irrigation andDrainage Div. Amer. Soc. Civil Eng. 90: 71-73.
Waelti, H., Liljedahl, J. B., and Monke, E. J. 1963. Field instrument measures soil compaction. Agr.Eng. August, pp: 438-439.
Weaver, H. A. and Jamison, V. C. 1951. Effects of moisture on tractor tire compaction of soil. SoilSci. 71: 15-23.
Weil, C., Natho-Jina, S. and Chambers, R. 1989. The feasibility of mole drainage in silicate claysoils subjected to freezing. Paper No. 89-2063, ASAE/CSAE Meeting, Québec, Canada.
Yaalon, D. H. and Kalmar, D. 1984. Extent and dynamics of cracking in a heavy clay soil with xericmoisture regime. Proc. ISSS Symposium on Water and Solute Movement in Heavy Clay Soils, ILRI#3, The Netherlands.

APPENDIX
FIGURES
A4.1 Map of Essex County Showing Soil Drainage Types A1
A4.2 Drainage System of Essex County A2
A6.1 Plasticity Chart (Atterberg Limits) A3
TABLES
A5.1 Depth to Tile Drains, Distance Between Tiles A4
A5.2 Tile Depth and Gradient A5
A6.1 Moisture Content (Field) Measurements - 1989 A6
A6.2 Dry Density and Moisture Content (Field and Laboratory), Farm 1, 1990 A7
A6.3 Dry Density (Field) Measurements - 1989 A8
A6.4 Piezometer Water Level Measurements July -September 1989 A9
A6.5 Farmer Cooperator Rainfall Data A11
A6.6 Piezometer and Tensiometer Measurements, 1990 A12
A6.7 Plant and Grain Yields for Farms 1, 2 and 3 A13
A6.8 Measured Plant Heights, Planting and Harvesting Dates A14
A6.9 Laboratory Moisture Contents and Densities, 1989 A15
A6.10 Field and Laboratory Measurements of Moisture Content & Dry Density A16
A6.11 Laboratory Values of Moisture Content, Dry Density and Shrinkage - 1990 A17
A6.12 Atterberg Limits A18
A6.13 Specific Gravity Determinations A18
A6.14 Proctor Density Results A19
APPENDIX - continued
DRAWINGS
S89257-A Plan of Tile Drains, Farm 1 A20
589257-B Plan of Tile Drains, Farm 2 A21
589257-C Plan of Tile Drains, Farm 3 A22
S89257-D Layout Plan of Piezometers & Tensiometers, Farm 1, R. Chauvin A23
SKETCHES
S 89257-SK-1 Generalized Piezometer Arrangement A24
MISCELLANEOUS
TABLE M.1 Field Visit Schedule A25
Crop Inspection Report by L. Gilbeault, Crop Specialist A27
Technical Specifications, Troxler Model 3440 A28
Photographic Plates A32
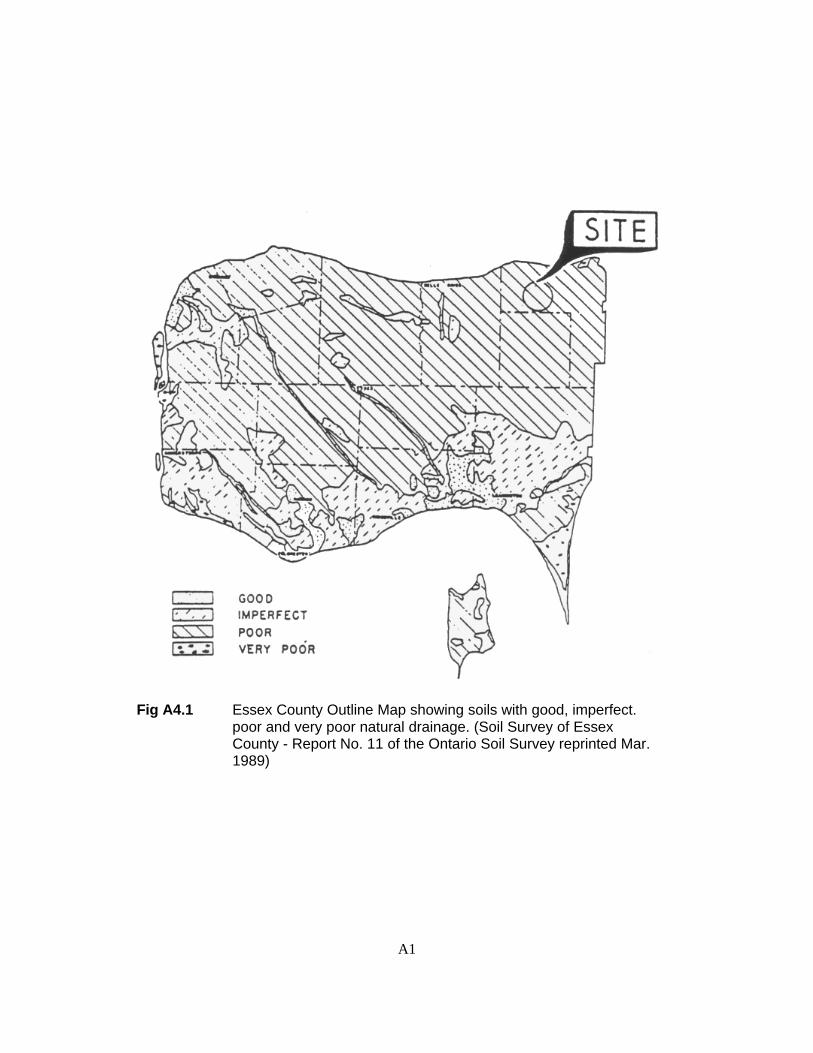
A1
Fig A4.1 Essex County Outline Map showing soils with good, imperfect.poor and very poor natural drainage. (Soil Survey of EssexCounty - Report No. 11 of the Ontario Soil Survey reprinted Mar.1989)

A2
Fig A4.2 Drainage System of Essex County. (Soil Survey of Essex CountyReport No. 11 of the Ontario Soil Survey reprinted Mar. 1989)

A3

A4
Table A5.1: Depth, Spacing, Diameter and Material Composition of Drain Laterals
Depth to Tile(m)
Lateral Spacing(m)
NominalTile
Diameter
TileMaterial
Tile Line *SL1 *SL2 *SL1 *SL2 mm
Farm 1
1 0.56 0.55 100 clay
6.66 6.58
2 0.65 0.65 100 plastic
6.25 6.40
3 0.67 0.67 100 plastic
Farm 2
1 0.70 0.56 100 clay
10.26 10.21
2 0.78 0.69 100 clay
10.69 10.95
3 0.70 0.59 100 clay
Farm 3
1 0.66 0.72 100 clay
20.30 20.94
2 0.74 0.78 100 clay
21.34 21.82
3 0.81 0.79 100 clay
* SL1 - Survey Line 1 SL2 - Survey Line 2

A5
Table A5.2 Tile Depth and Gradient
Farm &Survey Line
Elev.Grd.(m)
TileDepth
(m)
TileElev.(m)
OutletElev.(m)
Elev.Diff.(m)
Gradient
(%)
Farm #1 Survey Line 1Tile Line 1 98.04 0.56 97.48 97.41 0.07 0.5Tile Line 2 98.06 0.65 97.41 97.47 0.06 negTile Line 3 98.11 0.76 97.41 97.54 0.10 neg
Farm #1 Survey Line 2
Tile Line 1 98.08 0.55 97.53 97.41 0.12 0.3Tile Line 2 98.08 0.65 97.43 97.47 0.04 negTile Line 3 98.08 0.67 97.41 97.54 0.13 neg
Farm #2 Survey Line 1
Tile Line 1 99.02 0.70 98.32 98.30 0.02 0.1Tile Line 2 99.01 0.78 98.23 98.05 0.18 0.6Tile Line 3 99.03 0.70 98.33 98.35 0.02 neg
Farm #2 Survey Line 2
Tile Line 1 98.93 0.56 98.37 98.30 0.07 0.2Tile Line 2 98.94 0.69 98.25 98.05 0.20 0.4Tile Line 3 98.92 0.57 98.35 98.35 0.00 0.0
Farm #3 Survey Line 1
Tile Line 1 100.0 0.66 99.34 99.02 0.32 1.0Tile Line 2 99.94 0.74 99.20 99.16 0.04 0.1Tile Line 3 99.97 0.81 99.16 98.97 0.19 0.6
Farm #3 Survey Line 2
Tile Line 1 100.06 0.72 99.34 99.02 0.32 0.5Tile Line 2 100.03 0.78 99.25 99.16 0.09 0.1Tile Line 3 100.02 0.79 99.23 98.97 0.26 0.4
NotesFarm 1- Distance Survey Line 2 to Survey Line 1 - 30 m
Distance Survey Line 1 to ditch bank tile outlet - 15 m
Farm 2- Distance Survey Line 2 to Survey Line 1 - 30 m Distance Survey Line 1 to ditch bank tile outlet - 15 m
Farm 3 - Distance Survey Line 2 to Survey Line 1 - 30 m Distance Survey Line 1 to ditch bank tile outlet - 32 m
Elevations are not geodetic. Arbitrary bench marks selected.
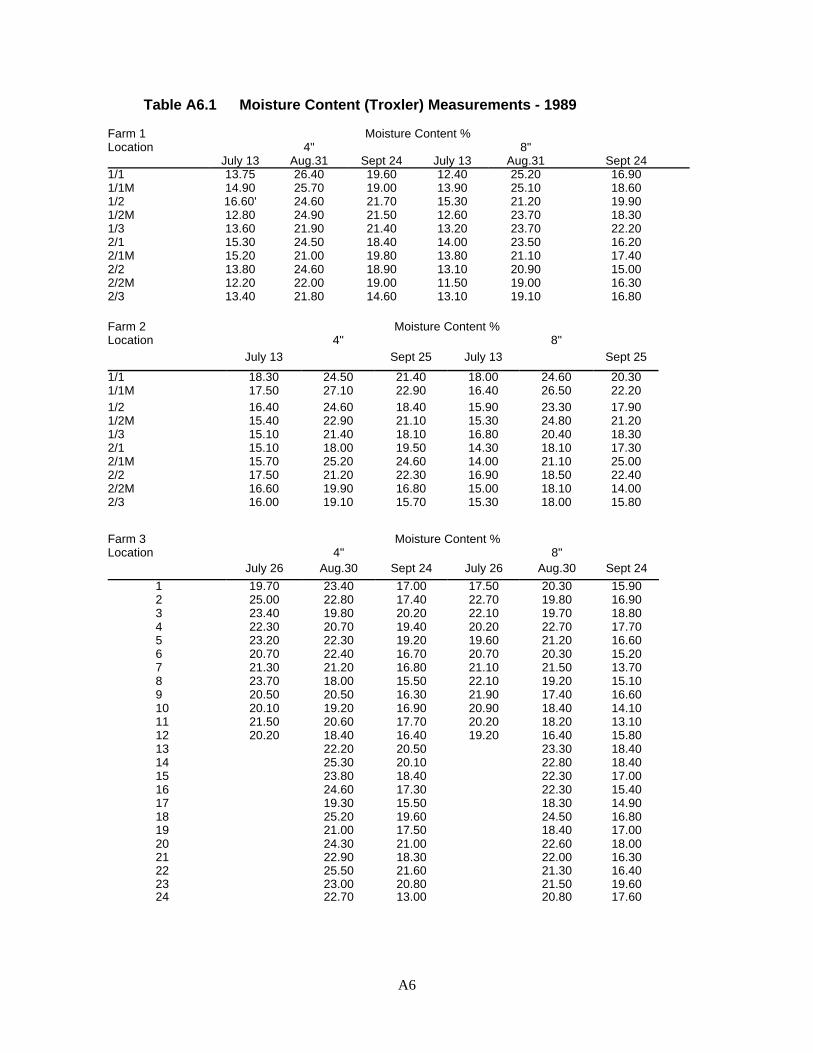
A6
Table A6.1 Moisture Content (Troxler) Measurements - 1989
Farm 1Location 4"
Moisture Content %8"
July 13 Aug.31 Sept 24 July 13 Aug.31 Sept 241/1 13.75 26.40 19.60 12.40 25.20 16.901/1M 14.90 25.70 19.00 13.90 25.10 18.601/2 16.60' 24.60 21.70 15.30 21.20 19.901/2M 12.80 24.90 21.50 12.60 23.70 18.301/3 13.60 21.90 21.40 13.20 23.70 22.202/1 15.30 24.50 18.40 14.00 23.50 16.202/1M 15.20 21.00 19.80 13.80 21.10 17.402/2 13.80 24.60 18.90 13.10 20.90 15.002/2M 12.20 22.00 19.00 11.50 19.00 16.302/3 13.40 21.80 14.60 13.10 19.10 16.80
Farm 2Location 4"
Moisture Content %8"
July 13 Sept 25 July 13 Sept 25
1/1 18.30 24.50 21.40 18.00 24.60 20.301/1M 17.50 27.10 22.90 16.40 26.50 22.201/2 16.40 24.60 18.40 15.90 23.30 17.901/2M 15.40 22.90 21.10 15.30 24.80 21.201/3 15.10 21.40 18.10 16.80 20.40 18.302/1 15.10 18.00 19.50 14.30 18.10 17.302/1M 15.70 25.20 24.60 14.00 21.10 25.002/2 17.50 21.20 22.30 16.90 18.50 22.402/2M 16.60 19.90 16.80 15.00 18.10 14.002/3 16.00 19.10 15.70 15.30 18.00 15.80
Farm 3Location 4"
Moisture Content %8"
July 26 Aug.30 Sept 24 July 26 Aug.30 Sept 241 19.70 23.40 17.00 17.50 20.30 15.902 25.00 22.80 17.40 22.70 19.80 16.903 23.40 19.80 20.20 22.10 19.70 18.804 22.30 20.70 19.40 20.20 22.70 17.705 23.20 22.30 19.20 19.60 21.20 16.606 20.70 22.40 16.70 20.70 20.30 15.207 21.30 21.20 16.80 21.10 21.50 13.708 23.70 18.00 15.50 22.10 19.20 15.109 20.50 20.50 16.30 21.90 17.40 16.6010 20.10 19.20 16.90 20.90 18.40 14.1011 21.50 20.60 17.70 20.20 18.20 13.1012 20.20 18.40 16.40 19.20 16.40 15.8013 22.20 20.50 23.30 18.4014 25.30 20.10 22.80 18.4015 23.80 18.40 22.30 17.0016 24.60 17.30 22.30 15.4017 19.30 15.50 18.30 14.9018 25.20 19.60 24.50 16.8019 21.00 17.50 18.40 17.0020 24.30 21.00 22.60 18.0021 22.90 18.30 22.00 16.3022 25.50 21.60 21.30 16.4023 23.00 20.80 21.50 19.6024 22.70 13.00 20.80 17.60
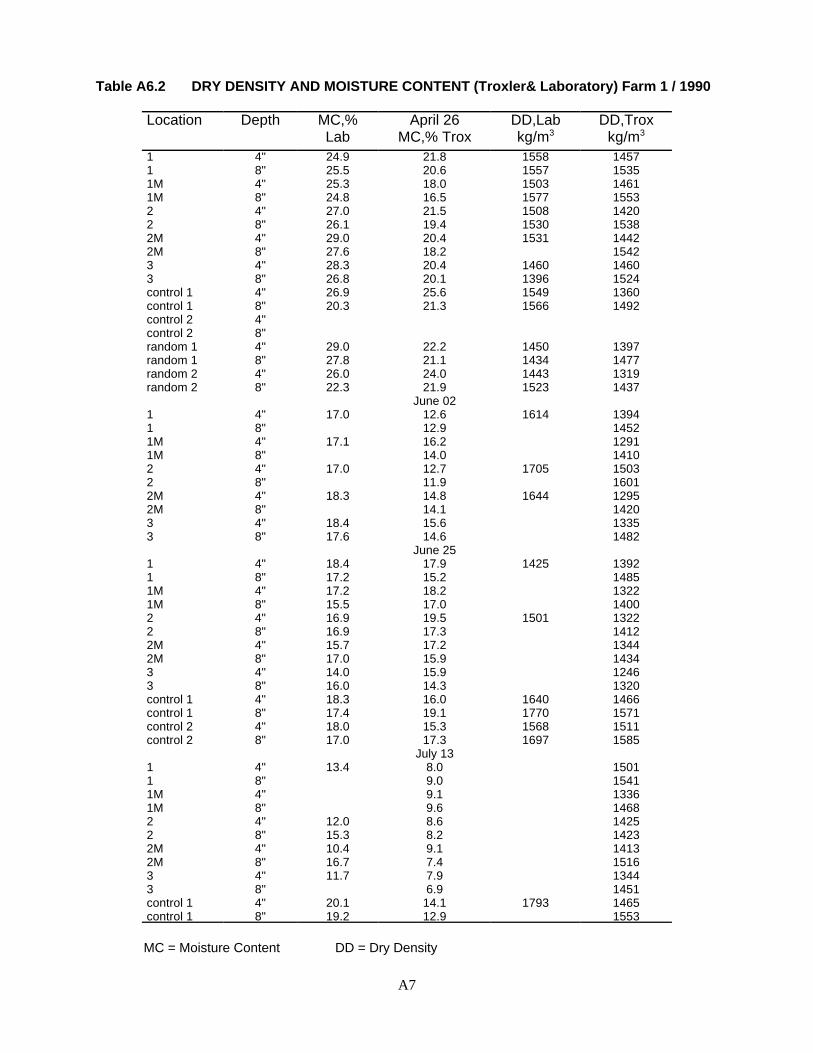
A7
Table A6.2 DRY DENSITY AND MOISTURE CONTENT (Troxler& Laboratory) Farm 1 / 1990
Location Depth MC,%Lab
April 26MC,% Trox
DD,Labkg/m3
DD,Troxkg/m3
1 4" 24.9 21.8 1558 14571 8" 25.5 20.6 1557 15351M 4" 25.3 18.0 1503 14611M 8" 24.8 16.5 1577 15532 4" 27.0 21.5 1508 14202 8" 26.1 19.4 1530 15382M 4" 29.0 20.4 1531 14422M 8" 27.6 18.2 15423 4" 28.3 20.4 1460 14603 8" 26.8 20.1 1396 1524control 1 4" 26.9 25.6 1549 1360control 1 8" 20.3 21.3 1566 1492control 2 4"control 2 8"random 1 4" 29.0 22.2 1450 1397random 1 8" 27.8 21.1 1434 1477random 2 4" 26.0 24.0 1443 1319random 2 8" 22.3 21.9 1523 1437
June 021 4" 17.0 12.6 1614 13941 8" 12.9 14521M 4" 17.1 16.2 12911M 8" 14.0 14102 4" 17.0 12.7 1705 15032 8" 11.9 16012M 4" 18.3 14.8 1644 12952M 8" 14.1 14203 4" 18.4 15.6 13353 8" 17.6 14.6 1482
June 251 4" 18.4 17.9 1425 13921 8" 17.2 15.2 14851M 4" 17.2 18.2 13221M 8" 15.5 17.0 14002 4" 16.9 19.5 1501 13222 8" 16.9 17.3 14122M 4" 15.7 17.2 13442M 8" 17.0 15.9 14343 4" 14.0 15.9 12463 8" 16.0 14.3 1320control 1 4" 18.3 16.0 1640 1466control 1 8" 17.4 19.1 1770 1571control 2 4" 18.0 15.3 1568 1511control 2 8" 17.0 17.3 1697 1585
July 131 4" 13.4 8.0 15011 8" 9.0 15411M 4" 9.1 13361M 8" 9.6 14682 4" 12.0 8.6 14252 8" 15.3 8.2 14232M 4" 10.4 9.1 14132M 8" 16.7 7.4 15163 4" 11.7 7.9 13443 8" 6.9 1451control 1 4" 20.1 14.1 1793 1465control 1 8" 19.2 12.9 1553
MC = Moisture Content DD = Dry Density

A8
Table A6.3 Dry Density (Troxler) Measurements - 1989
LOCATIONFarm 1
Dry Density, kg/m3
4"depth 8"depthJuly 13 August 31 Sept 24 July 13 Aug.31 Sept 24
1/1 1351 1275 1408 1460 1296 15591/1M 1518 1420 1473 1609 1417 15511/2 1360 1349 1381 1498 1513 14581/2M 1553 1367 1392 1587 1442 14981/3 1495 1388 1383 1606 1436 14552/1 1177 1245 1303 1296 1248 13942/1M 1238 1405 1320 1336 1447 14362/2 1221 1256 1323 1285 1394 14872/2M 1407 1360 1360 1481 1481 15032/3 1367 1291 1444 1484 1421 1518Farm 2
1/1 1460 1396 1508 1503 1425 15991/1M 1425 1328 1442 1505 1391 15021/2 1484 1396 1514 1548 1428 15671/2M 1455 1450 1510 1498 1445 15381/3 1508 1402 1344 1481 1436 14342/1 1482 1445 1428 1566 1447 15242/1M 1375 1275 1375 1534 1444 13962/2 1457 1322 1444 1511 1436 14762/2M 1423 1394 1442 1558 1466 15582/3 1381 1338 1460 1477 1421 1556
Farm 31 1519 1433 1466 1611 1535 15952 1348 1394 1408 1449 1510 15373 1413 1516 1365 1498 1551 14504 1453 1431 1365 1542 1461 14875 1423 1394 1380 1543 1500 15226 1413 1386 1447 1506 1526 15907 1425 1431 1466 1538 1477 16258 1455 1577 1473 1527 1583 15839 1558 1410 1452 1535 1537 156910 1502 1530 1468 1492 1601 163311 1444 1415 1482 1550 1492 206312 1522 1567 1477 1543 1676 159113 1407 1391 1447 149814 1364 1405 1489 150315 1383 1431 1476 153516 1449 1529 1497 166017 1453 1463 1494 155418 1319 1397 1449 153819 1524 1561 1572 160420 1290 1415 1389 152121 1328 1463 1426 154322 1283 1283 1412 146923 1317 1351 1437 145324 1338 1397 1452 1489

A9
TABLE A6.4 Piezometer Water Level Measurements July - September 1989
Water Level Depthsfrom Ground Level (m)
Tile Line
Date Farm # Survey Line 1 1M 2 2M 3 Remarks
1989 07 07 1 SL 1 *NR 0.79 NR NR NR
SL 2 NR NR NR NR 0.83 Farm 3not yet selected
1989 07 07 2 SL 1 0.81 0.85 0.86 0.86 0.79
SL 2 0.72 0.81 0.80 0.72 0.69
1989 07 13 1 SL 1 NR 0.71 NR NR NR
SL 2 NR NR NR NR NR Farm 3 not yetinstrumented
1989 07 13 2 SL 1 0.89 0.88 0.89 NR NR
SL 2 0.71 0.79 0.79 0.71 0.69
1989 07 27 1 SL 1 **GS 0.07 0.06 0.12 0.15 2.0" to 2.5"
SL 2 0.11 0.04 GS GS 0.04 rains 89/7/26and 89/7/27
1989 07 27 2 SL 1 0.71 0.44 0.79 0.56 0.55 Farm 3piezometersinstalled but noreadings takenSL 2 0.53 0.06 0.69 0.02 0.21
1989 08 17 1 SL 1 ^0.73 NR NR NR NR Taped cover ofpiezometerspartially openSL 2 NR NR 0.71 NR ^0.78
* NR - No Reading, piezometer dry** GS - Water at Ground Surface
-
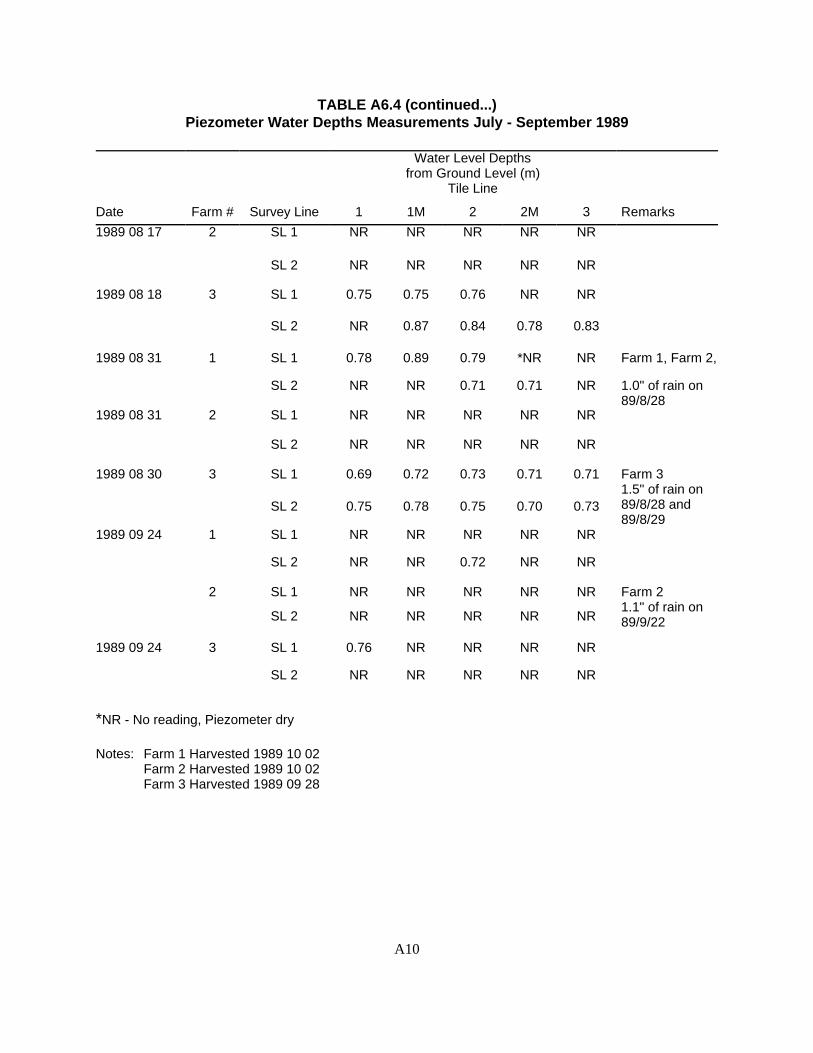
A10
TABLE A6.4 (continued...)Piezometer Water Depths Measurements July - September 1989
Water Level Depthsfrom Ground Level (m)
Tile Line
Date Farm # Survey Line 1 1M 2 2M 3 Remarks
1989 08 17 2 SL 1 NR NR NR NR NR
SL 2 NR NR NR NR NR
1989 08 18 3 SL 1 0.75 0.75 0.76 NR NR
SL 2 NR 0.87 0.84 0.78 0.83
1989 08 31 1 SL 1 0.78 0.89 0.79 *NR NR Farm 1, Farm 2,
SL 2 NR NR 0.71 0.71 NR 1.0" of rain on89/8/28
1989 08 31 2 SL 1 NR NR NR NR NR
SL 2 NR NR NR NR NR
1989 08 30 3 SL 1 0.69 0.72 0.73 0.71 0.71 Farm 3 1.5" of rain on89/8/28 and89/8/29
SL 2 0.75 0.78 0.75 0.70 0.73
1989 09 24 1 SL 1 NR NR NR NR NR
SL 2 NR NR 0.72 NR NR
2 SL 1 NR NR NR NR NR Farm 21.1" of rain on89/9/22SL 2 NR NR NR NR NR
1989 09 24 3 SL 1 0.76 NR NR NR NR
SL 2 NR NR NR NR NR
*NR - No reading, Piezometer dry
Notes: Farm 1 Harvested 1989 10 02 Farm 2 Harvested 1989 10 02 Farm 3 Harvested 1989 09 28
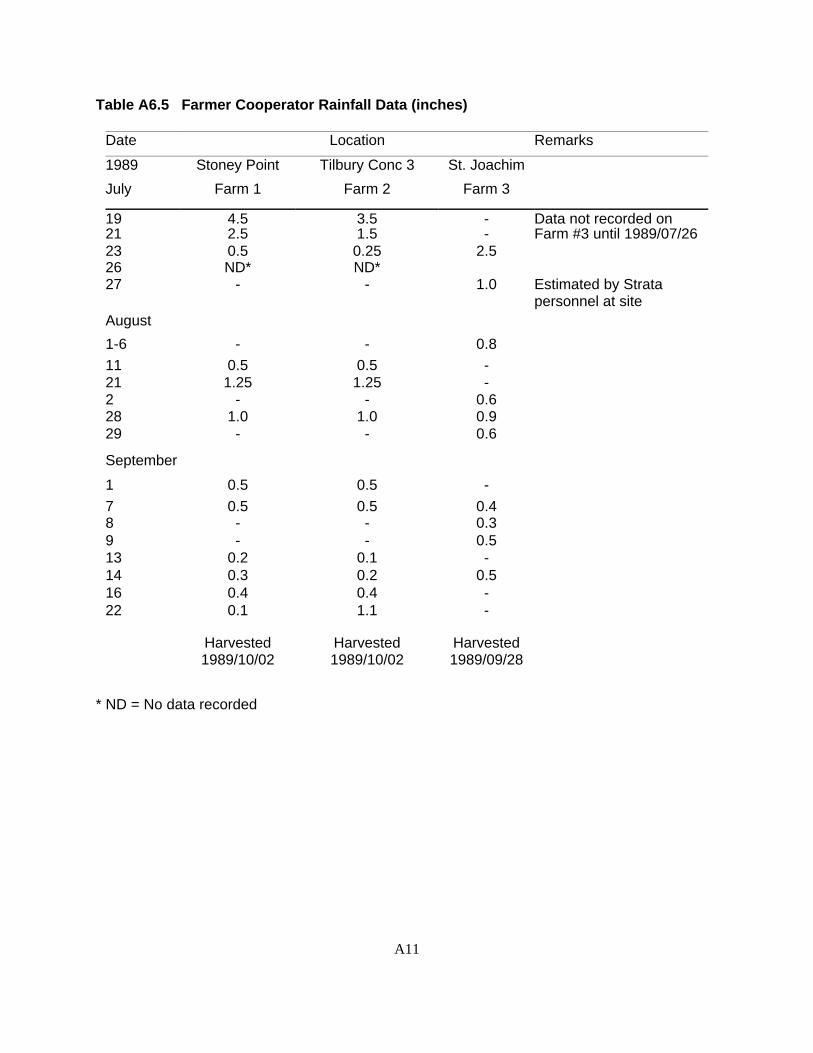
A11
Table A6.5 Farmer Cooperator Rainfall Data (inches)
Date Location Remarks
1989 Stoney Point Tilbury Conc 3 St. Joachim
July Farm 1 Farm 2 Farm 3
19 4.5 3.5 - Data not recorded on21 2.5 1.5 - Farm #3 until 1989/07/2623 0.5 0.25 2.526 ND* ND*27 - - 1.0 Estimated by Strata
personnel at siteAugust
1-6 - - 0.811 0.5 0.5 -21 1.25 1.25 -2 - - 0.628 1.0 1.0 0.929 - - 0.6
September
1 0.5 0.5 -7 0.5 0.5 0.48 - - 0.39 - - 0.513 0.2 0.1 -14 0.3 0.2 0.516 0.4 0.4 -22 0.1 1.1 -
Harvested1989/10/02
Harvested1989/10/02
Harvested1989/09/28
* ND = No data recorded

A12
TABLE A 6.6 PIEZOMETER AND TENSIOMETER MEASUREMENTS 1990
Month Day Rainfall (mm) Piezometer Readings (m) Tensiometer Readings
P1 P2 P3 P4 T1 T2 T3 T4May 1
2 0 14 56 04 25 D D D D 4 24 6 285 0 2 2 37 0 10 50 209 13 D D D D 0 38 72 42
11 0 55 80 561314 30 1.03 0.84 0.85 0.95 0 0 0 016 28 0.65 0.40 0.34 0.75 0 2 0 919 8 0.75 0.58 0.50 0.76 4 26 2 2022 0.86 0.65 0.55 0.81 8 40 32 3124 2 1.01 0.71 0.60 0.91 26 50 46 4026 1.08 0.75 0.65 0.95 59 62 64 5529 D 0.98 0.78 0.99 82 80 73 6231 D 1.02 0.90 1.02 87 87 74 62
June 4 12 D D D D 82 87 74 808 34 D D D D
15 65 50 80 8618 68 65 80 8021 72 80 82 8222 9 D D D D 86 86 82 8323 624 88 90 86 8627 90 92 88 8829 D D D D 90 90 88 8830 6 D D D D
July 4 25 D D D D9 13 D D D D
13 30 1.03 0.84 0.85 0.95 83 82 82
D=Dry
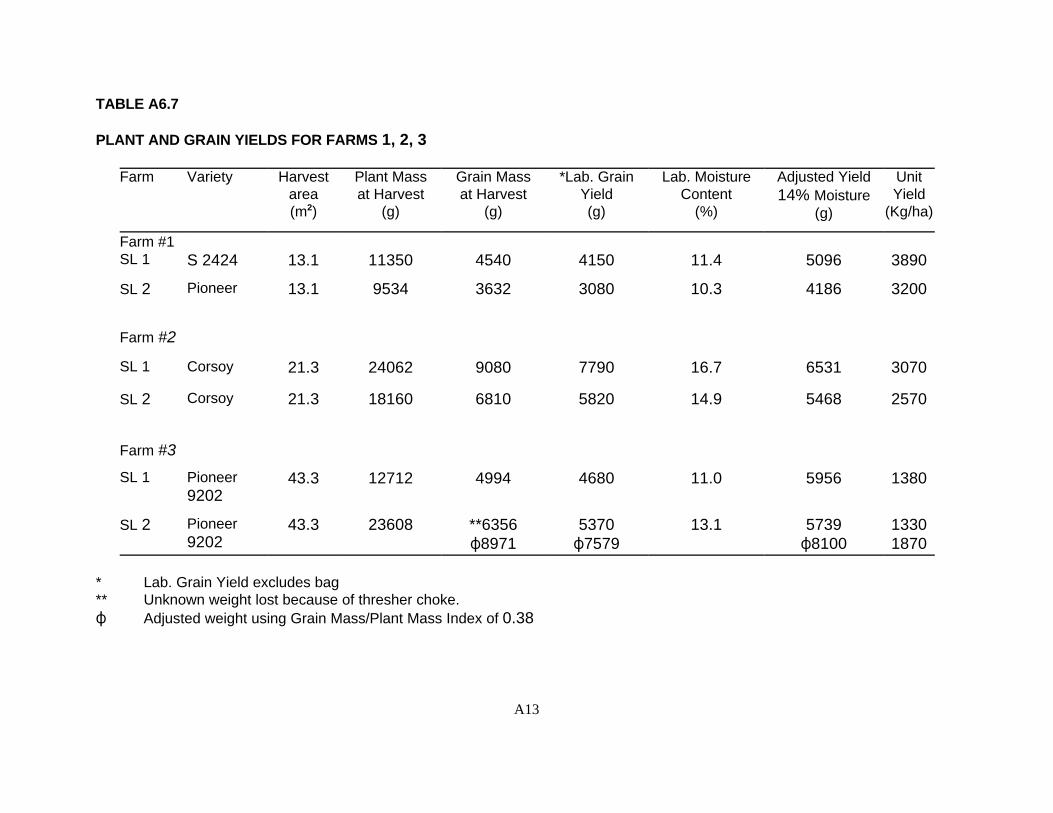
A13
TABLE A6.7
PLANT AND GRAIN YIELDS FOR FARMS 1, 2, 3
Farm Variety Harvestarea(m2)
Plant Massat Harvest
(g)
Grain Massat Harvest
(g)
*Lab. GrainYield(g)
Lab. MoistureContent
(%)
Adjusted Yield14% Moisture
(g)
UnitYield
(Kg/ha)
Farm #1SL 1 S 2424 13.1 11350 4540 4150 11.4 5096 3890
SL 2 Pioneer 13.1 9534 3632 3080 10.3 4186 3200
Farm #2
SL 1 Corsoy 21.3 24062 9080 7790 16.7 6531 3070
SL 2 Corsoy 21.3 18160 6810 5820 14.9 5468 2570
Farm #3
SL 1 Pioneer9202
43.3 12712 4994 4680 11.0 5956 1380
SL 2 Pioneer9202
43.3 23608 **6356N8971
5370N7579
13.1 5739N8100
13301870
* Lab. Grain Yield excludes bag** Unknown weight lost because of thresher choke.N Adjusted weight using Grain Mass/Plant Mass Index of 0.38

A14
TABLE A6.8
Measured Plant Heights, Planting and Harvesting Dates
Farm Planting Date Harvest date Plant Heights (mm)
1989/07/06 1989/07/27 1989/08/30 1989/09/24
#1 1989/05/22 1989/10/02 203 - 355 483 - 686 635 - 762 457 - 889
#2 1989/06/10 1989/10/02 152 - 203 254 - 406 457 - 762 305 - 711
#3 1989/05/11 1989/09/28 site notyet identified
355 - 406 381 - 534 381 - 406

A15
Table A6.9 Laboratory Moisture Contents and Densities, 1989
Farm # 1 1 3 3 3 3 3 3
Depth (mm) 200 200 100 100 200 100 100 200
Sample # 2/1 2/1 2/1 2/1 2/1 1 1 23
MC (%) 19.87 19.23 14.88 15.2 21.24 16.31 16.29 19.2
DD (Mg/m3) 1.381 1.342 1.565 1.623 1.468 1.563 1.547 1.599
SF (%) 16.50 18.10 7.50 9.10 23.60 6.68 11.30 9.63
Farm # 3 3 3 3 1 1 1 1 2
Depth (mm) 100 100 200 200 100 100 100 100 200
Sample # 12 12 3 3 2/1 2/1 2/2m 2/2m 2/2m
MC (%) 13.14 12.52 18.71 23.11 18.11 19.79 21.60 22.98. 23.57
DD (Mg/m3) 1.705 1.474 1.513 1.451 1.316 1.424 1.405 1.398 1.386
SF (%) 6.65 6.95 14.65 19.85 9.57 17.70 16.10 21.35 26.20
Farm # 2 2 2 2 2 2 2 2
Depth (mm)7 200 100 200 200 100 100 100 200
Sample # 2/2m 2/3 1/1 1/1 1/1 1/1 1/2 2/1m
MC (%) 23.38 20.97 20.63 22.60 21.09 22.28 21.57 28.64
DD (Mg/m3) 1.457 1.538 1.488 1.542 1.528 1.503 1.531 1.402
SF (%) 15.90 19.38 20.85 17.90 18.50 22.55 16.50 25.70
MC Moisture ContentDD Dry Density SF Shrinkage

A16
Table A6.10 Field and Laboratory Measurements of Moisture Content & Dry Density1989
Dry Density, Mg/cu.m Moisture Content,%All Farms Farm 1 Farm 2 Farm 3
Lab Troxler 4"Lab
DepthTroxler
4"Lab
DepthTroxler
4"Lab
DepthTroxler
1.362 1.394 13.75 19.44 16.4 20.26 20.8 20.841.516 1.508 16.6 20.62 15.1 20.4 22.3 24.491.531 1.514 15.3 19.4 15.1 23.62 20.5 22.491.402 1.396 13.4 18.3 16 23.4 24.6 24.121.474 1.477 26.4 29.97 27.1 27.18 23 23.041.482 1.45 24.6 25.85 22.9 26.77 22.7 24 1.37 1.303 21.9 26.98 18 18.76 17 14 1.401 1.36 24.6 27.46 25.2 24.08 20.2 20.3
21.8 24.6 21.2 22.55 16.4 14.8 19.6 19 21.4 22.1 18.3 16.9 21.7 22.2 18.1 20.6 20.8 19 18.4 19.8 24.6 2418.9 17.8 16.8 17.419 19.7 15.7 21.2
8" Depth 8" Depth 8" Depth
12.4 21.94 15.9 22.1 19.8 22.8215.3 18.2 16.8 21.1 21.2 21.9414 20.07 14.3 22.4 17.4 20.5913.1 19.5 15.3 27.1 22.3 18.8925.2 29.5 26.5 27.4 21.5 21.2921.2 24.18 24.8 25.83 20.8 22.5623.7 22.75 18.1 23.35 15.9 21.2 20.9 26.4 21.1 27.76 18.8 13.1 19.1 23.34 18.5 22.8 15.8 17 16.9 24.7 20.3 21.2 16.3 18.1 19.9 24.3 18.3 20.8 19.6 21.7 16.2 21.3 25 24.2 15 21.4 14 23.8 16.3 24 15.8 21.4
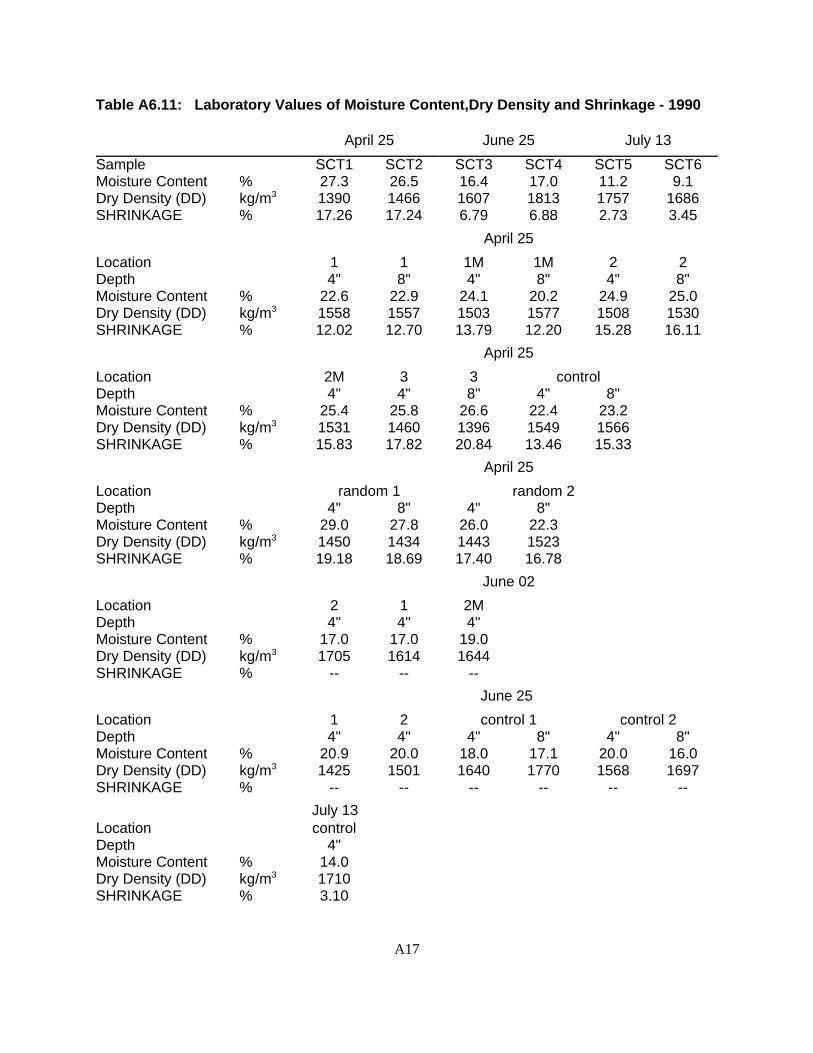
A17
Table A6.11: Laboratory Values of Moisture Content,Dry Density and Shrinkage - 1990
April 25 June 25 July 13
Sample SCT1 SCT2 SCT3 SCT4 SCT5 SCT6Moisture Content % 27.3 26.5 16.4 17.0 11.2 9.1Dry Density (DD) kg/m3 1390 1466 1607 1813 1757 1686SHRINKAGE % 17.26 17.24 6.79 6.88 2.73 3.45
April 25
Location 1 1 1M 1M 2 2Depth 4" 8" 4" 8" 4" 8"Moisture Content % 22.6 22.9 24.1 20.2 24.9 25.0Dry Density (DD) kg/m3 1558 1557 1503 1577 1508 1530SHRINKAGE % 12.02 12.70 13.79 12.20 15.28 16.11
April 25
Location 2M 3 3 controlDepth 4" 4" 8" 4" 8"Moisture Content % 25.4 25.8 26.6 22.4 23.2Dry Density (DD) kg/m3 1531 1460 1396 1549 1566SHRINKAGE % 15.83 17.82 20.84 13.46 15.33
April 25
Location random 1 random 2Depth 4" 8" 4" 8"Moisture Content % 29.0 27.8 26.0 22.3Dry Density (DD) kg/m3 1450 1434 1443 1523SHRINKAGE % 19.18 18.69 17.40 16.78
June 02
Location 2 1 2MDepth 4" 4" 4"Moisture Content % 17.0 17.0 19.0Dry Density (DD) kg/m3 1705 1614 1644SHRINKAGE % -- -- --
June 25
Location 1 2 control 1 control 2Depth 4" 4" 4" 8" 4" 8"Moisture Content % 20.9 20.0 18.0 17.1 20.0 16.0Dry Density (DD) kg/m3 1425 1501 1640 1770 1568 1697SHRINKAGE % -- -- -- -- -- --
July 13Location controlDepth 4"Moisture Content % 14.0Dry Density (DD) kg/m3 1710SHRINKAGE % 3.10

A18
Table A6.12 Atterberg Limits
Farm # Sample Depth (mm) LL PL PI
1 1 100 40.4 18.0 22.42 100 40.4 20.6 19.83 200 42.3 21.6 20.74 200 40.5 19.5 21.0
2 1 100 43.0 19.0 24.02 100 37.2 19.2 18.03 200 35.2 18.2 17.04 200 35.9 20.9 15.0
3 1 100 38.3 18.0 20.32 100 34.8 16.0 18.83 200 35.5 18.2 17.34 200 32.8 17.3 15.5
C 1 100 41.3 22.3 19.02 100 41.8 21.5 20.33 200 33.9 21.3 23.64 200 46.0 22.5 23.5
C - Combined Sample, Farm #1, #2, #3LL - Liquid LimitPL - Plastic LimitPI - Plasticity Index
Table A6.13 Specific Gravity Determinations
Farm # Depth (mm) Specific Gravity
1 100 2.6001 200 2.5581 375 - 450 2.6891 850 2.6892 100 2.5962 200 2.5503 100 2.6063 200 2.585
Mean Specific Gravity = 2.610Standard Deviation o = 0.051

A19
Table A6.14 Proctor Density Results
Farm # Proctor Test Optimum MoistureContent Compaction
(%)
Remarks
1 S 19.7 SL 1M 21.0 SL 1
1 S 20.5 SL 2M 23.2 SL 2
3 S 19.0 0 - 100mm DepthM 20.0 0 - 100mm Depth
3 S 19.5 100 - 375mm DepthM 21.0 100 - 375mm Depth
C S 18.5 Composite SampleM 20.0 Composite Sample
C - Composite SampleS - Standard Proctor Test (25 blows) M - "Modified" Proctor Test (10 blows)

A20
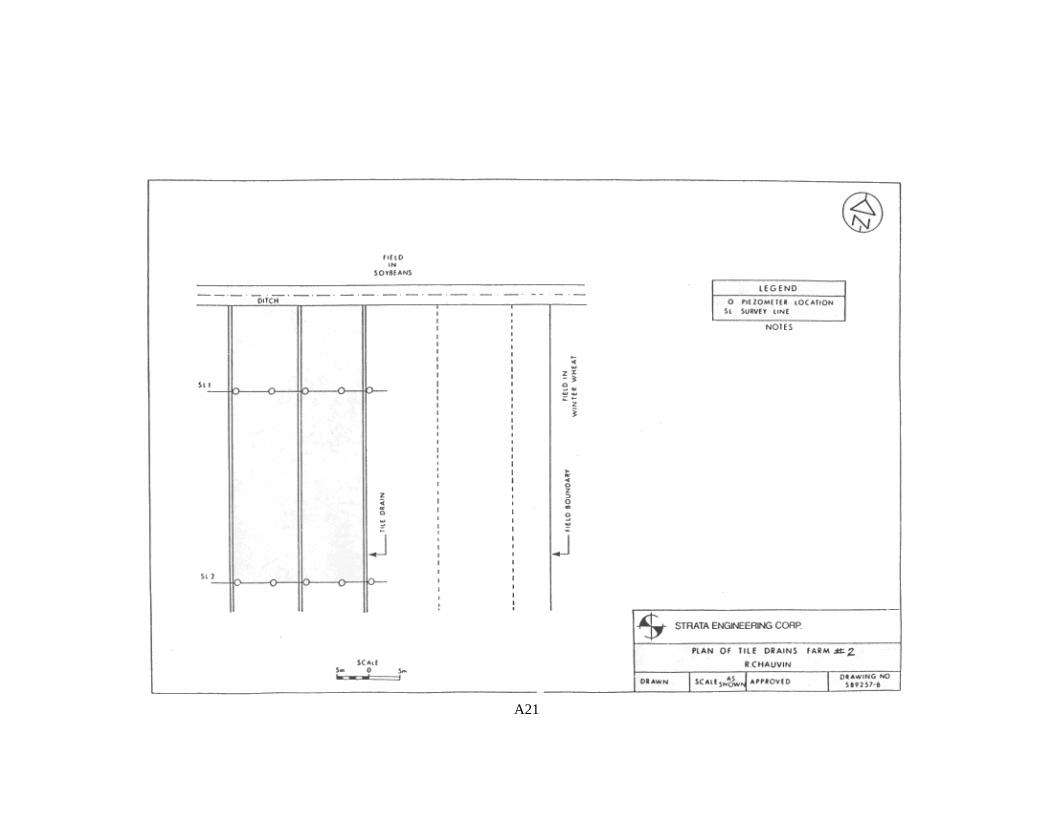
A21

A22

A23

A24

A25
Table M.1 Field Visit Schedule
Dates Reason for Visit Personnel Remarks
1989 05 31 Startup meeting CM,MP Attended start up meeting at Harrow.
1989 06 01 Toured TED sites
1989 06 12 Site Selection MP Visits to Stoney Pt. Tilbury Conc. 3
1989 06 22 Site Selection MP Visits to Stoney Pt. Tilbury Conc. 3
1989 07 04 Instrument'n. & MP,CM Locate drain tiles, set out survey lines,
1989 07 05 Site Selection SS Install piezometers on farms #1 & #2
1989 07 06 MP Select Farm #3
1989 07 07
1989 07 13 Instrumentation MP,SS Complete piezometer installation on
1989 07 14 Farm #2. Measurements, Farm #1
1989 07 26 Instrumentation MP,SS Installed piezometer on Farm #3.
1989 08 17 Measurements MP Hydraulic conductivity test, Farm #1
1989 08 03 Measurements MP,SS Measurements, all Farms. Rainfall data
1989 08 31 Measurements SS Measurements on all Farms.
1989 09 24 Measurements SS Measurements on all Farms. Contact
1989 09 28 Measurements MP,SS Harvesting on Farm #3
1989 10 02 Measurements MP,SS Harvesting on Farms #1 and #2
1989 11 10 Measurements MP Rainfall, cultivation, Farms #1,2 & 3
1989 11 28 Measurements SS Measurements of compaction & soil
1990 04 25 Instrumentation MP,SS Install Piezometers on Farm #1
1990 04 26 Measurements Crack Monitoring
1990 06 01 Measurements SS Density, Instruments Farm #1
1990 06 02
1990 06 25 Measurements MP,SS Density, Cracks

A26
Table M.1 Field Visit Schedule - continued
Date Reason for Visit Personnel Remarks
1990 07 09 Measurements MP Hyd. Conductivity, Farm #3
1990 07 13 Measurements SS Density, Cracks
1990 07 14
Personnel: MP - Michael J. PercySS - Shan ShanmugananthaCM - Cameran MirzaDM - Donald A. Mullett
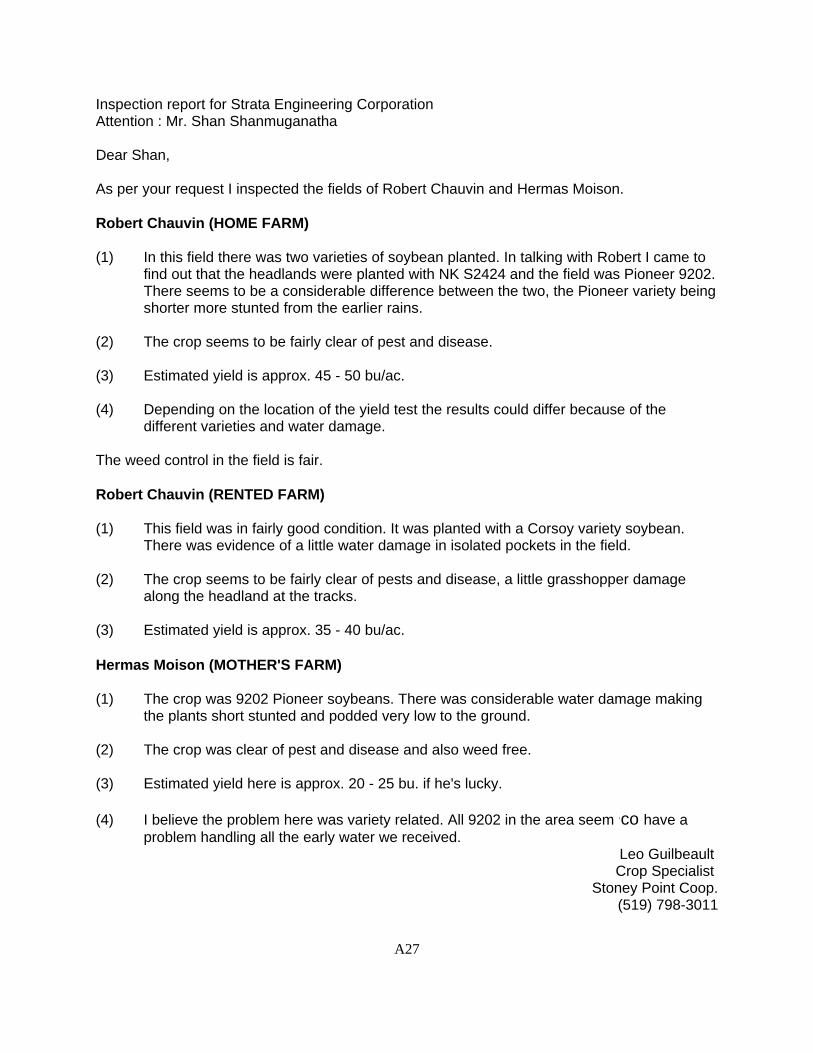
A27
Inspection report for Strata Engineering CorporationAttention : Mr. Shan Shanmuganatha
Dear Shan,
As per your request I inspected the fields of Robert Chauvin and Hermas Moison.
Robert Chauvin (HOME FARM)
(1) In this field there was two varieties of soybean planted. In talking with Robert I came tofind out that the headlands were planted with NK S2424 and the field was Pioneer 9202.There seems to be a considerable difference between the two, the Pioneer variety beingshorter more stunted from the earlier rains.
(2) The crop seems to be fairly clear of pest and disease.
(3) Estimated yield is approx. 45 - 50 bu/ac.
(4) Depending on the location of the yield test the results could differ because of thedifferent varieties and water damage.
The weed control in the field is fair.
Robert Chauvin (RENTED FARM)
(1) This field was in fairly good condition. It was planted with a Corsoy variety soybean.There was evidence of a little water damage in isolated pockets in the field.
(2) The crop seems to be fairly clear of pests and disease, a little grasshopper damagealong the headland at the tracks.
(3) Estimated yield is approx. 35 - 40 bu/ac.
Hermas Moison (MOTHER'S FARM)
(1) The crop was 9202 Pioneer soybeans. There was considerable water damage makingthe plants short stunted and podded very low to the ground.
(2) The crop was clear of pest and disease and also weed free.
(3) Estimated yield here is approx. 20 - 25 bu. if he's lucky.
(4) I believe the problem here was variety related. All 9202 in the area seem .co have aproblem handling all the early water we received.
Leo Guilbeault Crop Specialist
Stoney Point Coop.(519) 798-3011

A28
FIGURE 3. GAUGE SHOWING ROD POSITIONS 1
1 The 8 inch (200 mm) model is illustrated: the Troxler Model 3440 is also available in a12 inch (300 mm) model.

A29
PERIODIC MAINTENANCE AND SERVICE - SPECIFICATIONS MEASUREMENT SPECIFICATIONS U.S. CUSTOMARY UNITS
Direct Transmission. 6 inches 15 sec, min. 4 min.Precision at 125 PCF ±0.42 PCF ±0.21 PCF ±0.11 PCF
Composition Error at 125 PCF ±1.25 PCF ±1.25 PCF ±1.25 PCF
Surface Error (0.05 inch, 100% Void) -0.87 PCF -0.87 PCF -0.87 PCF
Backscatter Density (98%) 4 inches
Precision at 125 PCF ±1.00 PCF ±0.50 PCF ±0.25 PCF
Composition Error at 125 PCF ±2.50 PCF ±2.50 PCF ±2.50 PCF
Surface Error (0.05 inch, 100% Void) -3.43 PCF -3.43 PCF -3.43 PCF
Moisture,
Precision at 15 PCF ±0.64 PCF ±0.32 PCF ±0.16 PCF
Surface Error (0.05 inch, 100% Void) -1.12 PCF -1.12 PCF -1.12 PCF
Depth of Measurement at 15 PCF - 6 inches
MEASUREMENT SPECIFICATIONS S.I. UNITS
Direct Transmission. 6 in. (150 mm) 15 sec. J min, 4 min.Precision at 2000 kg/m3 ±6.8 kg/m3 ±3.4 kg/m3 ±1.7 kg/m3
Composition Error at 2000 kg/m3 ±20.0 kg/m3 ±20.0 kg/m3 ±20.0 kg/m3
Surface Error (1.25 mm, 100% Void) -14.0 kg/m3 -14.0 kg/m3 -14.0 kg/m3
Backscatter Density (98%) 100 mm
Precision at 2000 kg/m3 ±16.0 kg/m3 ±8.0 kg/m3 ±4.0 kg/m3
Composition Error at 2000 kg/m3 ±40.0 kg/m3 ±40.0 kg/m3 ±40.0 kg/m3
Surface Error (1.25 mm, 100% Void) -55.0 kg/m3 -55.0 kg/m3 -55.0 kg/; m3
Moisture
Precision at 240 kg/m3 ±10.0 kg/m3 ±5.0 kg/m3 ±2.5 kg/m3
Surface Error (1.25 mm, 100% Void) -18.0 kg/m3. -18.0 kg/m3 -18.0 kg/ m3
Depth of Measurement at 240 kg/m3- 150 mm

A30
PERIODIC MAINTENANCE AND SERVICE - SPECIFICATIONS (Continued)
CALIBRATION SPECIFICATIONS
Density Standards Accuracy : ± 0.3%Moisture Standards Accuracy: ± 2.0%Calibration Range 70-170 PCF (1100-2700 kg/m3) Density
0-40 PCF (0-640 kg/m3) Moisture
Method: Computer reduction of count rate data based on U.S. National Bureau of Standards ElectronCross Sections, Neutron Cross Sections and Absorption Coefficients. Data is reduced to the form D =(1/B)ln(A/(CR + C)) for density and M = (CR - E)/F for moisture where A, B, C, E, and F are constantsand CR is count ratio. The algorithm corrects for hydrogen photon scattering coefficients and providesmeans for offsetting non-water hydrogen. Direct calibration entry by keypad.
Special FunctionsAutomatic Standard Count Comparison and Storage Determination of count time for selected precision. Field offsets of density and moisture data.Field Calibration for special soil types.Nomograph method for measurement of asphalt overlays. Method to negate effects of sidewall moisture in a trench.
FIELD DATA CONVERSIONContains :P (Microprocessor) providing direct reading in both US and SI. Customary Units forwet density, dry density, moisture content and percent moisture. The algorithm corrects forhydrogen photon scattering coefficients and provides means for offsetting non-water hydrogen.
If theoretical densities are preset by operator, the :P can compute % of Marshall/Voids (Asphaltmode) or % of Proctor (Soil mode).
RADIOLOGICAL SPECIFICATIONS
Gamma Source and Dwg. No. 8 ±1 mCi Cesium-137, TEL A-102112Neutron Source and Dwg. No. 40 ±10% mCi Americium-241: Beryllium, TEL A-102451Source Housing Stainless Steel, Double EncapsulatedShielding Tungsten, Lead and CadmiumSurface Dose Rates 20 mRem/hour max., neutron and gammaSource Rod Material Stainless SteelShipping Case DOT 7A, Type A, Yellow II label, 0.5 Transport IndexSource Sealed approval for Cs-137, SPECIAL FORM Certificate; GB: SFC 140 Domestic and International Am-241: Be, SPECIAL FORM Certificate; GB: SFC 7 Shipment
COMMUNICATION SPECIFICATIONS
Serial Port RS-232 (Field Selectable 300 to 4800 Baud)Parallel Port General Purpose Expansion Port

A31
PERIODIC MAINTENANCE AND SERVICE - SPECIFICATIONS (Continued)
MEMORY SPECIFICATIONSRAM 64K Resident, Non-Volatile; Stores over 450 complete station records. 192K
External.ROM 256K or 512K Resident, 512K. External.
ELECTRICAL SPECIFICATIONS
Time Accuracy and Stability ± 0.005% ± 0.0002%/º CPower Supply Stability ± 0.01% º CStored Power 30 watt-hoursBattery Recharge Time 16 hours, Automatic cutoffCharge Source 110/220 VAC, 50-60 Hz. or 12-14 VDC Liquid Crystal Display (LCD) Readout 4 x 16 Alpha-numericPower Consumption (watts) Average 0.16Power Consumption after automatic
Battery Cutoff (watts) 0.00
Gauge returns to Gauge Ready (power saving mode) after 2 min. of operator inactivity, except inSTD, STAT TEST, DRIFT TEST, and NOMOGRAPH (30 Min.). After 5 hours of completeinactivity, gauge performs a total power shut-down.
Battery Packs are fully protected against overcharge and over discharge; charge life is updatedevery 1.9 seconds and is indicated on the (READY) display.
Emergency Use - Capable of Operation with six (6) "D" size Alkaline Batteries. Not all D size alkaline batteries will fit.
SELF TEST SERVICE PROGRAMS- Display Test- Keypad Test- RAM Test- He3 and GM Tube test- Statistical Stability and Drift Test - Gauge Identification Program
MECHANICAL SPECIFICATIONSCase Polycarbonate top/aluminum. cast base.Vibration Test 0.1 inches (2.54 mm) at 12.5 HzDrop Test 300 mm on 25 mm diameter steel ballOperating Temperature - Ambient: 14 to 158ºF (-10 to 70ºC)
- Surface: 350ºF (175ºC)Storage Temperature -70 to 185ºF (-55 to 85ºC)Gauge Size (excluding handles) 14.8 x 9.1 x 7.2" (376 x 231 x 183 mm)Gauge Height (including handles) 12" - 19.5" (495 mm) or, 8" - 15.5" (395 mm)Weight 29 pounds (13.15 kg)Shipping Weight 90 pounds (40.8 kg ) with transport case


A32
Plate 1 - Farm #1 General Layout, 1989
Plate 2 - Piezometer Tube, Bentonite, Sand

A33
Pate 4 - 300 mm Deep Crack. Farm #1 1990
Plate 3 - Soil Cracking Farm #1 July 1989
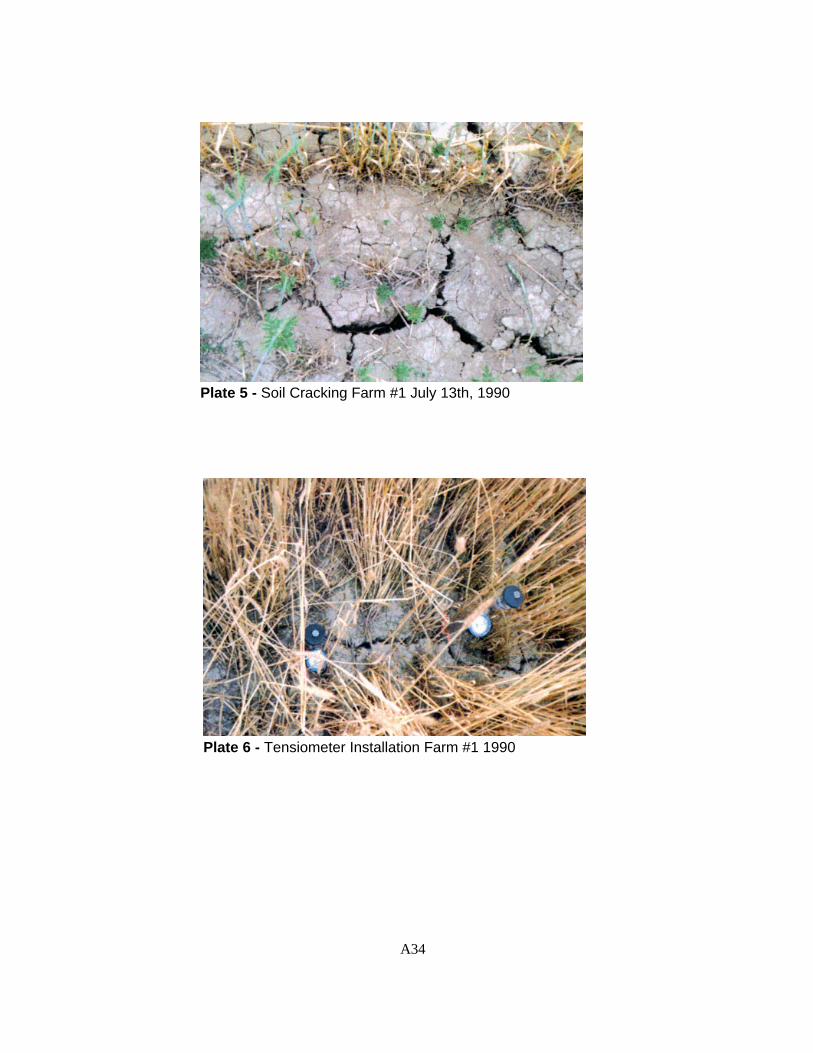
A34
Plate 5 - Soil Cracking Farm #1 July 13th, 1990
Plate 6 - Tensiometer Installation Farm #1 1990

A35
Plate 7 - Jet Fill Tensiometer InstalledFarm #1 1990
Plate 8 - Piezometer and TensiometerInstallations adjacent to Tile LineFarm #1 1990
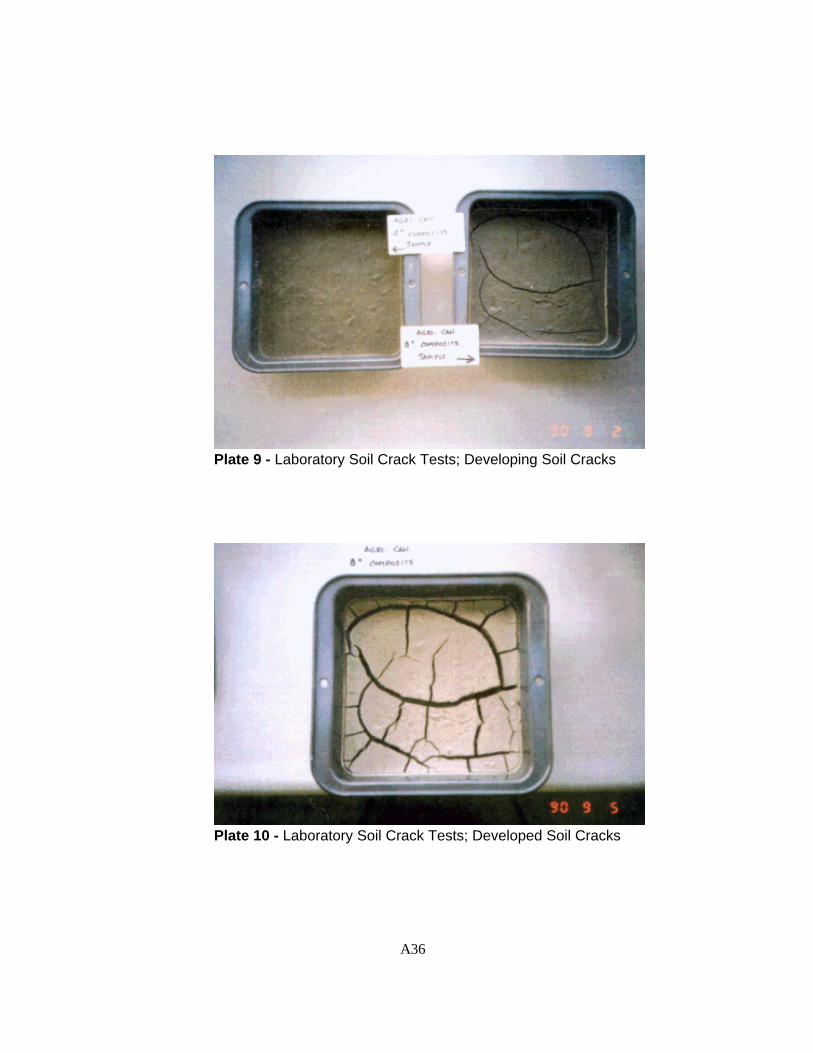
A36
Plate 9 - Laboratory Soil Crack Tests; Developing Soil Cracks
Plate 10 - Laboratory Soil Crack Tests; Developed Soil Cracks