Embed Size (px)
Citation preview

Communicable Disease Surveillance Centre
European Bacterial Meningitis Surveillance Project
February 2002 ©Copyright 2002 Norman Noah All rights reserved. No part of this report may be reproduced by any means, or transmitted, or translated into machine language without the written permission of the authors. Acknowledgements We wish to thank Wyeth-Lederle UK for funding this surveillance project. We also wish to thank the Meningitis Trust for a grant for developing the surveillance database.
Surveillance of Bacterial Meningitis in Europe 1999/2000
Prof. Norman Noah MB FRCP FFPHM Brian Henderson B.Sc.
Abridged Version

2
1. Introduction
This is an abridged version of the Surveillance of Bacterial Meningitis in Europe report 1999/2000. The following facts and figures were the most up to date available at the time of compiling this report. The full version of the forty-seven-page report contains further epidemiological data, sections on trends, a review of outbreaks and reports on countries outside of Europe; including the USA, Australia and New Zealand. If you are interested in the complete document contact us using the details at the end of this report. For this report twenty-nine European countries and one region provided information on cases of meningococcal disease. Ten countries reported pneumococcal and/or H. influenzae meningitis case data. The EU now separately funds surveillance of meningococcal disease in EU countries. It is however, working closely with us on the surveillance of meningococcal disease in Europe, so there is no waste of resources. Data collected by the EU surveillance feeds into our own database, with the consent of the countries involved. All incidence rates are based on reported infections and are per 100,000 population per year unless otherwise stated. With a few exceptions, total numbers reported are likely to be incomplete. All incidence data have to be interpreted cautiously because of under reporting, especially where the rate is low. This report should be used to interpret trends rather than be used as an indicator of true incidences. 2. Methods Most contributors report individual cases of bacterial meningitis and meningococcal disease in their country every quarter. A few countries still send in aggregated data, but now use a quarterly format. Most contributors send a common data set as an Excel file, either by diskette or e-mail. A few continue to complete hand-written forms. Data from EU countries goes to the
Contents 1. Introduction 2
2. Methods 2
3. Results: Meningococcal Disease 4 3.1 Distribution, Incidence and Clinical Diagnosis 4 3.2 Age 6
3.3 Case Fatality Rate 7 3.4 Serogroups 9 3.5 Predominant Serotype 11 3.6 Antibiotic Resistance 13
4. Results: Haemophilus influenzae and Pneumococcal 14
Meningitis

3
EU surveillance of meningococcal disease. Most countries have given permission for their data to be passed on to us in the detailed format used by the project. Others send the data to us separately in a format suitable for them. The data is transferred into a corresponding Excel spreadsheet. This functions as a template where data can be initially checked for coding and format standardisation. This is then imported into a password protected “Core” Access database for permanent storage. Selected data fields covering the required time period are then exported to a satellite “Reports” database where they can be temporarily stored for processing into reports without risk to the central data. Filter queries are used to further check and clean the data so that it can be exported as a set of standard Excel tables, as used in the quarterly reports, or an ad hoc Excel table designed as required. Disease definitions are as follows: Invasive meningococcal disease Covers all meningococcal infections causing symptoms other than carriers/throat infections. ICD-10 codes: A39.0 to A39.9 Septicaemia Covers the presence in the blood of meningococci and the symptoms of septicaemia. ICD-10 codes: A39.2 to A 39.4 Meningitis Covers the presence in the CSF of meningococci and the symptoms of meningitis. ICD-10 code: A39.0 Both Evidence of both septicaemia and meningitis on the basis of clinical diagnosis and/or laboratory tests. For laboratory cases the diagnosis was confirmed by laboratory methods, either culture or non-culture. Notifications were based on clinical presentation and may or may not be confirmed by laboratory methods. Most of the data presented here are based on laboratory reports. Core Data Set For figures comparing reporting periods a core of 16 countries which have reported all four quarters in each reporting period has been used. The countries are Austria, Belgium, the Czech Republic, England & Wales, France, Germany, Greece, Iceland, Israel, Netherlands, Norway, Republic of Ireland, Scotland, Slovak Republic, Slovenia and Spain. This was done to provide a data set that would give a more reliable representation of possible changes in the epidemiology of McD over time. It also allows some assessment of the reliability of the current reporting system.

4
3. Results: Meningococcal Disease 3.1 Distribution, Incidence and Clinical Diagnosis For the period July 1999 to June 2000, thirty countries from Europe contributed data. Twenty-nine European contributors reported a total of 8279 laboratory confirmed cases. For notifications, nine European contributors from the complete data set reported a total of 1333 cases. Twenty-five countries were eligible for inclusion in calculating an overall standardised incidence rate for Europe for laboratory confirmed cases. Four of the countries excluded provided only two quarters of data for the period covered by the report, and one only provided notifications. The countries included reported 8143 laboratory-confirmed cases of meningococcal disease, giving an overall age standardised incidence rate of 1.8. For the core data set the standardised incidence rate was 2.4. A total standardised incidence rate was also calculated for all the laboratory-confirmed cases. The incidence rate was 1.7, a little lower than either the complete or core data sets. Incidence – Notifications and Laboratory data For laboratory confirmed cases the age standardised incidence rate for meningococcal disease in Europe for 1999/2000 (table 1) varied from 0.05 in Romania to 9.8 in the Republic of Ireland. The incidence rate increased in both the European core and complete data sets between 1998/99 and 1999/2000, from 2.1 to 2.4 (core), and from 1.7 to 1.8 (complete). Austria, France, Iceland, Malta, Northern Ireland, the Republic of Ireland, Scotland, Slovenia and Spain all had higher incidence rates than in 1998/99. The data for Spain cannot be directly compared with previous years’ data because a different source for laboratory confirmed cases was used in 1999/2000. Meningococcal Disease Incidence Rate by Country, Europe 1999/2000

5
Table 1. Meningococcal Disease by country, Europe 1999/2000 Number of Cases and Incidence
Laboratory Cases Notifications Age Age
Country Standard Standard Crude -ised Crude -ised Number Incidence Incidence Number Incidence Incidence
Austria * 93 1.2 1.2 Belgium * 281 2.8 2.8 Croatia 58 1.2 1.2 Czech Republic * 77 0.7 0.7 Denmark † 28 1.1 - England & Wales * 2798 5.4 5.1 Estonia 8 0.5 0.5 Finland 47 0.9 0.9 France * 498 0.9 0.9 Germany * 415 0.5 0.6 Greece * 139 1.4 1.3 264 2.6 2.7 Iceland * 21 7.8 6.6 Israel *† 25 0.6 - Italy 230 0.4 0.4 Latvia 13 0.5 0.4 21 0.8 1.0 Lithuania 14 0.4 0.4 70 ‡ 1.9 n/a Malta 29 7.9 6.9 Netherlands * 551 3.6 3.5 Northern Ireland 137 8.3 6.8 114† 6.9 5.9 Norway * 83 1.9 1.8 Poland 51 0.1 0.1 Republic of Ireland * 457 13.0 9.8 554 15.7 12.6 Romania 11 0.05 0.05 172 ‡ 0.8 n/a Russia Moscow † 57 1.0 - Scotland * 381 7.4 7.1 Slovak Republic * 67 1.2 1.1 72 1.3 1.2 Slovenia * 7 0.4 0.3 8 0.4 0.4 Spain * 1561 4.0 4.0 Sweden † 24 0.5 - Switzerland 176 2.4 2.6
Total 8279 1.8 1.7 1333 - -
Complete data § 8143 1.9 1.8
Core data 7380 2.4 2.4
* Member of core data set (16 countries) † Number of cases two quarters out of four only. IR is estimate for four quarters. No
standardised value available. ‡ Complete age data not available so not possible to standardise. § 25 countries

6
Clinical Diagnosis and Case Fatality Rate The ratio of septicaemia to meningitis showed considerable variation between countries, which may be due to diagnostic convention or real differences. Overall, the clinical presentation was 40% meningitis alone, 41% septicaemia alone and 16% a combination of both. 1% (86 cases) were designated “meningitis/septicaemia not specified”. Of the remaining cases, 2% (130 cases) had a stated clinical diagnosis. These included 13 cases of arthritis, 11 cases of conjunctivitis, 5 cases of otitis, and 3 cases of pneumonia, with the remaining cases designated “other”. Nine cases recorded as purpura were re-coded as septicaemia. For laboratory confirmed data the case fatality rate for “meningitis only” was 6.1% (141 fatalities), for “septicaemia only” 7.6% (179 fatalities) and for cases of combined septicaemia and meningitis 6.5% (59 fatalities). The rate for those “not specified” was 1.2% and for “other” 8.5%. The overall CFR for laboratory confirmed cases was 6.9%. 3.2 Age The age distribution shown by core data set countries (figure 1 and Table 2) was as expected, with the main peak in infancy. The secondary teenage peak was still present. From 1998/99 to 1999/2000 the incidence rate increased in most age groups. This increase ranged from 8% for 10 to 14 years to about 50% for 25 to 44 years. The increase in the 15–19 year olds was only 9% compared with an overall increase of 14%. Increases of 21% in incidence in those aged 1-11 months, and of 20% in 1–4 year olds are more important because of the large numbers in these age groups. How Representative is the Complete Group? The core group represents greater completeness and continuity of reporting. The overall incidence of meningococcal disease in the core group is possibly nearer the true incidence in Europe than the complete group. Nevertheless A comparison of the age distributions in the two sets of data can be used to assess how representative reports are from countries not in the core group. These show (figure 1) that the ratio of core/complete incidence rates in each age group is consistently 1.4 – 1.5. The exceptions are those aged under 1 month (1.2) in which the complete group is slightly over represented (and this may be real), and 20 to 24 year olds (1.3) Thus although the incidence in the core-group countries is consistently higher, the age distributions are similar in the two groups.
Table 2. Incidence Rate of Laboratory Confirmed Cases of Meningococcal Disease in the Core Data Set, by Age, for 1997/98,1999/99 and 1999/2000
<1 1 to 11 1 to 4 5 to 9 10 to 14 15 to 19 20 to 24 25 to 44 45 to 64 65+ Overall month months years years years years years years years years
1999/00 5.6 38.6 14.4 4.6 2.8 4.7 1.7 0.6 0.7 0.7 2.4 1998/99 6.2 31.8 12.0 3.5 2.6 4.3 1.5 0.4 0.5 0.6 2.1 1997/98 3.8 21.2 8.3 3.0 1.8 2.9 1.2 0.3 0.3 0.4 1.5

7
Figure 1. Incidence of Laboratory Confirmed Cases of Meningococcal Disease in Europe 1999/2000 by Age Group
Figure 2. Distribution (%) of Laboratory Confirmed Cases of Meningococcal Disease in Europe 1999/2000 by Age Group,
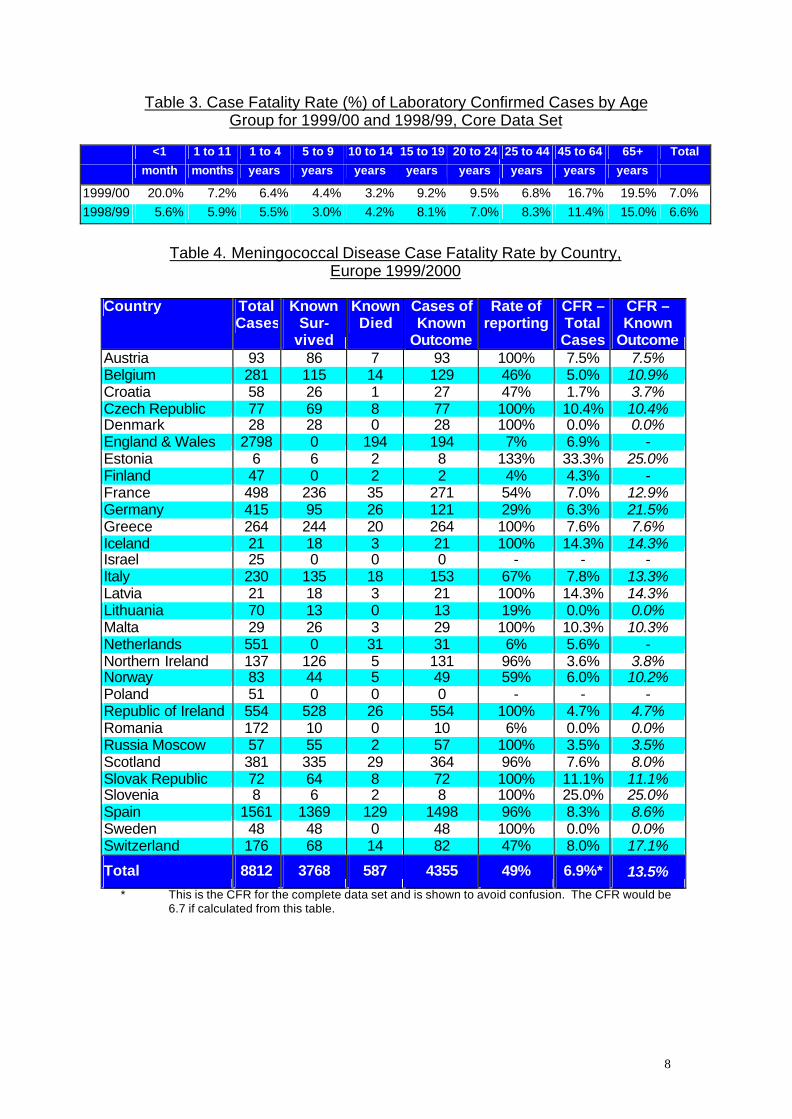
3.3 Case Fatality Rate As in previous years the case fatality rate (CFR) increased with age (table 3 and Figure 3). A J-shaped pattern was more prominent this year than in previous years. Case fatality rates have to be interpreted with caution. Overall, the outcome was reported in 49% of the cases (table 4). The reported CFR for Europe in 1999/2000 was higher than in 1998/99, at 6.9% for the complete data and 7.0% for the core data set. For some countries only two quarters' data were provided. Between countries considerable variation was seen in the CFR. The rate where outcome was known varied from 3.5% in Russia Moscow, through 14.3% in Iceland and Latvia, to more than 20% in Germany. The rate was also higher than 20% in Estonia and Slovenia, though these are both countries with small numbers of cases. High case fatality rates may reflect better reporting of more severe cases, while very low rates may indicate that some deaths occurred after diagnosis was made and the case reported.
8
Table 3. Case Fatality Rate (%) of Laboratory Confirmed Cases by Age
Group for 1999/00 and 1998/99, Core Data Set
<1 1 to 11 1 to 4 5 to 9 10 to 14 15 to 19 20 to 24 25 to 44 45 to 64 65+ Total
month months years years years years years years years years
1999/00 20.0% 7.2% 6.4% 4.4% 3.2% 9.2% 9.5% 6.8% 16.7% 19.5% 7.0% 1998/99 5.6% 5.9% 5.5% 3.0% 4.2% 8.1% 7.0% 8.3% 11.4% 15.0% 6.6%
Table 4. Meningococcal Disease Case Fatality Rate by Country,
Europe 1999/2000
Country Total Cases
Known Sur-
vived
Known Died
Cases of Known
Outcome
Rate of reporting
CFR – Total Cases
CFR – Known
Outcome Austria 93 86 7 93 100% 7.5% 7.5% Belgium 281 115 14 129 46% 5.0% 10.9% Croatia 58 26 1 27 47% 1.7% 3.7% Czech Republic 77 69 8 77 100% 10.4% 10.4% Denmark 28 28 0 28 100% 0.0% 0.0% England & Wales 2798 0 194 194 7% 6.9% - Estonia 6 6 2 8 133% 33.3% 25.0% Finland 47 0 2 2 4% 4.3% - France 498 236 35 271 54% 7.0% 12.9% Germany 415 95 26 121 29% 6.3% 21.5% Greece 264 244 20 264 100% 7.6% 7.6% Iceland 21 18 3 21 100% 14.3% 14.3% Israel 25 0 0 0 - - - Italy 230 135 18 153 67% 7.8% 13.3% Latvia 21 18 3 21 100% 14.3% 14.3% Lithuania 70 13 0 13 19% 0.0% 0.0% Malta 29 26 3 29 100% 10.3% 10.3% Netherlands 551 0 31 31 6% 5.6% - Northern Ireland 137 126 5 131 96% 3.6% 3.8% Norway 83 44 5 49 59% 6.0% 10.2% Poland 51 0 0 0 - - - Republic of Ireland 554 528 26 554 100% 4.7% 4.7% Romania 172 10 0 10 6% 0.0% 0.0% Russia Moscow 57 55 2 57 100% 3.5% 3.5% Scotland 381 335 29 364 96% 7.6% 8.0% Slovak Republic 72 64 8 72 100% 11.1% 11.1% Slovenia 8 6 2 8 100% 25.0% 25.0% Spain 1561 1369 129 1498 96% 8.3% 8.6% Sweden 48 48 0 48 100% 0.0% 0.0% Switzerland 176 68 14 82 47% 8.0% 17.1%
Total 8812 3768 587 4355 49% 6.9%* 13.5% * This is the CFR for the complete data set and is shown to avoid confusion. The CFR would be
6.7 if calculated from this table.

9
Figure 3. Fatality Rate of Meningococcal Disease in Europe 1999/2000 by Age Group, Complete Data Set
3.4 Serogroups Serogroup B and C disease together accounted for 95% of cases in Europe (table 5), with serogroup B predominant (63% of grouped strains). The proportion of serogroup C isolated varied by country (tables 5 and 6). Countries with 40% serogroup C or higher included Iceland, Northern Ireland, Russia (Moscow), the Slovak Republic, Spain and Switzerland. Compared with 1998/99 this represents an important change for Spain and Switzerland. Countries with less than 20% serogroup C strains were Austria, Denmark, Israel, Italy, the Netherlands and Norway. All these countries had correspondingly high proportions of serogroup B strains, except for Israel where 20% of the grouped cases were attributable to serogroup Y. In previous years (since 1996), in both the Czech and Slovak Republics, serogroup C predominated. This year, for the first time since our reports began, the Czech Republic has converted to the European pattern. Serogroup A accounted for only 0.3% of the total cases in Europe, but in Greece, Romania (small numbers) and Moscow it accounted for more than 10% of their cases. Likewise, serogroup Y comprised a small percentage of the total (1.3%), but accounted 20% of cases in Israel. England and Wales, France, Germany and the Netherlands each had more than 10 cases of serogroup W135 infection. The case fatality rate for each serogroup varied. Serogroup A had the highest rate (14.3%) followed by W135 (10.8%), C (8.0%) and Y (4.5%). Serogroup B had the lowest rate (4.3%).
Table 5. Countries with >40% Serogroup C - Last Three Reporting Periods
1997/98 1998/99 1999/2000 Czech Republic (59%) Czech Republic (55%) Iceland (53%) Greece (49%) Estonia* (62%) Russia (Moscow) (44%) Iceland (52%) Iceland (50%) Slovak Republic (62%) Scotland (47%) Scotland (52%) Switzerland (61%) Slovak Republic (78%) Slovak Republic (74%) Spain (45%) Switzerland (46%) * 2 out of 3 cases

10
Table 6. Serogroup Distribution by Country, Europe 1999/2000
A B C NGA W135 Y Other Total
Austria 67 77% 16 18% 1 1% 1 1% 2 2% 87 Belgium 179 67% 80 30% 3 1% 3 1% 1 <1% 266 Czech Republic 42 66% 21 33% 1 2% 64 Denmark 23 82% 5 18% 28 England & Wales 1 <1% 1628 61% 891 34% 1 <1% 96 4% 28 1% 6 <1% 2651 Estonia 3 100% 3 Finland 27 60% 12 27% 1 2% 3 7% 2 4% 45 France 2 <1% 313 67% 100 21% 2 <1% 40 9% 10 2% 1 <1% 468 Germany 280 68% 102 25% 3 1% 13 3% 15 4% 1 <1% 414 Greece N 7 11% 38 58% 15 23% 1 2% 4 6% 65 Iceland 9 47% 10 53% 19 Israel 15 60% 3 12% 1 4% 5 20% 1 4% 25 Italy 74 71% 30 29% 104 Latvia N 5 56% 3 33% 1 11% 9 Lithuania N 3 60% 1 20% 1 20% 5 Malta 11 69% 1 6% 2 13% 2 13% 16 Netherlands 429 78% 97 18% 16 3% 4 1% 2 <1% 548 Northern Ireland 71 53% 53 40% 9 7% 1 <1% 134 Norway 62 77% 10 12% 1 1% 4 5% 4 5% 81 Poland 37 74% 10 20% 3 6% 50 Republic of Ireland N 278 61% 167 37% 7 2% 2 <1% 3 1% 457 Romania 2 18% 6 55% 3 27% 11 Russia Moscow 5 14% 15 42% 16 44% 36 Scotland 126 57% 84 38% 1 <1% 6 3% 3 1% 2 1% 222 Slovak Republic N 19 32% 39 66% 1 2% 59 Slovenia N 4 57% 1 14% 2 29% 7 Spain 2 <1% 591 59% 398 40% 15 1% 1006 Sweden 11 50% 6 27% 5 23% 22 Switzerland 45 33% 82 61% 5 4% 3 2% 135
Total 19 <1% 4411 63% 2253 32% 33 <1% 203 3% 89 1% 29 <1% 7037
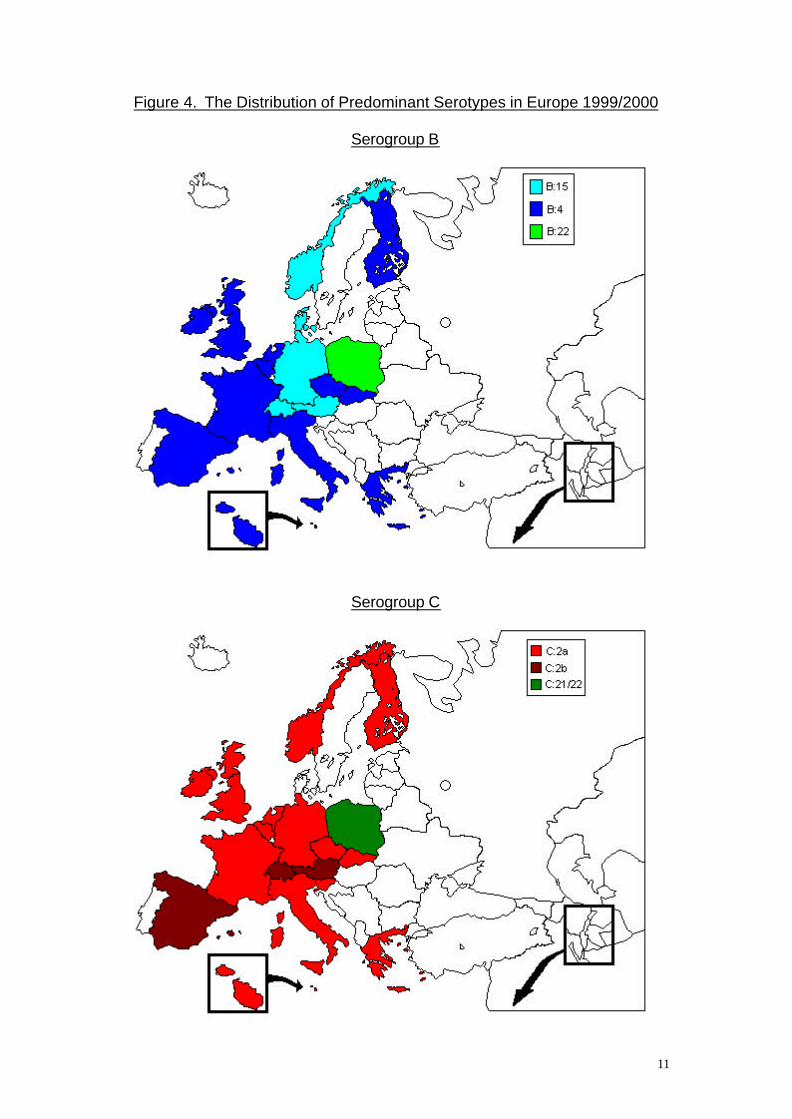
USA 6 1% 216 31% 204 29% 6 1% 17 2% 224 32% 32 5% 705 N Notification data 3.5 Predominant Serotype and Strains In the countries that provided data on serotypes (table 7) type B: 4 was the most reported overall of serogroup B, followed by B: 15. Type C: 2a was the most reported overall of serogroup C, followed by C: 2b. The country where this was not the case was Poland, where the most numerous serogroup B type was B: 22. Also the only C types isolated in Poland were C: 22 and C: 21. The predominant serotypes of serogroups B and C are shown geographically (figure 4). Of the other serogroups only W135 and Y generated subtyped isolates in any significant number. The most reported subtypes were W135: 2a (n = 71) and Y: 14 (n = 35), and the most reported strains were W135: 2a: P1.2, 5 (n = 62) and Y: 14: P1.5 (n = 13). All the main serogroups had a predominant sero/subtype combination strain (table 7). These were B: 4: P1.4, C: 2a: P1.5, W135: 2a: P1.2, 5 and Y: 14: P1.5 respectively. The predominant strain for serogroups B and C varied between countries (table 8).
11
Figure 4. The Distribution of Predominant Serotypes in Europe 1999/2000
Serogroup B
Serogroup C

12
Table 7. Top Five Overall Most Numerous Meningococcal Strains for Serogroup B, Serogroup C and Other Serogroups, Europe 1999/2000
Serogroup B Serogroup C Other Serogroups Strain No. Strain No. Strain No. 1 B: 4: P1.4 518 C: 2a: P1.5 352 W135: 2a: P1.2,5 62 2 B: 15: P1.7,16 152 C: 2a: P1.2,5 237 Y: 14: P1.5 13 3 B: 4: P1.15 121 C: 2b: P1.2,5 167 W135: 2a: P1.2 5 4 B: 1: P1.14 46 C: 2a: P1.2 58 Y: 14: P1.2,5 5 5 B: 4: P1.10 35 C: 2b: P1.2 23 Y: 4: P1.4 3
Table 8. Most Numerous Meningococcal Serotypes and Strains by Country, Europe 1999/2000
Serogroup B Serogroup C Country Type n Strain n Type n Strain n Austria 15 23 B: 15: P1.7,16 16 2b 7 C: 2b: P1.2 3
Belgium 4 105 B: 4: P1.4 62 2a 35 C: 2a: P1.2,5 22
Czech Republic 4 10 B: 4: P1.15 5 2a 11 C: 2a: P1.2,5 9
Denmark 15 13 No subtyping
England & Wales 4 356 B: 4: P1.4 213 2a 385 C: 2a: P1.5 205
Finland 4 7 B: 4: P1.4 2 2a 2 C: 2a: P1.5 2
B: 2a: P1.2,5 2
France 4 37 B: 15: P1.7,16 17 2a 15 C: 2b: P1.2 6
Germany 15 72 B: 15: P1.7,16 37 2a 33 C: 2b: P1.2,5 20
Greece 4 9 B: 4: P1.14 4 2a 10 C: 2a: P1.2 3
Italy 4 18 B: 4: P1.13 8 2a 12 C: 2a: P1.5 10
B: 14: P1.13 8
Malta 4 7 B: 4: P1.15 4 2a 1 No subtyping
Netherlands 4 270 B: 4: P1.4 142 2a 65 C: 2a: P1.5 30
Northern Ireland 4 7 B: 4: P1.4 6 2a 25 C: 2a: P1.5 14
Norway 15 27 B: 15: P1.7,16 10 2a 7 No most numerous
Poland 22 6 B: 22: P1.14 3 21 1 No most numerous
22 1
Republic of Ireland 4 38 B: 4: P1.4 24 2a 52 C: 2a: P1.2,5 29
Scotland 4 18 B: 4: P1.4 13 2a 45 C: 2a: P1.5 34
Slovak Republic 4 4 B:4:P1.15 2 2a 31 C: 2a: P1.2,5 17
Slovenia 2a 1 No subtyping
Spain 4 51 B: 4: P1.15 38 2b 48 C: 2b: P1.2,5 39
Switzerland 15 11 B: 15: P1.7,16 4 2b 47 C: 2b: P1.2,5 41
3.6 Antibiotic Resistance For this report 19 countries provided resistance data (table 9). Eighteen countries provided data on penicillin, fifteen on rifampicin and thirteen on sulphonamide. As in the previous report, only a handful of samples in a small number of countries tested as resistant to either penicillin or rifampicin. Resistance to penicillin was only shown in five of the eighteen reporting countries while resistance to rifampicin only appeared in one. The European

13
figures for penicillin, rifampicin and sulphonamide resistance were similar to those for 1998/99.
Table 9. Percentage of Resistant Meningococcal Isolates to Penicillin, Rifampicin and Sulphonamide by Country, Europe 1999/2000
Country Penicillin Rifampicin Sulphonamide
N n % n % n % Austria 70 0 - 0 - 56 80.0 Belgium 263 0 - 0 - 98 37.3 Czech Republic 58 0 - 0 - 12 20.7 Denmark 28 3 10.7 n/a 22 78.6 Germany 415 2 0.5 4 1.0 n/a Greece 48 0 - 0 - 42 87.5 Iceland 19 0 - 0 - 7 36.8 Israel 24 0 - 0 - n/a Italy - 1/18 5.3 0/20 - 4/15 26.7 Latvia 2 0 - n/a n/a Lithuania - 1/9 11.1 0/3 - 1/1 100 Netherlands 545 0 - 0 - n/a Poland 51 0 - 0 - n/a Republic of Ireland 133 n/a n/a 21 15.0 Romania 11 0 - 0 - 11 100 Scotland 148 0 - 0 - 21 15.0 Slovenia 6 0 - 0 - 3 50.0 Spain 207 0 - 0 - 168 81.2 Sweden 22 1 4.5 n/a 11 50.0 Switzerland 133 8 6.0 0 - n/a
Totals: 1999/2000 16 * 0.8 4 † 0.2 477 ‡ 47.3
Totals: 1998/99 0.8 0.2 48.3 * Nineteen countries used for total † Sixteen countries used for total ‡ Thirteen countries used for total n/a no data available NB: Italy - 1 case out of 18 tested showed resistance to penicillin, 0 cases out of 20 showed resistance to rifampicin and 4 cases out of 15 tested showed resistance to sulphonamide.
Lithuania - 1 case out of 9 tested showed resistance to penicillin, 0 cases out of 3 showed resistance to rifampicin and 1 case out of 1 tested showed resistance to sulphonamide. 4. Results: Haemophilus influenzae and Pneumococcal
Meningitis Eight countries reported H. influenzae and pneumococcal meningitis case data. One country reported only H. influenzae data and one country reported only pneumococcal data. Some of the data are incomplete, as in previous years. The incidence rate for H. influenzae meningitis ranged from 0.02 in Norway to 0.70 in Slovenia. The incidence rate for pneumococcal meningitis ranged from 0.07 in Poland to 1.06 in the Netherlands. Four deaths were

14
reported from H. influenzae meningitis (CFR 3.4%), and twenty-seven deaths were reported from pneumococcal meningitis (CFR 6.8%). Most cases of pneumococcal and H. influenzae meningitis reported by each country occurred in the 1st and 2nd quarters of 1999 (table 10). The age distribution of the H. influenzae cases showed a characteristic peak in children aged 1 to 4 years in this period. Again there was a larger percentage of cases in children aged 1 to 11 months than in the previous period. In a similar pattern to the previous period more than 75% of H. influenzae meningitis cases occurred in children less than 5 years of age (figure 5). Around two thirds of the pneumococcal meningitis cases reported occurred in adults over 24 years of age. Most of the remaining pneumococcal cases (22%) were in children aged less than 5 years (figure 6). Twenty-six H. influenzae meningitis isolates were confirmed as type b, with 1 case each confirmed as types e, f and non-b. 182 cases of pnumococcal meningitis isolates had their serogroup confirmed. Twenty-four different serogroups were identified (figure 7).
Table 10. Combined Laboratory Confirmed and Notified Cases of Haemophilus influenzae and Pneumococcal Meningitis, Europe 1999/2000
1999 2000 Total Crude
3rd 4th 1st 2nd Cases Incidence Haemophilus Influenzae Greece 1 0 3 0 4 0.04 Italy 11 20 - - 31 0.05 Netherlands * 4 0 8 8 20 0.13 Norway 0 1 - - 1 0.02 Poland 5 5 7 5 22 0.06 Republic of Ireland * 2 0 - - 2 0.06 Russia Moscow 6 5 - - 11 0.13 Slovak Republic 6 2 1 3 12 0.22 Slovenia 4 10 - - 14 0.70 Pneumococcal Meningitis Greece 6 15 21 5 47 0.46 Iceland 1 0 - - 1 0.37 Italy 15 61 - - 76 0.13 Netherlands 24 - 84 56 164 1.06 Poland 3 5 12 6 26 0.07 Republic of Ireland 2 6 - - 8 0.23 Russia Moscow 17 17 - - 34 0.39 Slovak Republic 9 8 13 6 36 0.67 Slovenia 2 2 - - 4 0.20 * Routine Hib vaccination programme in this country.

15
Figure 5. Age Distribution (%) of Haemophilus influenzae Meningitis Cases, Europe 1999/2000
Figure 6. Age Distribution of Pneumococcal Meningitis Cases, Europe 1999/2000
Figure 7. Number of Pneumococcal Meningitis Cases reported by Confirmed Serogroup, Europe 1999/2000

16
Contributors: Dr. Elveta Mastori, Albania Dr. John Tapsall, Australia Dr. Sigrid Heuberger, Austria Dr. Fransoise Carion, Belgium Ass. Prof. Irina Haydouchka, Bulgaria Prof. Hu Xujing, China Prof. Berislav Borcic, Croatia Dr. Miguel Suarez Hernandez, Cuba Dr. Paula Kriz, Czech Republic Dr. Steen Hoffmann, Denmark Dr. Mary Ramsay, England and Wales Dr. Unna Joks, Estonia Dr. Petri Ruutu, Finland Dr. Muhamed-Khier Taha, France Dr. Jean-Michel Alonso, France Dr. Ingrid Erhard, Germany Dr. Georgina Tzanakaki, Greece Dr. Jenny Kremastinou, Greece Dr. Ilona Straub, Hungary Dr. Hjordis Hardardottir, Iceland Dr. Colin Block, Israel Dr. Stefania Salmaso, Italy Dr. Aija Griskevica, Latvia Dr. Dalia Rokaite, Lithuania Dr. Mark Muscat, Malta Dr. Mohamed Benachir, Morocco Dr. Lodewijk Spanjaard, Netherlands Dr. Ilse Schuuman, Netherlands Dr. Diana Martin, New Zealand Dr. Susan Walker, New Zealand Dr. B. Smyth, Northern Ireland Dr. B. G. Iversen, Norway Prof. Waleria Hryniewicz, Poland Dr. Anna Skoczynska, Poland Prof. Maria da Graca Freitas, Portugal Dr. Darina O’Flanagan, Republic of Ireland Dr. Ileana Levenet, Romania Dr. Alexander Platonov, Russia Dr. Irina Koroleva, Russia Dr. Stuart Clarke, Scotland Dr. Edita Karelova, Slovak Republic Dr. Alenka Kraigher, Slovenia Dr. Rosa Cano Portero, Spain Dr. Julio Vasquez, Spain Dr. Per Olcen, Sweden Dr. Peter Helbling, Switzerland Dr. Elena Pagano, Switzerland Dr. Guldane Kabaday, Turkey Prof. Lyudmila Schostakovich-Koretskaya, Ukraine Dr. Mary Ramsay, United Kingdom Dr. Nancy Rosenstein, USA Contact Details Further tables of the data used for this report are available on request. The European Bacterial Meningitis Surveillance Project PHLS Communicable Disease Surveillance Centre 61 Colindale Avenue London NW9 5EQ United Kingdom Tel: +44(0) 208 2006868 Fax: +44(0) 208 2007868 The Internet address for the PHLS website is www.phls.co.uk .