Embed Size (px)
Citation preview
Surge-type glaciers:
controls, processes and distribution
Heïdi Sevestre
A thesis submitted for the degree of
Philosophiae Doctor (PhD)
July 2015
Arctic Geology
The University Centre in Svalbard
Department of Geosciences
University of Oslo
Series of dissertations submitted to the Faculty of Mathematics and Natural Sciences, University of Oslo No. 1671
Abstract
Glacier surging is an internally triggered instability. Surge-type glaciers periodically alternate between
long periods of slow flow (the quiescent phase) and short periods of fast flow (the surge phase).
Surging yields down-glacier transport of mass and often results in large and sudden glacier advances.
The surging phenomenon has always challenged the notion of normality in glacier flow dynamics.
The mechanisms of surging remain poorly understood. Observation of different surge behaviors
across the world has been used as evidence for the development of glacier type-specific surge
models that lack transferability and representativeness. Although only about 1% of the entire glacier
population has been observed to surge, the surge phenomenon questions the completeness of our
understanding of glacier dynamics.
This thesis uses different perspectives to gain a new understanding on the global, regional and
local controls on surging and reconcile the mechanisms of surging under a single model. Through a
geodatabase of surge-type glaciers, datasets of climate and glacier geometry variables and a global
distribution model we explore the controls on the non-random distribution of surge-type glaciers on
a global scale. The highest densities of surge-type glaciers are found in a well-defined climatic
envelope bounded by temperature and precipitation thresholds, while glacier geometry exerts a
second-order control on their distribution. We introduce the enthalpy cycle model which relates flow
oscillations to imbalances between enthalpy gains and losses. Enthalpy balance is satisfied outside of
the optimal surge envelope, in cold and dry or warm and wet regions. However, the intermediate
conditions of the optimal surge envelope prevent enthalpy balance to be reached, yielding dynamics
cycling of glacier flow.
Thermal switch models have been used to explain surging of polythermal glaciers. We
reconstruct the evolution of the thermal regime of six glaciers in Svalbard from existing and new
data. The large and thick surge-type glaciers of our sample do not return to a cold-based conditions
between surges, demonstrating that thermal switching cannot apply to surges of large glaciers in
Svalbard. On the other hand, the thin and mostly cold glaciers display evidence of former warm-
based thermal regimes, showing that switches in climate can make glaciers go in and out of surging.
We demonstrate that the concept of enthalpy cycling can explain surge and surge-like behavior in
Svalbard.
Finally, we investigate the role played by local controls on the initiation and development of
the surges of two large polythermal glaciers in Svalbard. First, passive seismics and DEM differencing
enabled the reconstruction of the chronology of events that led to the catastrophic surge of the
Nathorstbreen glacier system. Removal of backstress by the failure of the frozen glacier terminus

triggered the catastrophic collapse of one of the tributaries of the glacier system, source of unusual
seismic activity. Secondly, the upward propagating surge of Svalbard tidewater glacier
Aavatsmarkbreen is understood in terms of changes in the force balance. Glacier retreat and thinning
caused a rapid steepening of the glacier snout, which in turn increased the driving stresses
substantially. Development of crevasse fields during the late quiescent and surge phases allowed
transfer of surface meltwater to the bed, increasing basal water storage and causing ice acceleration.
The increase in driving stress and surface-to-bed drainage both contributed to basal enthalpy
production, and controlled the pattern of surge evolution.

Acknowledgements
Svalbard is a very special place. Whether it is the mighty glaciers, the windswept tundra, the polar
bears or the aurora, it is impossible not to fall in love with this place. But it is truly the people that
make Svalbard so unique. I feel grateful I got the chance to spend four magical years in the ‘bubble’
alongside the best companions I could have asked for. It is a pleasure to thank all of those who not
only have made this work possible but also made this journey unforgettable.
None of this would have been possible without the support of my supervisors and their precious
guidance. I would like to express my gratitude and sincere appreciation to Doug Benn. To work with
you has been a great honor, with heaps of fun and adventures. Thank you for being an awesome
supervisor and for your contagious enthusiasm throughout this research.
Jon Ove Hagen for always being available, and through SVALI and GlacioEx taking us to the most
amazing places on Earth and pretending it was all for work.
Nick Hulton, although not one of my ‘official’ supervisors, for being the best and most trustful field
companion. I’m grateful for all the things you had the patience to teach me.
The fieldwork accomplished during these four years is definitely the highlight of my time in Svalbard.
I would like to thank all the people who helped us out whether it required camping in -30°C for days,
driving hundreds of kilometers on a snowscooter at 15 km/h or walking along deep and nasty-looking
crevasses. I have learnt so much from you: Adrian Luckman, Bryn Hubbard, Jack Kohler, Faezeh Nick,
Penny How, Dorota Medrzycka, Chris Nuth, Sue Cook, Leo Decaux, Maria Temminghoff, Sebastian
Sikora, Silje Smith-Johnsen, Mats Björkman.
I cannot mention fieldwork without thanking the Logistics department at UNIS for allowing us to
collect the best possible field data: Fred Hansen, Martin Indreiten, Klas Hermansson, Sebastian
Sikora, Frede Lamo, Lars Frode Stangeland, Odd Magne Kvålshagen, Jukka Ikonen, Monica Votvik,
Kenneth Akseth.
I would like to thank Maggie Hagdorn for all his help and availability during my visit at the School of
Geosciences in Edinburgh, and Andrew Brown and David Kelly for their support during my visit at the
department of Geography and Earth Sciences at Aberystwyth University.

Tusen Takk to the people who make UNIS such a comfortable place to work. First of all, our current
managing director Ole Arve Misund, Hanne Christiansen and Riko Noormets as former and current
Head of the Department of Arctic Geology. Eva Therese Jenssen and Inger Lise Næss for giving me
plenty of occasions to share my enthusiasm about UNIS. Berit Jakobsen for being the friendliest and
most helpful librarian. This university would not be the same without the smiles and limitless help
from Venke Ivarrud, Sofia Mercadal and Jorge Kristiansen Robolledo
Finally, I would like to acknowledge my friends, as brilliant and passionate as they are. Thank you for
being my family from another latitude: Silvia, Teena, Alexander, Srikumar, David, Aleksandra,
Karoline, Sophie, Mark, Ingrid, Sarah, Jordan, Renat, Miriam, Sara, Archana, Sunil, Wes, Anne Elina,
Oscar, Anatoly, Graham, Lena, Martin, Thomas, Tatiana, Aleksey, Ingunn. Special thanks to my glacio
friends from other institutes: PiM, Thorben, Solveig, Désirée, Aga, Dorothée, and to Alexandra and
Penny for taking the time to proof read this work. Thank you Yann for bearing with me during all
these years. Through your endeavors and accomplishments you have been my biggest source of
inspiration.
Finally I would like to thank my family for their unconditional support, and weekly skype sessions to
show me the sun during the dark season, or the mountains and trees of my beloved Haute-Savoie. Je
souhaiterais tout spécialement remercier ma chère grand-mère (mamie kiki), pour avoir appris à
utiliser un ipad à l’âge de 90 ans afin de pouvoir partager mon quotidien, et moi le sien. C’est grâce à
votre soutient que j’ai pu aller au bout de cette aventure.
Longyearbyen, July 2015
1
Contents
Chapter 1: Introduction .......................................................................... 5
1.1 Motivation ........................................................................................................................... 5
1.2 Aims and objectives ............................................................................................................ 6
1.3 Outline ................................................................................................................................. 7
Chapter 2: Scientific background ............................................................ 9
2.1 How do glaciers flow? ......................................................................................................... 9
2.1.1 The force balance ......................................................................................................... 9
2.1.2 Ice deformation and fracturing .................................................................................... 9
2.1.3 Basal processes .......................................................................................................... 10
2.2 Balance velocities .............................................................................................................. 11
2.3 Glacial hydrology and its influence on glacier dynamics .................................................. 12
2.3.1 Water supply and plumbing system........................................................................... 12
2.3.2 Drainage systems and storage ................................................................................... 12
2.4 Ice temperature and thermodynamics ............................................................................. 14
2.4.1 Controls on ice temperature ...................................................................................... 14
2.4.2 Thermal regimes ........................................................................................................ 14
2.4.3 Feedback mechanisms between ice temperature and dynamics .............................. 16
2.4.4 Enthalpy ..................................................................................................................... 16
Chapter 3: Surge-type glaciers ............................................................... 19
3.1 Definition........................................................................................................................... 19
3.2 Distribution of surge-type glaciers and variations in surge behaviors ............................. 20
3.3 Identification of surge-type glaciers ................................................................................. 22
3.4 Controls on the distribution of surge-type glaciers: statistical studies ............................ 23
3.5 Surge models ..................................................................................................................... 24
3.5.1. The thermal switch mechanism ................................................................................ 24
3.5.2 The hydrologic switch mechanism ............................................................................. 25
CONTENTS
Chapter 4: Study areas ........................................................................... 27
4.1 Global analyses ................................................................................................................. 27
4.2 Regional analyses: the High Arctic archipelago of Svalbard ............................................. 28
4.2.1 Environmental settings .............................................................................................. 28
4.2.2 Glacier types and evolution since the Little Ice Age .................................................. 29
4.2.3 Surging in Svalbard ..................................................................................................... 30
4.2.4 Thermal regime of Svalbard glaciers .......................................................................... 31
4.3 Individual case studies ...................................................................................................... 33
Chapter 5: Material and methods .......................................................... 35
5.1 Compilation of the global geodatabase on surging .......................................................... 35
5.2 Investigating controls on global distribution of surge-type glaciers with Maxent ........... 36
5.3 Investigation of the thermal regime of surge-type glaciers in Svalbard ........................... 37
5.4 Remote sensing techniques .............................................................................................. 39
5.4.1 Extracting velocities from feature-tracking of TerraSAR-X images ............................ 39
5.4.2 Measuring elevation changes .................................................................................... 39
5.4.3 Crevasse mapping on SAR images .............................................................................. 40
5.5 Passive seismics ................................................................................................................ 41
Chapter 6: Summary of articles and key results ..................................... 43
Article I: Climatic and geometric controls on the global distribution of surge-type glaciers:
implications for a unifying model of surging .......................................................................... 43
Article II: Thermal structure of Svalbard glaciers and implications for thermal switch models
of glacier surging ..................................................................................................................... 45
Article III: Seismic detection of a catastrophic glacier surge .................................................. 47
Article IV: A tidewater glacier surge initiated at the terminus: Aavatsmarkbreen, Svalbard . 49
Chapter 7: Conclusions and future perspectives .................................... 51
Chapter 8: References ........................................................................... 53
3
Chapter 9: Peer-reviewed articles .......................................................... 63
9.1 Article I: Sevestre, H. and D.I. Benn (2015) Climatic and geometric controls on the global
distribution of surge-type glaciers: implications for a unifying model of surging. Journal of
Glaciology. Doi: 10.3189/2015JoG14J136 ......................................................................................... 65
9.2 Article II: Sevestre, H., Benn, D.I., Hulton, N.R.J., Baelum, K. (In Review) Thermal
structure of Svalbard glaciers and implications for thermal switch models of glacier surging. Journal
of Geophysical Research – Special Issue on Surging and Ice Streaming. .......................................... 85
9.3 Article III: Sevestre, H., Köhler, A., Benn, D.I., Nuth, C., Luckman, A., Weidle, C. (In Prep)
Seismic detection of a catastrophic glacier surge.. ......................................................................... 117
9.4 Article IV: Sevestre, H., Benn, D.I., Luckman, A., Nuth, A., Kohler, J., Lindbäck, K.,
Pettersson, R. (In Prep) A tidewater glacier surge initiated at the terminus: Aavatsmarkbreen,
Svalbard.. ......................................................................................................................................... 135

5
Chapter 1: Introduction
1.1 Motivation
Glaciers have been defined as ‘natural climate-meters’ in the IPCC Fifth Assessment report. They not
only act as passive indicators of climatic changes but also contribute actively to the global climatic
balance (IPCC, 2013). Observations have shown that glaciers across the world have been shrinking
since the end of the Little Ice Age, and that the rate of mass loss has been increasing since the 1980s
(Leclercq and others, 2011). Together with thermal expansion, glaciers have made a major
contribution to global sea level rise over the 21st century (Cazenave & Le Cozannet, 2014). There is
high confidence that glaciers and ice sheets will keep losing mass even without any further changes
in climate (Cubasch and others, 2013).
Estimations of future sea level rise suffer from two main issues. First, they are based on a small
proportion of the world’s glaciers, and second they rarely include a dynamic response of the glaciers
to changing climatic conditions. Improving the integration of glacier dynamics in future estimates of
glacier mass loss must therefore originate from a better understanding of glacier dynamics. Glacier
calving and glacier surging are at the crux of this challenge. While calving rates are predicted to make
an increasing contribution to sea level rise, directly related to increasing air and water temperatures,
surging glaciers behave in a more unpredictable way, and episodically discharge large volumes of ice
on land or in the oceans.
The surge phenomenon was defined by Kamb and others (1985) as one of the ‘outstanding
unsolved problems of glacier mechanics’, and remains so today. Several decades of studies have so
far been unsuccessful at identifying what makes glaciers surge. The study of glacier surging aims not
only to better understand the processes behind the unsteady flow of these glaciers but also requires
a comprehensive reassessment of the physical laws of glacier flow. Beyond investigating glacier
dynamics, the study of surging comprises numerous strands. The cyclic behavior of surge-type
glaciers, alternating between fast and slow flow, has often been compared to the unstable behavior
of ice streams (Clarke, 1987 ; Bindschadler, 1997). Surging of ice streams is thought to have played a
major role in extension of palaeo ice sheets (Boulton and others, 1977 ; Andreassen and others,
2014).
The behavior of surging glaciers is characteristically decoupled from climate trends. Still today
in a period of global glacier recession, glaciers surge in many parts of the world. Surging glaciers
complicate the investigation of glacier response to climate variability. The hazards that surging
glaciers represent are non-negligible. Although they tend to surge regularly, predicting the
7
comparing the evolution of the thermal structure of a representative set of Svalbard glaciers, the
processes taking place throughout the surge cycle are questioned. The investigation of small and
thin, large and thick, tidewater and land-terminating glaciers could reveal whether glaciers can
switch in and out of surging cycling in response to climatic changes.
Finally, the processes taking place during two recent surges in Svalbard are studied using a
variety of techniques. Passive seismics and elevation differencing allow the reconstruction of the
chronology of events that led to the large surge of the Nathorstbreen glacier system. The aim is to
assess the role played by changes in the force balance in the triggering and development of a surge,
and to show how passive seismics can provide a unique insight into the mechanisms of surging. In a
second example, the surge of a tidewater glacier is monitored through feature-tracking of SAR
imagery, combined with measurements of elevation changes, crevasse mapping and calculation of
the driving stress. This approach aims to uncover the mechanisms taking place during the upward
propagating surges of tidewater glaciers in Svalbard.
1.3 Outline
An overview of the thesis is provided in Chapter 1, followed by the relevant theoretical background
in Chapter 2. Chapter 3 focuses on the definition, distribution and characteristics of surge-type
glaciers, along with details of the main surge models. As this work assesses surging both on a global
and regional perspective, Chapter 4 follows this progression: in a first part we review the global
distribution of surge-type glaciers and variations in surge characteristics across regions, and secondly
we introduce the archipelago of Svalbard, home to the densest cluster of surge-type glaciers on
Earth. The main techniques used for this work are described in Chapter 5. Chapter 6 summarizes the
four articles included in this thesis. Chapter 7 concludes this work and suggests future work
perspectives. References can be found in Chapter 8.
Finally, Chapter 9 displays the four articles included in this thesis in their entirety: Article I:
Sevestre, H. and D.I. Benn (2015) Climatic and geometric controls on the global distribution of surge-
type glaciers: implications for a unifying model of surging. Journal of Glaciology ; Article II: Sevestre,
H., Benn, D.I., Hulton, N.R.J., Baelum, K. (In Review) Thermal structure of Svalbard glaciers and
implications for thermal switch models of glacier surging. Journal of Geophysical Research – Special
Issue on Surging and Ice Streaming ; Article III: Sevestre, H., Köhler, A., Benn, D.I., Nuth, C., Luckman,
A., Weidle, C. (In Prep) Seismic detection of a catastrophic glacier surge and Article IV: Sevestre, H.,
Benn, D.I., Luckman, A., Nuth, A., Kohler, J., Lindbäck, K., Pettersson, R. (In Prep) A tidewater glacier
surge initiated at the terminus: Aavatsmarkbreen, Svalbard.

1. INTRODUCTION
occurrence of a surge still remains elusive. The advance of a surging glacier can result in river
damming and disruption to roads, trails, snowmobile routes, etc. Large quantities of ice discharged
on land or in the ocean represent a significant danger, particularly in coastal areas and where dense
maritime traffic occurs. The end of the surge phase is often marked by the release of huge volumes
of turbid water causing floods and destruction. Predicting the occurrence of surges could improve
protection of communities and traffic.
Many questions remain partially or completely unanswered in the study of surging. To build on
Jiskoot (1999), some of the main issues that need further addressing concern the controls on surging
and the mechanisms taking place before, during and after a surge:
What are the controls on the global distribution of surge-type glaciers?
Why, within the same cluster, some glaciers surge while others do not?
What role does climate play in the distribution and occurrence of surges?
Can one surge mechanism be applied to all surge-type glaciers, regardless of their thermal
regime?
Can normal glaciers become surge-type glaciers, and vice versa?
What is the role of thermal regime in the surges of polythermal glaciers in the Arctic?
Why do tidewater glaciers surge differently from that of land-terminating glaciers?
What is the surge trigger?
This thesis aims to tackle these issues by taking a novel approach in the study of the surge
phenomenon.
1.2 Aims and objectives
Investigating the controls on the non-random distribution of surge-type glaciers could unlock a new
understanding of the surge phenomenon. This work aims to identify these controls by using a global
inventory of surge-type glaciers, along with global datasets of modelled climatic data and
information on glacier geometry. The climatic distribution of surge-type glaciers and geometry
properties across the climatic spectrum could lead to the launch a new theory as to why glaciers
surge in some parts of the world, while they do not surge in other regions.
Secondly, this work aims to test and evaluate the thermal switch mechanism, which is
typically used to explain surges of polythermal glaciers in Svalbard and other Arctic regions. By

9
Chapter 2: Scientific background
The uniqueness of surge-type glaciers can only be grasped if the characteristics and processes of
‘normal’ glacier flow are reviewed first. Basics of glacier flow are defined in section 2.1, before
moving on to the concept of balance velocities in section 2.2. Glacial hydrology and water storage are
described in section 2.3. Finally, section 2.4 focuses on ice temperature and thermodynamics.
2.1 How do glaciers flow?
2.1.1 The force balance
Glacier flow is a matter of balance between stresses that drive the flow and stresses that acts against
it. All glaciers move under their own weight, or more particularly under the horizontal gradient in
gravitational potential, called the driving stress. In equilibrium, the driving stress is balanced by
resisting stresses, namely the basal shear stress (that acts along a surface, in this case the bed),
lateral drag (on the glacier's sides) and the longitudinal stress gradients. Basal drag can be negligible
in the case of ice shelves, or ice streams, where most of the resistance occurs at the sides.
Longitudinal stress gradients exert pushes or pulls, driving or resisting the flow. In the force balance,
the efficiency of the driving stress at driving the flow is compared to that of the resisting stresses at
restricting it. The force balance of a glacier in equilibrium is zero.
2.1.2 Ice deformation and fracturing
Under stresses, ice either deforms or fractures. Fracturing occurs when the strength of the ice is
overcome by pulling stresses. It is a major process in the flow of tidewater glaciers, ice shelves and
ice streams. Ice creep, on the other hand, is a much more widespread and efficient process of ice
motion.
The structure of a crystal of ice can be compared to a deck of card. Molecules can easily glide
on top of each other when deformation occurs along the crystal basal planes. However non-basal
plane glide requires much higher stresses, and is often referred to as ‘hard glide’. Linear defects in
the structure are thought to largely facilitate slip along basal planes. Under stress, polycrystalline ice
responds by creeping. In addition to movements of dislocations within crystals and glide of the
crystals on top of one another, crystal growth and recrystallization also contribute to ice
deformation.

2. SCIENTIFIC BACKGROUND
(Eq. 1)
Flow laws relate the rate of ice deformation to stress. They are essential to model flow dynamics and
in the study of many glaciological mechanisms. Glen's flow law, today's most widely employed flow
law is based on extensive laboratory experiments (Glen, 1955). It quantifies the rate of ice
deformation at the secondary creep phase, and relates a dominant shear stress to the rate of ice
deformation . It must be acknowledged that Nye (1957) made the first applications of the power
law, which led to the subsequent adoption of the following form:
where is the basal shear stress, and the effective stress that incorporates all the stress
components. Parameter is defined as the exponent. Its value is governed by the creep mechanism
operating. Results from laboratory experiments point to a value of 3. Rate parameter relates to the
viscosity of the ice. Its value can be calculated by the Arrhenius relation (Hooke, 1981), and relates to
the ice temperature, fabric, water content, density and grain size. One of the main implications of
Glen's flow law is that ice does not deform linearly in response to stress. It is a distinct property of
non-Newtonian (or non-linear viscous) materials. In addition, it only relates stress to strain rate; a
more general constitutive relation would also include fracturing and elastic deformation.
2.1.3 Basal processes
Basal motion occurs by a combination of ice creep, sliding and deformation of the substrate. As
challenging as the investigations of subglacial processes can be, large advances were made using
subglacial laboratories and by studying recently deglaciated areas.
By observing that the presence of protuberances over hard beds was not preventing the flow
of glaciers, Weertman (1957) described two processes by which ice can move over and around bed
bumps: regelation and enhanced creep. Regelation (or re-freezing) occurs around small obstacles.
High pressures on the upstream side of bumps cause a lowering of the pressure melting point. Ice
ultimately melts, and meltwater travels to areas of lower pressure on the downstream side of
bumps. There, the pressure melting point is raised and ice refreezes. Latent heat thus released is
conducted through the obstacle and further enhances ice melt upstream (Weertman, 1964 ;
Lliboutry, 1968 ; Lliboutry, 1987 ; Kamb, 1970). Field observations by Kamb and Lachapelle (1964)
and Cohen (2000) have confirmed the occurrence of regelation. Enhanced creep relates to the
changes in ice viscosity in response to conductive stresses. These stresses are high on the upstream
2.1 How do glaciers flow?
11
side of large bumps, lowering the viscosity of the ice, and increasing (in a non-linear fashion)
deformation rates.
The size of the obstacle determines the favored process. As the transfer of latent heat is more
efficient on small bumps than on large obstacles, Weertman (1964), Nye (1969, 1970) and Kamb
(1970) were able to define a critical obstacle size of 0.5 m below which regelation occurs, and
otherwise enhanced creep is favored. Although as suggested by Lliboutry (1993), the two
mechanisms undoubtedly work in combination.
Short-term and significant variations of velocity observed by Iken and Bindschadler (1986) exposed
the incompleteness of Weertman's theory of sliding. Processes other than ice deformation and
changes in driving stress must be taking place at the bed. Lliboutry (1968) was the first to observe the
formation of cavities at the interface between ice and a rough bed. Cavities forming on the lee side
of obstacles can be filled with water, reducing basal drag. They expand when more water is delivered
than can be discharged, and decoupling occurs when the water pressure exceeds the ice overburden
pressure. The driving stress is then only supported in areas where the ice is in contact with the bed.
Glacier flow over a soft bed is radically different. Substrate deformation and sliding (ploughing) over
the till can contribute to ice flow. Boulton (1979) and Boulton and Hindmarsh (1987) showed that in
Iceland, deformation of the top few centimeters of the substrate was contributing from 80% to 90%
of the ice motion. The Boulton-Hindmarsh model states that the strain rate of granular materials
increases as the basal drag becomes more important that the yield strength of that material, but
decreases as basal water pressures top the ice overburden pressures. On the other hand, Kamb
(1991), and Engelhardt and others (1990) showed that under Ice Stream B, the till failed completely
past a threshold in applied shear stress (Coulomb-plastic rheology).
Water plays a central role in till deformation and sliding of ice over its substrate. Low water
pressures encourage ice infiltration in the pore spaces of the substrate. To the contrary, high water
pressures prevent infiltration and allow ice to slide over the substrate.
2.2 Balance velocities
Glaciers constantly have to balance rates of accumulation and ablation, and variations in their force
balance. They naturally tend to modulate their flow velocity in order to match mass gain up-glacier
with mass loss downstream, and therefore maintain a more or less fixed geometry over long time
scales. This outlines the concept of balance velocity. High turnover glaciers typically found in wet
maritime environments tend to have higher balance velocities than glaciers in more continental,
2. SCIENTIFIC BACKGROUND
drier and cooler regions. Balance velocities are also strongly influenced by the glacier geometry.
Glaciers with large catchments and narrow outlets will tend to flow faster. Thermal regime, the type
of basal substrate and bed topography also influence the balance velocities.
However, glaciers often depart from steady-state and are either growing or shrinking. Changes
in the balance between driving and resisting stresses cause short to long-term changes in glacier flow
velocities. For example, the driving stress can increase when the surface profile of a glacier steepens,
either by melting at the terminus or unusual accumulation in its upper parts; and resisting stresses
can be modulated by variations in subglacial water storage and pressure.
2.3 Glacial hydrology and its influence on glacier dynamics
2.3.1 Water supply and plumbing system
Meltwater is produced at the surface from snow/ice melt, within the glacier when ice deformation
causes friction between ice grains, and under the glacier from geothermal heating and basal friction.
Supraglacial melt is the greatest source of meltwater although it varies spatially over the glacier
surface and in quantity seasonally. Internal and basal melt is a steadier water supply although
volumes can change drastically over long timescales. Rain and groundwater also feed the glacier's
hydrological system. Water can be routed from the surface to the bed, and also from the bed to the
surface depending on the processes that drive or resist water flow.
2.3.2 Drainage systems and storage
The controls that the glacier hydrological system exerts on ice motion depend on supply, drainage
and storage, and connections between the supraglacial, englacial and subglacial systems.
Meltwater produced in the melt season can either percolate through the firn in the
accumulation zone, or runoff on bare ice in the ablation zone. Refreezing in the firn releases latent
heat, which in turn progressively brings the layer to the pressure melting point. Any further increase
in temperature then leads to melting. Drainage through the firn is very inefficient compared to runoff
on bare ice. Supraglacial meltwater cuts channels through the glacier surface that can incise deep
over one melt season, as long as channel incision rates are greater than surface ablation rates (Gulley
and others, 2009). Water can also be stored in ponds on the glacier surface in areas of gentle slope.

2.3 Glacial hydrology and its influence on glacier dynamics
13
Four types of englacial drainage systems connect the surface with the bed. Moulins form when
supraglacial meltwater exploits a fracture on the glacier surface. Sustained water supply will allow
the moulin to grow and deepen. Hydrofracturing of crevasses occurs when the pressure that water
exerts onto the crevasse walls overcomes the strength closing the crevasse (Röthlisberger & Lang,
1987). It allows rapid downwards propagation and connection to the basal plumbing network (Das
and others, 2008 ; Stevens and others, 2015). This process has been shown to contribute to a great
extent to the variations in flow of the Greenland ice sheet (Zwally and others, 2002 ; van de Wal and
others, 2008). Incision of supraglacial meltwater channels also connects supraglacial meltwater to
the englacial and subglacial networks (Fountain & Walder, 1998 ; Gulley and others, 2009). Finally,
Gulley and Benn (2007) have shown that water can also easily exploits lines of a different
permeability to that of the ice, such as debris-filled fractures, crevasse traces, and other similar
fractures. Storage within temperate glaciers can occur in conduits, crevasses or fracture network, as
observed on Storglaciären by Fountain and others (2005), while blockages of incised meltwater
channels commonly occur in polythermal glaciers (Gulley and others, 2009).
Subglacial drainage systems have a huge influence on ice dynamics. They can either be channelized
when water is discharged through an efficient network of conduits, or form distributed systems that
are relatively inefficient at discharging water. Channelized systems are divided into R- (or
Röthlisberger) channels incised between the bed and the ice, N- (or Nye) channels cut into bedrock,
or sediments and large tunnel valleys. In times of high water input, high water pressures in the
channels force the water out, while low water inputs cause the water to migrate towards the
channels. Tunnel size also adjusts to the water intake, making the drainage efficiency of the network
increase through the melt season.
Distributed subglacial drainage systems on hard beds are divided into thin water films and
linked cavities. Thin water films are maintained when energy gained (geothermal activity) or
produced at the bed (strain, frictional heating) is greater than energy conduction through the ice.
They are found at the interface between the ice and the bed, and have the most limited ability to
transport meltwater. As seen in section 2.1.3, linked cavities exerts a large control on flow speed,
reducing basal drag to areas of ice-bed contact. Large linked cavities can progressively turn into an
efficient, channelized drainage system as a result of high fluxes. Kamb (1987) suggested this could be
a mechanism leading to the termination of glacier surges.
Distributed systems over or within soft beds can discharge large amounts of water (Alley and
others, 1986). Water can be stored in the substrate pores and advected during shearing of the
subglacial layer. It can also flow through the pores of the substrate under a hydraulic gradient. The
volume discharged depends on the permeability and thickness of the aquifer. A water-saturated
2. SCIENTIFIC BACKGROUND
horizon has a strong influence on basal sliding and sediment deformation. Films at the ice-sediment
interface can form when the water supply exceeds the availability of pore spaces. Finally, water can
travel in shallow channels or “canals” within the substrate. Such systems are expected to be present
below gently sloping ice streams. Subglacial drainage systems largely control flow rates, and in turn,
ice motion can alter the drainage systems. Such feedback mechanisms remain poorly understood.
2.4 Ice temperature and thermodynamics
Ice temperature exerts a strong control on flow dynamics. Switches in basal temperature can result
in a dramatic acceleration of glaciers, and are thought to be involved in the surging of polythermal
glaciers (Fowler and others, 2001).
2.4.1 Controls on ice temperature
Changes in ice temperature can take place at the ice surface, englacially and subglacially. At the
glacier surface, energy exchanges with the atmosphere can raise or reduce ice temperature. In the
accumulation zone in particular, latent heat released by the refreezing of meltwater can significantly
increase the ice temperature and eliminate the cold winter wave. Once the firn is raised to the
melting point, any excess in heat will produce melting. In winter, snow insulates the glacier, reducing
heat loss. Conduction defines the transfer of heat from warm to cold areas in the glacier. It is most
efficient where steep thermal gradients occur. Advection of ice transfers temperate ice produced in
the accumulation zone downstream, increasing temperatures at depth, whereas advection of cold ice
originating from the interior of ice sheets reduces temperatures. Ice deformation produces most
heat at depth, where the shear stress is largest. At the glacier bed, geothermal heat needs to be
greater than conduction in order to raise the ice temperature to the melting point. Other processes
such as frictional heating and regelation can significantly warm basal ice, as well as sliding and
subglacial sediment deformation.
2.4.2 Thermal regimes
Glaciers can be divided into three categories based on their thermal structures. Temperate glaciers
are composed of ice at the pressure melting point, except for a shallow surface layer a few meters
thick subjected to seasonal changes in temperature. Between 0.1% and 2% of water can be found
between grains (Lliboutry, 1976). For a glacier to be fully temperate, the cold winter wave has to be

2.4 Ice temperature and thermodynamics
15
eliminated either by release of latent heat in the accumulation zone, or more efficiently by ablation
in the summer. The thickness of the cold wave depends on winter temperatures and insulation
provided by the snowpack. Therefore temperate glaciers are most likely to occur where snow
accumulation and ablation rates are high, such as in temperate-maritime climates.
Cold glaciers are frozen to their beds. Heat production is less efficient than heat loss,
maintaining the ice temperature below the pressure melting point. Cold glaciers are typically found
in cold and dry environments such as the Dry Valleys in Antarctica.
Polythermal glaciers contain temperate and cold ice. The proportion of both ice types varies, creating
a spectrum of thermal structures spanning from predominantly cold glaciers with a limited
temperate basal layer, to predominantly warm with cold ice close to the surface. Six main types of
polythermal valley glaciers have been described by Blatter and Hutter (1991) and Pettersson (2004)
(Fig. 1), although the spectrum of polythermal structure shall not be limited to these 6 examples.
Types a and b are found in cold environments where negligible melt occurs in the accumulation area.
Figure 1: thermal structures of idealized valley glaciers. Red indicates temperate ice, blue indicates cold ice. Modified from Pettersson (2004).

2. SCIENTIFIC BACKGROUND
Strain heating raises parts of the bed to the pressure melting point. Latent heat release of meltwater
in the low accumulation area produces a limited core of warm ice (type c). In regions where
temperate ice is produced by the same process, and the cold wave is ablated in the summer, the
glacier becomes predominantly temperate, with cold ice still being produced in the uppermost
accumulation area (type d). In type e, the winter cold ice is not successfully removed in the ablation
zone. Glaciers of this type are widespread in regions like Svalbard where snowpacks are thin and melt
rates moderate. Finally, glaciers of type f are found where summer ablation is important and strips
the cold wave from the ablation zone in the summer.
2.4.3 Feedback mechanisms between ice temperature and dynamics
Ice temperature and glacier flow dynamics are interrelated. Changes in ice temperature exert a
strong influence on ice dynamics, while ice dynamics can, through feedback mechanisms, gradually
modify a glacier's thermal structure (Benn & Evans, 2010).
Positive feedback mechanisms are thought to be involved in the trigger of glacier surges.
Glacier acceleration yields enhanced frictional heating at the glacier base. This is turn begins to warm
the ice, and eventually causes melting. Increasing volumes of meltwater promote faster sliding until
decoupling occurs. The mechanism stops when frictional heating at the bed is not efficient enough to
keep feeding the system.
Negative feedback mechanisms can occur in response to changes in geometry of the glacier.
The mass continuity equation relates a change in glacier thickness through time to the difference
between the mass balance and the flux of a quantity of ice. If the lower part of the glacier starts
accelerating, dynamic thinning occurs making the glacier more vulnerable to conduction from the
bed to the surface. Inversely, if more ice is transported down-glacier, thickening occurs and
conduction is limited.
2.4.4 Enthalpy
Modelling the thermodynamical properties of polythermal glaciers is challenging as they are
composed of a fraction of cold ice, and a fraction of temperate ice. These two ice types do not
respond the same way when submitted to a change in heat content. Raising the heat content of cold
ice results in a change in temperature, while raising the heat content of temperate ice yields a
change in water content (Aschwanden & Blatter, 2005, 2009). This difference in ice properties can be

2.4 Ice temperature and thermodynamics
17
understood within the framework of enthalpy. In a glaciological context, enthalpy is the ‘internal
energy’ of a glacier.
Enthalpy is produced when a glacier flows downslope and gravitational potential energy is
converted into thermal energy. Radiative and turbulent heat fluxes at the surface can produce or
discharge enthalpy. Internal and basal strain heating increase enthalpy, as well as latent heat release
and geothermal heat fluxes. Enthalpy gains can be dissipated at the glacier surface and bed by runoff,
and through the glacier by conduction or by calving.
For a glacier to remain in steady-state, not only it must flow at its balance velocity to balance
mass accumulation with mass loss, but it must also maintain equilibrium between enthalpy gains and
enthalpy losses. Any surplus or deficit in mass and enthalpy will have consequences on the glacier
dynamics. At the glacier bed, increased strain heating can raise the ice temperature and further
produce basal meltwater. If the meltwater and the rising temperature cannot be evacuated by
conduction or runoff as fast as they are generated, positive feedbacks will cause the glacier to
accelerate above its balance velocity, advecting ice faster than can be produced. To the contrary, if
heat is lost more rapidly by conduction or runoff faster than it is produced, the glacier will decelerate
and ice will accumulate within the system.


19
Chapter 3: Surge-type glaciers
This chapter focuses on surge-type glaciers, their dynamics, distribution and mechanisms. The
characteristics of the surge cycle are defined in Section 3.1. The contemporary distribution of these
glaciers and variations in surge behaviors observed across the world are detailed in section 3.2.
Section 3.3 focuses on the identification of surge-type glaciers, along with the relevant techniques,
and evidence to look for. Section 4.4 summarizes the results of statistical studies investigating
controls on regional distributions of surge-type glaciers. Finally, models of surge mechanisms are
presented in Section 3.5.
3.1 Definition
The spectrum of glacier flow velocities stretches from slow-moving cold-based glaciers in the Dry
Valleys of Antarctica or Arctic Canada to extremely rapidly-flowing outlet glaciers in Greenland or ice
streams in parts of Antarctica. Flow behavior spans from more or less constant flow vs to velocity
pulses. Surge-type glaciers have the ability to periodically switch between long periods of
continuously slow flow (the passive - or quiescent phase) and short periods of very fast flow (the
active - or surge phase). Surging is defined as an internally triggered instability, as opposed to other
pulsating behaviors such as the patterns of advance and retreat observed on Greenland outlet
tidewater glaciers, which are influenced by bed morphology and climate (Meier & Post, 1969 ; Sharp,
1988). The surge cycle is composed of the quiescent and the surge phase. Its length tends to be more
or less constant for each surge-type glacier (Meier & Post, 1969).
The quiescent phase typically lasts from a couple to several decades, and is characterized by
flow speeds below balance velocities. Seasonal variations in velocity can still occur during quiescence
(Abe & Furuya, 2015 ; Burgess and others, 2013). Ice builds-up in the ‘reservoir zone’ up-glacier,
while flow is restricted in the lower reaches of the glacier, altering its longitudinal profile. ‘Mini-
surges’ or ‘wavy surges’ can be detected a few years prior to the beginning of the main surge,
travelling down the glacier at great speeds (few hundreds of meters per hour) (Kamb & Engelhardt,
1987 ; Dolgoushin & Osipova, 1978). The thickening continues, forming a clear front between the
stagnant ice down-glacier and the increasingly active ice up-glacier (Clarke and others, 1984). The
bulge or ice front steepens until the surge is triggered (Meier & Post, 1969 ; Raymond, 1987).
During the surge, the glacier velocity can increase by a factor of ten. These high velocities are
maintained from a few months to a few years only. The changes in glacier geometry during
quiescence are rapidly reversed as mass is transferred down-glacier into a ‘receiving zone’. The thick
3. SURGE-TYPE GLACIERS
surge front travels down-glacier, causing compression as it moves into more stagnant ice, and
extension behind it. Drawdown of the glacier surface in the reservoir zone leaves ice hanging on the
valley sides (Post & LaChapelle, 1971). As the ice stretches, the glacier becomes intensively
crevassed. The down-glacier propagation of the surge may reach beyond the glacier limit in fast and
dramatic advances. Exceptions to this pattern are some tidewater glaciers in parts of Iceland,
Greenland and Svalbard. There, surges have been observed to begin at the calving front and
propagate up-glacier (Björnsson and others, 2003 ; Rolstad and others, 1997 ; Dowdeswell &
Benham, 2003 ; Murray and others, 2003b, 2012 ; Pritchard and others, 2003, 2005).
The mechanisms taking place during a surge are still poorly understood, although it is clear that ice
deformation cannot solely account for the surge velocities. A combination of sliding and substrate
deformation at the glacier bed must be involved (Raymond, 1987).
3.2 Distribution of surge-type glaciers and variations in surge behaviors
Meier and Post (1969) noted that surging can affect glaciers of all types, and can occur in almost all
climatic environments. One of the most fascinating facts about the population of surge-type glaciers
is its non-random distribution both on the global and regional scale (Raymond, 1987). During the past
100 years or so, surging has occurred in two main ‘superclusters’ namely the Arctic Ring, and western
Central Asia. Within the Arctic Ring, surge-type glaciers are clustered in clusters in Alaska, Yukon
Territory, Arctic Canada, parts of Greenland, Iceland, Svalbard and Novaya Zemlya (Post, 1969 ;
Fischer and others, 2003 ; Copland and others, 2003 ; Jiskoot and others, 2002, 2003 ; Grant and
others, 2009 ; Citterio and others, 2009 ; Yde & Knudsen, 2007). In western Central Asia, glaciers
have been observed to surge in the Karakoram, Pamirs and western Tien Shan (Copland and others,
2009, 2011 ; Hewitt, 1969, 1998 ; Kotlyakov and others, 2008 ; Osipova and others, 1998). A small
number of surge-type glaciers have been reported in the Caucasus, parts of the Andes, Russian high
Arctic, Kamchatka and Tibet (Kotlyakov, 1996 ; Kotlyakov and others, 2004 ; Casassa and others, 1998
; Espizúa, 1986 ; Zhang, 1992 ; Yafeng and others, 2010 ; Dowdeswell & Williams, 1997 ; Dolgoushin
& Osipova, 1975). The total population of surge-type glaciers is thought to represent about 1% of the
global population of glaciers (Jiskoot and others, 1998).
Equally important to the known distribution of surge-type glaciers are glacierized regions
where surge-type glaciers do not exist today. These are the Brooks Range and the Southern Coastal
range in Alaska, the contiguous states of the USA, northernmost and southernmost Greenland,
Pyrenees, European Alps, mainland Scandinavia, Franz Josef Land, Himalayan Range, Bhutan, New
3.2 Distribution of surge-type glaciers and variations in surge behaviour
21
Zealand, Northern Andes, and Verkhoyansk in Russia. Although Wellman (1982) explained the former
geometric changes of Fisher glacier through surging, no surges have been directly observed in
Antarctica.
Evidence shows that the population of surge-type glaciers might have migrated in the past
following climatic patterns. The European Alps hosted at least one surge-type glacier in Austria.
Vernagtferner underwent five successive surge-like advances between the 17th and 19th century
(Hoinkes, 1969). Other studies reveal that surge behaviors can be modulated by climate. In Iceland
Striberger and others (2011) traced the surges of Eyjabakkajökull over the past 1700 years showing a
clear reduction in the length of the surge cycle in times of high precipitation rates and low
temperatures, and an increase when the conditions were less favorable. In the Karakoram, a
sustained rise in precipitation has apparently led to the “Karakoram anomaly”: a sudden increase in
the number of surge occurrences (Hewitt, 2005). In Svalbard, Dowdeswell and others (1995)
interpreted a reduction in the frequency and occurrence of surges in Svalbard as a consequence of
climate change, although recent data contradict these conclusions as more than 15 glaciers are
currently surging on the archipelago (pers. Com. Luckman, April 2015).
Surge behavior varies greatly between regions and within individual surge-clusters. Two
contrasting types of surge behavior have traditionally been recognized: the Alaska-type surge and the
Svalbard-type surge, which are thought to be a reflection of the predominant thermal regimes found
in these regions. However, in reality a wide spectrum of behaviors actually exists between and
beyond these two classes. The shortest surges have been observed in Iceland, Alaska, Yukon
Territory and in the Pamirs, where they rarely exceed 4 years in duration (Osipova and others, 1998 ;
Thorarinsson, 1964, 1969 ; Dolgoushin & Osipova, 1975 ; Post, 1969). These clusters have
correspondingly short quiescent phases. Average surge velocities are highest in Alaska and Iceland
(Eisen and others, 2001 ; Kamb and others, 1985 ; Björnsson and others, 2003). The longest surge
cycles take place in Greenland, Svalbard and Arctic Canada (Liestøl, 1969 ; Dowdeswell and others,
1995 ; Hagen and others, 1993 ; Weidick, 1988 ; Jiskoot and others, 2003). Glaciers in the Karakoram
are typically found between these two groups, with moderately long surges (3 to 6 years) and
quiescent phases from 15 to 70 years (Copland and others, 2011 ; Hewitt, 1998). Heterogeneities in
the evolution of surges are also clear within this region (Quincey and others, 2015). The development
of the surge cycle also varies from one region to another. Murray and others (2003b) showed that
the surge of Monacobreen was characterized by a multiyear phase of steady acceleration, and
terminated with a gradual deceleration, as opposed to rapid initiation and termination for the surge
of Variegated glacier in Alaska (Kamb & Engelhardt, 1987 ; Kamb and others, 1985).
3. SURGE-TYPE GLACIERS
3.3 Identification of surge-type glaciers
The identification of surge-type glaciers is complicated by the changes in geometry, appearance and
behavior the glacier undergoes throughout the surge cycle. A glacier in full surge is relatively easy to
identify, and the surge dynamics can leave distinct geomorphological evidence that enables
identification during the quiescent phase. Surge-type glaciers can be identified using a suite of
glaciological and geomorphological evidence. Some features have a stronger diagnostic power than
others, and the most reliable identifications are based on a combination of surge-indicative features.
Copland and others (2003, 2011) and Grant and others (2009) have made comprehensive lists of
features for the identification of surge-type glaciers.
Among the clearest glaciological evidence of surging lies an increase in surface flow velocity by
an order of magnitude or more. Rare in-situ velocity measurements were collected during surges of
Variegated and Trapridge glaciers (Clarke and others, 1984 ; Kamb and others, 1985). Today, remote
sensing techniques are favored to detect such velocity changes (Mansell and others, 2012 ; Burgess
and others, 2012 ; Dowdeswell and others, 1999 ; Luckman and others, 2002 ; Fischer and others,
2003 ; Joughin and others, 1996). Very rapid changes in length can be indicative although not
conclusive of surging, as not all surges result in an advance of the glacier (Braun and others, 2011 ;
Mansell and others, 2012). Intense crevassing and sheared margins are commonly detected on
actively surging glaciers (Meier & Post, 1969). The evolution of the crevasse pattern can give
information the timing of the surge and stress patterns (Dowdeswell & Benham, 2003 ; Hodgkins &
Dowdeswell, 1994). Measuring elevation changes can allow identification of surging glaciers, in
particular where sudden thickening of the lower reaches of glaciers coincides with up-glacier thinning
(Meier & Post, 1969 ; Paterson, 1994 ; Melvold & Hagen, 1998 ; Nuth and others, 2010 ; Bevington &
Copland, 2012). Finally, looped moraines, surface foliation and potholes can be identified using
systematic visual interpretation of airborne or spaceborne images (Copland and others, 2003, 2011 ;
Dowdeswell and others, 1991 ; Hamilton & Dowdeswell, 1996 ; Post, 1969).
During quiescence, identification of surge-type glaciers has to rely on geomorphological
features. Surge-type glaciers produce consistent landform-sediment assemblages that cannot be
observed on normal glaciers in steady-state (Evans & Rea, 2003). A comprehensive model of the
surge landsystem was described by Evans and Rea (2003), based on landforms previously identified
by Sharp (1985a, 1985b), Croot (1988a, 1988b), and Knudsen (1995). Detailed mapping of basal ice
sequences and of internal structures have been applied to reconstruct past changes in flow dynamics
of the Tellbreen glacier in Svalbard (Lovell and others, 2015).

3.4 Controls on the distribution of surge-type glaciers: statistical studies
23
3.4 Controls on the distribution of surge-type glaciers: statistical studies
The unique distribution of surge-type glaciers has motivated a series of studies investigating the
connections between surging and a variety of attributes. Post (1969) provided the first qualitative
assessment of the role played by various parameters over the distribution of surge-type glaciers in
western North America. Successively, univariate and multivariate regression techniques have
investigated regional clusters such as the St Elias mountains, Yukon Territory, (Clarke and others,
1986 ; Clarke, 1991), western North America (Wilbur, 1988), Pamirs (Glazyrin and others, 1987) and
Svalbard (Hamilton, 1992 ; Hamilton & Dowdeswell, 1996 ; Jiskoot and others, 1998, 2000 ; Atkinson
and others, 1998), Iceland (Hayes, 2001), east Greenland (Jiskoot and others, 2003) and Karakoram
(Barrand, 2002 ; Barrand & Murray, 2006).
Glacier length, size and morphology have been tested in almost all clusters. In the Yukon
Territory, Svalbard and Karakoram, long glaciers are most likely to surge. Area correlates well with
surging in the Karakoram and Iceland. In east Greenland, complex glaciers (characterized by long
perimeters relative to their size) are most likely to surge. As suggested by Clarke and others (1986)
and Jiskoot and others (2000), the tendency for longer glaciers to surge can be related to the
increasing vulnerability of the drainage system to instability and collapsing with length. Longer
glaciers also tend to spread over several lithological boundaries, further affecting the subglacial
drainage system. Glacier length could also be a proxy for mass balance (Budd, 1975 ; Raymond,
1987), hypsometry (Glazyrin and others, 1987 ; Wilbur, 1988), subglacial conditions (Post, 1969 ;
Clarke, 1991) or thermal regime (Murray and others, 2000). Statistics on glacier slope produced
mixed results. In Svalbard and Yukon, surge-type glaciers tend to have relatively steep slopes, while
in eastern Greenland glaciers with a low slope are more likely to surge. Clarke (1991) demonstrated
that slope is only a by-product of its inverse relationship with length. Finally, glacier aspect varies
tremendously between regions, and could reflect topographic effects on mass balance.
Paterson (1994) noted that the global distribution of surge-type glaciers appears to be
confined to new mountain ranges undergoing rapid erosion. Surging glaciers were observed over
sedimentary, volcanic and metamorphic lithologies in north-western America. In Svalbard, Hamilton
(1992) found that the probability for surging increased for glaciers underlain by sedimentary rocks,
although this was the case for 80% of the glaciers in his sample. In the same region, Jiskoot and
others (1998) showed that surging was well-correlated with young fine grained sedimentary
substrate.
The thermal regime of surge-type glaciers has been comprehensively investigated in Svalbard.
Jiskoot and others (2000), based on a sample of 137 glaciers, showed that a polythermal regime was
more conductive to surging, as suggested by Bamber (1987) and Macheret and Zhuravlev (1982).
3. SURGE-TYPE GLACIERS
However, the influence of the thermal regime is not clear, but cold-based glaciers have never been
observed to surge. The thermal regime could have an effect on the drainage system and the energy
balance of a glacier.
Interestingly, climate has never been fully investigated as a potential control on the global
distribution of surge-type glaciers. Post (1969) noted that surging glaciers in Alaska and in the Yukon
Territory were found across a spectrum of climates from sub-maritime to continental, and concluded
that no specific climate conditions are in favor of surging. However, Budd (1975) suggested that the
accumulation rate and the bed profile are the primary controls on surging.
3.5 Surge models
Since the first observations of surges at the beginning of the 20th century, theories have been
developed to explain the mechanisms behind surging. Field observations and modelling efforts
contributed to the development of such models (Clarke, 1976 ; Harrison, 1972 ; Fowler, 1987 ; Clarke
and others, 1986 ; Kamb and others, 1985). Today, the theories on surging have considerably
improved, although they lack representativeness.
Early theories rapidly recognized surging glaciers as out-of-balance with their environments
(De Geer, 1910). Tarr and Martin (1914) and Nielsen (1937) related surging to tectonic activity and
volcanism. However, extensive observations by Post (1969) and Thorarinsson (1964, 1969) swiftly
contradicted these ideas. The fact that surging had been witnessed on glaciers of all types found in
almost all tectonic and climatic environments was the strongest argument against external controls
on surging. New models therefore aim to explain surging based on internally triggered instabilities.
The main models are described below.
3.5.1. The thermal switch mechanism
The thermal switch or thermal instability mechanism has a long history. Robin (1955) argued that
switches in temperature at the bed of glaciers from cold to warm could trigger surges. Below the
thickening reservoir zone, feedback mechanisms between increasing shear stresses and ice
deformation would progressively bring the base to the pressure melting point, causing a surge.
Clarke (1976) dismissed this mechanism as it would yield longer surge cycles than were actually
witnessed. Schytt (1969), based on observations of polythermal glaciers in Svalbard, proposed that
the cold ring detected along the glaciers margins could act as a dam for meltwater, and that

3.5 Surge models
25
enhanced water pressure in times of strong melting would lead to surging. However, large volumes
of water at the cold-warm ice transition could not be detected on Trapridge and Variegated glaciers
(Bindschadler, 1997 ; Clarke and others, 1984). Moreover, the surge bulge found on Trapridge glacier
was not located at this thermal transition.
Extensive field observations on Bakaninbreen, Svalbard, revived this theory and led to the
development of the ‘thermal switch mechanism’ (Murray and others, 2000 ; Fowler and others,
2001). According to this model, surges of polythermal glaciers occur in response to changes at the
base from cold to warm. During the quiescence of a cold-based glacier, mass starts to accumulate in
the reservoir zone. The longitudinal profile of the glacier is progressively altered, yielding enhanced
ice deformation. A positive feedback between ice motion and heat production (caused by strain
heating) takes place. Eventually ice reaches the melting point and any excess heat contributes to
melting it. Cold ice surrounding the core of warm ice, and the underlying permafrost prevent
meltwater from escaping. Rising water pressure reduces basal drag, promoting sliding. The surge is
eventually triggered and propagates down-glacier as stresses are transferred from the surge area to
the surrounding ice, facilitating ice deformation. Infiltration of water at the ice-bed interface and into
the ice significantly contributes to sliding. Surge termination occurs when the water is able to escape,
via faults into the ice or through the permafrost.
The application of the thermal switch mechanism is limited to polythermal glaciers. However,
Bindeschadler and others (1976) observed that fully temperate glaciers could also surge. This led to
the development of a model specific to temperate glaciers: the hydrologic switch mechanism.
3.5.2 The hydrologic switch mechanism
Röthlisberger (1969) first suggested that a switch in the subglacial drainage system, from efficient
tunnels to inefficient distributed networks could lead to surging. Thorarinsson (1969) also
emphasized the role of water in the surges observed in Iceland.
The development of the hydrologic switch mechanism is mostly based on observations made
during the surge of Variegated glacier, Alaska (Kamb and others, 1985). Field measurements revealed
the presence of a low-pressure, efficient subglacial drainage system during quiescence, and a much
more dispersed flow with high pressures during the surge. Peaks in water pressure corresponded to
uplifts and accelerations of the glacier. At surge termination, large volumes of turbid water were
released, coinciding with a drop in water pressure and in ice surface.
Kamb and others (1985) suggested that the surge of Variegated was sustained by extensive
cavitation over a hard bed and ice bedrock separation, and that its trigger and termination were
caused by a switch in the drainage system. Surging would initiate when a conduit system collapses
3. SURGE-TYPE GLACIERS
into linked cavities. According to Kamb (1987), high flow velocities and low hydraulic gradient keep
the linked cavity system stable. On the other hand, instability might arise when water inputs are
important, enlarging the connection between cavities and eventually switching the drainage system
to conduits. Although processes of surge termination are clear, this model does not satisfactorily
explain how a conduit system initially turns into linked cavities. Finally, the last requirement for a
linked cavity system to efficiently cause decoupling of ice from the bed is a large amount of water.
Fatland and Lingle (2002) and Lingle and Fatland (2003) suggested that this water could originate
from englacial storage in voids, and that a surge could be initiated as soon as this water reaches the
subglacial drainage system. The main limitation to Kamb (1987)’s model relates to the bed of the
glacier. Cavities require a hard bed, although Richards (1988) detected soft, deformable sediments
under Variegated glacier, as it is the case under numerous other temperate glaciers (Harrison & Post,
2003 ; Truffer & Harrison, 2006). A surge model based on a linked cavity system, therefore, may not
be appropriate in these cases.
Problems exist with both the hydrological and thermal switch models. Although surges of
temperate and polythermal glaciers differ in terms of magnitude and development, they produce
similar dynamics. Most interestingly, surges of both glacier types have occurred within the same
surge cluster of the St Elias mountains (Frappe-Seneclauze & Clarke, 2007), suggesting an underlying
dynamical unity. Further, as stated in Frappe-Seneclauze and Clarke (2007): “surge models should be
able to explain the entire spectrum of surge speed and structure observed within a geographical
cluster, irrespective of the thermal regime of the glaciers.” Development of such a model is one of the
aims of this thesis.
27
Chapter 4: Study areas This thesis investigates surging on a global, regional and local scale. Section 4.1 introduces the
surging phenomenon on a global scale. In section 4.2 the surge cluster of Svalbard is presented, along
with a sample of six glaciers representative of the spectrum of glacier geometries and thermal
regimes found in the region. Finally, glaciers investigated in two case studies are described in section
4.3.
4.1 Global analyses
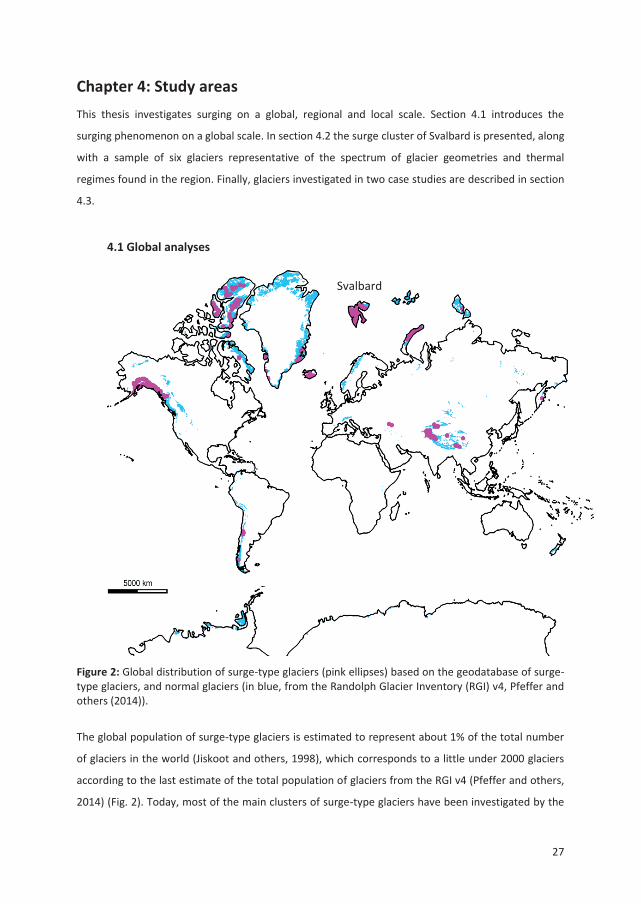
Figure 2: Global distribution of surge-type glaciers (pink ellipses) based on the geodatabase of surge-type glaciers, and normal glaciers (in blue, from the Randolph Glacier Inventory (RGI) v4, Pfeffer and others (2014)).
The global population of surge-type glaciers is estimated to represent about 1% of the total number
of glaciers in the world (Jiskoot and others, 1998), which corresponds to a little under 2000 glaciers
according to the last estimate of the total population of glaciers from the RGI v4 (Pfeffer and others,
2014) (Fig. 2). Today, most of the main clusters of surge-type glaciers have been investigated by the
Svalbard

4. STUDY AREAS
means of statistical studies, remote sensing techniques or field measurements. To date, studies have
focused on individual clusters, and findings related to one cluster might not be transferrable to other
regions. Statistical studies for example, have emphasized the differences between surge-type and
normal glaciers within clusters instead of focusing on common properties of all surge-type glaciers.
As expected, regional and local controls seem to have a strong influence on surging style and
magnitude, but region-specific factors may overshadow the global controls on surging. Exploring the
controls on the non-random distribution of surge-type glaciers may unlock a new understanding of
the surge phenomenon.
Fortunately, a wide range of tools are now available to study surging on a global scale. A
century of observations and identifications of surge-type glaciers has built an accurate picture of
where surge-type glaciers are found, and where they do not exist. High-resolution datasets allow
correlations of surging with glaciological and environmental parameters on a global scale, which was
not possible before. The knowledge gathered from the global distribution of surge-type glaciers can
then be applied to improve the understanding of regional surge dynamics.
4.2 Regional analyses: the High Arctic archipelago of Svalbard
The Norwegian archipelago of Svalbard lies in the High Arctic between 74 - 81°N and 10 - 35°E. It is
composed of four main islands, the largest being Spitsbergen, followed by Nordaustlandet, Edgeøya
and Barentsøya. Svalbard is 57% covered by glaciers (Nuth and others, 2013), and a total of 1615
individual glaciers are registered in the RGI v4 (König and others, 2013 ; Pfeffer and others, 2014).
4.2.1 Environmental settings
Located at the confluence of contrasting ocean currents and air masses, Svalbard displays a unique
climate sensitivity (Ahlmann, 1953 ; Lamb, 1977). The Arctic Ocean is connected to the North Atlantic
Ocean through the Fram Strait, a deep gateway between Greenland and Svalbard. The archipelago
lies on an emerged part of the Barents Sea Shelf. Conditions are relatively mild in Svalbard despite its
high latitude. The northernmost extremity of the North Atlantic Drift flows along the western coast
of Svalbard, and is characterized by warm and high-salinity water, while to the east of the
archipelago cold and low-salinity polar water flows south (Humlum and others, 2003 ; Svendsen and
others, 2002 ; Saloranta & Svendsen, 2001). There is therefore a strong contrast between the mild
marine climate of the south-west of the archipelago and the more Arctic conditions of the north east.
4.2 Regional analyses: the High Arctic archipelago of Svalbard
29
This is reflected in the strong presence of sea ice for most of the year along the east coast, and its
absence on the south west coast (with the exception of the formation of fjord ice in winter). Svalbard
also lies on one of the major gateways for atmospheric heat and moisture transport in the Arctic
Basin, due to its location in the North Atlantic cyclone track (Tsukernik and others, 2007 ; Dickson
and others, 2000). Extreme temperature changes on the order of >20°C can occur within a few hours,
resulting in occasional rain events, even in the middle of winter.
Svalbard has the longest meteorological record of the Arctic extending from 1911 until today
(Førland and others, 1997), representative of the conditions in central Spitsbergen (Nordli and
others, 2014). Mean annual temperatures underwent a very strong increase around the 1920s,
reaching -5°C at sea level in central Spitsbergen. This marked the end of the Little Ice Age (LIA) in
Svalbard. A decrease of about 4°C occurred in the 1960s before the temperature steadily rose,
reaching the present values 4 to 5°C higher than at the end of the LIA. From 2004 to 2014,
temperatures registered at Longyearbyen airport are the coldest in the month of March (mean = -
12°C) and the highest in July (mean = 7.1°C) (eklima.no), while precipitation is at the lowest from
February to June (10.5 mm w.eq per month), and at the highest from July to January (20 mm w.eq
per month). The weather during the winter season is mainly influenced by the Siberian high, a strong
and cold anticyclone, while summer is primarily characterized by low pressure systems passing across
the archipelago (Humlum and others, 2003). The mean annual temperature at Longyearbyen airport
is -3°C, and the mean annual precipitation is around 195 mm (eklima.no). Precipitation rates are
highest towards the east and west coasts (Sand and others, 2003), and decrease from south to north,
while the central parts of the archipelago are the driest (Winther and others, 1998).
Geologically, Svalbard spans from Precambrian Heckla Hoek formations to young Tertiary rocks
(Hjelle, 1993). The archipelago is crisscrossed by major striking fault zones oriented N-S to NNW-SSE.
Permafrost is found almost all over the archipelago with thicknesses between 60-90 m (Humlum and
others, 2003) to up to 450 m in high areas with limited snow cover (Liestøl, 1977).
4.2.2 Glacier types and evolution since the Little Ice Age
There is no such thing as a typical Svalbard glacier, as a wide range of glacier types can be found in
the archipelago. Cirque and valley glaciers are abundant in central Spitsbergen (Nordenskiöldland
and Andrée Land), while ice fields and ice caps make up most of the glacierized area. Ice fields are
defined as large ice masses divided into individual glaciers by topography such as mountain ridges
and nunataks. Three ice fields cover Spitsbergen in the south-east, north-east and north-west. The
two largest ice caps, Austfonna and Vestfonna, make 40% of the glacierized area of Svalbard, and are
found in Nordaustlandet. Smaller ice caps are located in the south-east of the archipelago on
4. STUDY AREAS
Edgeøya and Barentsøya. Both tidewater and land-terminating glaciers co-exist on the archipelago.
All tidewater margins are grounded (Dowdeswell, 1989).
In Svalbard, the LIA is thought to have ended at the beginning of the 20th century. Glaciers
started retreating in the 1920s as a consequence of an increase in summer temperatures. Between
1936-38 and 1990, glaciers were thinning at low elevations, while the interior of ice caps and ice
fields was thickening (except on Prins Karls Forland) (Nuth and others, 2007). The most negative
annual geodetic mass balances over this period occurred in the south and in the west (Prins Karls
Forland, Nathorstland and Wedel Jarlsberg Land), while the less negative balances were measured on
the east coast and central Spitsbergen. Comparisons to the other arctic regions reveal that,
considering the changes in glacier area and geodetic mass balance, Svalbard has the most negative
balance of the Arctic (Nuth and others, 2010).
The thermal regime of Svalbard glaciers spans from completely cold for small thin land
terminating glaciers (Bælum & Benn, 2011 ; Etzelmüller and others, 2000) to polythermal for glaciers
typically thicker than 120-130 m (Dowdeswell and others, 1984). Temperate ice is produced in the
accumulation zone of glaciers by latent heat release and is advected down-glacier. Strain heating
maintains a warm core, while cold ice is found near the surface and at the front of land-terminating
glaciers (Macheret & Zhuravlev, 1982 ; Björnsson and others, 1996 ; Bamber, 1987).
Land-terminating glaciers tend to flow at speeds below 10 m per year (Hagen and others,
2003), while larger tidewater glaciers can move much faster, some reach velocities of a couple of
meters per day (Lefauconnier and others, 1994). Today, 68% of the glacierized area of Svalbard
drains through tidewater glaciers (Nuth and others, 2013).
4.2.3 Surging in Svalbard
A large proportion of the population of glaciers in Svalbard are of surge-type, although the exact
number of surge-type glaciers has always been widely debated. Estimations span from 13% to 34%
and to 90% of surge-type glaciers on the archipelago (respectively Jiskoot and others (2000),
Hamilton & Dowdeswell (1996), Lefauconnier & Hagen (1991)), making Svalbard the region with the
highest proportion of surge-type glaciers in the world. The archipelago is therefore one of the best
laboratories to study the surging phenomenon.
Svalbard has always been a fertile ground for exploration. Numerous expeditions have made
substantial observations on glacier dynamics through the 1800s, and early 1900s. Field notes, maps,
drawings or photographs constitute early records that today are crucial to understand the current

4.2 Regional analyses: the High Arctic archipelago of Svalbard
31
behavior of glaciers. The very first recorded surges (interpreted later as such) took place on
Recherchebreen in c. 1839 (French expedition La Recherche), and on Basin 3 of Austfonna between
1850-1878 (Swedish expedition of Adolf Erik Nordenskiøld). Liestøl (1969) and Schytt (1969) realized
early that a large concentration of surge-type glaciers can be found on Svalbard.
Surges in Svalbard have often been described as ‘muted’ or ‘sluggish’ compared to surges in
Alaska (Jiskoot, 1999 ; Dowdeswell and others, 1991). The surge cycle is indeed longer, and velocities
experienced during the surge phase tend to be slower. Typically the surge cycle spans from 30 years
on Tunabreen (Hagen and others, 1993 ; Blaszczyk and others, 2009) to 500 years for Bråsvellbreen
(Dowdeswell and others, 1991). The average surge cycle duration is actually close to 60-70 years for
the limited number of glaciers that have surged more than twice on Svalbard. The duration of the
surge phase is on average around 6 years (Lefauconnier & Hagen, 1991 ; Hagen and others, 1993) but
longer surges up to 12 years in duration are not rare (Nuth and others, 2007 ; Blaszczyk and others,
2009). The long duration of the surge cycle in Svalbard has been attributed to the low accumulation
rates on Svalbard glaciers (Dowdeswell and others, 1991).
Liestøl (1969, 1988) gathered evidence of a very large number of surges towards the end of
the LIA. The rapidly changing conditions could have caused a wave of surges or surge-like advances.
However, evidence is sparse, and some surges could have been confused with a large glacial extent in
response to favorable LIA conditions (Lefauconnier & Hagen, 1991). Dowdeswell and others (1995)
predicted that, in a context of climate warming causing more negative mass balances, fewer and
fewer surges should occur in Svalbard. This is definitely not the case as today in 2015 no less than 15
glaciers are simultaneously surging (pers. Com. Luckman, April 2015).
4.2.4 Thermal regime of Svalbard glaciers
Regional mechanisms of surging were investigated through a sample of six glaciers (Fig. 3):
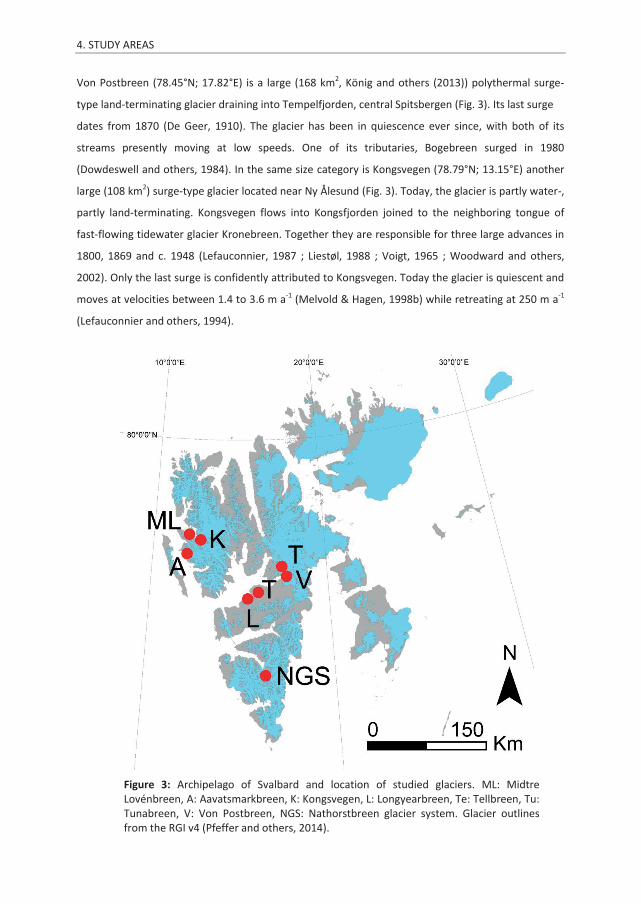
4. STUDY AREAS
Von Postbreen (78.45°N; 17.82°E) is a large (168 km2, König and others (2013)) polythermal surge-
type land-terminating glacier draining into Tempelfjorden, central Spitsbergen (Fig. 3). Its last surge
dates from 1870 (De Geer, 1910). The glacier has been in quiescence ever since, with both of its
streams presently moving at low speeds. One of its tributaries, Bogebreen surged in 1980
(Dowdeswell and others, 1984). In the same size category is Kongsvegen (78.79°N; 13.15°E) another
large (108 km2) surge-type glacier located near Ny Ålesund (Fig. 3). Today, the glacier is partly water-,
partly land-terminating. Kongsvegen flows into Kongsfjorden joined to the neighboring tongue of
fast-flowing tidewater glacier Kronebreen. Together they are responsible for three large advances in
1800, 1869 and c. 1948 (Lefauconnier, 1987 ; Liestøl, 1988 ; Voigt, 1965 ; Woodward and others,
2002). Only the last surge is confidently attributed to Kongsvegen. Today the glacier is quiescent and
moves at velocities between 1.4 to 3.6 m a-1 (Melvold & Hagen, 1998b) while retreating at 250 m a-1
(Lefauconnier and others, 1994).
Figure 3: Archipelago of Svalbard and location of studied glaciers. ML: Midtre Lovénbreen, A: Aavatsmarkbreen, K: Kongsvegen, L: Longyearbreen, Te: Tellbreen, Tu: Tunabreen, V: Von Postbreen, NGS: Nathorstbreen glacier system. Glacier outlines from the RGI v4 (Pfeffer and others, 2014).
4.2 Regional analyses: the High Arctic archipelago of Svalbard
33
Tunabreen (78.56°N; 17.61°E) is another large (163 km2) surge-type tidewater glacier draining
Filchnerfonna and Lomonosovfonna into Tempelfjorden (Fig. 3). Its tongue is separated from that of
Von Postbreen by an ice-cored moraine. It is one of the few glaciers in Svalbard that has been
observed to surge three times since the end of the LIA: in the 1930s, 1970s and from 2003-2005.
Today the glacier is quiescent and fast flow velocities occur at the calving front (1 m d-1) (Flink, 2013 ;
Flink and others, 2015).
Midtre Lovénbreen (78.88°N; 12.03°E) is one of the most studied glaciers in Svalbard. The
glacier is a relatively small (5.2 km2) land-terminating glacier found close to Ny Ålesund (Fig. 3). It was
identified by Liestøl (1988) as a surge-type glacier although other studies have since then disagreed
with this classification (Jiskoot and others, 2000 ; King and others, 2008). The glacier is currently
retreating and flows at velocities under 7.3 m a-1 (Rippin and others, 2005).
Small land-terminating glaciers Tellbreen (78.25°N; 16.17°E) and Longyearbreen (78.17°N;
15.46°E) are located in central Spitsbergen (Fig. 3). Tellbreen is a small (3.9 km2), thin (<100 m,
Bælum & Benn (2011)) cold valley glacier, thinning and slow-moving (<1 m a-1) (AGF212, 2014). No
surges have ever been observed on this glacier although recent studies of its basal ice and internal
structures have uncovered evidence of faster flow in the past (Lovell and others, 2015).
Longyearbreen is slightly smaller (2.9 km2) but thicker (140 m, Etzelmüller and others (2000)) than
Tellbreen. It is flowing between 1 and 4 m a-1 and experiencing negative balance (Hagen and others,
2003). Similarly to Tellbreen, Longyearbreen has never been identified as a surge-type glacier
(Humlum and others, 2005).
4.3 Individual case studies
The chronology of two surges was reconstructed in detail: the surge of the Nathorstbreen glacier
system (NGS) that started in 2008, and the surge of Aavtsmarkbreen (2013-2015) (Fig. 3).
The Nathorstbreen glacier system (77.30°N ; 16.67°E) is a very large glacier (430 km2)
composed of four main branches flowing into Van Keulenfjorden in southern Spitsbergen. A large
surge of the glacier system is thought to have occurred in 1870 based on the comparison of maps
made during expeditions 1861 and 1905 (Liestøl, 1973). This produced an advance of 12 km into the
fjord. Over the last century, the glacier retreated over 17.5 km (Sund and others, 2014). An advance
of the combined terminus of the NGS started to occur in 2008-2009, and marked the beginning of
one of the largest surges ever recorded in Svalbard since the 1930s (Sund and others, 2014).

4. STUDY AREAS
Aavatsmarkbreen (78.70°N 12.29°E) is a large (73 km2) tidewater glacier found on the north
west coast of Spitsbergen, south of Ny Ålesund (Fig. 3). The glacier has had two previous advances,
one between 1909 and 1936-38 (Niewiarowski, 1982 ; Lankauf, 1999), and in the early 1980s
(Lankauf, 1999). The glacier has lost over 1.3 km in length from 1990 and 2006 (Grześ and others,
2008). After a relatively short quiescence of 30 years, the glacier started accelerating in May 2013,
and produced a two year long upward propagating surge.
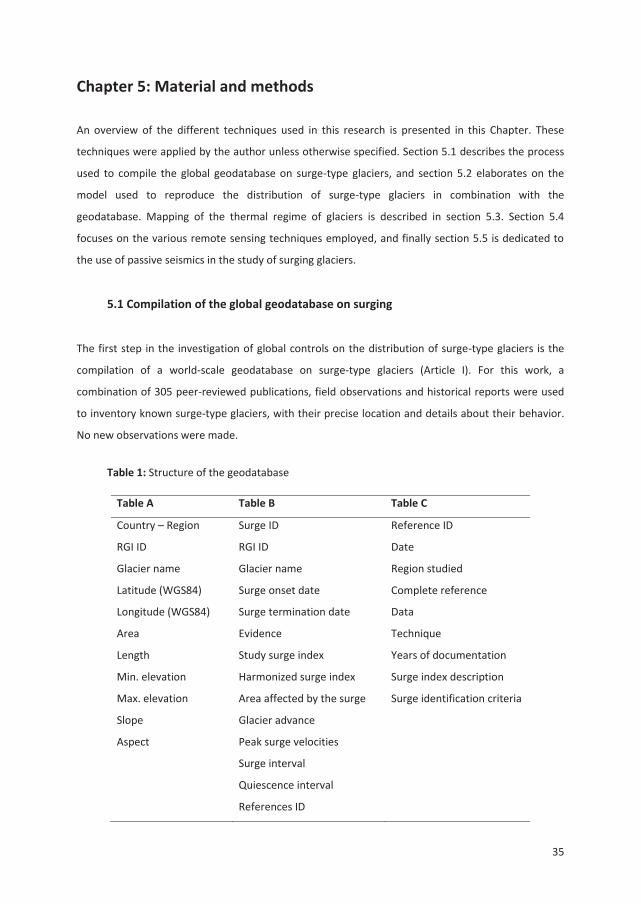
35
Chapter 5: Material and methods
An overview of the different techniques used in this research is presented in this Chapter. These
techniques were applied by the author unless otherwise specified. Section 5.1 describes the process
used to compile the global geodatabase on surge-type glaciers, and section 5.2 elaborates on the
model used to reproduce the distribution of surge-type glaciers in combination with the
geodatabase. Mapping of the thermal regime of glaciers is described in section 5.3. Section 5.4
focuses on the various remote sensing techniques employed, and finally section 5.5 is dedicated to
the use of passive seismics in the study of surging glaciers.
5.1 Compilation of the global geodatabase on surging
The first step in the investigation of global controls on the distribution of surge-type glaciers is the
compilation of a world-scale geodatabase on surge-type glaciers (Article I). For this work, a
combination of 305 peer-reviewed publications, field observations and historical reports were used
to inventory known surge-type glaciers, with their precise location and details about their behavior.
No new observations were made.
Table 1: Structure of the geodatabase
Table A Table B Table C
Country – Region
RGI ID
Glacier name
Latitude (WGS84)
Longitude (WGS84)
Area
Length
Min. elevation
Max. elevation
Slope
Aspect
Surge ID
RGI ID
Glacier name
Surge onset date
Surge termination date
Evidence
Study surge index
Harmonized surge index
Area affected by the surge
Glacier advance
Peak surge velocities
Surge interval
Quiescence interval
References ID
Reference ID
Date
Region studied
Complete reference
Data
Technique
Years of documentation
Surge index description
Surge identification criteria
5. MATERIAL AND METHODS
The geodatabase is divided into three tables (Table 1). All glaciers included in the database are
listed in Table A, along with glacier location and a suite of key information on glacier geometry.
Tributaries are included as separate entries when their behavior differs from that of the main trunk.
Table B compiles all the evidence that led to the identification of a glacier as surge type. In the case
of a direct observation of a surge, information on surge timing and magnitude is provided. Finally, all
references are provided in Table C. Out of the 2317 glaciers composing the geodatabase, 1148 surges
were directly observed. A total of 186 glaciers have been observed to surge more than once.
Integrity of the geodatabase was preserved by evaluating every entry. To be included in the
database, glaciers had to display either periodical changes in flow velocity, advances asynchronous to
neighboring glaciers or combinations of glaciological and geomorphological evidence. Secondly, a
surge-index was implemented in order to rank the quality of the identifications based on the
evidence presented.
To allow comparison with normal glaciers, every surge-type glacier is associated with its
Randolph Glacier Inventory ID. To do so, a spatial join was performed by combining the centerpoint
of surge-type glaciers with glacier outlines of the RGI. As a result, tributaries were merged with their
main trunk, resulting in a total of 1430 individual surge-type glaciers. The RGI was first released in
February 2012 and can downloaded from: http://www.glims.org/RGI/ (Arendt & others., 2012).
The potential of this geodatabase goes beyond this work as it enables to study the surge
phenomenon on the global, regional and individual scale. It also allows spatio-temporal analyses of
surge trends, magnitudes, periodicities, as well as inter- and intra-cluster comparisons as all the
glaciers are georeferenced.
5.2 Investigating controls on global distribution of surge-type glaciers with Maxent
Finding the controls on the distribution of surge-type glaciers has been a strong focus in glaciology
for the past 30 years. The development of statistical tools such as univariate and multivariate
regression techniques have enabled the investigation of the relationships between a variety of
glaciological and environmental controls and surging (Jiskoot and others, 2000 ; Hamilton &
Dowdeswell, 1996 ; Clarke and others, 1986 ; Clarke, 1991 ; Barrand & Murray, 2006). However,
controls on the global distribution of surge-type glaciers had not been investigated before this work.
We used the Species Distribution Model Maxent version 3.3.3k (Phillips and others, 2006 ;
Phillips & Dudík, 2008) to investigate the global distribution of surge-type glaciers. Maxent aims to
maximize entropy of a species in a geographic domain of a species in relation to a set of
environmental variables (James and others, 2015). The model is based on two components. First, the
5.2 Investigating controls on global distribution of surge-type glaciers with Maxent
37
presence data (i.e. known locations of the species) defines constraints on the probability distribution.
Second, the model uses maximum entropy as a probability distribution to fulfil these constraints.
Maxent originally starts by assuming a perfectly uniform probability before drifting from this
distribution only to the extent that it is forced to by the constraints (Merow and others, 2013). The
selected distribution is therefore only informed by the prior data.
To investigate a species’ distribution Maxent requires a dataset of presence locations and a
suite of environmental variables (the predicators). The global geodatabase on surge-type glaciers is in
this case the list of presence locations. Environmental variables consist of mean annual temperature
and mean annual precipitation extracted from ERA-Interim (ERA-I) reanalysis data (European Centre
for Medium-Range Weather Forecasts, Dee and others (2011)), glacier area from the RGI v3.2
(Arendt & others., 2012) and length, slope, and range derived from a global dataset of glacier
centerlines and the ASTER GDEM v2 (Machguth & Huss, 2014 ; Kienholz and others, 2014). To ensure
spatial consistency between climate and geometry datasets, glacier geometry values of all glaciers
present in every ERA-I cells were averaged. The same grid was therefore used for ERA-I and glacier
geometry data.
Maxent’s main output is a map of the probabilities of presence of surge-type glaciers across
the glacierized regions. The model output is evaluated using the AUC (area under the receiver
operating curve) (Hanley & McNeil, 1982). It discriminates between presence and background points.
An AUC of 0.5 qualifies the model as no better than random, while values over 0.5 show a higher
predictive power. Two series of runs were performed and compared. First, the model was trained on
75% of the presence data and tested on the other 25%. And second, a 10-fold cross validation was
used, testing 10% of the training data at each repetition (Radosavljevic & Anderson, 2014).
Importance of the different variables in building the model was analyzed by a Jackknife test (Wu,
1986). Finally, response curves show how climate and glacier geometry variables influence the
probabilities of presence.
5.3 Investigation of the thermal regime of surge-type glaciers in Svalbard
Ground penetrating radar (GPR) has been widely used to investigate the thermal regime and to
measure the thickness of Svalbard glaciers (Hagen & Sætrang, 1991 ; Björnsson and others, 1996 ;
Macheret & Zhuravlev, 1982 ; Macheret and others, 1985 ; Kotlyakov & Macheret, 1987 ;
Dowdeswell and others, 1984 ; Bamber, 1987 ; Drewry and others, 1980). The propagation of
electronic waves emitted by ground penetrating radar is influenced by the ice dielectric properties.
Cold ice is transparent to electromagnetic waves, whereas small volumes of liquid water contained in
5. MATERIAL AND METHODS
temperate ice cause strong scattering, making the two easily distinguishable (Navarro & Eisen, 2009).
Comparisons of borehole temperature measurements and GPR data in Svalbard showed that a
continuous internal reflecting horizon (IRH) corresponds to the cold-temperate transition surface
(CTS) (Hagen & Sætrang, 1991 ; Björnsson and others, 1996).
For this work, data were collected on a number of glaciers chosen for their representativeness
of the different types of glaciers found in Svalbard: tidewater and land-terminating glaciers, as well
as large and thick, small and thin glaciers, quiescent and surging glaciers (Articles II and IV). Here we
describe the GPR system and processing sequence used in Article II. A complete Malå system was
employed, fitted with “rough terrain” antennae with center frequencies between 25 and 100 MHz.
Ideally, higher frequencies (>345 MHz) are most suitable for detecting the CTS (Pettersson, 2005),
thus the frequencies we use provide a minimum thickness for the CTS. The Malå system is limited to
267 m in depth, but the focus is to map the CTS, which is generally shallower. Transmitter and
receiver are oriented in line, and the configuration of the antennae only allows for common offset
surveys. A GPS was connected to the system for positioning of the survey lines in the vertical and
horizontal. Typically GPS coordinates were recorded every 5-25 traces. In the field, the system is
installed on a snowscooter, and the antenna is pulled as the scooter moves at a constant speed close
to or below 20 km h-1.
Data were processed using a combination of two softwares. ReflexW version 7.5 (Sandmeier
Scientific Software) was used for the main processing, while Petrel version 6.1.7601 (Schlumberger)
allowed 3D interpolation of the results. Pre-processing of the raw data consisted of correcting errors
in GPS positioning, time zero adjustment and removal of repeated traces. Main processing steps
included Dewow to suppress unwanted low frequencies, dynamic correction and implementation of
a constant time increment between all traces. Data were migrated in order to move the reflections
and diffractions to their true position. A kirchhoff migration with a velocity of 0.167 m ns-1 was used
on a bracket of 150 traces. A bandpass butterworth filter was applied to reduce noise caused by the
migration, and finally a linear gain function strengthened the signal with depth. Bed and CTS were
then manually picked on every single radargram. The software Petrel was then used to interpolate
the picked data and provide a unique representation of the thermal structure of the glaciers.
Uncertainties in this technique can be divided into system-specific limitations, data processing
errors, and positioning errors. System-specific limitations are related to the vertical and horizontal
resolution of the antenna chosen for each survey. Data processing and more particularly manual
picking of reflectors introduce uncertainties. Migration quality and cross-over errors were assessed
by measuring offsets between the bed reflector of valley-parallel and valley-transverse lines. Finally,
errors in positioning were accounted for. In the early surveys (Tellbreen, Von Postbreen, Kongsvegen

5.3 Investigation of the thermal regime of surge-type glaciers in Svalbard
39
and Midtre Lovénbreen) a Garmin handheld GPS with an accuracy of 15 m in the horizontal and in
the vertical was used, while in the recent surveys a Trimble SPS885 GPS was preferred, characterized
by an accuracy of 30 cm both in the horizontal and vertical.
5.4 Remote sensing techniques
A variety of remote sensing techniques were used in this work. They were essential to derive glacier
velocities on a high temporal and spatial resolution, measure elevation changes, and map crevasse
propagation during surging.
5.4.1 Extracting velocities from feature-tracking of TerraSAR-X images
Feature-tracking of synthetic aperture radar (SAR) images has been widely used to derive glacier
surface velocities (Luckman and others, 2006 ; Fallourd and others, 2011 ; Floricioiu and others,
2009). The TerraSAR-X satellite, launched in 2007, provides its own source of illumination making in
independent of sun light. X-band (9.65 GHz) SAR images penetrate rain and cloud, allowing year-
round monitoring of the Polar Regions. Strength of the backscatter depends on the wavelength,
humidity and roughness of the surface.
A. Luckman applied feature-tracking to derive glacier velocities of Aavatsmarkbreen
throughout its surge (Article IV). The technique consists of matching patches between repeat pass
pairs of images and converting the displacement in velocity (Strozzi and others, 2002 ; Luckman and
others, 2006). Glaciers commonly display surface features such as crevasses, debris, making tracking
particularly efficient. Errors in the technique arise when the surface features change too significantly
for matching. Quality of the results can be assessed by tracking over off-glacier “zero-displacement”
areas.
5.4.2 Measuring elevation changes
Differencing digital elevation models (DEMs) consists of subtracting DEMs collected at different
epochs. Significant changes in elevation occur during the surge cycle. Measuring these elevation
changes enables the detection of patterns of mass accumulation in the reservoir zone prior to
surging, and during the surge itself, drawdown up-glacier and thickening of the receiving zone.
C. Nuth employed a large variety of DEMs in Articles III and IV. To investigate the surge of the
NGS (Article III), four different DEMs were employed: a DEM from the Norwegian Polar Institute built

5. MATERIAL AND METHODS
from aerial photographs collected in 1990 (20 m resolution), a SPOT5 HRS DEM (resolution of 5 m
and 10 m in the vertical) from 2008 and ASTER DEMs from 2003 and 2010 (30 m resolution) (Article
III). DEM differencing followed the sequence presented in Nuth & Kääb (2011), with co-registration of
the datasets to WGS 1984 UTM zone 33, and correction of elevation-dependent biases and
instrumentation related errors.
DEMs were also used to detect elevation changes of Aavatsmarkbreen during its surge (Article
IV). Glacier longitudinal profiles were extracted from four different DEMs to reconstruct changes in
elevation during the two decades prior to surging.
5.4.3 Crevasse mapping on SAR images
As explained above, backscatter strength is affected by the dielectric properties and texture of the
reflecting material. During the surge of the NGS (Article III), high backscatter values corresponded to
pervasively crevassed ice, as opposed to low backscatter values over smoother ice. A total of 1468
ENVISAT ASAR C-band Wide Swath Mode scenes collected between 1st January 2007 and 31st
December 2010 were acquired. Each scene was classified according to backscatter intensity in order
to monitor the propagation of highly crevassed ice. Training sets collected in highly crevassed areas
displayed an average value of -5 dB. This threshold was used to identify highly crevassed ice on all
the scenes. The spatial propagation of crevassing was then analyzed to understand surge onset and
its development. Classification was only applied to the lower reaches of the NGS in order to avoid
changes in reflection due to the presence of snow and firn. Nevertheless, backscatter values reached
a minimum every summer when meltwater was present on the glacier surface. The technique
worked best when the glacier surface remained frozen, from the months of October until June. Short
drops in winter backscatter values occurred during rain on snow events, while short peaks
corresponded to short-lived increases in temperature.
SAR images can also be used for manual mapping of glacier surface features. This technique
was implemented in the study the surge of Aavatsmarkbreen (Article IV). In this case, TerraSAR-X
images were chosen for the mapping. Their high spatial resolution (2 m) and low penetration of the
signal (<1 m in snow) make them particularly suitable for mapping. Three winter scenes were chosen
in order to avoid difficulties in observing features due to surface melt.
5.5 Passive seismics
41
5.5 Passive seismics
This technique has been applied to study ice quakes emerging during stick-slip events (Weaver &
Malone, 1979 ; Deichmann and others, 1979 ; Ekström and others, 2003), iceberg calving (Walter and
others, 2010 ; O'Neel & Pfeffer, 2007), and crevasse opening (Mikesell and others, 2012). In Svalbard,
a few studies have employed temporary networks of seismometers to study surge mechanisms
(Stuart and others, 2005), and calving activity (Köhler and others, 2012 ; Vinogradov and others, 2015
; Cichowicz, 1983). This technique fits well with the challenging monitoring of surging glaciers, as
seismometers can remotely and safely sense activity occurring tens of kilometers away.
Regional seismic networks have numerous advantages as they allow continuous monitoring of
large areas over several years. A network of three permanent stations can be found on Spitsbergen,
separated by about 100 km. The main station was installed at Longyearbyen in 1992 (SPITS array). It
consists of 9 instruments and has an aperture of a kilometer. Two smaller stations with single
seismometers are located at Ny Ålesund and Hornsund. The stations started operating respectively in
1994 and 2007 (see Köhler and others (2015) for further description of the network specificities).
The regional network of Spitsbergen can detect tectonic activity, calving, surging-related
calving, and most interestingly, surging on land. A large peak of seismic activity was detected from
October 2008 to May 2009 in the vicinity of Nathorstbreen glacier system (NGS) (Article III). A. Köhler
collected, processed and analyzed the seismics data. The signature of the seismic events were
different from that of calving as they displayed no seasonality, lacked low frequencies and originated
from one of the tributaries of the NGS.
Data pre-processing commonly consists of selecting a small number of strong seismic events
with clear seismic phase arrivals for localization. A total of 96 events were selected from the SPITS
array (magnitude >0.5) and from Hornsund station (magnitude >1). Traditional methods of
localization of seismic events detected on three or more seismic stations are inadequate for events
detected at regional distances. In this instance, event localization was performed by measuring the
time delay between P and S wave, calculating the backazimuth (station to source direction) and using
the BARENTS3D regional velocity model for wave propagation velocities (NORSAR, 2014 ; Köhler and
others, 2015). Errors in localizations were estimated using the mean and standard deviation of
backazimuth and distance. Two different techniques were applied to calculate the backazimuth from
the Longyearbyen and Hornsund stations, resulting in two different error ellipses.
Local magnitudes of the seismic events were calculated based on a magnitude-amplitude
(power law) relation based on regional tectonic events recorded from one of the seismometers in
Longyearbyen. The local magnitude was then converted to seismic moment using an empirical
relation.

43
Chapter 6: Summary of articles and key results
Article I: Climatic and geometric controls on the global distribution of surge-type glaciers:
implications for a unifying model of surging
Surge-type glaciers represent about 1% of the world’s glacier population (Jiskoot and others, 1998).
Despite this relatively small proportion, surge-type glaciers have attracted a great deal of attention
over the past few decades. Their periodic behavior, alternating between fast and slow flow is one of
the largest enigmas in glaciology. The issue of surging goes beyond the fascination for the
phenomenon. We cannot be satisfied with our present understanding of glacier flow if we cannot
provide a clear explanation as to why some glaciers surge, while most do not. Only an innovative
approach could shine a new light on the surge phenomenon. One of the most puzzling facts about
surge-type glaciers is their abundance in some regions, while they are completely absent in others.
We speculate that the non-random distribution of surge-type glaciers holds the key to a better
understanding of the surge phenomenon. In this paper, the role of climate on the global distribution
of surge-type glaciers is examined, while glacier geometry is investigated as a possible secondary,
local-scale control.
A global inventory of surge-type glaciers is compiled. Climate data were extracted from the
ERA-Interim reanalysis dataset (Dee and others, 2011). We focused on two main variables, namely
mean annual temperature and mean annual precipitation averaged from January 2000 to December
2009. For every glacier in the world, whether it is normal or of surge-type, mean annual temperature
and mean annual precipitation were extracted based on location of the glacier centerpoint. Glacier
area was derived from the RGI outlines (Arendt & others., 2012), while length, slope and range were
obtained from Machguth and Huss (2014) centerline dataset and the ASTER GDEM v2. Maxent, a
species distribution model is employed to reproduce the distribution of surge-type glaciers based on
a limited set of variables, and to investigate variable importance in their distribution.
Analysis of the climatic distribution of surge-type glaciers reveals that they are concentrated in
a narrow climatic envelope bounded by temperature and precipitation, which we identified as the
'optimal surge envelope' (Fig. 4). Interestingly, there is a near perfect overlap in climatic
characteristics of the two surge superclusters (the 'Arctic Ring' and western Central Asia). Surge-type
glaciers are longer and have greater areas than normal glaciers across all regions, especially at the
cold and dry end of the climatic spectrum (Fig. 6). Maxent accurately reproduced the distribution of
the main surge clusters based on four variables: mean annual temperature and mean annual
precipitation, and mean glacier length and surface slope (Fig. 9). High probabilities of presence were

6. SUMMARY OF ARTICLES AND KEY RESULTS
attributed over the major surge clusters; however more marginal clusters such as the Andes,
Caucasus and Arctic Canada are under-predicted.
The results are interpreted in terms of a new enthalpy cycle model. For a glacier to remain
close to equilibrium, the glacier must maintain balance velocities, and energy gains must be matched
by energy losses. At the cold and dry end of the climatic spectrum, surge-type glaciers are scarce, but
are noticeably larger than normal glaciers. On small glaciers, low basal enthalpy production is easily
dissipated by heat conduction. Large and thick glaciers have higher basal enthalpy production, and
their thickness reduces heat losses to the atmosphere. Therefore, large glaciers are less likely to find
a balance between enthalpy production and dissipation. At the warm and wet end of the climatic
spectrum, densities of surge-type glaciers are very low. Glaciers in these environments have a high
turnover, thus enthalpy production is significant. High runoff evacuates enthalpy gains via efficient
drainage networks. Finally, in the optimal surge envelope, enthalpy gains cannot be fully dissipated
by enthalpy losses. In temperate glaciers this causes growing storage of water, while in polythermal
glaciers, ice is progressively brought to the pressure melting point, and eventually melts, contributing
to storage of meltwater.
Glacier geometry exerts a second-order control on enthalpy balance. Large, long and branchy
glaciers are higher enthalpy producers than small glaciers. Enthalpy gains are less easily evacuated by
conduction on thick glaciers. Drainage systems are more vulnerable to instabilities under long
glaciers. This hierarchy in the controls on the distribution of surge-type glaciers is further reflected by
Maxent’s results. The model predicted the distribution of surge-type glaciers well based on climatic
variables only, but failed to do so based solely on glacier geometry variables.
Our results also suggest that many other local-scale controls such as thermal regime, bed
substrate, or subglacial topography must be involved in the mechanisms of surging. The enthalpy
cycle model redefines surging as a way glaciers respond to their climatic and topographic
environments.

45
Article II: Thermal structure of Svalbard glaciers and implications for thermal switch
models of glacier surging
Two main mechanisms are used to explain glacier surging today: the hydrologic switch mechanism
for temperate glaciers (Kamb, 1987), and the thermal switch mechanism for polythermal glaciers
(Fowler and others, 2001). We test the validity of the thermal switch mechanism for surges in
Svalbard. The archipelago is home to a dense population of surge-type glaciers. By comparing
published data with new GPR data collected for this work, we measure the evolution of the thermal
structure of surge-type glaciers through time. Finally, we reflect on the possibility for glaciers to go in
and out of surge cycling by focusing on small, cold, low-activity glaciers which display strong evidence
of past fast-flow dynamics.
The thermal regime of six glaciers is investigated. The glaciers were chosen for their
representativeness, surge history and availability of previously collected data. Among the large
glaciers of our sample, Kongsvegen and Tunabreen are marine-terminating and Von Postbreen is
land-terminating. All three have a known surge history and are currently in quiescence. Their thermal
structure was mapped in the past (Hagen & Sætrang, 1991 ; Björnsson and others, 1996 ; Bamber,
1987). The three other glaciers are small and land-terminating. Midtre Lovénbreen is known to
display a polythermal structure with a narrow core of temperate ice at its base (Björnsson and
others, 1996), and has a disputed surge history (Hambrey and others, 2005 ; King and others, 2008).
The remaining two, Longyearbreen and Tellbreen are cold and have not previously been identified as
surge-type glaciers (Etzelmüller and others, 2000 ; Bælum & Benn, 2011).
The six study sites were revisited between 2009 and 2015 with a Malå GPR system. Antennae
with center frequencies between 25 and 100 MHz were used to distinguish cold from temperate ice
(Table 1). The main processing of the radar data was achieved using ReflexW (Sandmeier Scientific
Software). The same processing sequence was used for bed and CTS mapping (Table 2). Picking of
these horizons was done manually. A second software, Petrel (Schlumberger) allowed interpolation
of the picked lines, improving the visualization of the thermal structure and thickness of the glaciers.
A detailed estimation of the errors related to the GPR system, data localization and data processing is
provided.
New data reveals that the large surge-type glaciers of our sample are remain almost fully
warm-based during their quiescence. Von Postbreen (Fig. 1) is a typical polythermal glacier of type e
while Kongsvegen (Fig. 2) is a variation of type e in which the frozen terminus is removed by calving
(Pettersson, 2004). Since previous studies, the shallow cold layer has expanded horizontally up-
glacier and has deepened (Björnsson and others, 1996). The tidewater glacier Tunabreen (Fig. 3) is
structurally very similar to Kongsvegen although its last surge in 2003 brought the CTS closer to the
6. SUMMARY OF ARTICLES AND KEY RESULTS
surface (Bamber, 1987). Midtre Lovénbreen is a polythermal glacier of type e in the process of
cooling (Figures 4,5). Finally, Tellbreen and Longyearbreen are entirely cold (Figures 6, 7). Studies
have revealed that Tellbreen and Midtre Lovénbreen display evidence of formerly more dynamical
flow (Glasser & Hambrey, 2001 ; Hambrey and others, 2005 ; Lovell and others, 2015). On
Longyearbreen, we detected a large number of elongated internal reflectors extending from the bed
to the surface, which corresponds to arcuate features on the glacier surface (Fig. 8).
Glaciological and geomorphological features show that small glaciers of our sample were more
active in the past. We propose that these glaciers underwent thermal cycling (from cold to warm)
when the conditions were optimal during the LIA. This resulted in a sudden and temporary dynamical
switch to fast flow, similar to the thermal switch mechanism proposed by Fowler and others (2001).
Larger glaciers such as Tunabreen and Kongsvegen do not display a frozen terminus, and together
with Von Postbreen remain fully warm-based during quiescence. Thermal switches therefore cannot
be involved in surge initiation on large and thick glaciers.
We explain the former fast-flow behavior of small glaciers as well as the cyclic surges of large
glaciers with the concept of enthalpy cycling (presented in Article 1). Under the present climate,
small and thin glaciers are low enthalpy producers. Conduction and runoff of meltwater efficiently
balance enthalpy production. However, during the LIA, favorable conditions led to sustained mass
accumulation. Enthalpy production rose as the glaciers were thickening. Net enthalpy gains yielded
positive feedbacks at the bed, ultimately toppling the glaciers into above balance velocity flow
regimes. On the other hand, large glaciers currently undergo periodic surges. As these glaciers are
warm-based, enthalpy cycling is manifested by variations in production and drainage of meltwater.
The efficiency of conductive heat losses is reduced by the glacier thickness. Studies have shown that
glaciers with high altitude accumulation basins still accumulate mass (Nuth and others, 2007). The
glacier flow rates must remain below balance velocities to allow build-up of mass. As potential
energy is increasing, basal enthalpy production rises, encouraging meltwater production. If
meltwater cannot be discharged by efficient drainage networks, pressure builds-up in the system,
eventually triggering a surge.
We argue that enthalpy cycling can explain the full spectrum of surging behavior in Svalbard.
Our findings also provide a new explanation on the proportion of surge-type glaciers on the
archipelago. During the LIA, surges or surge-like instabilities affected a very large number of small
glaciers in Svalbard, agreeing with the estimation of Lefauconnier and Hagen (1991) for the period
prior to the 20th century. However, under the present conditions, about 20% of all glaciers of
Svalbard surge (Article I)
47
Article III: Seismic detection of a catastrophic glacier surge
At the end of 2008 – early 2009 the permanent regional seismic network of Spitsbergen
detected a burst of activity in the vicinity of the Nathorstbreen glacier system (NGS). Signals recorded
were significantly different from that of calving or tectonic activity. The NGS was then initiating one
of the largest surges recorded on Svalbard since the 1930s (Sund and others, 2014). Interestingly,
seismic activity completely ceased three months later, despite continuation of the surge until 2013.
In this study, we located the origin of the seismic signals, and with a combination of DEM differencing
and mapping crevasse propagation we reconstructed the chronology of events leading to the surge.
The NGS is composed of four glaciers flowing as a combined front into Van Keulenfjorden in
southern Spitsbergen (from west to east: Zawadzkibreen (Z), Polakkbreen (P), Nathorstbreen-
Ljosfonn (N) and Dobrowolskibreen (D)). The NGS extends from 944 m a.s.l. to sea level (König and
others, 2013). The glacier has been in quiescence since its last surge in 1870 (Liestøl, 1973 ; De Geer,
1910). Radio echo-soundings from 1980 show a polythermal regime with mostly temperate ice and a
frozen terminus (Dowdeswell and others, 1984).
Records of seismic events were collected from the permanent stations of Longyearbyen (SPITS
array, 90 km north of the NGS) and Hornsund (40 km south). The first signals were detected in
October 2008, but the main period of activity occurred from early January to May 2009. A total of
14 000 low-magnitude events were detected. Only the 96 of the strongest and clearest events were
used for localization, and tributary Z was revealed as the main source of the signals (Fig. 1).
DEM differencing allowed reconstruction of the chronology of events leading to the surge.
Between 1990 and 2003 mass was building-up at high elevations on tributaries Z, P and D. From 2003
to 2008 mass was transported downstream on Z and D. The mass transfer stopped a few kilometers
from the glacier front, at the limit between temperate and cold ice (Fig. 1).
ENVISAT ASAR C-band wide swath mode scenes were used to map crevasse propagation
before and during the surge. In the ablation area of the glacier, when melting did not occur,
backscatter strength was mostly dominated by surface texture. Highly crevassed regions were
characterized by backscatter values greater than -5 dB. A total of 1468 scenes were classified based
on backscatter intensity (Fig. 3). Between October 2008 and January 2009, crevassing rapidly covered
the entire lower reaches of D, indicating activation of a surge. During the main period of seismic
activity, linear zones of crevassing formed around the frozen terminus, and between the different
branches of the NGS. The onset of the surge of the NGS therefore coincided with the fracturing and
collapse of the frozen terminus. Crevassing also expanded along the lateral margins of Z and between
Z and its two small tributaries Rozyckibreen (R) and Biernawskibreen (B).

6. SUMMARY OF ARTICLES AND KEY RESULTS
Comparison of high-resolution optimal images between September 2008 and July 2009
showed the formation of unusually large chasms in these areas, up to 100 m wide and 50 m deep
(Figures 1 and 6). Furthermore, long rifts formed along the margins of Z.
Similarly to the surge of Aavatsmarkbreen (Article IV), we conclude that the surge of the NGS is
the result of multi-year processes. The advance of the NGS was eventually triggered by the failure of
its frozen tongue. As a result, stresses were suddenly transferred to the margins of Z and regions of
high bed strength. Seismic signals originated from the catastrophic collapse of Z, while terminus
advance did not lead to detectable seismicity. The absence of signals during the main phase of the
surge suggests glide over a weak bed with little energy release. The surge of the NGS is analogous to
glacier speed-ups following the collapse of the Larsen ice shelves. Removal of backstress causes
sudden glacier acceleration in both cases.
49
Article IV: A tidewater glacier surge initiated at the terminus: Aavatsmarkbreen, Svalbard
Aavatsmarkbreen is a surge-type glacier found in north-western Spitsbergen (Fig. 1). After
three decades of recession and thinning, the glacier underwent a two year-long acceleration reaching
velocities nine fold those during quiescence. The speed-up was initiated at the front and propagated
to regions higher up-glacier. This behavior relates to other observations of surges of tidewater
glaciers in Svalbard such as Osbornebreen (Rolstad and others, 1997), Perseibreen (Dowdeswell &
Benham, 2003), Monacobreen and Fridtjovbreen (Murray and others, 2003a, 2003b). In this study,
we used a rich data set of glacier velocities, bed topography and surface elevation changes to
reconstruct the evolution of the glacier before and during the surge, and investigated what drives the
upward propagating surges of tidewater glaciers in Svalbard.
Feature tracking of TerraSAR-X imagery was used to derive the glacier velocity field c. every 11
days from late 2012 to June 2015. The glacier front position during quiescence was mapped on a
series of Landsat images. The evolution of the crevasse pattern was studied through high-resolution
optical imagery in 2009-2011 and TerraSAR-X SAR images during the surge. Surface elevation profiles
were extracted along the glacier centerline from 1990 to 2010, and the 2015 surface profile and bed
topography were obtained from a helicopter-borne GPR survey performed in May 2015. The
combination of surface longitudinal profiles and bed topography enabled the calculation of the
driving stress from 1990 to 2015.
The 2013-2015 surge was preceded by retreat, thinning, and steepening of the lower 4 km of
the glacier (Fig. 2). No thickening could be detected prior to the surge, nor could we detect the
presence of a surge bulge on the glacier surface. The glacier underwent a progressive acceleration
between the early 2000s and the surge. This acceleration was reflected by the apparition of narrow
transverse crevasses between 2009 and 2011 (Fig. 5). By the end of 2012 large extensional crevasses
had already largely expanded up-glacier (Fig. 6). In May 2013 just as melting was initiated, the glacier
terminal zone started to accelerate, and by the end of the meltseason velocities reached 2.5 m d-1
(Figures 3,4). While flow stabilized through the following autumn and winter, velocities and
crevassing propagated up-glacier. A second step-change in velocities occurred again during the
meltseason, this time with a larger impact on the dynamics. The velocities reached 4.5 m d-1 at the
glacier front, and high velocities could be measured over the lower 9 km of the glacier. A steady
decline followed, and by May 2015 the glacier returned to pre-surge velocities (Fig. 7).
We demonstrate that the surge of Aavatsmarkbreen was caused by two processes. First,
through the years leading to the surge, sustained steepening progressively increased the driving
stress. Strain heating was enhanced at depth, causing the glacier to slowly accelerate and large
extensional crevasses to expand up-glacier. The surge was triggered at the onset of the 2013
meltseason. Routing of surface meltwater to the bed through the expanding crevasse field reduced
6. SUMMARY OF ARTICLES AND KEY RESULTS
bed strength and facilitated glacier motion. The same mechanism took place the following summer,
this time doubling the speeds of the glacier and mobilizing a greater glacier area. At the end of the
meltseason velocities steadily decreased through the following year, reflecting slow release of
subglacial water.
This surge can be understood in terms of enthalpy production/dissipation (presented in Article
I). In the late quiescent phase, strain heating, hence enthalpy increased. Enthalpy production in a
polythermal glacier with a warm base is expressed as a rise in meltwater production. Steepening
continued, indicating that the glacier kept flowing below its balance velocities. Limited enthalpy
production is likely to have been evacuated by an efficient drainage system. However, addition of
large volumes of meltwater through crevasses suddenly increased water storage (hence enthalpy) at
the glacier bed, and eventually triggered the surge. The behavior of Aavatsmarkbreen reflects the
interplay between global and local factors on surging (Articles I and II) and changes in the force
balance (Article III).

51
Chapter 7: Conclusions and future perspectives
Although a small number of glaciers in the world have been observed to surge, the lack of a solid
understanding of their behavior uncovers weaknesses in our knowledge of glacier dynamics. For this
reason, surge-type glaciers have been regarded as ‘abnormal’. They are often excluded from
modelling efforts aiming to quantify glacier’s response to climate forcing. This thesis addresses some
of the essential questions related to surging, and by combining new data with innovative techniques,
provides a novel perspective as to why glaciers surge.
This research shows that the non-random distribution of surge-type glaciers is primarily
governed by climate. Glacier geometry variables on the other hand, act as a second-order control on
surging and allow glaciers to surge outside of the optimal surge envelope. These results led to the
introduction of the enthalpy cycle model. Enthalpy cycling can explain why some regions are prone to
surging. This concept expresses how glaciers interact with their environment, and unites the
behavior of normal and surge-type glaciers under the same framework. The model of enthalpy
cycling can be applied to explain surging of both temperate and polythermal glaciers. In Svalbard
polythermal glaciers remain warm-based throughout their surge cycle, demonstrating that surging of
large glaciers does not occur through thermal switches. However, cold and thin glaciers that today do
not surge display strong evidence of past fast flow dynamics that can be explained by thermal cycling
during the Little Ice Age. The present behavior of large polythermal surge-type glaciers, and the
former dynamics of cold and thin glaciers can also be understood within the enthalpy cycle model.
Finally, case studies have shown that surges in Svalbard are the result of multi-year processes. Failure
of the frozen terminus of the Nathorstbreen glacier system produced the largest advance recorded in
Svalbard since the 1930s, and triggered the catastrophic collapse of one of its tributaries. In turn this
produced a three month long period of unusual seismic activity. Sustained steepening of the
terminus of tidewater glacier Aavatsmarkbreen produced a chain reaction that led to gradual
increase in velocities and expansion of the crevasse field. It is ultimately the transfer of surface
meltwater to the bed that triggered a two year long upward propagating surge. Surges in Svalbard
are therefore the result of the combination of global controls on surging (climate), and controlled by
local factors (thermal regime, geometry).
This new understanding of surge mechanisms and surge behaviors exposes exciting new areas
of research. The geodatabase on surge-type glaciers could be used to refine the analyses of regional
distributions of these glaciers. Combined to high-resolution climatic data and regional datasets of
glacier geometry, bed topography and substrate lithology, regional and local controls on surging

7. CONCLUSIONS AND FUTURE PERSPECTIVES
could be identified. Field data are scarce and challenging to obtain, especially on surging glaciers, but
they are an absolute necessity to further improve our understanding of the surge mechanisms. New
technologies such as wireless sensors for example are perfectly suited to monitor glaciers going into
surging. Further field studies could be designed to quantify the energy balance of neighboring surge-
type and normal glaciers in order to test the enthalpy cycle model. Eventually such field data would
provide a strong basis for modelling of glacier thermodynamics.

53
Chapter 8: References
Abe, T. and M. Furuya 2015. Winter speed-up of quiescent surge-type glaciers in Yukon, Canada. The Cryosphere, 9: 1183-1190. AGF212 2014. Field Report 2014 - Snow and Ice Processes. The University Centre in Svalbard. Ahlmann, H.W. 1953. Glacier variations and climatic fluctuations. New York, American Geograhical Society. Alley, R.B., D.D. Blankenship, C.R. Bentley and S.T. Rooney 1986. Deformation of till beneath ice stream B, West Antarctica. Nature, 322: 57-59. Andreassen, K., M.C.M. Winsborrow, L.R. Bjarnadóttir and D.C. Rüther 2014. Ice stream retreat dynamics inferred from an assemblage of landforms in the northern Barents Sea. Quaternary Science Reviews, 92: 246-257. Arendt, A.A. and a. others. 2012. Randolph Glacier Inventory - A Dataset of Global Glacier Outlines: Version 3.2. In Space, G.L.I.M.f., ed., Boulder Colorado, USA. Aschwanden, A. and H. Blatter 2005. Meltwater production due to strain heating in Storglaciären, Sweden. Journal of Geophysical Research: Earth Surface, 110(F4). Aschwanden, A. and H. Blatter 2009. Mathematical modeling and numerical simulation of polythermal glaciers. Journal of Geophysical Research: Earth Surface, 114(F1). Atkinson, P., H. Jiskoot, R. Massari and T. Murray 1998. Generalized linear modelling in geomorphology. Earth Surface Processes and Landforms, 23: 1185-1195. Bamber, J.L. 1987. Internal reflecting horizons in Spitsbergen glaciers. Annals of Glaciology, 9: 5-10. Barrand, N. 2002. Controls on glacier surging in the Karakoram Himalaya. (Master thesis University of Leeds.) Barrand, N.E. and T. Murray 2006. Multivariate Controls on the Incidence of Glacier Surging in the Karakoram Himalaya. Arctic, Antarctic & Alpine Research, 38(4): 489-498. Benn, D. and D.J.A. Evans 2010. Glaciers and Glaciation, 2nd Edition. Hodder Arnold. Bevington, A. and L. Copland 2012. Characteristics of the last five surges of Lowell Glacier, Yukon, Canada, since 1948. Journal of Glaciology, 60(219): 113-123. Bindeschadler, R., W.D. Harrison, C.F. Raymond and C. Gantet 1976. Thermal regime of a surge-type glacier. Journal of Glaciology, 16(74): 251-259. Bindschadler, R. 1997. Actively surging West Antarctic ice streams and their response characteristics. Annals of Glaciology, 24: 409-414. Björnsson, H., Y. Gjessing, S.-E. Hamran, J.O. Hagen, O. Liestøl, F. Pálsson and B. Erlingsson 1996. The thermal regime of sub-polar glaciers mapped bu multi-frequency radio-echo sounding. Journal of Glaciology, 42(140): 23-32. Björnsson, H., F. Pálsson, O. Sigurðsson, G.E. Flowers, C.F. Raymond and K. Van der Veen 2003. Surges of glaciers in Iceland. Annals of Glaciology, 36: 82-90. Blaszczyk, M., J.A. Jania and J.O. Hagen 2009. Tidewater glaciers of Svalbard: Recent changes and estimates of calving fluxes. Polish Polar Research, 30(2): 85-142. Blatter, H. and K. Hutter 1991. Polythermal conditions in Arctic glaciers. Journal of Glaciology, 37(126): 261-269. Boulton, G.S. 1979. Processes of glacier erosion on different subtrata. Journal of Glaciology, 23: 15-38. Boulton, G.S. and R.C.A. Hindmarsh 1987. Sediment deformation beneath glaciers: rheology and sedimentological consequences. Journal of Geophysical Research, 92(B9): 9059-9082. Boulton, G.S., A.S. Jones, K.M. Clayton and M.J. Kenning 1977. A British Ice Sheet model and patterns of glacial erosion and deposition in Britain. In Shotton, F.W., ed. British Quaternary Studies, Oxford, Clarendon Press, 231-246.
8. REFERENCES
Braun, M., V.A. Pohjola, R. Pettersson, M. Möller, R. Finkelnburg, U. Falk, D. Scherer and C. Schneider 2011. Changes of glacier frontal positions of Vestfonna (Nordaustlandet, Svalbard). Geografiska Annaler, 93(4): 301-310. Budd, W.F. 1975. A first model for periodically self-surging glaciers. Journal of Glaciology, 14(70): 3-21. Burgess, E., R.R. Forster, C.F. Larsen and M. Braun 2012. Surge dynamics on Bering Glacier, Alaska, in 2008-2011. The Cryosphere, 6: 1251-1262. Burgess, E., C.F. Larsen and R.R. Forster 2013. Summer melt regulates winter glacier flow speeds throughout Alaska. Geophysical Research Letters, 40: 6160-6164. Bælum, K. and D.I. Benn 2011. Thermal structure and drainage system of a small valley glacier (Tellbreen, Svalbard), investigated by ground penetrating radar. The Cryosphere, 5: 139-149. Casassa, G., L.E. Espizúa, B. Francou, P. Ribstein, A. Ames and J. Alean 1998. Glaciers in South America. In Haeberli, W., M. Hoelzle and S. Soter, eds. Into the second century of worldwide glacier monitoring: prospects and strategies., Paris, 125-146. (Studies and Reports in Hydrology 56). Cazenave, A. and G. Le Cozannet 2014. Sea level rise and its coastal impacts. Earth's Future, 2(2): 15-34.Cichowicz, A. 1983. Icequakes and glacier motion: The Hans glacier, Spitsbergen. Pure Applied Geophysics, 121(1): 27-38. Citterio, M., F. Paul, A.P. Ahlstrom, H.F. Jepsen and A. Weidick 2009. Remote sensing of glacier change in West Greenland: accounting for the occurrence of surge-type glaciers. Annals of Glaciology, 50(53): 70-80. Clarke, G.K.C. 1976. Thermal regulation of glacier surging. Journal of Glaciology, 16(74): 231-250. Clarke, G.K.C. 1987. Fast glacier flow: ice streams, surging, and tidewater glaciers. Journal of Geophysical Research, 92(B9): 8835-8841. Clarke, G.K.C. 1991. Length, width and slope influences on glacier surging. Journal of Glaciology, 37(126): 236-246. Clarke, G.K.C., S.G. Collins and D.E. Thompson 1984. Flow, thermal structure, and subglacial conditions of a surge-type glacier. Canadian Journal of Earth Sciences, 21(2): 232-240. Clarke, G.K.C., J.P. Schmok, C.S.L. Ommanney and S.G. Collins 1986. Characteristics of surge-type glaciers. Journal Of Geophysical Research, 91(B7): 7165-7180. Cohen, D. 2000. Rheology of ice at the bed of Engabreen, Norway. Journal of Glaciology, 44: 315-325. Copland, L., S. Pope, M.P. Bishop, J.F. Shroder, P. Clendon, A. Bush, U. Kamp, Y.B. Seong and L.A. Owen 2009. Glacier velocities across the central Karakoram. Annals of Glaciology, 50(52): 41-49. Copland, L., M.J. Sharp and J.A. Dowdeswell 2003. The distribution and flow characteristics of surge-type glaciers in the Canadian High Arctic. Annals of Glaciology, 36(1): 73-81. Copland, L., T. Sylvestre, M.P. Bishop, J.F. Shroder, Y.B. Seong, L.A. Owen, A. Bush and U. Kamp 2011. Expanded and Recently Increased Glacier Surging in the Karakoram. Arctic, Antarctic, and Alpine Research, 43(4): 503-516. Croot, D.G. 1988a. Morphological, structural and mechanical analysis of neoglacial ice-pushed ridges in Iceland. In Croot, D.G., ed. Glaciotectonics: forms and processes, Rotterdam, Balkema, 33-47. Croot, D.G. 1988b. Glaciotectonics and surging glaciers, a correlation based on Vestspitsbergen, Svalbard, Norway. In Croot, D.G., ed. Glaciotectonics: forms and processes, Rotterdam, Balkema, 49-61. Cubasch, U., D. Wuebbles, D. Chen, M.C. Facchini, D. Frame, N. Moahowald and J.-G. Winther 2013. Observations: Atmosphere and Surface. In Stocker, T.F., D. Qin, G.-K. Plattner, M. Tignor, S.K. Allen, J. Boschung, A. Nauels, Y. Xia, V. Bex and P.M. Midgley, eds. Climate Change 2013: The Physical Science Basis. Contribution of Working Group I to the Fifth Assessment Report of the Intergovernmental Panel on Climate Change, Cambridge, United Kingdom and New York, NY, USA, Cambride University Press, 159-254.

55
Das, S., I. Joughin, M.D. Behn, I.M. Howat, M.A. King, D. Lizarralde and M.P. Bhatia 2008. Fracture propagation to the base of the Greenland ice sheet during supraglacial lake drainage. Science, 320: 778-781.De Geer, G. 1910. Guide de l'excursion au Spitzberg, Stockholm. XIe Congres GeologiqueInternationale, 23. Dee, D.P., S.M. Uppala, A.J. Simmons, P. Berrisford, P. Poli, S. Kobayashi, U. Andrae, M.A. Balmaseda,G. Balsamo, P. Bauer, P. Bechtold, A.C.M. Beljaars, L. Van de Berg, J. Bidlot, N. Bormann, C. Delsol, R.Dragani, M. Fuentes, A.J. Geer, L. Haimberger, S.B. Healy, H. Hersbach, E.V. Hólm, L. Isaksen, P.Kållberg, M. Köhler, M. Matricardi, A.P. McNally, B.M. Monge-Sanz, J.-J. Morcrette, B.-K. Park, C.Peubey, P.d. Rosnay, C. Tavolato, J.-N. Thépaut and F. Vitart 2011. The ERA-Interim reanalysis:configuration and performance of the data assimilation system. Quaternly Journal of the RoyalMeterological Society, 137: 553-597. Deichmann, N., J. Ansorge and H. Röthlisberger 1979. Observations of glacier seismicity onUnteraargletscher. Journal of Glaciology, 23(89): 409.Dickson, R.R., T.J. Osborn, J.W. Hurrell, J. Meincke, J. Blindheim, B. Adlandsvik, T. Vinje, G. Alekseevand W. Maslowski 2000. The Arctic Ocean Response to the North Atlantic Oscillation. Journal ofClimate, 13: 2671-2696.Dolgoushin, L.D. and G.B. Osipova 1975. Glacier surges and the problem of their forecasting. Snow and Ice-Symposium, Moscow, IAHS-AISH, 292-304.Dolgoushin, L.D. and G.B. Osipova 1978. Balance of a surging glacier as the basis for forecasting itsperiodic advances. Mater. Glyatsiologicheskik Isslef. Khronica Obsuzhdeniya, 32: 260-265.Dowdeswell, J.A. 1989. On the nature of Svalbard icebergs. Journal of Glaciology: 224-234.Dowdeswell, J.A. and T.J. Benham 2003. A surge of Perseibreen, Svalbard, examined using aerialphotography and ASTER high resolution satellite imagery. Polar Research, 22(2): 373-383.Dowdeswell, J.A., D.J. Drewry, O. Liestøl and O. Orheim 1984. Air-borne radio echo sounding of subpolar glaciers in Spitsbergen. Norsk Polarinstitutt. Srifter, 182: 41.Dowdeswell, J.A., G.S. Hamilton and J.O. Hagen 1991. The duration of the active phase on surge-typeglaciers: contrasts between Svalbard and other regions. Journal of Glaciology: 388-400.Dowdeswell, J.A., R. Hodgkins, A.-M. Nuttall, J.O. Hagen and G.S. Hamilton 1995. Mass balancechange as a control on the frequency and occurrence of glacier surges in Svalbard, Norwegian HighArctic. Geophysical Research Letters, 22(21): 2909-2912. Dowdeswell, J.A., B. Unwin, A.M. Nuttalla and D. Wingham, J. 1999. Velocity structure, flowinstability and mass flux on a large Arctic ice cap from satellite radar interferometry. Earth andPlanetary Science Letters, 167(3-4): 131-140. Dowdeswell, J.A. and M. Williams 1997. Surge-type glaciers in the Russian High Arctic identified fromdigital satellite imagery. Journal of Glaciology, 43(145): 489-494. Drewry, D.J., O. Liestøl, C.S. Neal, O. Orheim and B. Wold 1980. Airborne radio-echo sounding ofglaciers in Svalbard. Polar Record, 20: 261-275. Eisen, O., W.D. Harrison and C.F. Raymond 2001. The surges of Variegated Glacier, Alaska, U.S.A., and their connection to climate and mass balance. Journal of Glaciology, 47(158): 351-358. Ekström, G., M. Nettles and G.A. Abers 2003. Glacial Earthquakes. Science, 302(5645): 622-624. Engelhardt, H., N. Humphrey, B. Kamb and M. Fahnestock 1990. Physical conditions at the base of afast-moving Antarctic ice stream. Science, 248: 57-59.Espizúa, L.E. 1986. Fluctuations of the Rio del Plomo glaciers. Geografiska Annaler, 68(A)(4): 317-327. Etzelmüller, B., R.S. Ødegard, G. Vatne, R.S. Mysterud, T. Tonning and J.L. Sollid 2000. Glaciercharacteristics and sediment transfer system of Longyearbreen and Larsbreen, western Spitsbergen.Norsk Geografisk Tidsskrift - Norwegian Journal of Geography, 54: 157-168.Evans, D.J.A. and B.R. Rea 2003. Surging glacier landsystem. In Evans, D.J.A., ed. Glacial landsystems, Routledge, 544. Fallourd, R., O. Harant, E. Trouve, J.-M. Nicolas, A. Walpersdorf, J.-L. Mugnier, J. Serafini, D. Rosu, L.Bombrun, G. Vasile, N. Cotte, F. Vernier, F. Tupin, L. Moreau and P. Bolon 2011. MonitoringTemperate Glacier Displacement by Multi-Temporal TerraSAR-X Images and Continuous GPS
8. REFERENCES
Measurements. IEEE Journal of Selected Topics in Applied Earth Observations and Remote Sensing 4(2): 372-386. Fatland, D.R. and C.S. Lingle 2002. InSAR observations of the 1993-95 Bering Glacier (Alaska, USA) surge and a surge hypothesis. Journal of Glaciology, 48(162): 439-451. Fischer, A., H. Rott and H. Bjornsson 2003. Observation of recent surges of Vatnajökull, Iceland, by means of ERS SAR interferometry. Annals of Glaciology, 37(1): 69-76. Flink, A.E. 2013. Dynamics of surging tidewater glaciers in Tempelfjorden Spitsbergen. (Master thesis Stockholm University.) Flink, A.E., R. Noormets, N. Kirchner, D.I. Benn, A. Luckman and H. Lovell 2015. The evolution of a submarine landform record following recent and multiple surges of Tunabreen glacier, Svalbard. Quaternary Science Reviews, 108: 37-50. Floricioiu, D., M. Eineder, H. Rott, N. Yague-Martinez and T. Nagler 2009. Surface velocity and variations of outlet glaciers of the Patagonia Icefields by means of TerraSAR-X. Geoscience and Remote Sensing Symposium, 2009 IEEE International, IGARSS, Cape Town, IEEE. Fountain, A., R.W. Jacobel, R. Schlichting and P. Jansson 2005. Fractures as the main pathways of water flow in temperate glaciers. Nature, 433(7026): 618-621. Fountain, A.G. and J. Walder 1998. Water flow through temperate glaciers. Reviews of Geophysics, 36: 299-328. Fowler, A.C. 1987. A theory of glacier surges. Journal of Geophysical Research, 92(B9): 9111-9120. Fowler, A.C., T. Murray and F.S.L. Ng 2001. Thermally controlled glacier surging. Journal of Glaciology, 47(159): 527-538. Frappe-Seneclauze, T.P. and G.K.C. Clarke 2007. Slow surge of Trapridge glacier, Yukon Territory, Canada. Journal of Geophysical Research, 112(F3). Førland, E.J., I. Hanssen-Bauer and P.Ø. Nordli 1997. Climate statistics and longterm series of temperature and precipitation at Svalbard and Jan Mayen. Glasser, N.F. and M.J. Hambrey 2001. Styles of sedimentation beneath Svalbard valley glaciers under changing dynamic and thermal regimes. Journal of the Geological Society, 158: 697-707. Glazyrin, G.Y., G.M. Kamnyanskiy, A.B. Mazo, V.K. Nozdryukhin and A.N. Salamatin 1987. Mekhanizm podvizhki lednika Abramova v 1972-1975 (Mechanism of the Abramova Glacier surge in 1972-1975). Mater. Glyatsiol. Issled. Khron. Obsuzhdeniya., 60: 84-90. Glen, J.W. 1955. The creep of polycrystalline ice. Grant, K.L., C.R. Stokes and I.S. Evans 2009. Identification and characteristics of surge-type glaciers on Novaya Zemlya, Russian Arctic. Journal of Glaciology, 55(194): 960-972. Grześ, M., M. Król and I. Sobota 2008. Glacier geometry change in the Forlandsundet area (NW Spitsbergen) using remote sensing data. In Tijm-Reijmer, C.H., ed. The Dynamics and Mass Budget of Arctic Glaciers. Extended Abstracts, Obergurgl (Austria). IASC Working group on Arctic Glaciology, 50-52. Gulley, J. and D.I. Benn 2007. Structural control of englacial drainage systems in Himalayan debris-covered glaciers. Journal of Glaciology, 53: 399-412. Gulley, J., D.I. Benn, A. Luckman and D. Müller 2009. A cut-and-closure origin for englacial conduits on uncrevassed parts of polythermal glaciers. Journal of Glaciology, 55(89): 66-80. Hagen, J.O., O. Liestøl, E. Roland and T. Jorgensen 1993. Glacier atlas of Svalbard and Jan Mayen. Norsk Polarinstitutt. Meddelelser, 129. Hagen, J.O., K. Melvold, F. Pinglot and J.A. Dowdeswell 2003. On the net mass balance of the glaciers and ice caps in Svalbard, Norwegian Arctic. Arctic, Antarctic and Alpine Research, 35(2): 264-270. Hagen, J.O. and A. Sætrang 1991. Radio-echo soundings of sub-polar glaciers with low-frequency radar. Polar Research, 9(1): 99-107. Hambrey, M.J., T. Murray, N.F. Glasser, A. Hubbard, B. Hubbard, G. Stuart, S. Hansen and J. Kohler 2005. Structure and changing dynamics of a polythermal valley glacier on a centennial timescale: Midre Lovénbreen, Svalbard. Journal of Geophysical Research, 110(F01006).

57
Hamilton, G.S. 1992. Investigations of surge-type glaciers in Svalbard. (PhD thesis University of Cambridge.)Hamilton, G.S. and J.A. Dowdeswell 1996. Controls on glacier surging in Svalbard. Journal of Glaciology, 42(140): 157-168. Hanley, J.A. and B.J. McNeil 1982. The meaning and use of the Area under a Receiver Operating Characteristic (ROC) curve. Radiology, 143(1): 29-36. Harrison, W.D. 1972. Reconnaissance of Variegated glacier: thermal regime and surge behaviour. Journal of Glaciology, 11(63): 455-456. Harrison, W.D. and A.S. Post 2003. How much do we really know about glacier surging? Annals of Glaciology, 36: 1-6. Hayes, K. 2001. Controls on the incidence of glacier surging. (Unpublished Ph.D. disseration University of Leeds.) Hewitt, K. 1969. Glacier surges in the Karakoram Himalaya (Central Asia). Canadian Journal of Earth Sciences, 6(4): 1009-1018. Hewitt, K. 1998. Recent glacier surges in the Karakoram Himalaya, south central Asia. EOS Electronic Supplement. Hewitt, K. 2005. The Karakoram anomaly? Glacier expansion and the 'elevation effect', Karakoram Himalaya. Mountain Research & Development: 332-340. Hjelle, A. 1993. Geology of Svalbard. Oslo. Hodgkins, R. and J.A. Dowdeswell 1994. Tectonic processes in Svalbard tide-water glacier surges: evidence from structural glaciology. Journal of Glaciology, 40(136): 553-560. Hoinkes, H.C. 1969. Surges of the Vernagtferner in the Otztal Alps since 1599. Canadian Journal of Earth Sciences, 6(4): 853-861. Hooke, R.L.B. 1981. Flow law for polycrystalline ice is glaciers: comparison of theoretical predictions, laboratory data, and field measurements. Reviews of Geophysics, 19(664-672). Humlum, O., B. Elberling, A. Hormes, K. Fjordheim, O.H. Hansen and J. Heinemeier 2005. Late-Holocene glacier growth in Svalbard documented by subglacial relict vegetation and living soil microbes. The Holocene, 15(3): 396-407. Humlum, O., A. Instanes and J.L. Sollid 2003. Permafrost in Svalbard: a review of research history, climatic background and engineering challenges. Polar Research, 22(2): 191-215. Iken, A. and R.A. Bindschadler 1986. Combined measurements of subglacial water pressure and surface velocity at Findelengletscher, Switzerland: conclusions about drainage system and sliding mechanism. Journal of Glaciology, 32: 101-119. IPCC 2013. Climate change 2013: The Physical Science Basis. Contribution of Working Group I to the Fifth Assessment Report of the Intergovernmental Panel on Climate Change. James, A.M., C. Burdett, M.J. Mccool, A. Fox and P. Riggs 2015. The geographic distribution and ecological preferences of the American dog tick, Dermacentor variabilis (Say), in the U.S.A. Medical and Veterinary Entomology, 29(2): 178-188. Jiskoot, H. 1999. Characteristics of surge-type glaciers (Unpublished PhD Thesis). University of Leeds.) Jiskoot, H., P. Boyle and T. Murray 1998. The incidence of glacier surging in Svalbard: evidence from multivariate statistics. Computers & Geosciences, 24(4): 389-399. Jiskoot, H., A. Luckman and T. Murray 2002. Controls on surging in East Greenland derived from a new glacier inventory. NSIDC Report GD-30: 62-63. Jiskoot, H., T. Murray and P. Boyle 2000. Controls on the distribution of surge-type glaciers in Svalbard. Journal of Glaciology, 46(154): 412-422. Jiskoot, H., T. Murray and A. Luckman 2003. Surge potential and drainage-basin characteristics in East Greenland. Annals of Glaciology, 36(1): 142-148. Joughin, I., S. Tulaczyk, M. Fahnestock and R. Kwok 1996. A mini-surge on the Ryder Glacier, Greenland observed via satellite radar interferometry. Science, 274: 1525-1530. Kamb, B. 1970. Sliding motion of glaciers: theory and observation. Reviews of Geophysics and Space Physics, 8: 673-728.
8. REFERENCES
Kamb, B. 1987. Glacier surge mechanism based on linked cavity configuration of the basal water conduit system. Journal of Geophysical Research, 92: 9083-9100. Kamb, B. 1991. Rheological nonlinearity and flow instability in the deforming bed mechanism of Ice Stream motion. Journal of Geophysical Research, 96: 585-595. Kamb, B. and H. Engelhardt 1987. Waves of accelerated motion in a glacier approaching surge: the mini-surges of Variegated glacier, Alaska, U.S.A. Journal of Glaciology, 33(113): 27-46. Kamb, B. and E.R. Lachapelle 1964. Direct observation of the mechanism of glacier sliding over bedrock. Journal of Glaciology, 5: 159-172. Kamb, B., C.F. Raymond, W.D. Harrison, H. Engelhardt, K.A. Echelmeyer, N. Humphrey, M.M. Brugman and T. Pfeffer 1985. Glacier surge mechanism: 1982-1983 surge of the Variegated Glacier, Alaska. Science, 227(4686): 469-479. Kienholz, C., J.L. Rich, A.A. Arendt and R. Hock 2014. A new method for deriving glacier centerlines applied to glaciers in Alaska and northwest Canada. The Cryosphere, 8: 503-519. King, E.C., A.M. Smith, T. Murray and G.W. Stuart 2008. Glacier-bed characteristics of midtre Lovénbreen, Svalbard, from high-resolution seismic and radar surveying. Journal of Glaciology, 54(184): 145-156. Knudsen, O. 1995. Concertina eskers, Brúarjökull, Iceland: an indicator of surge-type glacier behaviour. Quaternary Science REviews, 14: 487-493. Kotlyakov, V.M. 1996. Variations of Snow and Ice in the past and at present on a Global and Regional Scale. UNESCO. Kotlyakov, V.M. and Y.Y. Macheret 1987. Radio echo-soundings of sub-polar glaciers in Svalbard: some problems and results of Soviet studies. Annals of Glaciology, 9: 151-159. Kotlyakov, V.M., G.B. Osipova, D.G. Tsvetkov and J. Jacka 2008. Monitoring surging glaciers of the Pamirs, Central Asia, from space. Annals of Glaciology, 48: 125-134. Kotlyakov, V.M., O.V. Rototaeva and G.A. Nosenko 2004. The September 2002 Kolka Glacier Catastrophe in North Ossetia, Russian Federation: evidence and analysis. Mountain Research & Development, 24(1): 78-83. Köhler, A., A. Chapuis, C. Nuth, J. Kohler and C. Weidle 2012. Autonomous detection of calving-related seismicity at Kronebreen, Svalbard. The Cryosphere, 6: 393-406. Köhler, A., C. Nuth, J. Schweitzer, C. Weidle and S.J. Gibbons 2015. Dynamic glacier activity revealed through passive regional seismic monitoring on Spitsbergen, Svalbard. Polar Research, in press. König, M., C. Nuth, J. Kohler, G. Moholdt and R. Pettersen 2013. A digital glacier database for Svalbard. Ch. 10. Global Land Ice Measurements from Space, Praxis-Springer. Lamb, H.H. 1977. Climate: present, past and future. Vol 2. London, Methuen. Lankauf, K.R. 1999. Retreat of the Aavatsmark glacier (Kaffiöyra Region, Oscar II Land, Spitsbergen) in XX Century. In Studies, P.P., ed. XXVI Polar Symposium, Lublin, 133-152. Leclercq, P.W., J. Oerlemans and J.G. Cogley 2011. Estimating the glacier contribution to sea-level rise for the period 1800-2005. Survey in Geophysics, 32: 519-535. Lefauconnier, B. 1987. Fluctuations glaciaires dans le Kongsfjord, 79°N, Spitsbergen, Svalbard; analyse et consequences. (PhD Universite de Grenoble.) Lefauconnier, B. and J.O. Hagen 1991. Surging and calving glaciers in eastern Svalbard. Norsk Polarinstitutt. Meddelelser: 1-130. Lefauconnier, B., J.O. Hagen and J.P. Rudant 1994. Flow speed and calving rate of Kongsbreen glacier, Svalbard, using SPOT images. Polar Research: 59-65. Liestøl, O. 1969. Glacier surges in West Spitsbergen. Canadian Journal of Earth Sciences, 6(4): 895-897. Liestøl, O. 1973. Glaciological work in 1971. Norsk Polarinstitutt Årbok: 895-897. Liestøl, O. 1977. Pingos, springs, and permafrost in Spitsbergen. Norsk Polarinstitutt Årbok: 7-29. Liestøl, O. 1988. The glaciers in the Kongsfjorden area, Spitsbergen. Norsk Geografisk Tidsskrift - Norwegian Journal of Geography, 42(4): 231-238.

59
Lingle, C.S. and D.R. Fatland 2003. Does englacial water storage drive temperate glacier surges? Annals of Glaciology, 36(1): 14-20. Lliboutry, L. 1968. General theory of subglacial cavitation and sliding of temperate glaciers. Journal of Glaciology, 7: 21-58. Lliboutry, L. 1976. Physical processes in temperate glaciers. Journal of Glaciology, 16(74): 151-158. Lliboutry, L. 1987. Realistic, yet simple bottom boundary condition for glaciers and ice sheets. Journal of Geophysical Research, 92: 9101-9109. Lliboutry, L. 1993. Internal melting and ice accretion at the bottom of temperate glaciers. Journal of Glaciology, 39: 50-64. Lovell, H., E.J. Fleming, D. Benn, B. Hubbard, S. Lukas and K. Naegeli 2015. Former dynamic behaviour of a cold-based valley glacier on Svalbard revealed by basal ice and structural glaciology investigations. Journal of Glaciology, in press. Luckman, A., T. Murray, R. de Lange and E. Hanna 2006. Rapid and synchronous ice-dynamic changes in East Greenland. Geophysical Research Letters, 33(3). Luckman, A., T. Murray and T. Strozzi 2002. Surface flow evolution throughout a glacier surge measured by satellite radar interferometry. Geophysical Research Letters, 29(23). Macheret, Y.Y. and A.B. Zhuravlev 1982. Radio echo-soundings of Svalbard glaciers. Journal of Glaciology, 28(99): 295-314. Macheret, Y.Y., A.B. Zhuravlev and L.I. Bobrova 1985. Thickness, subglacial relief and volume of Svalbard glaciers based on radio echo-sounding data. Polar Geography and Geology, 9(3). Machguth, H. and M. Huss 2014. The length of the world's glaciers - a new approach for the global calculation of center lines. The Cryosphere, 8(1741-1755). Mansell, D., A. Luckman and T. Murray 2012. Dynamics of tidewater surge-type glaciers in northwest Svalbard. Journal of Glaciology, 58(207): 110-118. Meier, M.F. and A. Post 1969. What are glacier surges? Canadian Journal of Earth Sciences, 6(4): 807-817. Melvold, K. and J.O. Hagen 1998. Evolution of a surge-type glacier in its quiescent phase: Kongsvegen, Spitsbergen, 1964–95. Journal of Glaciology, 44(147): 394-404. Merow, C., M.J. Smith and J.A. Silander 2013. A practical guide to MaxEnt for modeling species' distributions: what it does, and why inputs and settings matter. Ecography, 36: 1058-1069. Mikesell, T.D., K. van Wijk, M.M. Haney, J.H. Bradford, H.P. Marshall and J.T. Harper 2012. Monitoring glacier surface seismicity in time and space using Rayleigh waves. Journal of Geophysical Research, 117(F2). Murray, T., T.D. James, Y.Y. Macheret, I. Lavrentiev, A. Glazovsky and H. Sykes 2012. Geometric changes in a tidewater glacier in Svalbard during its surge cycle. Arctic, Antarctic & Alpine Research, 44(3): 359-367. Murray, T., A. Luckman, T. Strozzi and A.-M. Nuttall 2003a. The initiation of glacier surging at Fridtjovbreen, Svalbard. Annals of Glaciology, 36(1): 110-116. Murray, T., T. Strozzi, A. Luckman, H. Jiskoot and P. Christakos 2003b. Is there a single surge mechanism? Contrasts in dynamics between glacier surges in Svalbard and other regions. Journal of Geophysical Research, 108(B5). Murray, T., G.W. Stuart, P.J. Miller, J. Woodward, A.M. Smith, P.R. Porter and H. Jiskoot 2000. Glacier surge propagation by thermal evolution at the bed. Journal of Geophysical Research, 105(B6): 13491-13507. Navarro, F.J. and O. Eisen 2009. Ground-penetrating radar. In Pilleka, P. and W.G. Rees, eds. Remote sensing of glaciers, Longon, Taylor & Francis. Nielsen, N. 1937. A volcano under an ice-cap: Vatnajokull, Iceland, 1934-1936. Geographical Journal, 90(1): 6-23. Niewiarowski, W. 1982. Morphology of the forefield of the Aavatsmark Glacier (Oscar II Land, NW Spitsbergen) and phases of its formation. Acta Univ. N. Copernici, Geografia XVI, Toruń: 147-158.

8. REFERENCES
Nordli, Ø., R. Przybylak, A.E.J. Ogilvie and K. Isaksen 2014. Long-term temperature trends and variability on Spitsbergen: the extended Svalbard Airport temperature series, 1989-2012. Polar Research, 33(21349). NORSAR 2014. BARENTS3D 2006. A (hybrid) 3D crust and upper mantle model for the greater Barents Sea region. (02/10/14). Nuth, C., J. Kohler, H.F. Aas, O. Brandt and J.O. Hagen 2007. Glacier geometry and elevation changes on Svalbard (1936–90): a baseline dataset. Annals of Glaciology, 46(1): 106-116. Nuth, C., J. Kohler, M. König, A. von Deschwanden, A. Kääb, G. Moholdt and R. Pettersson 2013. Decadal changes from a multi-temporal glacier inventory of Svalbard. The Cryosphere, 7: 1603-1621. Nuth, C. and A. Kääb 2011. Co-registration and bias corrections of satellite elevation data sets for quantifying glacier thickness change. The Cryosphere, 5: 271-2011. Nuth, C., G. Moholdt, J.O. Hagen and A. Kääb 2010. Svalbard glacier elevation changes and contribution to sea level rise. Journal of Geophysical Research, 115(F01008). Nye, J.F. 1957. The distribution of stress and velocity in glaciers and ice sheets. Proceedings of the Royal Society, A(239): 113-133. Nye, J.F. 1969. A calculation on the sliding of ice over a wavy surface using a newtonian viscous approximation. Proceedings of the royal Society of London, 311(1506): 445-467. Nye, J.F. 1970. Glacier sliding without cavitation in a linear viscous approximation. Proceedings of the Royal Society of London, A(315): 1522. O'Neel, S. and W.T. Pfeffer 2007. Source mechanics for monochromatic icequakes produced during iceberg calving at Columbia Glacier, AK. Geophysical Research Letters, 34(22). Osipova, G.B., A.S. Tchetinnikov and M.S. Rudak 1998. Catalogue of surging glaciers of Pamir. Mater Glaciol Investig, 85: 3-136. Paterson, W.S.B. 1994. The physics of glaciers. Oxford, New York and Tokyo. Pettersson, R. 2004. Dynamics of the cold surface layer of polythermal Storglaciären, Sweden. (PhD Stockholm University.) Pettersson, R. 2005. Frequency dependence of scattering from the cold-temperate transition surface in a polythermal glacier. Radio Science, 40(3). Pfeffer, T., A.A. Arendt, A. Bliss, T. Bolch, J.G. Cogley, A.S. Gardner, J.O. Hagen, R. Hock, G. Kaser, C. Kienholz, E.S. Miles, G. Moholdt, N. Mölg, F. Paul, V. Radic, P. Rastner, B.H. Raup, J. Rich and M. Sharp 2014. The Randolph Glacier Inventory, a globally complete inventory of glaciers. Journal of Glaciology, 60(221): 537-552. Phillips, S.J., R.P. Anderson and R.E. Schapire 2006. Maximum entropy modeling of species geographic distributions. Ecological Modelling, 190: 231-259. Phillips, S.J. and M. Dudík 2008. Modeling of species distributions with Maxent: new extensions and a comprehensive evaluation. Ecography, 31: 161-175. Post, A. 1969. Distribution of surging glaciers in Western North America. Journal of Glaciology, 8(53): 229-240. Post, A. and E.R. LaChapelle 1971. Glacier Ice. Seattle. Pritchard, H., T. Murray, A. Luckman, T. Strozzi and S. Barr 2005. Glacier dynamics of Sortebrae, East Greenland, from synthetic aperture radar feature tracking. Journal of Geophysical Research, 110(F03005). Pritchard, H., T. Murray, T. Strozzi, S. Barr and A. Luckman 2003. Surge-related topographic change of the glacier Sortebrae, East Greenland, derived from synthetic aperture radar interferometry. Journal of Glaciology, 49(166): 381-390. Quincey, D.j., N.F. Glasser, S.J. Cook and A. Luckman 2015. Heterogeneity in Karakoram glacier surges. Journal of Geophysical Research, 120. Radosavljevic, A. and R.P. Anderson 2014. Making better Maxent models of species distributions: complexity, overfitting and evaluation. Journal of Biogeography, 41: 629-643. Raymond, C.F. 1987. How do glaciers surge? A review. Journal of Geophysical Research, 92(B9): 9121-9134.
61
Richards, M.A. 1988. Seismic evidence for a weak basal layer during the 1982 surge of Variegated glacier, Alaska, U.S.A. Journal of Glaciology, 34(116): 111-120. Rippin, D., I. Willis and A. Neil 2005. Seasonal patterns of velocity and strain across the tongue of the polythermal glacier midre Lovénbreen, Svalbard. Annals of Glaciology, 42(1): 445-453. Robin, G.d.Q. 1955. Ice movement and temperature distribution in glaciers and ice sheets. Journal of Glaciology, 2(18): 523-532. Rolstad, C., J. Amlien, J.O. Hagen and B. Lundén 1997. Visible and near-infrared digital images for determination of ice velocities and surface elevation during a surge on Osbornebreen, a tidewater glacier in Svalbard. Annals of Glaciology, 24: 255-261. Röthlisberger, H. 1969. Evidence for an ancient glacier surge in the Swiss Alps. Canadian Journal of Earth Sciences, 6(4): 863-865. Röthlisberger, H. and H. Lang 1987. Glacial hydrology. In Gurnell, A.M. and M.J. Clark, eds. Glacio-fluvial Sediment Transfer, New York, Wiley, 207-284. Saloranta, T.M. and H. Svendsen 2001. Across the Arctic front west of Spitsbergen: high resolution CTD sections from 1998-2000. Polar Research, 20(2): 177-184. Sand, K., J.-G. Winther, D. Maréchal, O. Bruland and K. Melvold 2003. Regional variations of snow accumulation on Spitsbergen, Svalbard, 1997-99. Nordic Hydrology, 34(1-2): 17-32. Schytt, V. 1969. Some comments on glacier surges in eastern Svalbard. Canadian Journal of Earth Sciences, 6(4): 867-873. Sharp, M. 1985a. 'Crevasse-fill' ridges - a landform type characteristic of surging glaciers ? Geografiska Annaler, 67A(213-220). Sharp, M. 1985b. Sedimentation and stratigraphy at Eyjabakkajökull - an Icelandic surging glacier. Quaternary Research, 24(268-284). Sharp, M. 1988. Surging glaciers: behaviour and mechanisms. Progress in Physical Geography, 12: 349-370. Stevens, L.A., M.D. Behn, J.J. Mcguire, S.B. Das, T. Herring, D.E. Shean and M.A. King 2015. Greenland supraglacial lake drainages triggered by hydrologically induced basal slip. Nature, 552: 73-76. Striberger, J., S. Jbörck, I.Ö. Benediktsson, I. Snowball, C.B. Uvo, O. Ingólfsson and K.H. Kjær 2011. Climatic control on the surge periodicity of an Icelandic outlet glacier. Journal of Quaternary Science, 26(6): 561-565. Strozzi, T., A. Luckman, T. Murray, U. Wegmuller and C.L. Werner 2002. Glacier motion estimation using SAR offset-tracking procedures. IEEE Transactions on Geoscience and Remote Sensing, 40(11): 2384-2391. Stuart, G., T. Murray, A. Brisbourne, P. Styles and S. Toon 2005. Seismic emissions from a surging glacier: Bakaninbreen, Svalbard. Annals of Glaciology, 42: 151-157. Sund, M., T.R. Lauknes and T. Eiken 2014. Surge dynamics in the Nathorstbreen glacier system, Svalbard. The Cryosphere, 8: 623-638. Svendsen, H., A. Beszczynska-Møller, J.O. Hagen, B. Lefauconnier, V. Tverberg, S. Gerland, J.B. Ørbøk, K. Bischof, C. Papucci, M. Zajaczkowski, R. Azzolini, O. Bruland, C. Wiencke, J.-G. Winther and W. Dallmann 2002. The physical environment of Kongsfjorden-Krossfjorden, an Arctic fjord system in Svalbard. Polar Research, 21(1): 133-166. Tarr, R.S. and L. Martin 1914. Alaskan glacier studies. Washington, D. C. Thorarinsson, S. 1964. Sudden advance of Vatnajokull outlet glaciers 1930-1964. Jokull, 14: 76-89. Thorarinsson, S. 1969. Glacier surges in Iceland, with special reference to the surges of Brúarjökull. Canadian Journal of Earth Sciences, 6(4): 875-882. Truffer, M. and W.D. Harrison 2006. In-situ measurements of till deformation and water pressure. Journal of Glaciology, 52(117): 175-182. Tsukernik, M., D.N. Kindig and M.C. Serreze 2007. Characteristics of winter cyclone activity in the northern North Atlantic: Insights from observations and regional modeling. Journal of Geophysical Research, 112.
8. REFERENCES
van de Wal, R.S.W., W. Boot, M.R. van den Broeke, C.J.P.P. Smeets, C.H. Reijmer, J.J.A. Donker and J. Oerlemans 2008. Large and rapid melt-induced velocity changes in the ablation zone of the Greenland ice sheet. Science, 321: 111-113. Vinogradov, Y.A., V.E. Asming, S.V. Baranov, A.V. Fedorov and A.N. Vinogradov 2015. Seismic and infrasonic monitoring of glacier destruction: a pilot experiment on Svalbard. Seismic Isntruments, 51(1): 1-7. Voigt, U. 1965. Die Bewegung der Gletscherzunge des Kongsvegen (Kingsbay, Westspitsbergen). Petermanns Geogr. Mitt., 109(1): 1-8. Walter, F.-., S. O'Neel, D. McNamara, W.T. Pfeffer, B. J.N. and H.A. Fricker 2010. Iceberg calving during transition from grounded to floating ice: Columbia Glacier, Alaska. Geophysical Research Letters, 37(15). Weaver, C.S. and S.D. Malone 1979. Seismic evidence for discrete glacier motion at the rock-ice interface. Journal of Glaciology, 23(89): 171-184. Weertman, J. 1957. On the sliding of glaciers. Journal of Glaciology, 3(21): 33-38. Weertman, J. 1964. The theory of glacier sliding. Journal of Glaciology, 5(287-303). Weidick, A. 1988. Surging glaciers in Greenland - a status. Groenlands Geologiske Undersoegelse. Rapport, 140(106-110). Wellman, P. 1982. Surging of Fisher Glacier, Eastern Antarctica: evidence from geomorphology. Journal of Glaciology, 28(98): 23-28. Wilbur, S.C. 1988. Surging vs nonsurging glaciers: a comparison using morphometry and balance. (M.Sc. University of alaska.) Winther, J.-G., O. Bruland, K. Sand, Å. Killingtveit and D. Maréchal 1998. Snow accumulation distribution on Spitsbergen, Svalbard, in 1997. Polar Research, 17(2): 155-164. Woodward, J., T. Murray and A. McCaig 2002. Formation and reorientation of structure in the surge-type glacier Kongsvegen, Svalbard. Journal of Quaternary Science, 17(3): 201-209. Wu, C.F.J. 1986. Jackknife, Bootstrap and other resampling methods in regression analysis. The Annals of Statistics, 14(4): 1261-1295. Yafeng, S., M. Desheng, Y. Tandong, Z. Quinzhu and L. Chaohai 2010. Glaciers of Asia, Glaciers of China. U.S. Geological Survey Professional Paper. Yde, J.C. and N.T. Knudsen 2007. 20th-century glacier fluctuations on Disko Island (Qeqertarsuaq), Greenland. Journal of Glaciology, 46(1): 209-214(6). Zhang, W.J. 1992. Identification of glaciers with surge characteristics on the Tibetan Plateau. Annals of Glaciology, 16: 168-172. Zwally, H.J., W. Abdakati, T. Herring, K. Larson, J. Saba and K. Steffen 2002. Surface melt-induced acceleration of Greenland Ice Sheet flow. Science, 297: 218-222.