Embed Size (px)
Citation preview
Surface-Water Hydrology of Coastal Basins of Northern CaliforniaBy S. E. RANTZ
GEOLOGICAL SURVEY WATER-SUPPLY PAPER 1758
Prepared in cooperation with the Cali fornia Department of Water Resources
UNITED STATES GOVERNMENT PRINTING OFFICE, WASHINGTON : 1964

UNITED STATES DEPARTMENT OF THE INTERIOR
STEWART L. UDALL, Secretary
GEOLOGICAL SURVEY
Thomas B. Nolan, Director
For sale by the Superintendent of Documents, U.S. Government Printing Office Washington, D.C. 20402

CONTENTS
Page
Abstract__ _____________________________________________________ 1Introduction._____________________________________________________ 3
Purpose and scope of the report.________________________________ 3Other investigations___________________________________________ 5Acknowledgments _____________________________________________ 5
Description of region_____________________________________________ 6Geology._____________________________________________________ 10Climate-____________________________________ 11Description of individual basins.________________________________ 12
Eel River basin._______________________________-_-_.-_ 12Elk River basin________________________-______ 12Jacoby Creek basin._______________________________________ 13Mad River basin._________________________________________ 13Little River basin.________________________________________ 13Redwood Creek basin._____________________________________ 14Klamath River basin and adjacent closed basins_____________ 14Smith River basin.._____________________.__.__ 20
Precipitation .___________________________________ 20Runoff. _.________________________________________________ 26
Mean annual volume_________________________________________ 26Average annual water loss and evaporation from water surfaces._ _ __ 32Flow duration and regimen of floW_____________________________ 34
Low flow magnitude, duration, and frequency______________________ 45Flood frequency._-_______________________--_.____-_______-_------- 53
Method of analysis.___________________________________________ 55Mean annual flood___________________________________________ 58Dimensionless flood-frequency curve.-_-_____-__-__-___-__------- 61Application of regional flood-frequency curves.____________________ 64
High flow magnitude, duration, and frequency _______________________ 65References cited___________________________________________________ 77
ILLUSTKATIONS
[Plates are in pocket]
Plate 1. Principal drainage systems and hydrologic units in coastal basins of northern California.
2. Isohyetal map of coastal basins of northern California showing mean annual precipitation for 60-year period, 1900-1959.
3. Precipitation stations in coastal basins of northern California.4. Stream-gaging stations in coastal basins of northern California.

IV CONTENTS
Plate 5. Location of stream-gaging stations and physiographic regions and subregions used in studies of flood frequency and of magnitude, duration, and frequency of high flows.
6. Relation of mean annual flood, drainage area, and mean annual basinwide precipitation in the Klamath Mountains.
Page Figure 1. Map showing location of report area-_-___---------_---__- 4
2. Streamflow diagram, upper Klamath River basin___________ 163. Diagram of main canals and gaging stations, Klamath Project- 174. Trends in precipitation and runoff-_______________________ 255. Average annual water loss and evaporation from water
surfaces -____-_______-___-_____--__---____--_________ 336. Flow-duration curves for selected gaging stations for period
1912-59_______________________-____-_ 357. Mean monthly distribution of runoff at selected gaging
stations_____________________________________________ 408. Relation between Qmean and do-------------------------- 439. Geographical distribution of the index of variability. _______ 44
10. Low-flow frequency curves for Eel River at Scotia, Calif.(sta. 4770)^-_-____-__._.-__-__-_-_--_---_--_____.___ 47
11. Low-flow frequency curves for Trinity River at Lewiston,Calif, (sta. 5255)______________________________ 48
12. Frequency-mass curve and storage-draft lines for Hayfork Creek near Hyampom, Calif, (sta. 5285) for 20-year recurrence interval_____________________-___-_________ 54
13. Flood-frequency curves for Sprague River near Chiloquin and for Williamson River below Sprague River, near Chiloquin, Oreg____________________________________ 59
14. Flood-frequency curve for Fall Creek at Copco, Calif _______ 6015. Relation of mean annual flood to drainage area in the northern
California Coast Ranges_____________________________ 6116. Dimension!ess flood-frequency curve for subregion l___-____ 6217. Dimensionless flood-frequency curve for subregion 2________ 6318. Dimensionless flood-frequency curve for subregion 3_ _______ 6419. High-flow frequency curves for Sprague River near Chiloquin,
Oreg_____-_____________________-----__-__----- 6620. High-flow frequency curves for Williamson River below
Sprague River, near Chiloquin, Oreg_______---_-____- 6721. High-flow frequency curves for Fall Creek at Copco, Calif___ 6722. Relation of Q2 .s3> for high flows of various durations, to
drainage area in northern California Coast Ranges____ 6923. Relation of K for high flows of various durations to mean
annual precipitation in the Klamath Mountains __-.____ 7124. High-flow frequency curves for Scott River near Fort Jones,
Calif___-_______.___________-_-____._-__________ ____ 7225. Dimensionless curves of high-flow frequency for subregion 1_ 7526. Dimensionless curves of high-flow frequency for subregion 2_ 75

CONTENTS V
TABLES
Page Table 1. Basinwide precipitation, runoff, and water loss for hydrologic
units in coastal basins of northern California._____---_---- 62. Mean monthly distribution of precipitation at selected stations. 213. Mean annual precipitation for period 1900-59, at stations in
coastal basins of northern California.___________-___------ 224. Bar chart records of stream-gaging stations in coastal basins
of northern California-_____-_-_---__-----_------------- 275. Average annual consumptive use of applied irrigation water,
1957__________________________________._____-____---_- 316. Flow-duration summary for selected stream-gaging stations
(adjusted to base period 1912-59)_-___-__--_-----__------ 367. Flow characteristics at selected stream-gaging stations for base
period 1912-59._________________________________ 428. Low-flow frequency table for selected stream-gaging stations.^ 499. Relation of low-flow frequency and flow-duration curves for
durations of 7 and 183 consecutive days__________________ 5310. Annual peak discharges of Klamath River near Klamath,
Calif, (sta. 5305)_.________________________ 5511. Mean annual floods and associated hydrologic factors at selected
stream-gaging stations._________________-________------_ 5712. High flows, with recurrence interval of 2.33 years, for various
durations at selected stream-gaging stations in California _ 7013. High flows, with recurrence interval of 10 years, for various
durations at selected stream-gaging stations in California. _ _ _ 7314. High flows, with recurrence interval of 50 years, for various
durations at selected stream-gaging stations in California.- _ _ _ 7415. Characteristics of frequency curves for high flows of various
durations in subregions 1 and 2________________________ 76


SURFACE-WATER HYDROLOGY OF COASTAL BASINS OF NORTHERN CALIFORNIA
BY S. E. RANTZ
ABSTRACT
This report presents an analysis of the surface-water hydrology of those coastal basins of California that are north of the south boundary of the Eel River basin. Its purpose is to provide hydrologic information in convenient form for use in project planning by the California Department of Water Resources and other water agencies operating in the state.
Precipitation in the report area is distinctly seasonal, very little occurring from June through September. The mountainous topography influences the areal distribution of precipitation, causing rainfall to be heaviest on the western, or windward, slope of the coastal ranges. The runoff pattern is influenced not only by the distribution of precipitation, but also by the geology and topography of the region. From a consideration of physiography, the region can be divided into three subregions, or sections, each of which is hydrologically homogeneous. They are the northern California Coast Ranges, the Klamath Mountains, and the Southern Cascade Mountains and associated lava plateau.
The basins south of the Klamath River lie wholly in the northern California Coast Ranges. The mountains are relatively low and there is therefore little snowmelt runoff. Because of the impermeability of the mantle rock, base flow is poorly sustained. Consequently, the bulk of the runoff in the subregion occurs during and shortly after the rains of late fall and winter.
The Smith River and the lower 200-mile reach of the Klamath River drain the Klamath Mountains. Because a large part of the Klamath River basin is above 5,000 feet in elevation, much of the winter precipitation is stored as snow, and a large amount of snowmelt runoff occurs in late spring in addition to the storm runoff in the winter. The mantle rock is more permeable here than in the northern California Coast Ranges, and base flow is therefore better sustained.
The upper Klamath River basin and adjacent closed basins are in the Southern Cascade Mountains. The highly permeable and fractured volcanic rock of this subregion allows ready infiltration of precipitation and snowmelt, and base flow is therefore better sustained in this subregion than in either of the other two. Because of the high elevation of the subregion, the volume of snowmelt runoff is significantly large.
The basins studied in the three subregions have a total drainage area of 21,000 square miles. The average annual natural runoff from this area for the 60-year period, 1900-1959, is estimated to be 30.3 million acre-feet, which is equivalent to 27 inches of runoff from the entire region. There is a wide range, however, in areal distribution of runoff; some of the closed basins adjacent to the upper Klamath River basin have an average annual runoff of about 2 inches, whereas & large part of the Smith River basin has an average annual runoff of 90 inches.
1

2 SURFACE-WATER HYDROLOGY, NORTHERN CALIFORNIA
The variability of runoff with time, reflecting the variability of precipitation from year to year, is also striking. Wet and dry periods lasting for several years are common, and during those periods average runoff departs widely from the long-term mean. Northern California experienced a prolonged wet period from 1890 to 1916 followed by a dry period from 1917 to 1937. In the 22 years since 1937, there have been two wet periods and one dry period. The driest single year of record was 1924, when runoff was generally about 20 percent of the 60- year (1900-1959) mean. Two of the wettest years of record were 1956 and 1958 when runoff was generally slightly more than twice the 60-year mean.
Study of the regimen of runoff in the region indicates that for any stream there is a close relationship between the flow-duration curve and the frequency curves for low flows of various durations. Both are influenced by basin charac teristics, and the relationship is helped by the consistency of the precipitation distribution wherein little runoff-producing precipitation occurs during the 6-month period, mid-April to mid-October. The recurrence intervals of low flows sustained for periods ranging from 1 day to 183 days may be derived from the flow-duration curve with considerable confidence.
The greatest floods known in Northwestern California are those of the winter of 1861-62. The peak discharge of Klamath River at Klamath, Calif., for the flood of December 1861 has been computed, but for other streams only qualitative information concerning this flood is available. From this information, however, it has been deduced that the flood peaks of December 1955 were of approximately the same order of magnitude as those that occurred 94 years earlier. A flood- frequency study of the region indicates that the magnitude of the mean annual flood for any stream is related to (1) the size of drainage area and (2) the mean annual basin-wide precipitation, there being a different relationship in each of the physiographic provinces. In making the flood study, dimensionless flood- frequency curves for the various gaging stations were constructed, using annual peak discharges expressed as ratios to the mean annual flood. Comparison of these frequency curves indicates that the slope of the curve is related primarily to mean annual precipitation, and to a lesser degree, to the elevation of the basin. Generally speaking, the more humid the area, the less variable is the precipitation, and therefore there is a lesser difference in severity between the storms that produce the minor floods and those that produce the major floods. Consequently the flatter flood-frequency curves are associated with the more humid basins. Elevation influences the degree to which melting snow augments the runoff from precipitation during the storms of long duration that cause major floods in the region.
The method used in the analysis of magnitude, duration, and frequency of high flows closely paralleled that followed in the flood-frequency study. The mean discharges for various durations ranging from 1 day to 365 days were arrayed for each stream, and the values of discharge corresponding to a recurrence interval of 2.33 years were determined. The discharge figures so obtained were then related to (1) the size of drainage area and (2) the mean annual basin-wide precipitation. As found in the flood-frequency study, the relationship differs in each of the physiographic provinces. The slopes of the frequency curves for the various durations are affected by the same climatologic and physiographic factors that influence the slope of the flood-frequency curve, but the effect of differences in these factors rapidly diminishes with increasing length of duration period.
SURFACE-WATER HYDROLOGY, NORTHERN CALIFORNIA 3
INTRODUCTION
PURPOSE AND SCOPE OF THE REPORT
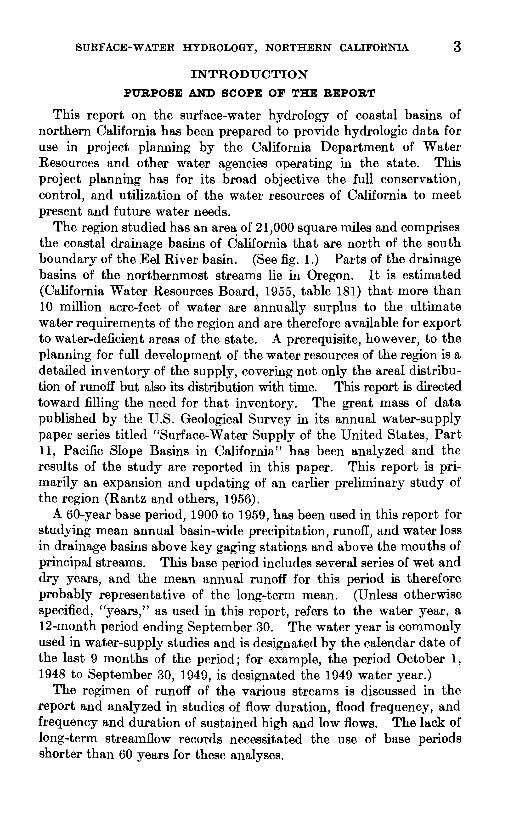
This report on the surface-water hydrology of coastal basins of northern California has been prepared to provide hydrologic data for use in project planning by the California Department of Water Resources and other water agencies operating in the state. This project planning has for its broad objective the full conservation, control, and utilization of the water resources of California to meet present and future water needs.
The region studied has an area of 21,000 square miles and comprises the coastal drainage basins of California that are north of the south boundary of the Eel River basin. (See fig. 1.) Parts of the drainage basins of the northernmost streams lie in Oregon. It is estimated (California Water Resources Board, 1955, table 181) that more than 10 million acre-feet of water are annually surplus to the ultimate water requirements of the region and are therefore available for export to water-deficient areas of the state. A prerequisite, however, to the planning for full development of the water resources of the region is a detailed inventory of the supply, covering not only the areal distribu tion of runoff but also its distribution with time. This report is directed toward filling the need for that inventory. The great mass of data published by the U.S. Geological Survey in its annual water-supply paper series titled "Surface-Water Supply of the United States, Part 11, Pacific Slope Basins in California" has been analyzed and the results of the study are reported in this paper. This report is pri marily an expansion and updating of an earlier preliminary study of the region (Rantz and others, 1956).
A 60-year base period, 1900 to 1959, has been used in this report for studying mean annual basin-wide precipitation, runoff, and water loss in drainage basins above key gaging stations and above the mouths of principal streams. This base period includes several series of wet and dry years, and the mean annual runoff for this period is therefore probably representative of the long-term mean. (Unless otherwise specified, "years," as used in this report, refers to the water year, a 12-month period ending September 30. The water year is commonly used in water-supply studies and is designated by the calendar date of the last 9 months of the period; for example, the period October 1, 1948 to September 30, 1949, is designated the 1949 water year.)
The regimen of runoff of the various streams is discussed in the report and analyzed in studies of flow duration, flood frequency, and frequency and duration of sustained high and low flows. The lack of long-term streamflow records necessitated the use of base periods shorter than 60 years for these analyses.

4 SURFACE-WATER HYDROLOGY, NORTHERN CALIFORNIA
V,
OREGON I
i Roseburg f
^
h Eureka
Kl
th'i
\hi \ 11V& 1 \^ <^V^"J 1°
I ^
\ ?* \rpo-L ". ^J C \?.
11
I ^
10 100 200 MILES
? , 1 1 1San Francisco
O
4
k
4>
i
FIGURE 1. Map showing location of report area.

INTRODUCTION 5
Relatively few stream-gaging stations operated during all years of the various base periods used in this report, and it was therefore necessary to resort to correlation techniques to produce the synthetic streamflow figures needed to fill existing gaps in the records. Greater refinement in these correlative estimates of flow would have been possible had this study been postponed for years to permit the collec tion of additional data. The pressing need of the planning agencies, however, for information of the type presented in this report permitted no delay.
OTHER INVESTIGATIONS
The ground-water resources of the region have been studied in recent years, and the results of the investigations have been published in seven U.S. Geological Survey water-supply papers (Back, 1957; Evenson, 1959; Mack, 1959; Mack, 1960; Poole 1961; Wood, 1961; Cardwell, in preparation). Additional ground-water information is found in a report of the Pacific Southwest Field Committee of the U.S. Department of the Interior (Rantz and others, 1956), and in an open- file report of the Geological Survey (Newcomb and Hart, 1958).
There have also been investigations of the quality of water in the region. Information concerning surface-water quality is published by the U.S. Geological Survey in its water-supply paper series titled "Quality of Surface Waters of the United States, Parts 9-14." In formation relating to the quality of ground-water supplies is pub lished annually by the California Department of Water Resources as chapters to its Bulletin 66 titled "Quality of Ground Waters in California". A summary of the quality of both surface- and ground- water supplies is found in the previously mentioned report of the Pacific Southwest Field Committee of the U.S. Department of the Interior (Rantz and others, 1956).
ACKNOWLEDGMENTS
This study was performed under the terms of a cooperative agree ment between the U.S. Geological Survey and the California Depart ment of Water Resources. The report was prepared by the Geological Survey under the supervision of Walter Hofmann, district engineer. W. T. Rintala assisted in the computation and preparation of the data.
Acknowledgment is made of the assistance rendered by the Cali fornia Department of Water Resources, Sacramento, Calif., in fur nishing tabulations of precipitation data. The Bureau of Reclamation, Sacramento, Cain*., helpfully furnished runoff information for the closed basins adjacent to the upper Klamath River basin.

6 SURFACE-WATER HYDROLOGY, NORTHERN CALIFORNIA
DESCRIPTION OF REGION
The principal streams of the region are the Eel Kiver, Mad River> Redwood Creek, Klamath River, and Smith River, all of which, drain large interior basins. The smaller coastal streams studied, Elk River, Jacoby Creek, and Little River, drain the coastal slope only of the northern California Coast Ranges. Plate 1 delineates the principal drainage systems and those hydrologic units under consideration for project planning; table 1 lists these drainage basins and their size. More than half the region is drained by the Klamath River and its tributaries, the principal tributaries being the Williamson River in Oregon, and the Shasta, Scott, Salmon, and Trinity Rivers in Cali fornia. The basins of Lost River and Lower Klamath Lake contribute little to the flow of the Klamath River.
TABLE 1. Basinwide precipitation, runoff, and water loss for hydrologic units in coastal basins of northern California (adjusted to base period 1900-59)
No. (Pi. 1)
1A
IB 1C
ID
IE
IF
1G
1H
U
IK 1L
Basin
Eel River Basin
Eel Eiver above gage at
Outlet Creek above mouth. Bemainlng drainage into
Eel Eiver above Middle Fork.....................
Total or average, Eel Eiver above Middle Fork.................
Middle Fork Eel Eiver below Black Butte River.
Remaining drainage into Middle Fork Eel River
Total or average, Mid dle Fork Eel Eiver above mouth ........
Total or average, Eel Eiver below Middle Fork.. ...............
North Fork Eel Eiver
Eemaining drainage into Eel River above Alder-
Drainage into Eel River between Alderpoint gage and mouth of South Fork.
Total or average, Eel Eiver above South Fork.. ............
South Fork Eel River above
Tenmile Creek at mouth- .. Eemaining drainage into
South Fork Eel Eiver above gage near Miranda.
Total or average, South Fork Eel Eiver above Miranda gage. ___
Drainage area (sq mi)
347 162
200
367
386
43.966.8
427.3
637
709
753
1,462
282
336
187
2,266
Annual basinwide values
Precipi tation
(inches)
5157
51
52
60
49
64
63
59
56
62
55
79 66
70
70
Runoff
1000's of acre-ft
500 315
325
689
481
122 145
1,030
1,297
1,140
1,170
2,310
426
447
394
3,576
Inches
27.0 36.4
30.5
30.2
35.2
23.4
29.1
29.6
28.3
25.0
39.5
29.6
52.1 41.3
45.2
45.3
Water loss
(inches)
24 21
21
22
26
26
25
23
31
31
22
25
27 25
26
25

DESCRIPTION OF REGION
TABLE 1. Basinwide precipitation, runoff, and water loss for hydrologic units in coastal basins of northern California (adjusted to base period 1900-59) Con.
No.<?;
1M
IN
IP
1R
IS
IT 1U
IV
2A
3A
4A
4B
4C
4D
5A
Basin
Eel River Basin Con.
Drainage into South Fork Eel River between Mi randa gage and mouth....
Total or average, South Fork Eel River above mouth... _______
Remaining drainage into Eel River above gage at Scotia _ - ____ - __
Total or average, Eel River above Scotia gage.... ........
Van Duzen River above
South Fork Van Duzen
Remaining drainage into Van Duzen River above gage near Bridgeville-- _
Total or average, Van Duzen River above
Yager Creek above mouth- Remaining drainage into
Van Duzen River above mouth.. ______ ......
Total or average, Van Duzen River above
Remaining drainage into Eel River above mouth. .
Total or average, Eel River above mouth
Elk River Basin
Elk River above gage near Falk . ..................
Jacoby Creek Basin
Jacoby Creek above gage near Freshwater _
Mad River Basin
Mad River above gage near
Drainage into Mad River between Forest Glen gage and mouth of North Fork
North Fork Mad River
Remaining drainage into Mad River above gage near Arcata. __ ..
Total or average, Mad River above Arcata gage.. --.-_-..-...
Little River Basin
Little River above gage at Crannell ______ .. ...
Drainage area (sq mi)
152
85.3
58.2
70.5
214 135
80
689
158
3,113
429
83
3,625
44.2
6.07
144
256
49.5
35.5
485
44.3
Annual basinwide values
Precipi tation
(inches)
76
71
66
59
74
75
67
72 60
50
64
41
59
49
54
60
68
66
55
64
65
Runoff
1000's of acre-ft
441
246
172
169
587 280
128
1,738
406
5,720
995
93
6,808
57
10.6
248
620
122
66
1,056
98
Inches
54.4
47.3
48.2
34.4
54.1
55.4
45.0
51.4 38.9
30
43
21
35
24.2
32.7
32.3
45.4
46.2
34.9
40.8
41.5
Water loss
inches)
22
24
18
25
20
20
22
21 21
20
21
20
24
25
21
28
23
20
20
23
23

8 SURFACE-WATER HYDROLOGY, NORTHERN CALIFORNIA
TABLE 1. Basinwide precipitation, runoff, coastal basins of northern California (adj
and water loss for hydrologic units in to base period 1900-59) Con.
No. (Pi. 1)
6A
6B
7A
7B
7C
8A
8B
8C
8D
8E
8F
80
8H
Basin
Redwood Creek Basin
Redwood Creek above gage
Drainage into Redwood Creek between gages near
Total or average, Red wood Creek above gage at Orick .........
Closed basins adjacent to Klamath River Basin
Lost River area above
Antelope and Butte Creek
Remaining closed drainage -
Total or average, all closed basins. .. ......
Trinity River Basin
Trinity River above gage
Trinity River drainage be tween gages at Lewiston and near Burnt Ranch. . .
Total or average, Trin ity River above
Trinity River drainage be tween Burnt Ranch gage and mouth of South Fork-
Total or average, Trin ity River above South Fork ...........
South Fork Trinity River above Hayfork Creek .....
Hayfork Creek above Hay-
Hayfork Creek drainage be tween Hayfork gage and mouth ___________
Total or average, Hay fork Creek above mouth ................
South Fork Trinity River drainage between Hay fork Creek and mouth. ...
Total or average, South Fork Trinity River
Trinity River drainage be tween South Fork and mouth _ _____ . -.
Total or average, Trin ity River above mouth ____ . __ -.
Drainage area (sq mi)
727
711
1,438
296
342
87.2
299.8
387
180
67.5
210.5
278
1,180
240 2,180
3,600
1,734
909
326
2,969
Annual basinwide values
Precipi tation
(inches)
80
80
80
16
26 16
17
59
55
57
59
57
63
47
42
43
57
50
61
55
Runofl
1000'sofacre-ft
1,304
958
2,262
547
507
83.5
289.5
373
331
195
601
796
191
45 233
469
2,809
1,211
601
4,621
Inches
54.2
53.5
53.7
3.0
3.52.0
2.4
33.6
25.3
29.4
34.7
30.4
27.8
18.0
18.1
18.1
34.5
24.9
34.5
29.2
Waterloss
(inches)
26
26
26
13
22 14
15
25
30
28
24
27
25
29
24
25
23
25
27
26

DESCRIPTION OF REGION 9
TABLE 1. Basinvride precipitation, runoff, and water loss for hydrologic units in coastal basins of northern California (adjusted to base period 1900-59) Con.
No. (Pi. 1)
9A
9B 9C 9D
9E
9F
9Q 9H
9J
9K
9L
9M
9N
9P
9R
98
Basin
Klamath River Basin
Williamson River above
Sprague River above mouth.
Remaining drainage into Upper Klamath Lake.
Total or average, drain age into Upper Klam-
Klamath River drainage between Upper Klamath Lake and gage at Keno ...
Total or average, Klam ath River above Keno
Klamath River "drainage between gages at Keno
Total or average, Klam ath River above
Scott River above Callahan
Drainage into Scott River between Callahan dam- site and gage near Fort
Drainage into Scott River between Fort Jones gage
Total or average, Scott
Remaining drainage into Klamath River above
Total or average, Klam ath River above Seiad Valley gage .....
Klamath River drainage between Seiad Valley gage and Happy Camp
Klamath River drainage between Happy Camp damsite and mouth of Salmon River-...-. ......
Total or average, Klam ath River above Sal-
South Fork Salmon River
North Fork Salmon River
Remaining drainage into Salmon River above
Total or average, Sal mon River above mouth... _______
Drainage area (sq mi)
1,400 1,600
360
450
3,810
110
3,920
460
160
602
151
..........
290
205
256
4,370 796
813
1,001
6,980
355
399
7,734
751
Annual basinwide values
Precipi tation
(inches)
25 23 30
24
24
14
24
32
25 22
38
32
45
36
38
28
67
77
32
50
59
63
57
Runoff
1000's of acre-ft
369 454 327
250
1,390
12
1,402
220
156
330
169
451
374
514
1,622 172
665
641
3,090
778
1,133
5,001
1,339
Inches
4.8 5.3
17.0
10.4
6.8
2.0
6.7
9.2
7.0 4.0
18.3
12.3
21.0
15.1
12.0
8.3
41.1
53.2
12.1
29.2
34.2
37.7
33.4
Water loss
(inches)
20 18 13
14
17
12
17
23
18 18
20
20
24
21
26
20
26
24
20
21
26
25
24

10 SURFACE-WATER HYDROLOGY, NORTHERN CALIFORNIA
TABLE 1. Basinwide precipitation, runoff, and water loss for hydrologic units in coastal basins of northern California (adjusted to base period 1900-59) Con.
No.is-
9T
g 9U
10A
10B 10C 10D
10E
Basin
Klamath River Basin Con.
Klamath River drainage between Salmon and Trinity Rivers. -. ____
Total or average, Klam ath River above
Trinity River above mouth . Remaining drainage into
Klamath River above
Total or average, Klam ath River above mouth.. . _______
Smith River Basin
Middle Fork above mouth of North Fork... .........
Remaining drainage into Smith River above gage
Total or average, Smith River above Crescent
Remaining drainage into Smith River above
Total or average, Smith
Drainage area (sq mi)
205
8,780 2,969
351
12,100
130 158 295
30
613
106
719
Annual basinwide values
Precipi tation
(inches)
77
3655
92
42
100 115 116
90
111
90
108
Runoff
1000'sofacre-ft
929
7,269 4,621
1,260
13,150
515 760
1,415
104
2,794
366
3,160
Inches
59.1
15.5 29.2
67.3
20.4
74.3 90.2 89.9
65.0
85.5
65.0
82.4
Water loss
(inches)
18
20 26
25
22
26 25 26
25
26
25
26
Most of the region is mountainous; many peaks are above 6,000 feet in elevation. Mount Shasta on the eastern divide at 14,161 feet is the highest. The mountainous areas are generally well covered with timber. The only valley areas of appreciable extent are those in the basins of the Scott, Shasta, Lost, and upper Klamath Rivers, and in the basin of Lower Klamath Lake. (A valley area is defined, for the purpose of this study, as one sloping less than 200 feet to the mile.) Irrigation is widely practiced in these valleys. The only storage or diversion works of large size are in the basins of the upper Eel, Trinity (project under construction as of May 1961), Shasta, Lost, and upper Klamath Rivers.
GEOLOGY
The report area includes large parts of three physiographic sections (pi. 5): the northern California Coast Ranges, the Klamath Mountains, and the Southern Cascade Mountains and associated lava plateau (Irwin, 1960). The geology and topography of these provinces
DESCRIPTION OF REGION 11
significantly affect the climate and weather, drainage conditions, soils, and natural vegetation, and each province is hydrologically homogeneous. All the streams with the exception of the Smith River and the Klamath River and its tributaries lie wholly within the northern California Coast Ranges.
The northern California Coast Ranges are composed chiefly of a complex assemblage of sandstone and shale, and greenstones of probable Mesozoic Age, intruded by large masses of ultramafic rocks largely altered to serpentine. The general structure of the Coast Ranges, characterized by northwest-trending folds and faults, controls the drainage. Many of the streams and large valleys are along zones of weakness associated with major faults, and the drainage pattern is rudely trellised. Locally, the combination of sheared rocks, steep slopes, and heavy precipitation produces the landslides common to the area.
The Klamath Mountains section is a rugged region extending be tween the northern California Coast Ranges and the Southern Cascade Mountains. It adjoins the Coast Ranges along the South Fork Mountains, which have the rock types of the Klamath Mountains but the topography of the Coast Ranges. The Klamath Mountains have a complex structural pattern and a well-defined arcuate regional trend. The rocks are largely crystalline, consisting principally of highly metamorphosed volcanic and sedimentary rocks, intruded by granitic and ultramafic rocks. Streams in the Klamath Mountains are transverse and flow in deep narrow canyons. Their devious courses give little suggestion of order and are little related to geologic structure.
The Southern Cascade Mountains, lying east of the Klamath Moun tains and north of the Sierra Nevada, consist of lava and pyroclastic rocks. From Keno, Oreg., to the mouth of Willow Creek, the Klamath River flows in a canyon cut into the volcanic rocks. Upstream from Keno, the Klamath River and its tributaries drain a plateau region likewise underlain by lava and pyroclastic rocks. The surface drain age pattern of the plateau is poorly developed, because the highly permeable and fractured volcanic rock allows ready infiltration of precipitation and snowmelt. Seeps are common and large springs are numerous.
CLIMATE
The climate along the coast is marked by moderate and equable temperatures, heavy and recurrent fogs, and prevailing west to north west winds. Inland, temperatures have a wider range and winds are generally moderate. Temperatures are influenced largely by elevation and by local topography. Precipitation along the coast is
710-057 <

12 SURFACE-WATER HYDROLOGY, NORTHERN CALIFORNIA
of greater frequency and annual magnitude than anywhere else in California. It is heaviest on the western slopes of the coastal ranges and decreases, in general, from north to south. Precipitation is dis tinctly seasonal, very little occurring from June through September. This seasonal distribution of precipitation is largely controlled by the anticyclonic cell that is normally found off the California coast, particularly in summer. The frequent winter precipitation occurs usually when this anticyclone either is absent or is far south of its usual position. Snow falls in moderate amounts at elevations above 2,000 feet, but only at elevations above 4,000 feet does snow remain on the ground for appreciably long periods of time.
DESCRIPTION OF THE INDIVIDUAL BASINS
EEL, RIVER BASIN
The Eel River, the southernmost stream in the region covered by this report, drains an area of 3,625 square miles. The drainage basin (area 1 on pi. 1) is almost entirely mountainous, and the tributary streams, for much of their length, follow roughly parallel courses between the northwestward-trending ridges of the northern California Coast Ranges. Sharp drops in streambed profile occur where the main stream and tributaries have cut westward through ridge lines. Ele vations in the basin range from sea level to 7,000 feet.
On upper Eel River storage in Lake Pillsbury provides sufficient water for an average annual diversion of 148,000 acre-feet into the Russian River basin for power development and irrigation. The first large upstream tributary, Middle Fork, joins the main stream from the east, 40 miles below Lake Pillsbury. The river then flows through a canyon for about 100 miles. Near the mouth of its tribu tary, the Van Duzen River, it reaches the coastal plain, through which it meanders for 15 miles before entering the Pacific Ocean. The fall of the main stream ranges from about 19 feet per mile in the upper reaches to about 3.5 feet per mile in the coastal area. The other principal tributaries of the Eel River are the North Fork, which enters from the east, and the South Fork, which flows in a narrow valley to the west of the main river valley and parallels it for the greater part of its course. The east side tributaries are typical mountain streams flowing through canyons with steep gradients, then* fall in the upper reaches being from 50 to 150 feet per mile.
T5T.TC RIVER BASIN
The Elk River, draining an area (area 2 on pi. 1) on the west slope of the northern California Coast Ranges, derives its flow from two principal tributaries, the North Fork and the South Fork. The single gaging station in the basin is located just below the confluence of these tributaries, where the river debouches from the canyon onto the

DESCRIPTION OF INDIVIDUAL BASINS 13
coastal plain. The streambed gradient above the gaging station is quite steep and averages about 150 feet to the mile; downstream from the gaging station the river slowly meanders into Humboldt Bay. Elevations in the basin range from sea level to about 2,400 feet. The drainage area above the mouth of Elk River is 56.1 square miles; above the gaging station near Falk the drainage area is 44.2 square miles.
JACOBY CREEK BASIN
Jacoby Creek flows in a northwesterly direction in a canyon along the coastal flank of the northern California Coast Ranges. The streambed gradient is extremely steep and in its upper 6K miles aver ages more than 300 feet to the mile. In its lower two miles, the creek meanders through the coastal plain to empty into Humboldt Bay. Elevations in the basin range from sea level to about 2,200 feet. The total drainage area (area 3 on pi. 1) of the basin is 16.0 square miles; above the gaging station near Freshwater the drainage area is 6.07 square miles.
MAD RIVER BASIN
The Mad River has a drainage area of 497 square miles (area 4 on pi. 1) and is the first sizable stream in the northern California Coast Ranges north of the Eel River. Throughout its 100-mile length, the river flows generally northwest to empty into the Pacific Ocean. Its two principal tributaries are Pilot Creek and North Fork, neither of which is large.
Elevations in the basin range from sea level to about 6,000 feet. The main channel of the river heads at an elevation of 2,900 feet in the same valley trough in which, a few miles to the southwest, the Middle Fork Eel River starts its flow in an opposite direction. In the first 37 miles of its upper course, the Mad River traverses a mountain valley approximately one-half mile wide, having a fall averaging about 16 feet per mile. At an elevation of 2,300 feet, the river enters a canyon through a break in a ridge on the west. The river flows rapidly through this canyon section for 31 miles with a total drop of 1,900 feet. In the lower canyon the river cuts westward across a second ridge and emerges in a lower valley trough at an elevation of 400 feet. It continues along this trough for 24 miles to the coastal plain, through which it flows for the last 10 miles of its course to the ocean.
LITTI^E RTVER BASIN
The Little River drains a 48.7-square mile area (area 5 on pi. 1) on the west slope of the northern California Coast Ranges and empties into the Pacific Ocean north of Humboldt Bay. The upper 14 miles of the river is incised in a canyon and has a fall of more than 200 feet

14 SURFACE-WATER HYDROLOGY, NORTHERN CALIFORNIA
to the mile. The lower 2% miles meanders through the coastal plain and drops only 18 feet in its course to the ocean. Elevations in the basin range from sea level to about 3,200 feet.
REDWOOD CREEK BASIN
Redwood Creek drains an area (area 6 on pi. 1) of 282 square miles in the northern California Coast Ranges, north and east of the Little River. The basin is roughly rectangular in shape and is about 55 miles long. Redwood Creek flows in a northwesterly course for its entire length and has no large tributaries. It is joined by Prairie Creek, its principal tributary, about 3 miles from its mouth near Orick. Elevations in the basin range from sea level to about 5,000 feet.
KLAMATH RIVER BASIN AND ADJACENT CLOSED BASINS
The Klamath River, its tributaries, and the streams in the adjacent closed basins of Lost River and Lower Klamath Lake drain an area (areas 7-9 on pi. 1) of 15,700 square miles. Of this area, approxi mately 3,600 square miles, comprising the closed basins of Lost River and Lower Klamath Lake, normally do not contribute to the runoff of the Klamath River. The area upstream from Keno, Oreg. (in cluding Lost River and Lower Klamath Lake basins) is a high vol canic plateau of about 7,500 square miles, lying east of the Cascade Mountains. This plateau, which is partly in Oregon and partly in California, is composed of broad, flat valleys separated by low hills and ridges. Elevations range, in general, from 4,000 to 5,000 feet above sea level in the valleys, and from 5,000 to 7,000 feet along the timbered mountain ridges; a few peaks rise above 9,000 feet. Agri culture is extensive in the valleys.
At Keno, the Klamath River crosses a hard lava ridge and enters a rugged winding canyon, in which it travels 235 miles to the Pacific Ocean. The 8,200-square-mile drainage area downstream from Keno lies south of the principal ridge of the Klamath Mountains and almost entirely in California. Practically all of this extensive area is moun tainous; ridges range up to 7,000 feet in elevation and a few peaks even higher. Much of the area is forest covered. The only agricultural lands of any extent are found in the tributary basins of the Shasta and Scott Rivers.
The Williamson River in Oregon is considered the headwater stream of the Klamath River. It has its source in a spring, located on what was formerly the Klamath Indian Reservation, and flows for 30 miles into Klamath Marsh. Klamath Marsh, with an area of about 125 square miles, affords some grazing for cattle but is utilized principally as a refuge for migratory waterfowl. Fourteen miles downstream from Klamath Marsh, the Williamson River, fed by Spring Creek and
DESCRIPTION OF INDIVIDUAL BASINS 15
many smaller springs, receives its principal tributary, the Sprague River. Twelve miles farther downstream, the Williamson River empties into Upper Klamath Lake. The Sprague River is likewise spring fed, and its principal tributary, the Sycan River, is subject to natural regulation in its course through Sycan Marsh. The area drained by the Williamson River is 3,000 square miles, of which 1,600 square miles is in the Sprague River basin.
In addition to the runoff from the Williamson River, Upper Klamath Lake receives runoff from a number of small basins on the north and west, including those of Wood River, Sevenmile, Cherry, and Fourmile Creeks. Crater Lake, a closed basin to the north of Wood River, is considered part of the Klamath River drainage area because some Crater Lake water may percolate into that basin. It is equally possible, however, that some percolation finds its way into the Rogue River basin to the west. Some water from Fourmile Lake, naturally draining into Upper Klamath Lake through Fourmile Creek, is diverted through the Cascade Canal into the Rogue River basin at Fish Lake. This diversion averages about 4,500 acre-feet per year. About 10 miles to the east of Upper Klamath Lake is the small closed basin of Swan Lake.
Upper Klamath Lake is a shallow body of water with a surface area of about 70,000 acres. There is a regulating dam for power and irrigation at the lower end of the lake. Water for irrigation in the U.S. Bureau of Reclamation Klamath Project is diverted into "A" canal which feeds canals and laterals on both sides of Klamath valley. Figures 2 and 3, which are schematic diagrams of the upper Klamath River basin and the closed basins of Lost River and Lower Klamath Lake, show the principal features of the Klamath Project. Upper Klamath Lake discharges into the Link River, which in turn flows into Lake Ewauna at Klamath Falls. The Link River is about 1 mile long and has a fall of about 60 feet. Lake Ewauna is about 2 miles long and one-half mile wide. It gradually narrows at its lower end and becomes the Klamath River. Because of the flat grade at the head of the river, there is no definite line marking the lower end of Lake Ewauna and the beginning of the Klamath River.
The Lost River drains most of the southern part of the plateau area. From its source in north-central California it flows northward into south-central Oregon, then westward and finally southward and southwestward into Tule Lake not far from its source. Tule Lake has no surface outlet, and all water reaching it is lost by evaporation and percolation. In the past, there was occasional interchange of water through a slough connecting the Lost River and the Klamath River, although generally, during flood periods, the flow was from the Klamath River into the Lost River. The construction of a dike

16 SURFACE-WATER HYDROLOGY, NORTHERN CALIFORNIA
FIQVBE 2. Streamnow diagram, Upper Elamath River basin, showing present conditions. (Courtesy ofU.S. Bureau of Reclamation.)

DESCRIPTION OF INDIVIDUAL BASINS 17
SHEEPY LAKE
4855 Olene Woste 4860 Lost River
4865 "G" Conol 4870 Lost River
\ 1 i ^^bj^m;(*#ift^iM*
............ .. . ,.^u, , , \ :<: !; Olene, Oregon F: :: ' : ':$snij>f '
near Olene, Oregon V ..: r. ; ': -'-':'_']^ of Wilson Bridge neor ^^>~-Lii
Olene, Oregon ~V
5070 Upper Klomoth Loke neor fe^T3 T" \ Klomoth Falls, Oregon Va^^K/ ::^i\
5060 "A" Conol at Klomoth Foils, Oregon \jL:.: j 5075 Link River at Klamoth Foils, Oregon 5065 Keno Conol at Klomoth Foils, Oregon
Lost Rive
5091 Diversion to
5090 Diversions f
5092 Ady pumps
r near Olene , Oregon Midland Canal neor
Midland , Oregon
rom Klomoth River at Ady , Oregon
to Klomath River at Ady, Oregon
FIGURE 3. Diagram of main canals and gaging stations, Klamath Project.

18 SURFACE-WATER HYDROLOGY, NORTHERN CALIFORNIA
across the slough ended this condition, and since the construction of the Lost River diversion dam and canal, most of the flow of the Lost River, not needed for irrigation, is discharged into the Klamath River. These works and others, including the construction of Clear Lake and Gerber Reservoirs, have resulted in the drying up of most of Tule Lake. Crops are now cultivated on the former lakebed, but a part of it is utilized as a sump for flood protection in the event of flow in the Lost River exceeding the capacity of the Lost River diversion canal (capacity 2,100 cfs). During the irrigation season, when the demand in the lower Lost River and Tule Lake regions exceeds the water supply of the Lost River basin, the direction of flow in the Lost River diversion canal may be reversed to divert water from the Klamath River to the Lost River at a point just downstream from the Lost River diversion dam.
Klamath Straits, joining the main river between the Lost River diversion canal and Keno, formerly connected the Klamath River with Lower Klamath Lake, and a considerable quantity of water flowed annually from the river into the lake. In 1917, Klamath Straits was closed by gates, and a large part of Lower Klamath Lake has since dried up. A part of its bed is now cultivated, and during the irrigation season water is diverted from the Klamath River into this reclaimed area through the Midland Canal and Klamath Straits. A part of the old Lower Klamath Lake bed is utilized as a refuge for migratory waterfowl and as a sump, and at times water may be pumped from Lower Klamath Lake back into the Klamath River. The Lower Klamath Lake system is connected to the Tule Lake sump through a tunnel. This enables water to be pumped from Tule Lake sump through Lower Klamath Lake and Klamath Straits into the Klamath River.
Southwest of Lower Klamath Lake there are several closed basins from which either ground water or surface spill may find its way, in part, to Lower Klamath Lake. Two of the more important basins are those drained by Antelope and Butte Creeks. A part of the flow of these two creeks is used for irrigation.
At Keno, Oregon, about 15 miles downstream from Lake Ewauna, the Klamath River enters a canyon and in the next 60 miles drops over 2,000 feet. There are numerous small tributaries in this stretch of channel, but none of major economic importance. There is some irrigation, however, along these tributaries, principally on Cottonwood Creek. From Keene Creek, another of the small tributaries, there is a diversion into the Rogue River basin that amounts to about 8,000 acre-feet per year.
DESCRIPTION OF INDIVIDUAL BASINS 19
Sixty miles below Keno, the Shasta River enters the Klamath River. The Shasta River has its source on the east slope of China Mountain, at an elevation of 6,000 feet above sea level, and flows generally north and northwest in its 40-mile course to the Klamath River. It has a total fall of 4,000 feet; of this total, 3,000 feet occurs in the first 5 miles. The Shasta River drains an area of 796 square miles and has for its principal tributary the Little Shasta River. There is considerable irrigation in Shasta Valley, and virtually all the runoff above Dwinnell Reservoir is stored and diverted for that purpose. The drainage area above the reservoir is 139 square miles, and the reservoir itself has a usable storage capacity of 30,000 acre-feet. During the summer, flow downstream from Dwinnell Reservoir is maintained largely by springs.
The Scott River, the next tributary of importance, joins the Kla math River 34 miles downstream from the mouth of the Shasta River It is formed by the confluence of the East and South Forks at Callahan, from which point Scott River flows 50 miles to the Klamath River. There are numerous small tributaries below the forks of the river, most of which enter on the left. The area drained is 813 square miles. A large part of the valley is under irrigation, but there are no storage works on the river. Elevations in the basin range from about 2,600 feet to about 8,000 feet above sea level.
The next Klamath River tributary of importance downstream from the Scott River is the Salmon River. In the 77 miles between the mouths of the Scott and Salmon Rivers, numerous small tributary streams enter the Klamath River. Of these, Indian Creek is the most important.
Salmon River is formed by the confluence of the- South and North Forks. Its headwaters drain an inaccessible region along the north and west slopes of the Salmon Mountains. Its length from the head of South Fork to the Klamath River is 50 miles. The river with its numerous tributaries drains an area of 751 square miles, all of it rough and mountainous. Elevations in the basin range from about 500 feet to about 8,000 feet above sea level.
The Trinity River, which enters the Klamath River 23 miles down stream from the Salmon River, is the principal tributary of the Kla math. The source of the Trinity River is about 20 miles southwest of Mount Shasta and about 10 miles from the headwaters of the Sacramento River. The river flows first south, then west, then northwest for about 130 miles and empties into the Klamath River at Weitchpec, 42 miles from the ocean. Its principal tributary is South Fork, whose principal tributary, in turn, is Hayfork Creek.

20 SURFACE-WATER HYDROLOGY, NORTHERN CALIFORNIA
The Trinity River drainage basin, largely mountainous, comprises 2,969 square miles, about 30 percent of which is tributary to South Fork. Elevations in the basin range from about 250 feet to about 9,000 feet above sea level. A multipurpose project is under construc tion (as of May 1961) on the upper Trinity River near Lewiston; water in excess of the needs of the Trinity River basin will be diverted into the Sacramento River basin.
The only other Klamath River tributaries of any consequence are Bluff Creek and Blue Creek, both of which enter the river 'from the right. Bluff Creek with a drainage area of about 75 square miles, empties into the Klamath River about 5 miles upstream from the mouth of Trinity River; Blue Creek, with a drainage area of about 110 square miles, enters the Klamath River about 24 miles downstream from the mouth of the Trinity River.
SMITH RIVER BASIN
The Smith River, the northernmost stream in the region covered by this report, drains an area (area 10 on pi. 1) of 719 square miles. Except for a narrow coastal plain about 3% miles wide, the entire basin lies in the Klamath Mountains. From the head of Middle Fork to the Pacific Ocean, the Smith River is about 45 miles long, and its principal tributaries are North Fork and South Fork. With the ex ception of a small valley area at Gasquet on Middle Fork and a similar area at Big Flat on South Fork, the river flows through deep gorges and canyons until it reaches the coastal plain. Elevations in the basin range from sea level to about 5,800 feet. Streambed slopes range from less than 10 feet per mile in the lower reaches to more than 100 feet per mile in the headwaters.
PRECIPITATION
Precipitation in the coastal basins of northern California is dis tinctly seasonal, very little occurring from June through September. Roughly three-fourths of the total precipitation falls during the five months, November through March. The distribution is illustrated by table 2, which gives mean monthly precipitation, in percent of the total, at six representative precipitation stations in the region. The bulk of the precipitation occurs during general storms of several days duration and relatively moderate intensity. Hourly precipitation volumes in excess of 1 inch are uncommon. Snow falls in moderate

PRECIPITATION 21
amounts at elevations above 2,000 feet, but only at elevations above 4,000 feet does snow remain on the ground for appreciably long periods of time.
TABLE 2. Mean monthly distribution of precipitation at selected stations
Precipitation station
Crescent City, Calif. (No. 120)... ____
Klamath Falls, Oreg. (No. 112) _____ ...
Yreka, Calif. (No. 100).......
Weaverville Ranger Station, Calif, (sta. 67) .....
Eureka WB City, Calif, (sta. 36)
Covelo Eel River Ranger Station, Calif, (sta. 11) _____
Mean annual precip itation 1900-59
(in.)
82.4
13.3
18.0
37.1
38.3
39.3
Mean monthly distribution of precipitation in percentage of mean annual precipitation
Oct.
7
7
7
6
7
5
Nov.
14
13
14
14
13
10
Dec.
16
15
17
18
16
20
Jan.
16
16
17
18
17
21
Feb.
15
12
14
16
15
19
Mar.
13
9
10
11
14
10
Apr.
8
7
6
8
8
8
May
5
7
6
4
5
4
June
2.5
6
3
2.6
2
1
July
0.5
2
2
.4
.5
.5
Aug.
0.5
2
1.5
.3
.5
.2
Sept.
2.5
4
2.5
1.7
2
1.3
Mean annual precipitation is influenced by distance from the ocean, elevation, shape and steepness of mountain slopes, and direction of slopes in relation to the moisture-bearing winds. As a rule, precipita tion increases from south to north and is much heavier on southern and western than on northern and eastern mountain slopes. This is seen on the isohyetal map (pi. 2), which presents a generalized picture of the areal distribution of mean annual precipitation, based on the 60-year period 1900-59. The wide range in mean annual precipitation is striking; precipitation decreases from a high of 120 inches in the northwest to a low of 10 inches in the northeast. Plate 3 is a location map showing the 126 precipitation stations within the region that were used in the construction of the isohyetal map; outlying precipita tion stations that were used are not shown. With few exceptions, all the stations are or were operated by the U.S. Weather Bureau. Table 3, based on a tabulation furnished by the California Department of Water Resources, lists mean annual precipitation at each of the 126 stations. The precipitation figures have been adjusted by correlation procedures to the base period, 1900-59. Table 3 also includes, for each station, its location, elevation, and identifying number on plate 3.

22 SURFACE-WATER HYDROLOGY, NORTHERN CALIFORNIA
TABLE 3. Mean annual precipitation for period 1900-59, at stations in coastal basins of northern California
No. (PL 3)
1234
56789
101112131415161718192021222324252627282930313233
343536
373839404142434445
46474849
505152
53545556
Station
Eel Riser basin, California
Willits Howard Forest Ranger Station ... Willits Northwestern Pacific Railroad
Depot... ________________
Laytonville 3 SW _____________Laytonville ________________
Standish Hickey Park __________
Lake Mountain _____________Old Harris.. _______________
Miranda Spengler Ranch _________Alderpoint ...............................Zenia 1 SSE ________________
Myers Flat .....- ............ .........
Sbively............ ._ __.__ Bridgeville 4 NNW... _ ................
Scotia ....................................Rohnerville _ ........................
Kneeland 10 SSE ........................
Small coastal basins in California north of Eel Riser basin
Crannell ___ . _____________Little River. ............................
Patricks Point State Park... ............Orick 5 SSW__.._ ............ _ . _ ..
Crescent City 5 NNE.. .................Crescent City Lake Earl __ ... .........
Mad Riser basin, California
Korbel _______ __ .. _____ - .Mad River Ranger Station.. ._.. Ruth....................................
Redwood Creek basin, California
Orick 3 NNE.. .......................Orick Prairie Creek ......................
Closed basins adjacent to Klamath River basin
Dairy 3 NE Yonna, Oregon _______Gerber Dam. Oregon.. _________
Merrill2 NW, California....
Lati tude
39°19'39°25'39°21'
39°24'39°29'39°39'39°40'39°42'39°43'39°47'39°50'39°50'39°51'39°52'39°59'40°02'40°01'40°05'40°06'40°12'40°11'40°11'40°16'40°16'40°21'40°26'40°32'40°30'40°31'40°29'40°34'40°36'40°38'
40°42'40°00'40°48'
41°01'41°02'41?03'4P08'41°14'41°46'41°46'41°49'41°49'
40°56'40°52'40°27'40°19'
41°19'41°19'41°20'
42°16'42°12'41°52'42°03'
Longi tude
122°53'122°59'123°19'
123°21'123°09'123°37'123°32'123°29'123°21'123°15'123°05'123°38'123°42'123°44'123°37'123°30'123°24'123°40'123°47'123°46'123°36'123°29'123°37'123°52'123°55'123°58'123°49'123°54'124°01'124°06'124°08'124°09'123°54'
124°16'124°00'124°10'
124°04'124°07'124°09'124°09'124°06'124°12'124°12'124°09'124°10'
123°52'123°58'123°32'123°22'
124°03'124°02'124°01'
121 °28'121 °0«'120°57'121 °38'
Ele vation
(ft)
2,1501,9001,900
1,3651,8002,0001,9001,640
9271,3851,5141,3241,100
8501,910
9403,1702,225
540400435
2,8801,700
175155200
2,05042516013915060
2,356
1601043
15015019825047540505530
1,875180
2,7752,925
7550
161
4,1504,9005,0004,080
Period of
record
1928-441924-501935-59
1911-591910-16
f 1900-24
1917-591940-591917-591921-591939-591927-591950-591950-591953-591943-591939-591956-591935-591939-591940-591950-591906-161950-591944-591912-211954-591947-521948-591926-591901-201956-591952-59
1916-391913-361878-1959 1933-481949-591918-391947-591951-561946-591941-591949-591949-57
1952-591937-591943-591912-30
1954-591950-591937-59
1908-591926-591923-491906-271949-59
Estimated 60-yr. mean annual pre cipitation
(to)
50.041.048.0
52.147.5
} 79.174.455.146.439.339.372.273.170.467.041.752.576.354.251.748.562.464.067.452.855.958.652.150.447.344.739.860.4
35.237.938.3
53.551.341.964.866.264.463.077.375.4
73.853.056.851.0
66.469.067.4
13.717.413.011.0

PRECIPITATION 23
TABLE 3. 'Mean annual precipitation for period 1900-59, at stations in coastal basins of northern California Continued
No. (pl. 3)
57585960 616263
64656667
686970717273747576
777879808182S384858687888990919293949596979899
100101102103104105106107108
109110111112113114115116117118
Station
doted basins adjacent to Klamath Riser basin Continued
Tulelake Inspection Station, California ..
Mount Hebron Ranger Station, Califor-
Trinity Riser basin, California
Trinity Center Ranger Station ___
Burnt Ranch 1 S ____ . _ . _ . ___Burnt Ranch Honor Camp 36 _____China Flat ________ . _____ ..
Forest Glen __ ___ __ _ ___ .
Klamath Riser basin California
Blackbear King Solomon Mine. ___ ..Qilta... .._._._-_-....___-_______________Weitchpec 7 NNE __ _ _ __Klamath
Sawyers Bar Ranger Station _____ ..Callahan Ranger Station __ _ __ ..
Weed ___ .. _ ___ ___ ___
Gazelle.. __ __ ... __ __ .Bray 10 WSW... _ ....... _ ..... .. .. ..Gazelle 4 NNW....... ...................
Soap Creek... __ __ _ _____
Yreka _ ........ _ .... _ . __ ...... ...Scott Bar Guard Station _ . _ .. .....Happy Camp Ranger Station ____ .Horse Creek Hamaker Ranch ____ . .
Betts Ranch ___ .. ___ _ ....
Hornbrook ____ _ . __ . __ ..Hilts.....................................
Oregon Siskiyou ___________________Copco Dam No*. 1, California ______
Klamath Falls 2 SSW... _ . _ .........Round Grove _______________Chiloquin. ________________Fort Klamath ______________Sand Creek ________________Crater Lake ________________Chemult _________________
Lati tude
42°01'41°58'41°56'41°37' 41°43'41°44'
41°47'
41°12'41°00'40°50'40°44'
40°45'40°48'40°48'40°52'40°53'41°03'40°37'40°33'40°23'
41°06'41°10'41°15'41°12'41°18'41°32'41°18'41°23'41°18'41°18'41°28'41°26'41°28'41°31'41°34'41°35'41°35/41°33'41°36'41°40'41°39/41°44'41°45'41°43'41°45'41°48'41°54'41°50'41°49'41°52/41°55'42°00'
42°03'41°59'42°08'42°13'42°20/42°35'42°42'42°51'42°54'43°12'
Longi tude
121°25'121°28'121°05'121°14' 121°30'121°48'
122°00'
122°32'122°41'122°51'122° 56'
123°15'123°29'123°29'123°35'123°35'123°41'123°28'123°10'123°20'
123°03'123°10'123° 11'123°20'123°41'124°02'123°32'123°29'123°08'122°48'122°54'122°23'122°26'122°31'122°08'122°32'122°43'122°54'122°51'122°45'122°32'122°31'122°28'122°38'123°00'123°23'123°02'122°51'122°30'122°14'122°33'122°38'
122°36'122°22'121°56'121°47'120°53'121°51'122°00'121°54'122°08'121°46'
Ele vation
(ft)
4,0504,0354,5004,408 4,7604,380
4,250
5,7002,2952,4002,050
1,2482,1401,540
650623350
1,2402,3462,340
3,0003,5503,6003,3001,700
25403550
2,1693,1362,9123,5062,9632,7755,7592,7303,3242,8182,7203,5002,5602,5382,6402,6311,8001,0903,4701,9632,6506,1402,1542,900
4,4862,7004,0404,0984,8884,2004,2004,6826,4754,760
Period of
record
1912-471932-591907-551953-59 1940-451952-59
1942-59
1946-591941-591949-591871-921912-59 1943-591945-591942-581908-551943-591941-591940-591915-591930-59
1954-591938-401941-451910-151910-171941-591903-591954-591931-591943-591940-591942-571888-19471943-591951-591949-591941-591943-591936-591941-471908-391888-19591948-591871-19591921-361914-591941-591942-591943-591952-591888-19181939-59
1899-19361928-591927-591884-19591920-59
/ 1884-98\ 1909-59
1865-981930-481920-591937-59
Estimated 60-yr- mean annual pre cipitation
(in)
11.99.9
13.016.4 11.910.8
10.1
51.346.945.837.1
38.038.837.047.546.550.239.731.959.5
37.933.637.554.477.879.450.858.043.720.024.925.120.811.019.610.418.220.920.820.817.912.910.818.027.552.039.422.214.834.313.820.8
37.016.818.913.316.0
} 17.322.427.764.024.2

24 SURFACE-WATER HYDROLOGY, NORTHERN CALIFORNIA
TABLE 3. Mean annual precipitation for period 1900-59, at stations in coastal basins of northern California Continued
No.(pi.3)
119120121122123124125126
Station
Smith Riser basin, California
Crescent City 11 E. ________ __Crescent City 7 ENE _______ .. .Gasquet Ranger Station. ________Patrick Creek Lodge ___________Idlewild Maintenance Station. ..........Smith River 7 SSE__ .....Monumental.... __ __ ..Smith River 2 WNW ___ ......
Latitude
41°45'41°48'41°52'41°52'41°54'41°50'41°58'41°66'
Longitude
124°00/124°05'123°58'123°51'123°46'124°07'123°48'124°11'
Elevation
(ft)
360120384820
1,26060
2,420195
Periodof
record
1947-591913-591940-591951-591946-591952-591904-101951-59
Estimated60-yr. meanannual precipitation
(in)
93.282.488.183.277.279.6
104.596.6
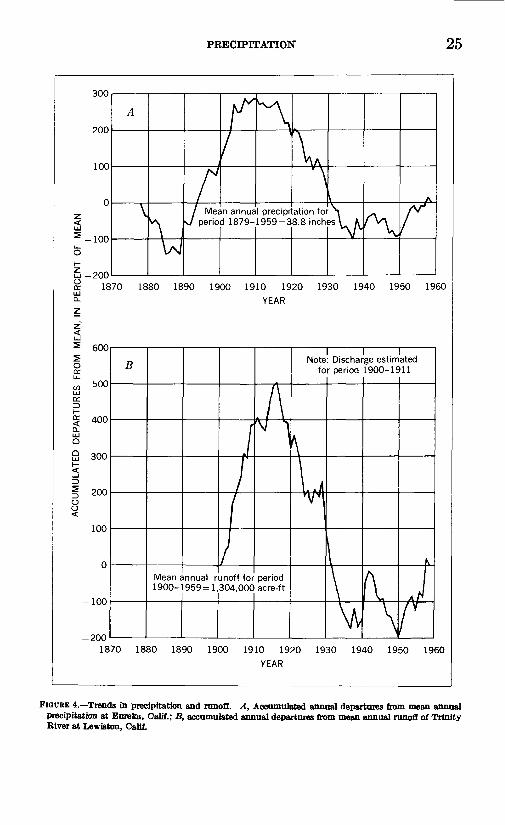
There is wide variation from year to year in the annual precipita tion at any particular site. For example, at the precipitation station at Dos Rios in the Eel River basin, the mean annual rainfall is 46.4 inches, but precipitation has ranged from 15.3 inches in 1924 to 85 inches in both 1956 and 1958. Time trends in precipitation are illus trated by graph (A) of figure 4 which shows accumulated departures of annual precipitation from the 81-year mean at Eureka, Calif., during the period 1879 to 1959. The progression shown is quite typical of that for the entire region. In a graph of this type, the plotting position for any particular year has little significance and only the slope of the graph is important. A downward slope indicates less than average precipitation; an upward slope indicates that pre cipitation exceeded the mean. It is seen that northern California experienced a prolonged wet period from 1890 to 1916, followed by a dry period from 1917 to 1937. In the 22 years since 1937, there have been two wet periods and one dry one. The driest single year of record was 1924; two of the wettest years of record were 1956 and 1958. The long-term base period chosen for use, 1900-59, has a mean annual precipitation at Eureka that differs by only 1.3 percent from the mean for the entire 81 years of record at that station.
Mean annual precipitation for the subbasins and hydrologic units listed in table 1 has been estimated by planimetering the isohyetal map on plate 2. It is recognized that estimates of basinwide precipita tion, obtained for this rough mountainous country from the existing network of precipitation stations, are not precise; these estimates are of importance, nevertheless, as indexes of precipitation. The basinwide averages are given in table 1.
PRECIPITATION 25
300
200
100
100
-200
Mean annual precipitation for period 1879-1959 = 38.8 inches'
1870 1880 1890 1900 1910 1920 1930 1940 1950 1960YEAR
I I INote: Discharge estimated
for period 1900-1911I
Mean annual runoff for period 1900-1959=1,304,000 acre-ft
-200
1870 1880 1890 1900 1910 1920 1930 1940 1950 1960YEAR
FIGURE 4. Trends in precipitation and runoff. A, Accumulated annual departures from mean annual precipitation at Eureka, Calif.; B, accumulated annual departures from mean gnmmi runoff of Trinity River at Lewiston, Calif.

26 SURFACE-WATER HYDROLOGY, NORTHERN CALIFORNIA
RUNOFF
MEAN ANNUAL VOLUME
Mean annual runoff in the region, being directly related to mean annual precipitation, is influenced principally by such factors as latitude, distance from the ocean, elevation and steepness of the mountain slopes, and their exposure and orientation. This results in an areal distribution of mean annual runoff in which runoff tends to increase from south to north and from east to west. The Smith River basin in the northwestern corner of California, with an average annual runoff of 82 inches, has the largest volume of runoff per square mile of any major basin in the state.
Geologic characteristics usually have their primary effect on the time distribution of flow, but they also affect the total volume of runoff in the upper Klamath River basin and adjacent closed basins. These basins occupy a lava plateau that has poorly developed surface drainage, and the volume of surface runoff that passes a given point is often dependent on the location of the larger springs and seeps, and on the permeability of the streambed above the site. The extensive marsh areas of the upper Klamath River basin also cause large evapotranspiration losses.
Runoff trends during the period 1900-1959, are illustrated by graph (B) of figure 4, which shows accumulated annual departures from the 60-year mean annual runoff for the Trinity River at Lewiston. This 60-year period is the longest period practicable for use in study ing long-term runoff trends for the region. The trends depicted are similar to those shown by the precipitation graph (A) for Eureka, Calif. The driest single year of record was 1924, when runoff was generally about 20 percent of the 60-year mean. The driest decade of record was the period 1928-37 when runoff was about 62 percent of the long-term mean. Two of the wettest years of record were 1956 and 1958 when runoff was generally slightly more than twice the 60-year mean.
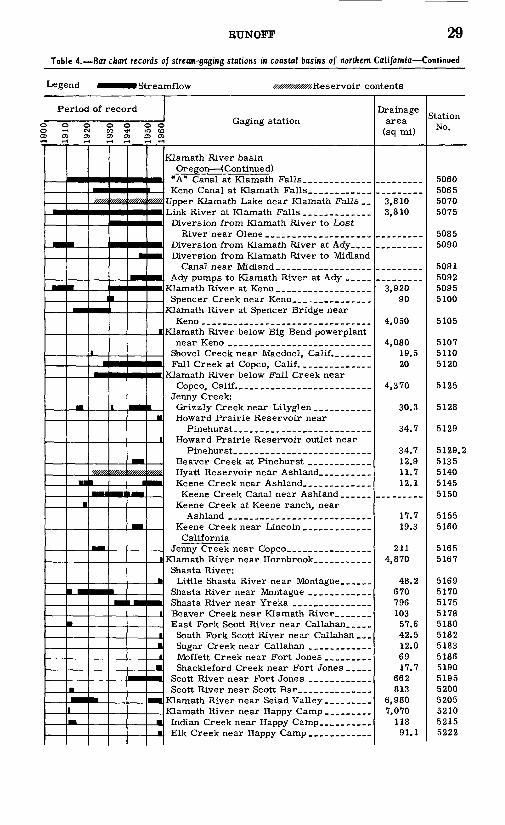
Plate 4 is a location map showing the 150 stream-gaging stations in the region for which runoff data have been compiled. The stations are numbered in downstream order in accordance with the permanent numbering system adopted by the Geological Survey in 1958. The scale of plate 4 is too small for an adequate depiction of the Bureau of Reclamation Klamath Project, and figure 3 is therefore provided as a supplement. Table 4 lists the 150 gaging stations, together with their drainage areas and identifying numbers on plate 4, and also presents a bar chart showing the period of record at each station.

RUNOFF 27
Table 4. Bar chart records of stream-gaging stations in coastal basins of northern California
Legend: Stream flow Reservoir contents
Period of record= o o oooo waging siauoii 3 IH PQ oo -<j< m to5 O3 O3 O3 O3 O3 O3
___
mat
_
^^
i
'Wff%
_
1
_M
?M
1_
IH
II
_ m
1 1
i
Bi
_ tm.
1
1
H
Eel River basin, CaliforniaLake Pillsbury near Potter Valley________
Valley __ _. ___ __ _______ __ __Potter Valley powerhouse tailrace near
Potter Valley __________________Eel River at Van Arsdale Dam, near Potter
Valley _______ ________________Eel River at Hear st____ _________________
Eel River above Dos Rios _______________Middle Fork Eel River:
Middle Fork Eel River below Black Butte
Mill Creek:
North Fork Eel River near Mina _______Eel River at Alderpoint _________________
South Fork Eel River near Branscomb___
South Fork Eel River near Miranda. _____
Van Duzen River near Dinsmores _______South Fork Van Duzen River near
Van Duzen River at Bridgeville ______ __
Yager Creek near Carlotta ___ _ _______
Elk River basin, CaliforniaElk River near Falk _ ___ _ __ _ __ _ _ _Jacoby Creek basin, California
Mad River basin, California
North Fork Mad River near Korbel ______
Little River basin, CaliforniaLittle River at Crannell. _ _ __ _ __ _____Redwood Creek basin, California
Lost River basin (closed basin adjacent toKLamath River basin) California
Oregon Miller Creek at Gerber Reservoir, near
Lor ella_ _______ _ ___________________
Drainage area
(sq mi)
288
290
347 465 159 703
162
367 405
15.4 97.1
1,481 251
2,079 43.9 50.4
468 537
3,113 80.2
36.2 200 214 127 134
44.2
6.07
144 40.5
485
44.3
67.5 82.8
278
550
220
Station No.
4700
4705
4710
4715 4720 4722 4725
4729
4730 4735
4736 4737 4740 4745 4750 4755 4757 4760 4765 4770 4775
4777 4780 4785 4790 4795
4797
4800
4805 4808 4810
4812
4815 4820 4825
4830
4835
710-057 O 64 3

28 SURFACE-WATER HYDROLOGY, NORTHERN CALIFORNIA
Table 4. Bar chart records of stream-gaging stations in coastal basins of northern California Continued
Legend » »» Stream-low ^KCM. Reservoir contents
Period of record3000000 waging aiduioii 3 T-I c<i co ^F m to3 O) O) O) O) 03 O3
__ 1
1
f
TOHI
1
nil
JIIUU_
,
IB
__ffll M
i.
IIM
__
__ H JUi
!
HimIBM
L_Umm
m
__
__
i
i
II _
n
H
H
miiL
_ __
lUUL II
_ _ tmm
L«gggg!
__
mm.
UI
H
H
_ .
f*W
Lost River basin Oregon (Continued)
Lost River at Wilson Bridge, near Olene _
Lower KLamath Lake basin (closed basinadjacent to KLamath River basin) California
Antelope Creek near Tennant____________
KLamath River basinOregon
Williamson River near Silver Lake _______
Scott Creek near Fort KLamath _ _ _ ____
Williamson River above Spring Creek, near KLamath Agency __ ___________________
South Fork Sprague River: Ely Canal near Bly_ _ _ _ __ _____ __ _
South Fork Sprague River near Ely ______North Fork Sprague River: Sprague River Irrigation Co.'s canal
North Fork Sprague River near Bly_____
Sycan River at Sycan Marsh, near Silver Lake ______________________________
Williamson River below Sprague River, near Chiloquin_ _______________________
Wood River:
Wood River at Fort KLamath _ _ _ _ ___ _ _
Fourmile Creek near Odessa____ _ ______
Drainage area
(sq mi)
270 1,410 1,590
1,620 1,670 1,680
18.8 30
178
220 23.7 35 10
1,290
1,330 1,400
110
45 40
513 100
220 40
540 51
1,270 1,580
1,600
3,000
40 90 10.6
10.6
Station No.
4840 4845 4850 4855 4860 4865 4870 4875 4880
4895 4900 4905
4910 4915 4920 4925 4930 4935
4940 4945
4950 4955
4960 4965 4970 4975 4980
4981 4985 4990 4995 5000 5010 5015 5020
5025
5035 5040 5045 5050 5055
RUNOFF 29
Table 4. Bar chart records of stream-gaging stations in coastal basins of northern California Continued
Legend iStreamflow contents
Period of record
> 0 0 0 0 0 C> i-t N m ^ m tc0 CO CO CO CO CO Cf
_-
_
_
_
-mm
_ m
n
_
m.mm
mm mm,
^
-i
mm
i
mmi _jmt
mm
_
m.
1 __
'mm
mu
_-
zm»,
p
'm0fli.
___ 1
umi
imt
mm
ww
==
i _H
88888K
,
mm i
,ii
Bmm
mm.
B
Gaging station
Klamath River basin Oregon (Continued)
Upper Klamath Lake near Klamath Falls __
Diversion from Klamath River to Lost River near Olene ___________ _ _______
Diversion from Klamath River to Midland Canal near Midland __________________
Klamath River at Keno__ _ _ _ _ ____ _ ___
Klamath River at Spencer Bridge near Keno ________________________________
Klamath River below Big Bend powerplant near Keno ___________________________
Shovel Creek near Macdoel, Calif.__ _ _ _
Klamath River below Fall Creek near Copco, Calif.. __ ________ __ __________
Jenny Creek: Grizzly Creek near Lilyglen ___________Howard Prairie Reservoir near
Pinehurst______ ____________________Howard Prairie Reservoir outlet near
Pinehurst_____ _ ___ _ ___ _ _ _ _ _ ___
Keene Creek Canal near Ashland __ ___Keene Creek at Keene ranch, near
California
Shasta River:
Shasta River near Yreka _ __ __ _ _ _ __
South Fork Scott River near Callahan___
Klamath River near Seiad Valley _________
Drainage area
(sq mi)
3,810 3,810
3,920 90
4,050
4,080 19.5 20
4,370
30.3
34.7
34.7 12.9 11.7 12.1
17.7 19.3
211 4,870
48.2 670 796 103 57.6 42.5 12.0 69 17.7
662 813
6,980 7,070
118 91.1
Station No.
5060 5065 5070 5075
5085 5090
5091 5092 5095 5100
5105
5107 5110 5120
5125
5128
5129
5129.2 5135 5140 5145 5150
5155 5160
5165 5167
5169 5170 5175 5178 5180 5182 5183 5186 5190 5195 5200 5205 5210 5215 5222

30 SURFACE-WATER HYDROLOGY, NORTHERN CALIFORNIA
Table 4. Bar chart records of stream-gaging stations in coastal basins of northern California Continued
Legend Streamflow ^gg^g^Reservoir contents
Period of recordDO O O O O CD TH N co Tf m c3) O) O) O) O) O3 C
____
1
H
1
1
H
__
Ul_
M_
_
__
__
__
ri
i
qi
i1
1 __ 1
_M
H
1
|
Gaging station 53 H
Klamath River basin California (Continued)
South Fork Salmon River near Forks of Salmon ___ _ _ _____________________
North Fork Salmon River near Forks of Salmon _____ _ ____________________
Trinity River above Coffee Creek near Trinity Center _ _ _ ___ __ _ _ _ __
Coffee Creek near Trinity Center _ _ __
East Fork Trinity River near Trinity Center... _ _ ____ _ _ _ _ ___ _ _ _ __
Trinity River at Lewiston _____________
North Fork Trinity River at Helena____ Trinity River near Burnt Ranch ________
South Fork Trinity River near
South Fork Trinity River near Salyer _ _
Klamath River near Klamath. __ _________Smith River basin, CaliforniaMiddle Fork Smith River at Gasquet_____ North Fork Smith River near Crescent
City____ ____ _______________ __South Fork Smith River near Crescent
City _______________________________
Drainage area
(sq mi)
252
205 746
8,480 56.1 74.6
149 102 107 300
34.8
109 726 49 71.6
1,017 151
1,438 180
1,733
342 87.2
379 899
2,846 12,100
130
158
295 613 33.6
Station No.
5223
5224 5225 5230 5230.3 5230.5
5232 5235 5237 5240 5245
5250 5255 5258 5259 5260 5265 5270 5275 5280
5282 5284 5285 5290 5300 5305
5310
5315
5320 5325 5327
The records of streamflow observed at many gaging stations in the Klamath River basin and adjacent closed basins (areas 7-9) are impaired to varying degrees by diversion for irrigation within the gaged subbasins. In these subbasins the diversions are numerous and many are unmeasured, and an undetermined amount of return flow finds its way back to the original stream. To adjust observed flow to natural flow, it is necessary to add the consumptive use of applied irrigation water to the observed runoff. Table 5 lists the estimated

RUNOFF 31
values of average annual consumptive use of applied irrigation water, based on a recent study (California Dept. Water Resources, 1960, table 30). The tabulation is restricted to those hydrologic units in which irrigation is practiced to an appreciable degree, and the names and numbers of the hydrologic units listed refer to those found on plate 1 and table 1. The values of consumptive use appear to be low in relation to the total acreage under cultivation, but an appreciable portion of the total acreage receives subirrigation from natural sources. The consumptive use of subirrigation water is not included in table 5, because the subirrigated lands are considered to have a naturally high water-table condition, and therefore a high evapotranspiration loss in their natural state.
TABLE 5. Average annual consumptive use of applied irrigation water, 1957
No.(Pl.l)
7A7B7C9A9B9C9D909J
Name of hydrologic unit
Average annualconsumptiveuse of applied
irrigationwater (acre-ft)
4,0001,400
1250,00010, 00015, 00041,00013, 00048, 00023,000
i Includes large quantities of water imported from Klamath Eiver for U.S. Bur. Eeclamation Klamath Project.
Table 1 gives estimated figures of mean annual runoff (natural flow) for the 60-year period 1900-59, for the various hydrologic units shown. Included in the annual runoff are the estimates of consumptive use of applied irrigation water listed in table 5, with an adjustment made for the change in irrigated acreage during the base period. For all Eel River hydrologic units downstream from Van Arsdale Dam (area 1A), runoff has been adjusted for evaporation and change in reservoir contents of Lake Pillsbury, and for diversion into the Russian River basin through the Potter Valley powerhouse. However, net evaporation losses from Upper Klamath Lake (area 9D), averaging about 150,000 acre-feet annually, have been omitted from the Klamath River estimates. This omission has been made because Upper Klamath Lake, although controlled for power and irrigation operations, has a water-surface area that is closely represent ative of natural conditions that existed in the past, and there is little likelihood that these conditions will be changed in the future. Evaporation and percolation losses from Clear Lake and Gerber Reservoir, as computed by the Bureau of Reclamation, are included

32 SURFACE-WATER HYDROLOGY, NORTHERN CALIFORNIA
in the estimates for the Lost River area (area 5A); in many years the losses from Clear Lake exceed the natural flow. Releases into the Klamath River from the closed basins of Lost River and Lower Kla- math Lake are not included in the tabulation for the Klamath River.
The long-term runoff figures of table 1 have been obtained by correlating records for nearby gaging stations, some of which have been in existence only a few years. Estimates, however carefully made, that are based on short periods of observation are subject to consid erable error, but their inclusion is justified by the fact that these records are needed now for use in preliminary project planning.
AVERAGE ANNUAL WATER LOSS AND EVAPORATION FROM WATERSURFACES
As used in this report, the average annual water loss of a drainage basin is the difference between the 60-year mean annual precipitation over the basin and the 60-year mean annual runoff. The use of long- term average figures in this computation reduces the effect of changes in surface or underground storage to insignificance in the final result. Computed average annual water loss for the various hydrologic units under consideration is listed in table 1. Because basinwide precip itation totals for the region are more properly considered index figures, rather than absolute values, the computed annual water loss figures fall in the same category and should be considered as indexes of annual water loss or evapotranspiration.
Variations in average annual water loss between basins are caused by variations in the factors that influence evapotranspiration, namely: (1) temperature and other climatic elements, (2) precipitation, (3) soil, (4) vegetal cover, (5) topography, and (6) geologic structure. The climatic factors temperature, humidity, windspeed, and solar radiation fix the upper limit of loss or the potential evapotranspira tion. Potential evapotranspiration cannot be attained, however, unless the area affords the opportunity for evaporation. Evaporation opportunity is related, therefore, to the available moisture supply and is influenced largely by the volume and distribution of precipitation; it is influenced to a lesser degree by the last four factors listed above.
An index of potential evapotranspiration is the evaporation from the surface of bodies of water such as lakes and reservoirs. A recent study by the U.S. Weather Bureau (Kohler and others, 1959, pi. 2) has produced a generalized map of average annual lake evaporation in the United States, and a part of this map has been reproduced in figure 5. There are too few evaporation stations and first-order Weather Bureau stations in the region to permit refinement of the isopleths shown.

RUNOFF 33
EXPLANATION
Isopleth showing average annual evaporation, in inches, from water surfaces such as lakes and reservoirs
>^^Computed average annual water
loss, in inches
Base from U S. Geological Survey map of United States, 1938
FIGURE 5. Average annual water loss and evaporation from water surfaces.
Figure 5 indicates that evaporation increases with distance inland from the humid and often foggy coast. As a matter of interest, aver age annual water loss is also shown on figure 5 in the circled figures. Because figure 5 gives no clue to the evaporation opportunity, it should be supplemented by the isohyetal map (pi. 2). For example, the upper Klamath River basin has the greatest lake evaporation (potential evapotranspiration) but the lowest water loss, because precipitation is least in this area.

34 SURFACE-WATER HYDROLOGY, NORTHERN CALIFORNIA
Variations in average annual water loss between basins are to be expected in view of the variability of the factors that influence this element, but some of the indicated variation undoubtedly results from discrepancies in the figures of water loss computed for this report. These discrepancies reflect the vagaries inherent in the determination of basinwide precipitation.
FLOW DURATION AND REGIMEN OF FLOW
The basic factors that affect the distribution of streamflow with respect to time are topography, tributary pattern, geologic structure, soil, vegetation, and meteorological conditions. The flow-duration curve is the simplest means of expressing the distribution of discharge, showing, as it does, the percent of time for a given period that any specified discharge is equaled or exceeded. It thus provides a useful device for analyzing the availability and variability of streamflow.
Flow-duration curves of daily natural discharge have been prepared for 25 gaging stations in the region that have five or more complete years of record of daily discharge virtually unaffected by regulation or diversion. The information given by these curves is summarized in table 6, where discharge equaled or exceeded during specified per centages of time is tabulated in both cubic feet per second and cubic feet per second per square mile. All discharges have been placed on a common basis for comparison by being adjusted to the base period 1912-59. Because of the lack of long-term gaging records, this is the longest base period feasible for use in this analysis. Correlation pro cedures were used to extend the shorter records. The number of significant figures used in the discharge columns of table 6 are not intended to imply great precision; they are included to enable the user of the table to conveniently reconstruct smooth flow-duration curves from the tabulated values.
Only one gaging station in the region meeting the criterion of 5 or more years of record of daily discharge unaffected by storage and diversion was omitted from the study. Station 4990, Sycan River near Beatty, Oreg., not only correlated poorly with the base station on Sprague River near Chiloquin, Oreg. (sta. 5010), but had only 4 complete years of concurrent record for use in the correlation. Dura tion curves for three selected stations, illustrating the different regi mens of flow in the three physiographic sections in northern California,

RUNOFF 35
have been plotted on logarithmic normal probability paper on figure 6. Streamflow is shown as a ratio to mean annual discharge to facilitate comparison of the runoff characteristics indicated by the curves.
an
60504030
20
10
654 3
2
1 0.8
0.6 0.5 0.4 0.3
0.2
0.1 0.080.06 0.05 0.04
0.03
0.02
0.01 0.008
0.006 0.005 0.004
0.003
0.002
n nm
4
>
_^_
\^s.
^"x
*^
>y ^ ^
^^
SI** V
9 V V
%J^**nV
.
Eel R ver at Scotia, California (California Coast Ranges)
Tr n\ty River at Lew ston, Ca ifornia (Klamath Mountains)
xxx Fall Creek at Copco, California (Southern Cascade Mountains)
X >
\
1
< X.
\\
pIP
X )
\
4
X X
\>y
* «
x x
s^>
x x x J
>w^v
xxxx
^v^
k »
* ,
TIME, IN PERCENT OF TOTAL PERIOD
FIGURE 6. Flow-duration curves for selected gaging stations for period 1912-59.

36 SURFACE-WATER HYDROLOGY, NORTHERN CALIFORNIA
8
<-,5»
-i
3 aoTS
^£S5isr
rM'
i
la 83 S1
(COCO <H<
cj i-< o!c HO* <Se
O>O001N rH
S fe* O<H
<H fq » *
<HCO>OOO SJSS^B **' oooo "o o o *H co c
*°ii §5
-O1N>O N<H<Ht^ COI5 *H f-4 rH CN CO W5 CO 00 C9OOO OOOO <H<
H <NCO>O
-OQO O< 5«*t- t;t
rH'N"-* OOtC<
>^iF-. <H>o<H>a COIN9<H<H CO>OOt-- to OO to IN
oo>oot^rHMt-i >Ot^«
<H <H<H IN COt
-CO 00
>oS SSc 5«oeo oorHeo
;SrH COtO>O"
',-! «' >o ai to
§ SSS S9SSS o o o oooo -*t-- OOOOO

Gag
ing
stat
ion.
.
Peri
od o
f rec
ord-
Dra
inag
e ar
ea .
.
Tim
e (p
erce
nt)
99.9
---
OQ
ft
OQ 98-
Oft 90-
8
0-
7
0
60
_
50-
40
-.
30
on 10-
5- __
- _
-
2..
..
-.
1 _ 0.5
.
0.1
. _
Mad
Riv
er b
asin
Mad
Riv
er n
ear
Fore
st G
len,
C
alif
. (4
805)
1954
-59
144
sq m
i
Mad
Riv
er n
ear
Arc
ata,
Cal
if.
(481
0)
1911
-13,
195
1-59
485
sq m
i
Red
woo
d C
reek
bas
in
Red
woo
d C
reek
ne
ar B
lue
Lak
e,
Cal
if.
(481
5)
1954
-58
67.5
sq
mi
Red
woo
d C
reek
at
Ori
ck,
Cal
if.
(482
5)
1912
-13,
195
4-59
278
sq m
i
Low
er K
lam
ath
Lak
e ba
sin
Ant
elop
e C
reek
ne
ar T
enna
nt,
Cal
if.
(489
5)
1953
-59
18.8
sq
mi
Kla
mat
h R
iver
bas
in
Spra
gue
Riv
er
near
Chi
loqu
in,
Ore
g.
(501
0)
1922
-59
1,58
0 sq
mi
Fal
l C
reek
at
Cop
co.
Cal
if.
(512
0)
1929
-59
20 s
q m
i
Scot
t R
iver
ne
ar F
ort
Jone
s, C
alif
. (5
195)
1942
-59
662
sqm
i
Salm
on R
iver
at
Som
esba
r,
Cal
if.
(522
5)
1928
-59
746
sq m
i
Dis
char
ge t
hat
is e
qual
ed o
r ex
ceed
ed d
urin
g pe
rcen
t of t
ime
indi
cate
d, a
djus
ted
to b
ase
peri
od 1
912-
59
cfs 0.
15
.27
.37
.52
.89
1.45
2.
95
6.2
17
50
115
212
405
810
1,38
0 2,
450
3,40
0 4,
600
8,00
0
cfs
per
sqm
i
0.00
1 .0
02
.003
.0
04
.006
.0
10
.020
.0
43
.118
.3
47
.799
1.
47
2.81
5.
62
9.58
17
.0
23.6
31
.9
55.6
cfs 9.
4 11
.5
13.0
15 19
25
38
61 12
5 31
0 64
0 1,
100
1,90
0 3,
600
5,90
0 9,
300
12,5
00
16,0
00
24,0
00
cfs
per
sqm
i
0.01
9 .0
24
.027
.0
31
.039
.0
52
.078
. .1
26
.268
.6
39
1.32
2.
27
3.92
7.
42
12.2
19
.2
25.8
33
.0
49.5
cfs 2.
5 3.
3 3.
8 4.
5
5.8
7.4
11.0
17 32 70
12
7 20
5
325
580
930
1,50
0
2,05
0 2,
700
4,40
0
cfs
per
sq m
i
0.03
7 .0
49
.056
.0
67
.086
.1
10
.163
.2
52
.474
1.
04
1.88
3.
04
4.81
8.
59
13.8
22
.2
30.4
40
.0
65.2
cfs 4.
2 6.
7 8.
5 11
.0
16.5
24
.0
41
70 130
270
485
760
1,25
0 2,
300
3,70
0 6,
100
8,40
0 11
,200
18
,500
cfs
per
sqm
i
0.01
5 .0
24
.031
.0
40
.059
.0
86
.147
.2
52
.468
.9
71
1.74
2.
73
4.50
8.
27
13.3
21
.9
30.2
40
.3
66.5
cfs 2.5
3.7
4.5
5.4
7.3
9.4
12.5
15
.5
18.0
21
.0
25.5
32
.0
43
66
93
130
163
200
295
cfs
per
sqm
i
0.13
3 .1
97
.239
.2
87
.388
.5
00
.665
.8
24
.957
1.
12
1.36
1.
70
2.29
3.
51
4.95
6.
91
8.67
10
.6
15.7
cfs 89
11
6 13
0 14
7
172
197
230
257
289
328
385
480
690
1,18
0 1,
730
2,67
0
3,50
0 4,
300
5,40
0
cfs
per
sqm
i
0.05
6 .0
73
.082
.0
93
.109
.1
25
.146
.1
63
.183
.2
08
.244
.3
04
.437
.747
1.
09
1.69
2.22
2.
72
3.42
cfs
22.0
23
.5
24.5
25
.5
27.0
28
.5
30.5
32
.5
34.0
35
.5
37.5
41
.0
45
53
61 77 92
111
160
cfs
per
sq m
i
1.10
1.
18
1.22
1.
28
1.35
1.
42
1.52
1.
62
1.70
1.
78
1.88
2.
05
2.25
2.
65
3.05
3.
85
4.60
5.
55
8.00
cfs 8.
0 14
18
24 35 49
74
10
7
160
261
447
685
995
1,46
0 2,
020
2,94
0
3,82
0 4,
850
8,20
0
cfs
per
sqm
i
0.01
2 .0
21
.027
.0
36
.053
.0
74
.112
.1
62
.242
.3
94
.675
1.
03
1.50
2.
21
3.05
4.
44
5.77
7.
33
12.4
cfs 56
72
83
99 12
9 16
9 24
2 35
0
520
870
1,35
0 1,
970
2,75
0 3,
850
5,20
0 7,
300
9,40
0 12
,000
20
,200
cfs
per
sq m
i
0.07
5 .0
97
.111
.1
33
.173
.2
27
.324
.4
69
.697
1.
17
1.81
2.
64
3.69
5.
16
6.97
9.
79
12. f
f 16
.1
27.1
03

TAB
LE
6. F
low
-dur
atio
n su
mm
ary
for
sele
cted
str
eam
-gag
ing
stat
ions
C
onti
nued
CO
Per
iod
of r
ecor
d. _
Tim
e (p
erce
nt)
99.9
_9
9.5
. _
__
_..
99.. _
_ _
98.-
,- _
__
95..
90
..8
0..
_ _
70. _
__ . _
60 50-.
- __
-
40
..
30... _
.....
20,-
10.-
5 2..... _
_ . _ .
....
1..
. _ ..
_ .....
.0
.5..
0.1
.. _
__ ..
. __
_ ...
Kla
mat
h R
iver
bas
in
Tri
nit
y R
iver
at
Lew
isto
n,
Cal
if.
(525
5)
1912
-59
726
sq m
i
Tri
nit
y R
iver
ne
ar D
ougl
as
Cit
y, C
alif
. (5
260)
1945
-51
1,01
7 sq
mi
Tri
nit
y R
iver
ne
ar B
urn
t R
anch
, C
alif
. (5
270)
1932
-39,
195
7-59
1,43
8 sq
mi
Hay
fork
Cre
ek
near
Hya
mpo
m,
Cal
if.
(528
5)
1954
-59
379
sq m
i
Sou
th F
ork
Tri
nit
y
Riv
er n
ear
Sal
yer,
Cal
if.
(529
0)
1912
-13,
195
1-59
899
sq m
i
Tri
nit
y R
iver
n
ear
Hoo
pa,
Cal
if.
(530
0)
1912
-13,
191
7-18
, 19
32-5
9
2,84
6 sq
mi
Sm
ith
Riv
er b
asin
Sou
th F
ork
Sm
ith
Riv
er n
ear
Cre
scen
t C
ity,
C
alif
. (5
320)
1912
-13,
195
5-59
295
sq m
i
52S
mit
h R
iver
d
near
Cre
scen
t W
C
ity,
Cal
if.
^
(532
5)
> M
1932
-59
^
613
sq m
iW
Dis
char
ge t
hat
is
equa
led
or e
xcee
ded
duri
ng p
erce
nt o
f ti
me
indi
cate
d, a
dju
sted
to
base
per
iod
1912
-59
!j
cfs 32 47
57
71 97
13
2 19
5 28
5
425
730
1,22
0 1,
900
2,78
0 4,
150
5,75
0 8,
300
10,5
00
13,1
00
20,2
00
cfs
per
sq m
i
0.04
4 .0
65
.079
.0
98
.134
.1
82
.269
.3
93
.585
1.
01
1.68
2.
62
3.83
5.
72
7.92
11
.4
14.5
18
.0
27.8
cfs 37 54
66
81 11
4 15
5 22
5 30
5
445
790
1,42
0 2,
180
3,05
0 4,
850
7,00
0 10
,300
13,4
00
16,5
00
25,0
00
cfs
per
sq m
i
0.03
6 .0
53
.065
.0
80
.112
.1
52
.221
.3
00
.438
.7
77
1.40
2.
14
3.00
4.
77
6.88
10
.1
13.2
16
.2
24.6
cfs 50
70
85
10
6
152
212
335
510
780
1,32
0 2,
250
3,35
0
4,70
0 6,
900
9,40
0 13
,500
17,2
00
21, 3
00
32,5
00
cfs
per
sqm
i
0.03
5 .0
49
.059
.0
74
.106
.1
47
.233
.3
55
.542
.9
18
1.56
2.
33
3.27
4.
80
6.54
9.
39
12.0
14
.8
22.6
cfs 5.
7 8.
5 10
.7
13.5
19.3
27
.0
40 58 80
120
205
345
610
1,23
0 2,
060
3,50
0
4,70
0 6,
000
9,30
0
cfs
per
sqm
i
0.01
5 .0
22
.028
.0
36
.051
.0
71
.106
.1
53
.211
.3
17
.541
.9
10
1.61
3.
25
5.44
9.
23
12.4
15
.8
24.5
cfs 19
.0
27.5
33
.5
41.0
57
79
117
170
254
440
790
1,29
0
2,15
0 4,
150
6,80
0 11
,000
14,5
00
18, 1
00
27,0
00
cfs
per
sq m
i
0.02
1 .0
31
.037
.0
46
.063
.0
88
.130
.1
89
.283
.4
89
.879
1.
43
2.39
4.
62
7.56
12
.2
16.1
20
.1
30.0
cfs 98
14
3 17
4 21
9
305
415
620
910
1,40
0 2,
450
4,25
0 6,
600
9,60
0 14
,500
20
,500
30
,500
39,0
00
48,5
00
76,0
00
cfs
per
sq m
i
0.03
4 .0
50
.061
.0
77
.107
.1
46
.218
.3
20
.492
.8
61
1.49
2.
32
3.37
5.
09
7.20
10
.7
13.7
17
.0
26.7
cfs 66
71
76
83 99
12
3 17
5 25
2
410
720
1,10
0 1,
600
2,25
0 3,
650
5,70
0 9,
300
13,3
00
18,2
00
32,5
00
cfs
per
sqm
i
0.22
4 .2
41
.258
.2
81
.336
.4
17
.593
.8
54
1.39
2.
44
3.73
5.
42
7.63
12
.4
19.3
31
.5
45.1
61
.7
110
cfs 14
5 16
0 17
0 18
5
215
260
350
500
790
1,37
0 2,
150
3,35
0
5,00
0 8,
000
12,5
00
20,8
00
29,5
00
39,5
00
66,0
00
ir<J
cfs
per
2
sqm
i Q
0. 2
37
^
.261
,.
.277
g
.302
0
?3
.351
3
424
PH
.571
M
.8
16
g
1.29
2.
23
O
3.51
>
5.
46
£
8.16
O
13
.1
pa
20.4
a
33.9
H
48.1
64
.4
108
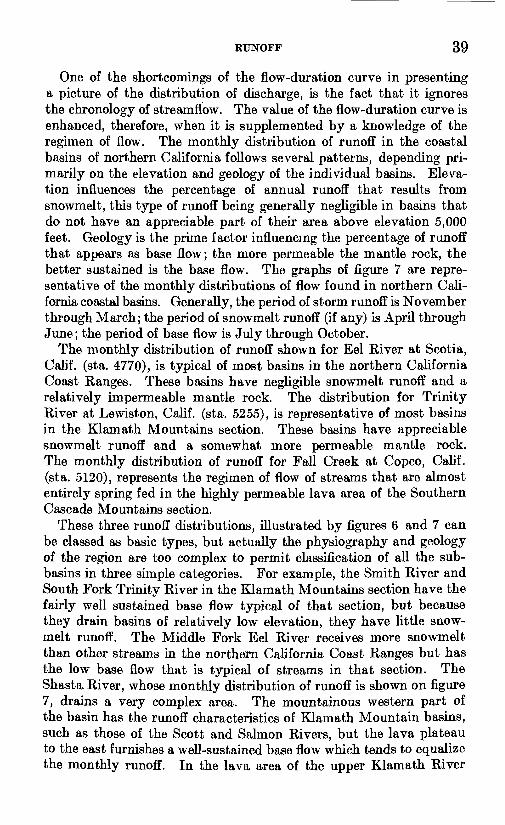
RUNOFF 39
One of the shortcomings of the flow-duration curve in presenting a picture of the distribution of discharge, is the fact that it ignores the chronology of streamflow. The value of the flow-duration curve is enhanced, therefore, when it is supplemented by a knowledge of the regimen of flow. The monthly distribution of runoff in the coastal basins of northern California follows several patterns, depending pri marily on the elevation and geology of the individual basins. Eleva tion influences the percentage of annual runoff that results from snowmelt, this type of runoff being generally negligible in basins that do not have an appreciable part of their area above elevation 5,000 feet. Geology is the prime factor influencing the percentage of runoff that appears as base flow; the more permeable the mantle rock, the better sustained is the base flow. The graphs of figure 7 are repre sentative of the monthly distributions of flow found in northern Cali fornia coastal basins. Generally, the period of storm runoff is November through March; the period of snowmelt runoff (if any) is April through June; the period of base flow is July through October.
The monthly distribution of runoff shown for Eel River at Scotia, Calif, (sta. 4770), is typical of most basins in the northern California Coast Ranges. These basins have negligible snowmelt runoff and a relatively impermeable mantle rock. The distribution for Trinity River at Lewiston, Calif, (sta. 5255), is representative of most basins in the Klamath Mountains section. These basins have appreciable snowmelt runoff and a somewhat more permeable mantle rock. The monthly distribution of runoff for Fall Creek at Copco, Calif. (sta. 5120), represents the regimen of flow of streams that are almost entirely spring fed in the highly permeable lava area of the Southern Cascade Mountains section.
These three runoff distributions, illustrated by figures 6 and 7 can be classed as basic types, but actually the physiography and geology of the region are too complex to permit classification of all the sub- basins in three simple categories. For example, the Smith River and South Fork Trinity River in the Klamath Mountains section have the fairly well sustained base flow typical of that section, but because they drain basins of relatively low elevation, they have little snow- melt runoff. The Middle Fork Eel River receives more snowmelt than other streams hi the northern California Coast Ranges but has the low base flow that is typical of streams in that section. The Shasta, River, whose monthly distribution of runoff is shown on figure 7, drains a very complex area. The mountainous western part of the basin has the runoff characteristics of Klamath Mountain basins, such as those of the Scott and Salmon Rivers, but the lava plateau to the east furnishes a well-sustained base flow which tends to equalize the monthly runoff. In the lava area of the upper Klamath River

40 SURFACE-WATER HYDROLOGY, NORTHERN CALIFORNIA
^ c*J T C-1 ,-
[?!-: ;i: : '
U^
H in c
J i^'jf [?im'ff 8!sa -:;.;: '':':;:'f^' +'-^ ^
ii,5 ;>:;. +S%<i K; m
l :-v. ": : :: - : ::: : - : :: 'v::: ': : :' :: :-.:': : ; :-:::-.-::;:-;:
r-?- -*: ::-!-^ : :: ::: ::v- :: :: ..::> '^'^^^^'^'^: ' :"'.::: :"-'::v i^:.-::^:: 1 :^::::'-^:-:';:"-!:':: 1 ::;'^':;' 1!:::1 :::--:;>.:: f:."": v :-:r: :;:> !i:;i :: :^i:; i;;i>: " ; : :: i- : > :;:::.':-;:'- ': :;> :: : X 'y": ;: :^:i
r»":^-j:^:^S : : ::::i ^ ;:.:: ' ::^!: '^ v :""::i:. '^"'v!:'::":^
' ' ;: ^"'t? 5; f 5-i |JS ; 1. jjjK. ; :|.;.;'! |:f
ili»lLsU?;::^;!?i
3 <
T.d3S ^[9 nv ^K-Ainr o:S
AVW UJ g
uwui CC < -avl UJ 1- 03J > C/)
u:
7/\ON {/) f('100 < °
L
p:?"1 ?: :: -: '-" :'':!- /:": ^;: >: !"-:':": I-: != '-: 1 -; K
llll':;i:;1ll|s;:il::;;^ii:::l;:l
Idas o ^ r9nv ^ g Mnr 0 S3NHf U z AVW £ O[adv Havw u Hr83J ^ 52 rNVf O u: "030 _| ^ ~AON ^ 0100 "-
Imst»-Kx"sffytff-KKK!"'-'*
fi.:S?;s:i;:8i:?i:'V5
Fmmnmrn mmma
t£-ti :£?t'S?--&£: :;':oro: : - ::;:;,;.::.:<:-: -:::;:;:;::-
;-:;:': -:' :':> ;i ' ^!:^S ':: :
MikJ|g:
pji!i!: f:tl!i;H
iillllS:?ilSs|; :i;lfP
z'ld3S 1- ^l>nv ^S Ainr f S3Nnr -i zAVW 1- o lldV < P
avw £^ laaj > 52
^30 >- <^ON - Oloo ?
t -.; ::-: ;. :-iy s; ; ;s;.«
iri'::: - : :;- :"- - '.-: : : =: : " \-
i: 5: ;:: ". :>v ':-: : "i ' : :-:;.; : , : . . : ;.:_ -. ;.-; ,
'i
pr?-|?
: : ' : - : : : : : -- :":: ^ : ;'-" i.-^:'^ - :...,:.." :.;:.:.;:;' ;.-; -.:; ;:::..-
1 . i: ::,i ;i;:::v-i :;>>L>';:
': : .i-i : -. .i : .i:: ;.- i:.!- : ^:W^
1
-id3S <^ 9flV ^ 0~Ainr o £3Nnr JJ*
c/) -^-AVW HO «dv 5 p avw Q. <rB3J w 5; LNvr E uT030 _,
V^ON ilj <[100 w °
nvioi do

RUNOFF 41
basin and adjacent closed basins, the permeability of the mantle rock varies, and consequently snowmelt may or may not cause relatively high volumes of runoff during the spring. Where marsh areas are extensive, as in the Sycan River basin, large evapotranspira- tion losses may greatly reduce base flow.
Examination of the duration curves for the region elicits some in teresting information regarding their characteristics. Key points on the curves are Qlo, Q5Q , Qw, Qmem, and Pmean> where
Qio is the discharge equaled or exceeded 10 percent of the time during the period 1912-59.
Q50 is the median discharge for the period 1912-59.Qoo is the discharge equaled or exceeded 90 percent of the
time during the period 1912-59.Qmem ^s the mean discharge for the period 1912-59 (this dis
charge is about 8 percent smaller than that for the long- term base period, 1900-59).
^mean is the percent of time, in the 1912-59 period, duringwhich Qmean was equaled or exceeded.
These discharges, expressed in cubic feet per second per square mile, are listed in table 7 for the 25 gaging stations of table 6.
Simple index figures were desired to indicate, for each station, (1) the variability of discharge and (2) the regimen of flow. For an index of variability, the ratio of Qw to Qoo was chosen, because the duration curves exhibit a linear trend between durations of 10 and 90 percent, when plotted on logarithmic normal probability paper. For an index of storm runoff the average percentage of total annual runoff occurring during the five months November through March was used. The average percentage of total annual runoff occurring during the three months April through June provides an index of snowmelt runoff. These various indexes are listed in table 7. The indexes of storm and snowmelt runoff are not precisely comparable from station to station, in that they do not represent a common period of record at all stations; the indexes were computed from whatever length of record was available. Nevertheless, these computed indexes are satisfactory for identifying the regimen of flow at the various gaging stations. An index figure greater than 60 for storm runoff is indi cative of a basin whose runoff is predominantly from this source. An index figure greater than 30 for snowmelt runoff indicates that this type of runoff is of appreciable magnitude. Only 2 of the 25 gaging stations fail to fall clearly in one category or the other. The highly impermeable basin of Middle Fork Eel River upstream from the gage near Covelo, Calif, (sta. 4730), shows significantly high indexes in both categories, whereas the highly permeable basin of Fall Creek upstream from Copco, Calif, (sta. 5120), does not show significantly

42 SURFACE-WATER HYDROLOGY, NORTHERN CALIFORNIA
TABLE 7. Flow characteristics at selected streamrgaging stations for base. 1912-59
No. (Pi. 4)
4730
4745
4755
4765
47704775
4785
4790
4805
4810
4815
4825
4895
5010
5120 5195
5225
5255
5260
5270
5285
5290
5300
5320
6325
Stream-gaging station
Ed River Basin
Middle Fork Eel River be low Black Butte River
North Fork Eel River near Mina, Calif.
South Fork Eel River near
South Fork Eel River near Miranda, Calif .......
Eel River at Scotia, Calif- . Van Duzen River near
Van Duzen River near Bridgeville, Calif...
Yager Creek near Carlotta, Calif.
Mad River Basin
Mad River near Forest Glen, Calif .
Mad River near Arcata, Calif
Redwood Creek Basin
Redwood Creek near Blue Lake, Calif.. -
Redwood Creek at Orick, Calif
Lower Klamath Lake Basin
Antelope Creek near Ten- nant, Calif... _
Klamath River Basin (in cluding Trinity River)
Sprague River near Chilo-
Fall Creek at Copco, Calif- Scott River near Fort
Jones, Calif. . __ ___Salmon. River at Somesbar, Calif
Trinity River at.Lewiston, Calif
Trinity River near Douglas City, Calif
Trinity River near Burnt
Hayfork Creek near Hyampom, Calif ___ -
South Fork Trinity River
Trinity River near Hoopa, Calif. . ..
Smith River Basin
South Fork Smith River near Crescent City, Calif-
Smith River near Crescent City, Calif...
Drain age area (sqmi)
367
251
43.9
537 3,113
80.2
214
127
144
485
67.5
278
18.8
1,580 20
662
746
726
1,017
1,438 379
899
2,846
295
613
Pio 050 Qoo Qmean
(discharge in cfs per sq mi)
7.63
5.18
8.88
7.82 5.53
9.35
8.88
7.24
5.62
7.42
8.59
8.27
3.51
.747 2.65
2.21
5.16
5.72
4.77
4.80 3.25
4.62
5.09
12.4
13.1
0.708
.271
.661
.559
.437
.860
.771
.504
.347
.639
1.04
.971
1.12
.2081.78
.394
1.17
1.01
.777
.918
.317
.489
.861
2.44
2.23
0.029
.006
.055
.069
.031
.033
.045
.043
.010
.052
.110
.088
.500
.125 1.42
.074
.227
.182
.152
.147
.071
.088
.146
.417
.424
2.36
1.92
3.51
3.04 2.26
3.75
3.53
2.73
2.17
2.80
3.72
3.69
1.66
.354 1.95
.860
2.24
2.27
1.86
1.98 1.18
1.66
1.94
6.21
5.90
ft-(per cent)
32
23
23
22 23
24
24
24
24
26
25
24
31
26 36
34
34
33
33
34 25
27
34
26
28
Indexes
Varia bility
263
863
161
113 178
283
197
168
562
143
78
94
7
6 1.9
30
23
31
31
33 46
52
35
30
31
Storm runoff
68
86
84
8381
81
79
81
83
82
81
81
32
37 46
52
50
43
44
4978
75
57
74
73
Snow- melt
runoff
30
13
13
1418
17
20
17
16
15
16
17
51
47 25
41
43
51
50
46 19
21
38
21
22

RUNOFF 43
MEAN ANNUAL DISCHARGE, IN CUBIC FEET PER SECOND PER SQUARE MILE (Q mean )
FIGUSE 8. Relation between Qmean and Q w. Station numbers used to identify plotted points.
high indexes in either category. The sum of the two indexes for the Fall Creek station and for the other two stations in the southern Cascades province Antelope Creek near Tennant, Calif, (sta. 4895), and Sprague River near Chiloquin, Oreg. (sta. 5010) total less than 85, thereby indicating well-sustained base flow.
In analyzing the tabulated data, the first characteristic investigated was the duration time (Pmean) of mean discharge (Qmean). Pmean was found to be related to the regimen of flow and to be independent of the value of QmeKa . It is to be expected that those streams that experience snowmelt rises as well as storm peaks will have more days of discharge in excess of the mean, than will those streams that do not carry appreciable snowmelt. For those streams whose storm runoff index is greater than 60, Qmeim is equalled or exceeded about 24 percent of the time. For those streams whose snowmelt runoff index is greater than 30, Qmesa is equalled or exceeded about 34 percent of the time.
The average slope of the duration curve between Q w and <290 , or index of variability, was investigated next. Figure 8 indicates that
710-057i

44 SURFACE-WATER HYDROLOGY, NORTHERN CALIFORNIA
EXPLANATION
Eureka
Boundary of physiographic region
Basin boundary30
Index of variability
OREGON CALIFORNIA
Southern Cascade Mountains (highly permeable)
Klamath Mountains (fairly permeable)
Catifornia Coast Ranges (impermeable)
25 0 25 50 75 100 MILES
of United States. 1938
FIGURE 9. Geographical distribution of index of variability.

LOW FLOW MAGNITUDE, DURATION, AND FREQUENCY 45
Q10 is closely related to Qmea n, and, in general, is 2.5 times larger-fehan Qmean- The existence of this close relation is not surprising in view of the fact that both discharges are related to the mean annual precipi tation, the bulk of which occurs in general storms that reach all basins. Geology has little effect on the large discharges represented in Q10 and Qmea n, except in the extremely permeable basin of Fall Creek (sta. 5120). Qoo, however is influenced primarily by the geology of the basins, being higher for the more permeable mantle rock. Because Qoo varies much more widely than does Qio> the index of variability is much more closely related to Qoo than to Qw. The variation in permeability in the region has been discussed earlier in the report, and on the basis of that discussion and the tabulation of the index of variability in table 7, the map on figure 9 has been pre pared. This map depicts, in a general way, the geographical distri bution of the index of variability. The wide range of values of the index in the impermeable northern California Coast Ranges is striking.
As for the upper and lower ends of the duration curves, they show the following characteristics:1. All other things being equal, the part of the curve for discharges
less than Q90 is flattest for those basins that have the most permeable mantle rock.
2. All other things being equal, the part of the curve for discharges greater than Qio is influenced primarily by the regimen of flow, and is steepest for those basins that have little or no snowmelt runoff.
LOW FLOW MAGNITUDE, DURATION, AND FREQUENCY
A prerequisite for any study involving water supply during periods of critically low runoff is a knowledge of the magnitude, duration, and frequency of deficient flow. To fill the need for this information, low-flow frequency graphs were prepared for 25 gaging stations, showing the probable recurrence interval of low flows of various magnitudes and durations. The stations used were those included in the previously described flow-duration analysis, because these were virtually the only ones in the region with five or more complete years of record of daily discharge that is not seriously affected by regulation or diversion. The duration periods used in this analysis were 1, 7, 15, 30, 60, 90, 120, and 183 days. The inclusion of a 3-day duration period was originally planned but was rejected when it was found that lowest mean discharge each year for 3 consecutive days was almost

46 SURFACE-WATER HYDROLOGY, NORTHERN CALIFORNIA
identical with the minimum daily discharge of each year. The base period selected for the study was April 1, 1912 to March 31, 1960. This 48-year period was the longest that was practical to use, and it included the extremely dry years that occurred during the decade 1924 to 1934. Using March 31 as the closing day of each year elimi nated the possibility of a period of sustained low flow starting in one year and extending into the next.
In a step preliminary to the construction of the low-flow frequency graphs, the smallest mean discharges each year for 1 day, 7 consecutive days, 15 consecutive days, 30 consecutive days, 60 consecutive days, 90 consecutive days, 120 consecutive days, and 183 consecutive days were listed and ranked in ascending order of magnitude for the long- term stations on Eel River at Scotia, Calif, (sta. 4770), and Trinity River at Lewiston, Calif, (sta. 5255). The plotting position of each discharge was next computed by use of the formula
Recurrence interval= TT~'M
where N is the number of years of record (48 years), and M is the order number. These points were then plotted on logarithmic extreme- value probability paper and smooth curves were fitted to the points. The sets of curves for the two long-term stations are found on figures 10 and 11.
To obtain the ordinates of the points defining the low-flow frequency curves for the remaining 23 gaging stations, all of which have periods of record that are shorter than the 48-year base period, it was first necessary to extend these shorter records by correlation with the base stations at Scotia and Lewiston. It was found that minimum flows for all durations at 22 of the stations correlated well with concurrent flows at one or the other of the 2 base stations. The lone exception was the station on Sprague River near Chiloquin, Oreg. (sta. 5010). For this station low-flow frequency curves for the 48-year base period were obtained by extrapolation of the frequency curves for the 39 years of recorded flow (1921-60). The discharge figures obtained from this study are summarized in table 8; it provides the data needed for constructing long-term low-flow frequency curves for all 25 stations.

2000
60 d
ays
30 d
ays
15 d
ays
s 7
day
s 1
day
10CO
-3
" Lf
> ID
RE
CU
RR
EN
CE
IN
TER
VA
L, I
N
YE
AR
S
FIG
URE
10-
Low
-flo
w f
requ
ency
cur
ves
for
Eel
Riv
er a
t Sc
otia
, C
alif,
(st
a. 4
770)
. C
urve
bas
ed o
n re
cord
ed d
isch
arge
s du
ring
per
iod
from
Apr
il 1,
1912
, to
Mar
ch 3
1,19
60.

O o
2000
1000 800
: 600
i 500
'. 40
0
' 30
0
j 20
0
100 80 60 50 40 30 20 10
rt
c\i
oo
<*oq
CM
oo
<*
m
<£>
oo
o
RE
CU
RR
EN
CE
IN
TER
VA
L, I
N
YE
AR
S
120
days
.90
days
- 60
day
s 30 d
ays
- 15
day
s -7
da
ys
1 da
y
FIG
URE
11.
Low
-flo
w fr
eque
ncy
curv
es fo
r Tri
nity
Riv
er a
t Lew
lsto
n, C
alif,
(st
a. 5
255)
. B
ased
on
the
peri
od fr
om A
pril
1,19
12, t
o M
arch
31,1
960.
00 a
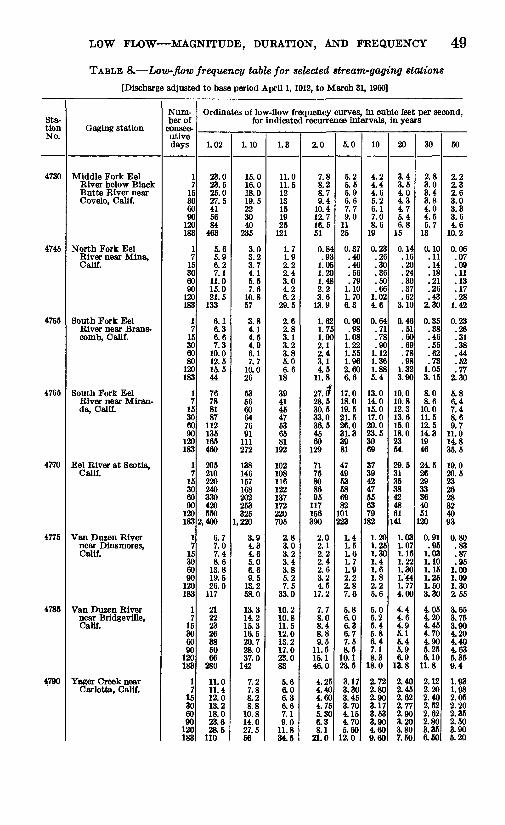
LOW FLOW MAGNITUDE, DURATION, AND FREQUENCY 49
TABLE 8. Low-flow frequency table for selected stream-gaging stations
[Discharge adjusted to base period April 1,1912, to March 31,1960]
Sta tion No.
4730
4745
4755
4765
4770
4775
4785
4790
Gaging station
Middle Fork EelRiver below BlackButte River nearCovelo, Calif.
North Fork EelRiver near Mina,Calif.
South Fork EelRiver near Brans-comb, Calif.
South Fork EelRiver near Miranda, Calif.
Eel River at Scotia,Calif.
Van Duzen Rivernear Dinsmores.Calif.
Van Duzen Rivernear Bridgeville,Calif.
Yager Creek nearCarlotta, Calif.
Num ber of
consec utive days
17
15306090
120183
17
15306090
120183
17
15306080
120183
17
15306090
120183
17
15306090
120183
17
15306090
120183
17
15306090
120183
17
15306090
120183
Ordinates of low-flow frequency curves, in cubic feet per second, for indicated recurrence intervals, in years
1.02
23.023.525.027.5415684
463
5.65.96.27.1
11.015.021.5
133
6.16.36.67.3
10.012.515.544
76788187
112135165460
205210220240330420550
2,400
6.77.07.48.6
13.819.526.0
117
21222326385066
280
11.011.412.013.218.023.628.5
110
1.10
15.016.018.019.5223040
235
3.03.23.74.15.57.6
10.857
3.84.14.54.96.17.7
10.026
535660647691
111272
138146157168202253325
1,220
3.94.34.65.06.69.5
13.258.0
13.314.215.316.520.728.037.0
142
7.27.88.28.8
10.814.027.566
1.3
11.011.51213151925
121
1.71.92.22.43.04.26.2
29.5
2.62.83.13.23.85.06.6
18
39414547536581
192
102108116122137172220705
2.83.03.23.43.85.27.5
33.0
10.210.811.512.013.217.023.083
5.66.06.36.67.19.0
11.834.5
2.0
7.88.2a?9.4
10.412.716.551
0.84.93
1.051.201.482.23.6
13.9
1.621.751.902.12.43.14.5
11.8
27.6*28.530.533.036.54560
129
7175808695
117156390
2.02.12.22.42.63.24.5
17.2
7.78.08.48.89.5
11.515.146.0
4.254.404.604.755.306.38.1
21.0
5.0
5.25.55.96.67.79.0
1125
0.37.40.46.56.79
1.101.706.3
0.90.98
1.081.221.551.962.606.6
17.018.019.521.526.031.33981
474953586982
101223
1.41.51.61.71.92.22.87.6
5.86.06.36.77.58.5
10.123.5
3.173.303.453.704.154.705.60
12.0
10
4.24.44.65.26.17.08.6
19
0.23.26.30.36.50.66
1.024.6
0.64.71.78.90
1.121.361.885.4
13.014.015.017.020.023.53069
37394247556379
182
1.20.25.30.4.6.8
2.25.6
5.05.25.45.86.47.18.3
18.0
2.722.802.903.173.533.904.609.60
20
3.43.5404.34.75.46.8
15
0.14.16.20.24.30.37.62
3.10
0.46.51.60.69.78.98
1.323.90
10.010.812.313.615.018.02354
29.5313538424861
141
1.031.071.151.221.301.441.77400
4.44.64.95.15.45.96.9
13.8
2.402.452.622.772.903.203.807.50
30
2.83.03.43.840455.7
13
0.10.11.14.18.21.26.43
2.30
0.35.38.46.55.62.73
1.053.15
ao8.6
10.011.512.51431946
245262933364051
120
0.91.95.03.10.15.25.50
3.30
4.054204454.704.905.256.10
11.8
2.122.202.402.522.622.803.356.50
50
2.22.32.63.03.33.646
10.2
0.06.07.09.11.13.17.28
1.42
0.23.26.31.38.44.52.77
2.30
5.86.47.4ae9.7
11.014835.5
19.020.5232628324093
0.80.83.87.95
1.001.091.302.55
3.653.753.904.204.404.635.359.4
1.931.982.052.202.352.503.905.20
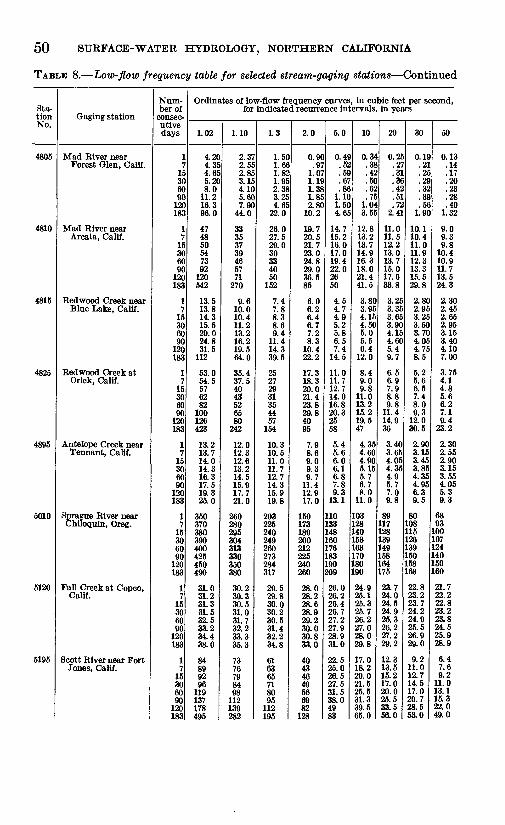
50 SURFACE-WATER HYDROLOGY, NORTHERN CALIFORNIA
TABLE 8. Low-flow frequency table for selected stream-gaging stations Continued
Sta tionNo.
4805
4810
4815
4825
4895
5010
5120
5195
Gaging station
Mad Elver nearForest Glen, Calif.
Mad River nearArcata, Calif.
Kedwood Creek nearBlue Lake, Calif.
Kedwood Creek atOrick, Calif.
Antelope Creek nearTennant, Calif.
Sprague River nearChiloquin. Oreg.
Fall Creek at Copco.Calif.
Scott River near FortJones, Calif.
Num ber of
consec utive days
17
15306090
120183
17
15306090
120183
17
15306090
120183
17
15306090
120183
17
15306090
120183
17
15306090
120183
17
15306090
120183
17
15306090
120183
Ordinates of low-flow frequency curves, In cubic feet per second, for indicated recurrence intervals, in years
1.02
4.204.354.655.208.0
11.216.396.0
474850547392
120642
13.513.814.315.520.024.831.5
112
53.054.5576282
100126423
13.213.714.014.316.317.519.325.0
350370380390400425450490
31.031.231.331.532.533.234.438.0
84899296
119137178495
1.10
2.372.552.853.154.105.607.90
44.0
33353739465771
270
9.610.010.411.213.216.219.564.0
35.437.54043526580
242
12.012.312.613.214.515.917.721.0
260280295304313330350380
30.230.330.531.031.732.233.335.3
7376798498
112139282
1.3
1.501.661.821.952.383.254.65
22.0
26.027.529.030334050
152
7.47.88.38.69.4
11.414.339.5
25272931354457
154
10.310.511.011.712.714.315.919.8
203225240249260273284317
29.529.830.030.230.531.432.234.8
616365718095
112195
2.0
0.90.97
1.071.191.381.852.80
10.2
19.720.521.723.024.829.036.585
6.06.26.46.77.28.3
10.422.2
17.318.320.021.423.829.84095
7.98.69.09.39.7
11.412.917.0
150173189200212225240260
28.028.228.628.929.230.030.833.0
40434649566982
128
5.0
0.49.52.59.67.86
1.101.504.65
14.715.216.017.019.422.02650
4.54.74.95.25.86.57.4
14.5
11.011.712.714.016.820.32558
5.45.66.06.16.87.89.3
13.1
110133148160176183190209
26.026.226.426.727.227.928.931.0
22.525.026.527.531.538.04983
10
0.34.38.42.50.62.75
1.043.55
12.813.213.714.916.318.021.441.5
3.803.954.154.505.05.56.4
12.0
8.49.09.8
11.013.215.219.547
4.354.604.905.155.76.78.0
11.0
103128140153163170180190
24.925.125.325.726.227.028.029.8
17.018.220.021.525.531.339.565.0
20
0.25.27.31.36.42.51.72
2.41
11.011.512.213.013.715.017.633.8
3.253.353.653.904.154.605.49.7
6.56.97.98.89.8
11.414.936
3.403.654.054.354.95.77.09.8
89117128139149158164175
23.724.024.524.925.326.227.229.2
1Z313.515.217.020.025.533.556.0
30
0.19.21.25.29.32.39.56
1.90
10.110.411.011.912.313.315.529.8
2.802.953.253.503.704.054.758.5
5.25.66.57.48.09.3
12.030.5
2.903.153.453.854.354.956.39.5
80108115126139150158168
22.823.223.724.224.925.526.929.0
9.211.012.714.517.020.728.553.0
50
0.13.14.17.20.23.28.40
1.32
9.09.39.8
10.410.911.713.524.3
2.302.452.652.953.153.404.107.00
3.754.14.85.66.27.19.4
23.2
2.302.552.903.153.554.055.39.3
6893
100107124140150160
21.722.222.823.223.824.525.928.9
6.47.69.2
11.013.115.322.049.0

LOW FLOW MAGNITUDE, DURATION, AND FREQUENCY 51
TABLE 8. Low-flow frequency table for selected stream-gaging stations Continued
Sta tion No.
5225
5255
5260
5270
5285
5290
5300
5320
5325
Gaging station
Salmon River atSomesbar, Calif.
Trinity River atLewiston, Calif.
Trinity River nearDouglas City,Calif.
Trinity River nearBurnt Ranch,Calif.
Hayfork Creek nearHyampom, Calif.
South Fork Trinity River near Salyer,Calif.
Trinity River nearHoopa, Calif.
South Fork SmithRiver nearCrescent City,Calif.
Smith River nearCrescent City,Calif.
Num ber of
consec utivedays
17
15306090
120183
17
15306090
120183
17
15306090
120183
17
15306090
120183
17
15306090
120183
17
15306090
120183
17
15306090
120183
17
15306090
120183
17
15306090
120183
Ordinates of low-flow frequency curves, in cubic feet per second, for indicated recurrence intervals, in years
1.02
255270280295380440580
1,450
210220230240310360480
1,330
240246255265340390520
1,520
365380400422560655880
2,400
44464851627086
223
127 132138142187215290850
680705740770
1,0101,1901,6004,550
187198202218290345470
1,180
375395405430560660890
2,330
1.10
220230237255300355450910
180188195210245290370780
204212220240270315400845
305320330415435520680
1,450
38394044505871
133
110 113116127145172222475
580600620680790940
1,2202,650
160168173178220265355760
325340350360435520675
1,430
1.3
190195200215240290355640
152156162175197237290530
175179185200225260315570
250260270295337417520980
3132343641485894
91 9498
105119140172320
480495515560635760940
1,770
137142145155173210265520
285293300320350420520980
2.0
140150158163178210247410
109119124130142170202335
128139145150163193227365
170187200209230283348610
22.024.025.526.528.535.04266
66 71747783
102121200
347377395410445540645
1,100
107111117120132152180315
230240248254275313362610
5.0
97103107110121137163252
7074788191
106130207
81859093
106125150232
105111117122138165209355
13.514.315.01618212643
42 444648546377
125
217230243253285335410670
8285899195
104120183
183188195198208225254370
10
82859094
105120141200
565963677590
110162
6568737886
105130185
83889499
113136171269
10.511.111.913.014.317.522.034.0
33 35374044536698
173182195207235282350515
767779818693
106145
168171175178190205228300
20
6972778290
105124178
44475256637594
142
515460657386
109164
6670788394
113142231
8.08.79.7
10.511.914.318.529.0
2628313337445684
135145160173195235295448
70727376798697
132
155160163168175190210275
30
606570758291
113172
37414550566484
138
43485258657497
160
576268758395
128226
6.77.48.29.2
10.512.216.528.0
22.0 24.026.529.533.0385082
113125138153173198262438
66697173768190
126
148153157162168177199265
50
52566065717795
163
30333741465269
130
35384348536080
150
475157626978
103209
5.45.86.77.48.39.7
13.326.5
17.8 19.522.02427314177
91100113125142160215410
62646669717381
120
140145148153158163180254

52 SURFACE-WATER HYDROLOGY, NORTHERN CALIFORNIA
In the course of this analysis it became evident that for each gaging station there is a relation between the low-flow frequency curves and the flow-duration curve. This relation is more consistent for low- flow frequency curves for durations of 120 days or less than it is for the 183-day curves, because only base flow is involved in the dis charges for the shorter durations. The paragraphs that follow pre sent a generalized summary of the characteristics of the low-flow frequency curves for durations ranging from 1 day to 120 days and for recurrence intervals ranging from 2 to 50 years.1. For recurrence intervals greater than 2 years, the graphs have only
slight curvature when plotted on logarithmic extreme-value probability paper.
2. The graphs are roughly parallel for a particular station.3. The relation between the low-flow frequency curve for 7 days
duration at any station and the flow-duration curve for that same station Is that shown in the upper part of table 9.
4. There is variation in the spacings between the roughly parallel low-flow frequency curves, but average values of the spacings at the 25 stations are as follows:
a. 1-day discharges are approximately 6 percent smallerthan 7-day discharges,
b. 15-day discharges are approximately 9 percent largerthan 7-day discharges,
c. 30-day discharges are approximately 19 percent largerthan 7-day discharges,
d. 60-day discharges are approximately 34 percent largerthan 7-day discharges,
e. 90-day discharges are approximately 55 percent largerthan 7-day discharges,
f. 120-day discharges are approximately twice as large as7-day discharges.
Fall Creek, with its equable flow, shows wide departure fromthe percentages shown above. The 1-day discharge there isonly 1 percent smaller than the 7-day discharge; the 120-daydischarge is only 13 percent larger than the 7-day discharge.
The characteristics of the low-flow frequency curves for 183,daysduration differ from those for the shorter durations, because fairlylarge quantities of surface runoff, particularly snowmelt, are includedin the 183-day periods, whereas the shorter periods involve only baseflow. It is to be expected, therefore, that relationships between thelow-flow frequency and flow-duration curves will differ in the threephysiographic sections, because of differences in runoff characteristics.The bottom part of table 9 shows the relations for the northern Cali-

FLOOD FREQUENCY 53
fornia Coast Ranges and the Klamath Mountains. The relations for the three gaging stations in the Southern Cascade Mountains showed considerable scatter, but their average was similar to that for Klamath Mountain stations.
The data in table 8 are in convenient form for use in studies of water supply, water power, and pollution control during periods of critically low flow, in those situations where the construction of storage facilities is not contemplated. Where the need for within-year storage is apparent and economic considerations govern the design of the storage facility, the data in these tables may be used to construct a frequency- mass curve that represents the total runoff available for a critical period of specified recurrence internal. The traditional mass-curve method of analyzing the storage required to maintain given draft rates may then be applied (Linsley and Franzini, 1955, p. 138-140). An example of this method of analysis, shown on figure 12, is self- explanatory. The curve of total runoff available, corresponding to a 20-year recurrence interval, is obtained by plotting the volume of runoff for various durations of minimum flow against the duration period.
TABLE 9. Relation of low-flow frequency and flow-duration curves for durations of7 and 188 consecutive days
Duration (days)
7.. ...... _ ....183.............
Physiographic section
Northern California Coast Ranges. . ________
Klamath Mountains ......
Average recurrence interval, in years, of discharges corre sponding to flow-duration curve percentiles Indicated below
99.9
60
99.5
20
99
11
98
6.0
96
2.66
90
1.55
46 46
85
27 10
80
14 6
75
6.5 3.7
70
3.32.6
60
1.45 1.55
FLOOD FREQUENCY
The magnitude and frequency of floods is an essential element in studies involving flood-control design or the economics of structures within the reach of flood waters. Accordingly, this section of the report provides regional flood-frequency graphs that may be used as guides in determining "design" flood flows for streams both gaged and ungaged, in the coastal basins of northern California. The application of these graphs is explained and the results are discussed in order to give some indication of the degree of reliability that may be expected from their use. The method of analysis used in deriving the regional graphs is only briefly described here; it is discussed in detail in a Geological Survey hydrology manual (Dalrymple, 1960). The regional concept of flood-frequency analysis has been adopted because flood- frequency curves for individual stations, particularly with the short

54 SURFACE-WATER HYDROLOGY, NORTHERN CALIFORNIA
oouu
5000
4500
> 4000«tQ
1 CO
0 3500z
UJ
m 3000_i <
"* 2500U_u_ OZ
i 2000<
£ 1500
1000
500
nc/
Durati perio(days
17
15 3060 90
120 183
on d )
Mean discharge
(cfs)
8.0 8.7 9.7
10.5 11.9 14.3 18.5 29.0
Tot rune (cfs day
6 14 31 71
128 222 530
3l
ff
5)
31 5 54 7 0 7
x/X
_ ^sX
xK</
'X
/
/t
/
v£
E
/
</
>20
/d^960 c
;fs-days
//
^
fs-days
^
//
xample: For a 20-year recurrence in a storage capacity of 960 cfs-days a draft of 25 cfs
1
rt
tervalallows
20 40 60 80 100 120 140 160 180
DURATION PERIOD OR PERIOD OF MINIMUM DISCHARGE, IN DAYS
200
FIGURE 12. Frequency-mass curve and storage-draft lines for Hayfork Creek near Hyampom, Calif, (sta. 5285) for 20-year recurrence Interval. Mean discharge from table 8.
records available, are felt to be inadequate for establishing flood criteria for design purposes. The flood series for a single station is a random sample and therefore may not be representative of the long- term average distribution of flood events at the gaging station.
The streamflow records used in this study were those whose peak discharges were not seriously affected by storage or diversion. A common base period is required for all streamflow records used in the regional analysis, and the 28-year period October 1931, to September 1959 was selected; the dearth of long-term streamflow records pre cluded the use of a longer base period. It was possible to extrapolate the flood-frequency curves beyond the base period with considerable confidence because of the availability of historical records, both qualitative and quantitative, of major floods that occurred in years

FLOOD FREQUENCY 55
prior to 1931. It is known for example, that the flood peaks of Decem ber 1861-January 1862 were the greatest since at least 1854. Evidence also indicates that the peak discharges of December 1955 were roughly of the same magnitude as those of 1861-62. For the gaging station on Klamath Kiver near Klamath, Calif., it has been possible to compute the peak discharge from floodmarks for all notable floods that occurred prior to 1932. For each of those years between 1932 and 1959 when this station was not in operation, annual flood peaks were computed by routing flows recorded at the gaging stations on Klamath Kiver at Somesbar, Calif., and Trinity Kiver near Hoopa, Calif. Because these computed flows do not appear in any Geological Survey publications, they are presented here in table 10. Notable peak discharges recorded prior to 1932, at the few other stations then in operation, were also used in the regional analysis.
TABLE 10. Annual peak discharges of Klamath River near Klamath, Calif, (sta.5306)
Water year
18621881
192?1932193319341935193619371938103Q
19401941194219431944194519461947194819491950195119521953195419551956195719581959
Date
Dec. 1861....-,. Feb. 1881-. Feb. 1890. . ___ . _________ . . Feb. 1927... _ Mar. 1932. _ __ ... Mar. 1933 Mar. 1934 _ - __Apr. 1935-..- __ . _Jan. 1936 Apr. 1937.. Dec. 1937-. __ Dec. 1938--- _ Feb. 1940-- _ Mar. 1941 Feb. 1942.. Jan. 1943. _ Mar. 1944 Feb. 1945---. - _ . - Dec. 1945 Feb. 1947---
Mar. 1949 Mar. 1950 _ ... .Feb. 5, 1951 Feb 2, 1952 Jan. 18, 1953--. Jan. 28, 1954- __________ . ______ . _Dec. 31, 1954 _______ . ___ . Dec. 22, 1955 _Feb. 26, 1957 Feb. 25, 1958 Jan. 12, 1959.
Discharge (cfs)
i 450, 000i 360, 0001425,000i 300, 000
* 96, 400246,2002 51, 100260,000
2 162, 0002 121, 0003 218, 000
2 71, 0002237,0002 124, 0002151,0002162,000
8 32, 0002102,0002 209, 000
2 73, 9002 202, 000295,000292,600173,000195,000297, 000133, 00074,200
425, 000160, 000236,000175, 000
Remarks
Greatest flood in 106 years.Fourth highest in 106 years.Third highest in 106 years.Fifth highest in 106 years.
Sixth highest in 106 years.
Second highest in 106 years.
1 Computed from floodmarks and hydraulic properties of channel.2 Computed by routing flows recorded at stations on Klamath River at Somesbar, Calif, and Trinity
River near Hoopa, Calif.
METHOD OF ANALYSIS
The analysis of the peak-flow data was performed in two separate steps, in conformance with Geological Survey practice. Computation of the mean annual flood at each gaging station represented the first

56 SURFACE-WATER HYDROLOGY, NORTHERN CALIFORNIA
step. Geological Survey usage defines an annual flood as the maxi mum momentary discharge occurring in a water year; the mean annual flood is the discharge indicated for a recurrence interval of 2.33 years when the array of annual floods for a station is plotted on extreme-value probability paper. Plotting positions for annual floods in the array are computed by use of the formula:
Recurrence interval=-^r^> M
where N is the number of years of record, and M is the order number of each flood when ranked in descending order of magnitude.
The magnitude of the mean annual flood was determined for each station that had 5 or more years of record of annual peak discharge within the base period 1932-59, providing these annual maximum discharges were not seriously affected by regulation or diversion. Correlation techniques were used in the determination of the mean annual flood for those stations whose records were shorter than the base period. Only one gaging station in the region, meeting the cri terion of 5 or more years of record of essentially unregulated peak discharge, was omitted from the study. Station 4895, Antelope Creek near Tennant in the Southern Cascade Mountains, has 7 years of record but the peak-flow correlation with nearby stations is poor. Table 11 lists the stations used in the study and the station numbers that identify them on the location map (pi. 5). Referring to plate 5, it is seen that station 4615 in the Russian River basin in California and station 3770 in the Rogue River basin in Oregon lie just outside the region being studied. These two stations were used for verifica tion of the flood characteristics of streams near the perimeter of the delineated area.
Preparation of dimensionless composite flood-frequency curves, each representative of a large area, constituted the second step in the analysis. All gaging stations in table 11 that had 10 or more years of record were used in this part of the analysis. For each of these se lected stations flood-frequency curves were drawn on extreme-value probability paper with discharge expressed as a ratio to the mean annual flood. For Klamath River at Klamath, Calif, (sta. 5305), the magnitudes of all major flood peaks in the past 106 years are known and were used in the construction of the flood-frequency curve. For the other stations in California, where it was known only that the flood peaks of December 1955 were roughly equivalent to those of 1961-62, the magnitude of the 1955 peak was plotted with a recur rence interval of both 107 years and 53.5 years, indicating that this magnitude represented both the highest and second highest discharge

FLOOD FREQUENCY 57
TABLE 11. Mean annual floods and associated hydrologic factors at selected stream- gaging stations
[All mean annual discharges have been adjusted to the 28-year base period, 1932-59]
Station No.
1377014615
4730
47404745
4755
4765
47704775
24785
47904800
4805 48104815
4825
51755195 5225
52555260
5270
5285
5290
5300
5305 5320
5325
5010 5025
5120
Gaging station
Northern California Coast Ranges
East Fork Russian River near Cal- pella, Calif.-- -
Middle Fork Eel River below Black Butte River, near Covelo, Calif. ...
Eel River below Dos Rios, Calif ___North Fork Eel River near Mina,
Calif... South Fork Eel River near Brans-
South Fork Eel River near Miranda, Calif--.
Eel River at Scotia, Calif _ . __Van Duzen River near Dinsmores,
Calif...
Van Duzen River near Bridgeville, Calif..
Jacoby Creek near Freshwater, Calif-
Mad River near Forest Glen, Calif _
Redwood Creek near Blue Lake, Calif
Klamath Mountains
Scott River near Fort .Tones, Calif. _ Salmon River at Somesbar, Calif. __
Trinity River near Douglas City, Calif-- -
Trinity River near Burnt Ranch, Calif
Hayfork Creek near Hyampom, Calif
South Fork Trinity River near Sal- yer, Calif.. _ ____ . __
Klamath River near Klamath, Calif- South Fork Smith River near Cres
cent City, Calif Smith River near Crescent City, Calif
Southern Cascade Mountains
Sprague River near Chiloquin. Oreg.. Williamson River below Sprague
River near Chiloquin, Ore? __ . ...
Drainage area
(sqmi)
364
93 0
367
1,481
251
43.9
5373,113
80.2
214127
6.07
144485
67.5278
3657662 746
726
1,017
1,438
379
8992,846
12,100
295
613
1,580
3,00020
Period of record
1928-59
1942-59
1952-59
1912-13,1952-59
1954-59
1947-59
1941-591911-15, 1917-59
1954-58
1912-13. 1940-591954-55, 1957-59
1955-59
1954-59 1911-13, 1951-59
1954-581912-13, 1954-59
1934-41, 1946-591942-59
1912-15,1928-59
1912-59
1945-51
1932-40, 1957-^59
1954-59
1951-591912-14,1917-18,
1932-59
1911-26, 1951-59 <
1955-59
1932-59
1921-59
1917-591929-59
Mean annual flood (cfe)
27, 000
7,640
30,000
88,000
18,000
6,500
47,300180,000
8,300
18,60010,000
540
10, 000 32,000
5,20018,500
1,0606,200
19, 000
19.800
22,500
37,400
8,750
22,00065,300
152,000
38,000
75,000
2,280
2,890174
Mean annual basin wide
precipitation (In.)
60
53
58
79
7059
74
726054
60 64
8080
193357
59
56
57
43
5055
42
116
111
23
2424
1 Outside the report region.2 Records for stations on Van Du?cn River at and near Bridgeville. Calif, have been combined.s Actual drainage area above gage is 796 sq ini, but 139 sq ini above Dwinnell Reservoir is non-contributing.* Annual peak flows for period 1982-1950 computed by routing technique.

58 SURFACE-WATER HYDROLOGY, NORTHERN CALIFORNIA
in 106 years. The well-defined portion of the flood-frequency curve for each station, generally a straight line or gentle curve, was ex trapolated to the 100-year recurrence interval, with the provision that the extrapolation pass through one of these two plotted points or pass be tween them. A statistical test was then performed to define groups of stations that were homogeneous with respect to slope of the flood- frequency curve. Finally, a median curve was drawn for each group of homogeneous stations. Each median curve is considered to be the dimensionless flood-frequency curve for the subregion in which its group of stations lies.
The regional type of analysis described briefly in the preceding paragraphs is applicable to gaging stations in the northern California Coast Ranges and the Klamath Mountains, but could not be applied in the Southern Cascade Mountains (subregion 4 on pi. 5). Only three gaging stations with records unimpaired by regulation or diver sion are available for regional analysis in that 8,000-square-mile lava area. Two of these stations, Sprague River near Chiloquin, Oreg. (sta. 5010), and Williamson River below Sprague River near Chilo quin, Oreg. (sta. 5025), can hardly be classed as independent, because the former station contributes more than 75 percent of the peak flow that passes the latter station. Both rivers drain extensive marsh areas that provide natural regulation for the high flows that result from snowmelt or rain on snow. No parallel can be drawn between these rivers and the California streams; far from being outstanding, the flood peaks of December 1955 on the two rivers were exceeded in the following April of 1956, and these peaks of April 1956, in turn, were exceeded in other years during the period of record. There is no information available concerning the floods of 1861-62 in subregion 4.
The third gaging station in the Southern Cascade Mountains, Fall Creek at Copco, Calif, (sta. 5120), is spring fed and normally has very steady flow. Winter rains, however, may cause sharp flood peaks, but these represent a low discharge per square mile of drainage area. As a matter of general interest, flood-frequency curves for each of the three stations, based on complete periods of record, are presented on figures 13 and 14. Because these stations could not be included in a regional type of analysis, the discussion that follows is confined to gaging stations in the northern California Coast Ranges and the Klamath Mountains.
MEAN ANNUAL FLOOD
The magnitude of the mean annual flood in basins in northwestern California is related primarily to the size of drainage area and to the magnitude of the mean annual storm. Mean annual precipitation is an excellent index of the relative magnitude of the mean annual

FLOOD FREQUENCY 59
7000
Q z.
o 6000 tocc
^ 5000
UJ UJu.
0 40000013 O
z Qnnn
DISCHARGE,
(- hO C
§0 Co c 0 c
0^
Og£
~*
Wi
J
m
lia Ri
pt
*
mso /er r
P
>n
**
n F lea
(S eric
^
/
Jiv rC ta >d
**
*
~
art hilc 50 19
-
elow >quin, 25) L7-5?
^~£~
r
Sprag Oreg
/*/°, °>/»
ue^
t
S
?
x1
o /"
^(
y
y\S
^?*j
r i.*
^X^Spra ^ Ch
(Per
o^^-
i ^^
gue Ri\ loquin Sta 50 iod 19
^^
^
i&t n Ore
10) 21-5
-- o
r-1
gar g9~
; ^OVICIO*J-(£>OOCMOO ro ^LOIDOOO o ooc
RECURRENCE INTERVAL, IN YEARS
FIQUBE 13. Flood-frequency curves for Sprague River near Chiloquin, and for Williamson River belowSprague River near Chiloquin, Oreg.
storm because the bulk of the annual precipitation in the region occurs during several general storms each year, and all stations expe rience the same number of general storms in any given year. Sub surface storage also exerts a significant influence on the magnitude of the mean annual flood. Surface storage, on the other hand, is a negligible factor in this study, because there are no sizable lakes or reservoirs that are uncontrolled, and streams that are seriously affected by artificially regulated storage have been excluded from the analysis. Because subsurface storage is related to the infiltration capacity, or the permeability of the mantile rock, it is logical to expect the mean annual flood in the northern California Coast Ranges to differ from that in the Klamath Mountains, when all other factors are equal.
On figure 15 the mean annual floods for basins in the northern California Coast Ranges have been plotted against drainage area. Each point is labelled with (1) the number of the gaging station for identification purposes, and (2) the mean annual precipitation for the basin upstream from the station. The precipitation is seen to range from 53 inches to 80 inches, and within this relatively small
710-057'
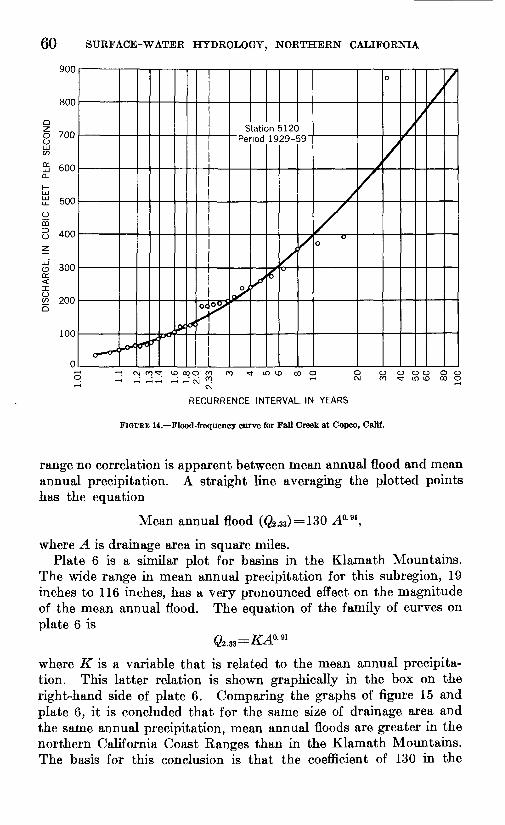
60 SURFACE-WATER HYDROLOGY, NORTHERN CALIFORNIA
900
800
700
600
500
400
300
200
100
Station 5120 Period 1929-59'
m to oo o
RECURRENCE INTERVAL, IN YEARS
FIGURE 14. Flood-frequency curve for Fall Creek at Copco, Calif.
range no correlation is apparent between mean annual flood and mean annual precipitation. A straight line averaging the plotted points has the equation
Mean annual flood ($2.33) = 130 A°- n ,
where A is drainage area in square miles.Plate 6 is a similar plot for basins in the Klamath Mountains.
The wide range in mean annual precipitation for this subregion, 19 inches to 116 inches, has a very pronounced effect on the magnitude of the mean annual flood. The equation of the family of curves on plate 6 is
where K is a variable that is related to the mean annual precipita tion. This latter relation is shown graphically in the box on the right-hand side of plate 6. Comparing the graphs of figure 15 and plate 6, it is concluded that for the same size of drainage area and the same annual precipitation, mean annual floods are greater in the northern California Coast Ranges than in the Klamath Mountains. The basis for this conclusion is that the coefficient of 130 in the
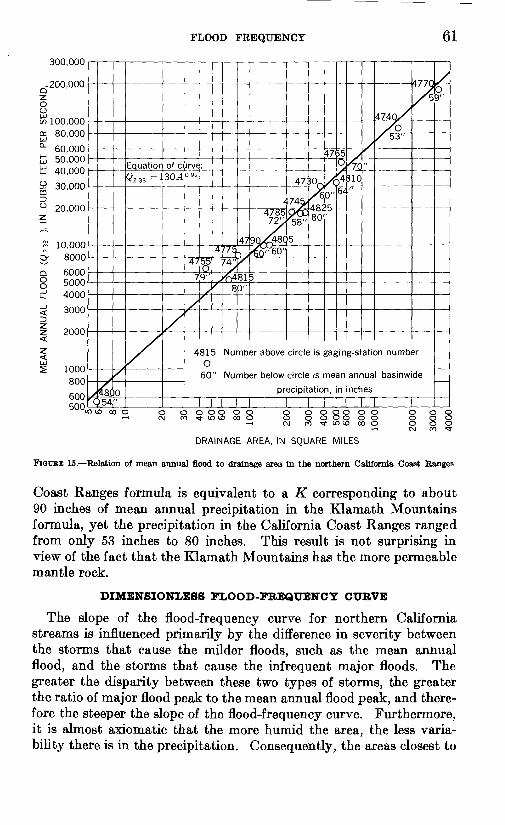
FLOOD FREQUENCY 61
-200,000Q
Oo co 100,000 o: 80,000UJ
°- 60,000 t 50,000 tt! 40,000
y 30,000QQ30 20,000z
8 10,000 O; 8000
d 6000 g 5000 u! 4000
^ 3000
I 2000
zUJ5 1000
800
600 500U
4^/0
^054,"
Equation of c$233=1
A
3QA
/
,jrve091
4755
7
A
9"
^r
4
^^
4815 O60"
775,74'
47
^/0481
80"
/4785
go^sc;^W'
5
47:
745/
'58"
5
3°O
s D 482 80
471
A0"
oit 6^
-
^ 310H
/"
474oXX?-/5
Number above circle is gaging- station number
Number below circle is mean annual basinwide
precipitation, in inches
3"
c"> ID 00 O O OOOOOO O OOOOOO O OC
-1 CM m ^- in 10 oo o o oooooo ooc -i CM 00 ^t IT) ID 00 O OOC
^H CM ro ^
DRAINAGE AREA, IN SQUARE MILES
FIGURE 15. Relation of mean annual flood to drainage area in the northern California Coast Ranges
Coast Ranges formula is equivalent to a K corresponding to about 90 inches of mean annual precipitation in the Klamath Mountains formula, yet the precipitation in the California Coast Ranges ranged from only 53 inches to 80 inches. This result is not surprising in view of the fact that the Klamath Mountains has the more permeable mantle rock.
DIMENSIONLESS FLOOD-FREQUENCY CURVE
The slope of the flood-frequency curve for northern California streams is influenced primarily by the difference in severity between the storms that cause the milder floods, such as the mean annual flood, and the storms that cause the infrequent major floods. The greater the disparity between these two types of storms, the greater the ratio of major flood peak to the mean annual flood peak, and there fore the steeper the slope of the flood-frequency curve. Furthermore, it is almost axiomatic that the more humid the area, the less varia bility there is in the precipitation. Consequently, the areas closest to

62 SURFACE-WATER HYDROLOGY, NORTHERN CALIFORNIA
"CMOO^J-UJOOCM m ^j-mioooo o oooooo ,-i _; ,-i,_;_;_; ^ CM m * in uj oo o
RECURRENCE INTERVAL, IN YEARS
The solid line Is the flood-frequency curve applicable for the entire subregion. This curve is the median of the flood-frequency curves for nine individual stations in the subregion. The curves for the Individual stations are the dotted lines with Identifying station numbers.
FIGUBE 16. Dimensionless flood-frequency curve for subregion 1.
the coast, because they in general, have the greatest precipitation, would be expected to have flood-frequency curves that show the flattest slopes. Infiltration capacity has little effect on the peak dis charge during major floods, because these floods are generally asso ciated with rains that last for many days, and as a consequence, the ground becomes well saturated and the infiltrating rain amounts to only a small percentage of the storm precipitation. Elevation may also be a factor because during these prolonged major storms there is generally some snowmelt which augments the runoff directly attribut able to rainfall. Thus the flood-frequency curves for the basins of higher elevation in northwestern California tend to have steeper slopes.
The statistical tests for homogeneity of slope of the flood-frequency curves bear out these premises. These tests have resulted in the establishment of the areas of homogeneity shown on plate 5. Sub- region 1 has the flattest flood-frequency curves; lying closest to the ocean, it is the most humid area and has the lowest elevations. Figure 16 shows the dimensionless flood-frequency curve for this subregion, based on the nine gaging stations in subregion 1 that had been in operation for at least 10 years. As an indication of the degree to which this flood-frequency curve is representative of the subregion, the individual flood-frequency curves for the nine stations have been included in figure 16. These individual curves, drawn as dotted lines,

FLOOD FREQUENCY 63
have a maximum departure of about 20 percent from the median curve for the subregion.
The slope of the flood-frequency curve for subregion 2, shown in figure 17, is steeper than that of the flood-frequency curve for sub- region 1. This is attributed to the generally more variable storm precipitation and higher elevations found in subregion 2. There are only three stations with 10 or more years of record in subregion 2, and consequently the flood-frequency curve representative of the subregion lacks the high degree of confirmation obtainable from a large number of gaging stations. The flood-frequency curves for the 3 individual stations, drawn as dotted lines on figure 17, show a maxi mum departure of less than 10 percent from the median curve for the subregion.
The flood-frequency curve for subregion 3 is shown in figure 18. This curve has the steepest slope of the three regional curves, reflecting the fact that subregion 3 is the least humid of the three subregions. Only two stations in the subregion have the requisite 10 years or more of record, and one of those Shasta River near Yreka, Calif.
4.5
4.0
*>
j>
3.5
3.0
2.5
02.0
cc co 1.5bj"
C3 | 1.0
IQ 0.5
DOOCM oo *t m 10 oo o o
RECURRENCE INTERVAL, IN YEARS
The solid line is the flood-frequency curve applicable for the entire subregion. This curve is the median of the flood-frequency curves for three Individual stations in the subregion. The curves for the individual stations are the dotted lines with Identifying station numbers.
FIGURE 17. Dimensionless flood-frequency curve for subregion 2.
52705225
5255
710-057

SURFACE-WATER HYDROLOGY, NORTHERN CALIFORNIA
-1 CM 00 ^t l£> 00 CM 00 ^t LT> l£> 00 O OQI-J ,-i ,_; ,_;,_;,_;,_; > < CM
RECURRENCE INTERVAL, IN YEARS
The solid line is the flood-frequency curve applicable for the entire subregion. This curve Is the median of the flood-frequency curves for two individual stations in the subregion. The curves for the individual stations are the dotted lines with identifying station numbers.
FIGUKE 18. Dimensionless flood-frequency curve for subregion 3.
(sta. 5175) has flood flows from the upper 139 square miles of its drainage area completely controlled by Lake Dwinnell. It was possible, however, to include this station in the analysis because releases from the lake are negligible during flood peaks. The 139 square miles above Lake Dwinnell are therefore considered non- contributing area for the purpose of flood-frequency analysis. The flood-frequency curves for the 2 individual stations drawn as dotted lines on figure 18, show a maximum departure of less than 10 percent from the median curve for subregion 3.
APPLICATION OF REGIONAL FLOOD-FREQUENCY CURVES
The regional graphs may be used as guides in the construction of flood-frequency curves for ungaged sites in either the northern California Coast Ranges or the Klamath Mountains. The first step in the process is to determine the mean annual flood for the ungaged site. If the site lies in the northern California Coast Ranges this is accomplished by entering figure 15 with the drainage area above the site. If the site lies in the Klamath Mountains, it is first necessary to obtain the mean annual basin wide precipitation from plate 2. This precipitation value and the drainage area are then applied to plate 6 to obtain the mean annual flood. The next step is to apply the value of the mean annual flood to the appropriate dimensionless composite (median) curve found in figure 16, 17, or 18. By multi plying the mean annual flood by the ratios shown on the regional flood-frequency curve, the discharges corresponding to selected fre-

HIGH FLOW - 65
quencies are obtained. A sufficient number of discharges are com puted to define the flood-frequency curve for the ungaged site.
HIGH FLOW MAGNITUDE, DURATION, AND FREQUENCY
Studies involving the storage of flood waters require a knowledge of the magnitude, duration, and frequency of high flows. To fill the need for this information, high-flow frequency curves were prepared for all but 5 of the 31 stations, listed in table 11, that were used in the previously described flood-frequency analysis. The stations omitted were:
No. Station 3770 __ ______ Illinois River at Kerby, Oreg.4615____-_________________ East Fork Russian River near Calpella, Calif.4740_________________ Eel River below Dos Rios, Calif.4800._____________________ Jacoby Creek near Freshwater, Calif.5175._____________________ Shasta River near Yreka, Calif.
Stations 3770 and 4615 both lie outside the report area; station 4800, which had 5 years of record of momentary peak discharge, did not meet the criterion of 5 complete years of daily discharge record; stations 4740 and 5175 are downstream from reservoirs whose operation does not impair an analysis of annual momentary flood peaks, but which may seriously affect a study involving average flow rates during periods of high discharge. The method of analysis described in the para graphs that follow is most appropriate for use on streams having one major high-water period per year, and for use where large reduc tions in outflow are desired. The principal advantage of the method is that it allows estimates of required storage to be made for ungaged streams.
The high flows selected for analysis were the maximum average rates of discharge each year for the following intervals of time: 1 day, 3 consecutive days, 7 consecutive days, 15 consecutive days, 30 con secutive days, 60 consecutive days, 120 consecutive days, 183 con secutive days, 274 consecutive days, and 365 consecutive days. It was realized that maximum 24-hour flow would have been a great deal more significant than maximum flow for 1 calendar day. The users of Geological Survey streamflow data, however, do not generally have maximum 24-hour flow rates available to them, and in addition, the maximum flow for so short a time interval, is generally not a critical factor in reservoir design. For these reasons, the rather artificial duration period of 1 calendar day was adopted for use in this study. The results obtained for discharge of this duration were surprisingly consistent.
In analyzing the high-flow data, each of the 10 duration periods was studied separately, using a method of analysis that closely paralleled that described in the preceding flood-frequency section of this report.
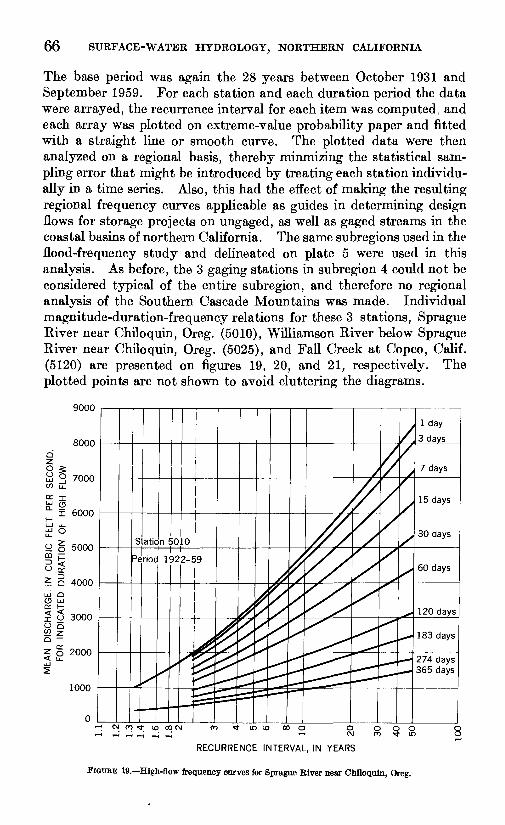
66 SURFACE-WATER HYDROLOGY, NORTHERN CALIFORNIA
The base period was again the 28 years between October 1931 and September 1959. For each station and each duration period the data were arrayed, the recurrence interval for each item was computed, and each array was plotted on extreme-value probability paper and fitted with a straight line or smooth curve. The plotted data were then analyzed on a regional basis, thereby minmizing the statistical sam pling error that might be introduced by treating each station individu ally in a time series. Also, this had the effect of making the resulting regional frequency curves applicable as guides in determining design flows for storage projects on ungaged, as well as gaged streams in the coastal basins of northern California. The same subregions used in the flood-frequency study and delineated on plate 5 were used in this analysis. As before, the 3 gaging stations in subregion 4 could not be considered typical of the entire subregion, and therefore no regional analysis of the Southern Cascade Mountains was made. Individual magnitude-duration-frequency relations for these 3 stations, Sprague River near Chiloquin, Oreg. (5010), Williamson River below Sprague River near Chiloquin, Oreg. (5025), and Fall Creek at Copco, Calif. (5120) are presented on figures 19, 20, and 21. respectively. The plotted points are not shown to avoid cluttering the diagrams.
9000
oo CM oo *t m vo oo o o oocrtrtrtrtrtrt ^ CM 00 *t IT
RECURRENCE INTERVAL, IN YEARS
FIGUEE 19. High-flow frequency curves for Sprague River near Chiloquin, Oreg.

ME
AN
D
ISC
HA
RG
E,
IN
CU
BIC
FE
ET
PER
S
EC
ON
D,
FOR
IN
DIC
ATE
D
DU
RA
TIO
N
OF
HIG
H
FLO
W
ME
AN
DIS
CH
AR
GE
,IN C
UB
IC F
EET
PER
SE
CO
ND
, FO
R
IND
ICA
TED
DU
RA
TIO
N O
F H
IGH
FLO
W
100
100
Oi

68 SURFACE-WATER HYDROLOGY, NORTHERN CALIFORNIA
The remaining 23 gaging stations used in this study are listed in table 12. The discharges shown for each duration are the graphic means for the individual arrays that is, the discharge indicated for a recurrence interval of 2.33 years on each of the individual plots on extreme-value probability paper. These discharges, referred to here after as $2.33, were analyzed in precisely the same manner as were the mean annual floods in the preceding flood-frequency section of this report. Q2. 33 was found to be related to the size of drainage area and to the mean annual precipitation by the equation Q=KAOM . In this equation the parameter K varies with geologic characteristics, mean annual precipitation, and duration. With regard to geologic character istics, the 23 stations lie in one or the other of two geologically homo geneous regions, the northern California Coast Ranges and the Klamath Mountains. In the northern California Coast Ranges, the basins investigated had a comparatively narrow range in mean annual precipitation (59-80 in.) and K was found to vary with duration alone. This is illustrated by figure 22. On this graph individual points have been plotted only for durations of 1 day, 30 days, and 365 days. Plotting the points for the other seven durations on this single diagram would have created a disorderly and obscuring effect.
In the Klamath Mountains, the wide range in mean annual pre cipitation, 33 inches to 116 inches, has a pronounced effect on the value of K. Figure 23 shows the variation of K with mean annual precipitation and duration of flow. To avoid cluttering the diagram the individual values of K have been plotted only for durations of 1 day, 30 days, and 365 days. It will be noted that 1 set of points, with mean annual precipitation equal to 42 inches, consistently plotted higher than the curves. This set of points represents the station on Klamath River near Klamath, Calif. (5305). Because of the com plexity of the 12,100-square-mile area drained by the Klamath River, the lack of conformity of this station is not particularly surprising.
The values of K, as indicated by figures 22 and 23, may be compared by assuming the curves of figure 22 to represent an average annual precipitation of 70 inches. For durations of 120 days or more the values of K, corresponding to 70 inches of precipitation in each of the 2 physiographic provinces, are quite similar. As the duration periods decrease from 120 days, K values in the northern California Coast Ranges become increasingly larger than those in the Klamath Moun tains. This development is not surprising. Because the Klamath Mountains have the more permeable mantle rock, a significantly larger percentage of the precipitation infiltrates into ground-water storage. Furthermore, some of the winter precipitation in the Klamath Mountains is retained for several months in the form of a mountain snowpack. The net result of these factors is a greater time

HIGH FLOW 69
o-
I; 200,000
100,00080,000
60,00050,000
40,000
30,000
20,000
10,000
8000
60005000
4000
3000
2000
1000
800
600500
400
300
200
100
1-day mean discharge
x 30-day mean discharge
365-day mean discharge
Note: Numerals at top of graph are station numbers
§ o o o o o 00 O O OCM rr> rh (o oo o
DRAINAGE AREA, IN SQUARE MILES
FIGURE 22. Relation of 02.33, for high flows of various durations, to drainage area in northern CaliforniaCoast Ranges.

70 SURFACE-WATER HYDROLOGY, NORTHERN CALIFORNIA
ss s ess ess s§s ssfes gfes ss 9
r-ieS 5 CCO<M cqt-r- oot»c<ii-Tie' «T <-Teo"
CflQ i-H M
S3 S ss
T-H1O >O >O03i-l CD 00oo eg
ffq"<O'eO' t-Tr-cf
O CO i-H 00 QO CO
eo"oo" of
<*»-
t. m ® £
PH
I-H I
3«S»rHO9 &
WTfC* ,-ie
<N
:
a
O> S
s "P
fl S ®
S «I5
^1,
jfl |«| | 511 ||i!.~ a H HOS <3 §2 ^ rS °j h b itf ^fe fejj^ "^ a a -a ^«« «®i
fe a
^^fl a£! a a«H L.OC
S rt
««<
gMogu § » .<a ,<aa£ £, <f> <D
O Sg
|£> 5 ^b«a s^s

HIGH FLOW 71
200
Note: Mean discharge, with recurrence interval of 2.33 years for high flows of various durations in Klamath Mountains, is related to size of drainage area in accordance with the equation Q 233 = KA°-n
O 1-day mean dischargex 30-day mean discharge 365-day mean discharge
10 20 30 40 50 60 80 100 150 MEAN ANNUAL BASINWIDE PRECIPITATION, IN INCHES
FIGURE 23. Relation of K, for high flows of various durations, to mean annual precipitation in theKlamath Mountains.

72 SURFACE-WATER HYDROLOGY, NORTHERN CALIFORNIA
lag between precipitation and runoff in the Klamath Mountains and, consequently, smaller K values for the durations of runoff shorter than 120 days.
The final step in the analysis of high flow was the construction of regional frequency curves for the various duration periods under consideration, using discharge expressed as a ratio of $2.33- All gaging stations in table 12 that had 10 or more years of record within the base period 1932-59 were used in this part of the analysis. These stations are listed in tables 13 and 14. It is seen that there is only one station, Scott River near Fort Jones, Calif. (5195), available for analysis in subregion 3. While the shapes of the high-flow frequency curves for this station are believed to be fairly representative of those for other basins in the subregion, it was felt that no generalizations concerning subregion 3 should be expressed until recently established gaging stations in the subregion have sufficient length of record to be included in the analysis. The magnitude-duration-frequency rela tions for the Fort Jones station are therefore presented in 'figure 24 without further comment.
25,000
60 days 120 days 183 days 274 days 365 days
sCM oo ^f ID oq CM oo ^f ir> ID ooo
RECURRENCE INTERVAL, IN YEARS
FIGTJKE 24. High-flow frequency curves for Scott River near Fort Jones, Calif.
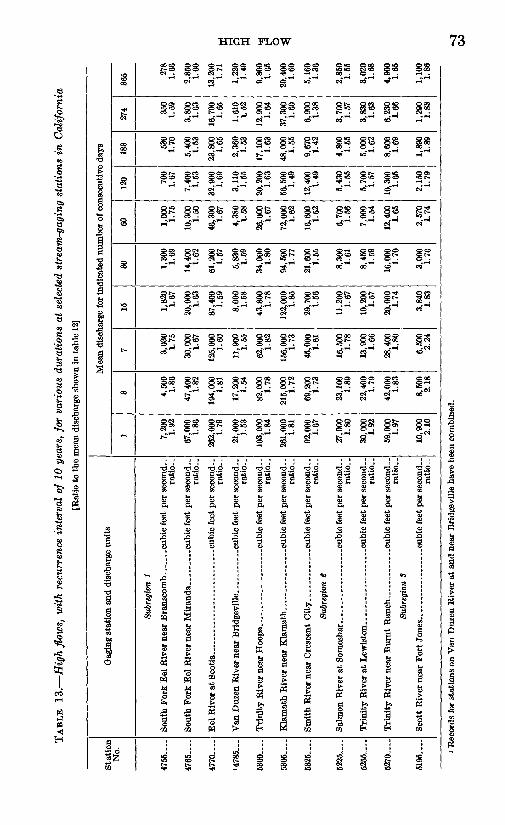
TAB
LE 1
3.
Hig
h fl
ows,
wit
h re
curr
ence
int
erva
l of
10
year
s, f
or v
ario
us d
urat
ions
at
sele
cted
str
eam
-gag
ing
stat
ions
in
Cal
ifor
nia
[Rat
io t
o th
e m
ean
disc
harg
e sh
own
in t
able
12]
Sta
tion
No.
4755
....
4765 .
47
70
1478
5...
5300
... .
5305
5325
- _
5225
5255
6270
5195
Gag
ing
stat
ion
and
disc
harg
e un
its
Subr
egio
n 1
Sout
h F
ork
Eel
Riv
er n
ear
Bra
nsco
mb cu
bic
feet
per
sec
ond-
ra
tio
Sout
h F
ork
Eel
Riv
er n
ear
Mir
anda
__
__
cubi
c fe
et p
er s
econ
d ra
tio
-
rati
o
rati
o. .
rati
o..
rati
o. .
rati
o. .
Subr
egio
n #
rati
o..
rati
o..
rati
o..
Subr
egio
n 3
ratio
- -
1 7,20
0 1.
92
67,0
001.
86
262,
000
1.79
21,0
001.
53
103,
000
1.84
261,
000
1.81
92,0
001.
67
27,0
001.
80
30,0
001.
92
69,0
001.
97
10,9
002.
10
]
3 4,50
0 1.
86
47,4
001.
82
194,
000
1.81
17,2
001.
54
82,0
001.
78
215,
000
1.72
69,2
001.
73
23,1
001.
89
22,4
001.
79
42,0
001.
83
8,50
02.
18
VIe
an d
isci
7 3,03
0 1.
75
30,0
001.
67
125,
000
1.60
11,9
001.
55
62,0
001.
82
156,
000
1.73
45,0
001.
61
16,5
001.
78
13,9
001.
66
28,4
001.
80
6,50
02.
24
arge
for
in
15 1,82
0 1.
67
20,0
001.
63
87,4
001.
59
8,00
01.
58
43,8
001.
78
122,
000
1.85
29,7
001.
56
11,2
001.
67
10,2
001.
57
20,0
001.
74
3,84
01.
83
dica
ted
nu
30 1,30
0 1.
69
14,4
001.
62
61,2
001.
57
5,83
01.
59
34,0
001.
80
94,5
001.
77
21,6
001.
55
8,30
01.
61
8,45
01.
59
16,0
001.
70
3,00
01.
76
mbe
r of
coi
60 1,00
0 1.
75
10,3
001.
50
46,3
001.
67
4,38
01.
58
26,0
001.
67
72,0
001.
62
16,6
001.
52
6,70
01.
56
7,00
01.
54
12,4
001.
65
2,57
01.
74
isec
utiv
e
120 70
0 1.
67
7,40
01.
53
32,9
001.
69
3,11
01.
55
20,2
001.
63
56,5
001.
49
12,4
001.
49
5,43
01.
55
5,70
01.
57
10,3
001.
65
2,15
01.
79
days 18
3 530
1.70
5,40
01.
53
23,8
001.
65
2,36
01.
53
17,1
001.
63
48,0
001.
55
9,67
01.
42
4,80
01.
55
5,00
01.
62
8,60
01.
69
1,89
01.
89
274 35
0 1.
59
3,80
01.
63
16,7
001.
65
1,61
01.
52
12,9
001.
64
37,3
001.
60
6,90
01.
38
3,70
01.
57
3,83
01.
63
6,23
01.
66
1,29
01.
83
365 27
8 1.
66
2,85
01.
60
13,2
001.
71
1,22
01.
49
9,80
01.
65
29,4
001.
60
5,16
01.
36
2,85
01.
55
3,02
01.
68
4,90
01.
65
1,10
01.
86
I
i Rec
ords
for
sta
tion
s on
Van
Duz
en R
iver
at
and
near
Bri
dgev
ille
have
bee
n co
mbi
ned.
00

74 SURFACE-WATER HYDROLOGY, NORTHERN CALIFORNIA
1
ffl < H
38 §3 8$ 8S 88'* rf*4 g04 S-5 eg 84
5JH 35« -
N.e4 ^ci ^CM' ^rn ^M ^M ^M ^ff
>o«» C>o O.H Sco
.N ^N -C
* SiI". l-
3 SS S3 83 S3 ^ - * s* 84
j.e«i .e«i .ei .e«i? 92 55^
O OO
-e< .co o&8! »H
O d§*"" -co
Ob OQt~ =o
is is S O-* Q«2 oo o<°,N ..pi ^.«
CO f*
O toto <o

HIGH FLOW 75
3 4 5 6 8 10 20 30 40 50 RECURRENCE INTERVAL, IN YEARS
FIGURE 25. Dlmenslonless curves of high-flow frequency for subreglon 1.
100
3 4 5 6 8 10 20 30 40 50
RECURRENCE INTERVAL, IN YEARS
FIGURE 26. Dimensionless curves of high-flow frequency for subregion 2.
100

76 SURFACE-WATER HYDROLOGY, NORTHERN CALIFORNIA
The discharge figures in tables 13 and 14 were obtained from the indi vidual frequency curves that had been drawn for each station and each duration period. With very few exceptions, each of these curves for stations in subregions 1 and 2 was linear. Discharges with indicated recurrence intervals of 10 years and 50 years were picked from the curves and then divided by $2.33, to give the ratios listed in tables 13 and 14. From these ratios the composite dimensionless high-flow frequency curves for subregions 1 and 2 were constructed. This was done by selecting the median ratios for the various duration periods (see listing in table 15), and plotting them on figures 25 and 26 to give
15. Characteristics of frequency curves for high flows of various durations in subregions 1 and 2
Recurrence interval
Subregion 1:
Subregion 2:
Ratio to $2.33 for indicated durations (days) of high flow
1
1.81 2.60
1.90 2.79
3
1.77 2.50
1.85 2.68
7
1.68 2.35
1.75 2.49
15 to 365
1.60 2.20
1.60 2.20
the desired curves. The maximum departure of any individual frequency curve from its appropriate regional curve was about 20 percent.
In accordance with the explanation given in the flood-frequency section of this report, it is to be expected that the slopes of the fre quency curves for short duration periods would be steeper in subregion 2 than in subregion 1. This is primarily a result of the greater variability of storm precipitation in subregion 2. For durations of 15 days or more, the effect of differences in storm characteristics is less pronounced and the slopes of the frequency curves in the two sub- regions tend to be similar.
The regional graphs that were derived in this study may be used as guides in constructing frequency curves for various durations of high flow at ungaged sites in either subregion 1 or subregion 2. The pro cedure to be followed is similar to that previously described for con structing flood-frequency curves for ungaged sites.
The information furnished by these magnitude-duration-frequency graphs is useful in studying the hydrologic and economic aspects of reservoir design for flood control. Data picked from these curves would be used to construct a frequency-mass curve that represents the total flood volume produced, for some specified recurrence interval, during duration periods of various lengths. The traditional mass-curve

SURFACE-WATER HYDROLOGY, NORTHERN CALIFORNIA 77
method of analyzing the storage required to limit reservoir outflow rates to some given value would then be applied. This method of analysis is similar to the method explained and illustrated in the closing part of the low-flow analysis section of this report.
REFERENCES CITED
Back, William, 1957, Reconnaissance of geology and ground-water resources of Smith River plain, Del Norte County, Calif.: U.S. Geol. Survey Water Supply Paper 1254, 76 p.
California Dept. of Water Resources, 1960, Klamath River Basin Investiga tion: Bull. 83.
California Water Resources Board, Bull. 2, 1955, Water Utilization and Require ments of California.
Cardwell, G. T., Geology and ground water in Russian River Valley areas and in Round, Laytonville, and Little Lake Valleys, Sonoma and Mendocino Counties, Calif.: U.S. Geol. Survey Water-Supply Paper open-file report.
Dalrymple, Tate, 1960, Flood-frequency analyses: U.S. Geol. Survey Water Supply Paper 1543-A, 80 p.
Evenson, R. E., 1959, Reconnaissance of the geology and ground-water features of the Eureka area, Humboldt County, Calif.: U.S. Geol. Survey Water- Supply Paper 1470.
Irwin, W. P., 1960, Geologic Reconnaissance of the Northern Coast Ranges and Klamath Mountains, California: California Div. Mines Bull. 179.
Kohler, M. A., Nordenson, T. J., and Baker, D. R., 1959, Evaporation Maps for the United States: U.S. Weather Bureau Tech. Paper 37, 13 p.
Linsley, R. K., and Franzini, J. B., 1955, Elements of Hydraulic Engineering: New York, McGraw-Hill Book Company, 582 p.
Mack, Seymour, 1959, Geology and ground-water features of Scott Valley, Siskiyou County, Calif.: U.S. Geol. Survey Water-Supply Paper 1462, 98 p.
1960, Geology and ground-water features of Shasta Valley, Siskiyou County, Calif.: U.S. Geol. Survey Water-Supply Paper 1484, 115 p.
Newcomb, R. C., and Hart, D. H., 1958, Preliminary report on the ground-water resources of the Klamath River basin, Oregon: U.S. Geol. Survey open-file report, 248 p.
Poole, J. L., 1961, Water resources reconnaissance of Hoopa Valley, Humboldt County, Calif.: U.S. Geol. Survey Water-Supply Paper 1576-C, 18 p.
Rantz, S. E., Olmsted, F. H., Brennan, Robert, and Ames, F. C., 1956, Natural Resources of Northern California, Water Resources Appendix: U.S. Dept Interior, Pacific Southwest Field Committee.
U.S. Geological Survey, 1960, Compilation of records of surface waters of the United States through September 1950, Part 11-A, Pacific slope basins in California except Central Valley: U.S. Geol. Survey Water-Supply Paper J315-B, 413 p.
U.S. Geological Survey, Compilation of records of surface waters of the United States, 1951-60, Part 11, Pacific slope basins in California: U.S. Geol. Survey Water-Supply Paper 1735 (in press).
Wood, P. R., 1960 [1961], Geology and ground-water features of the Butte Valley region, Siskiyou County, Calif.: U.S. Geol. Survey Water-Supply Paper 1491, 150 p.
o