Embed Size (px)
Citation preview

Standards
Certification
Education & Training
Publishing
Conferences & Exhibits
Surface Temperature
Measurements from a Stator Vane
Doublet in a Turbine Engine
Afterburner Flame Using a
YAG:Tm Thermographic Phosphor
J.I. Eldridge, NASA Glenn Research Center
D.G. Walker and S.L. Gollub, Vanderbilt University
T.P. Jenkins, MetroLaser, Inc.
S.W. Allison, Emerging Measurements
https://ntrs.nasa.gov/search.jsp?R=20150021279 2018-08-30T08:26:53+00:00Z

Jeff Eldridge
• In a NASA career spanning over twenty-five years, Dr. Eldridge has
most recently worked towards developing spectroscopy-based
health monitoring tools for both space and turbine engine
applications. He has coauthored over 70 publications and has made
over 50 conference presentations and invited tutorials/lectures.
• Dr. Eldridge is a senior scientist of the Optics and
Photonics Branch at NASA Glenn Research Center.
2

Background• Thermographic phosphors for temperature measurements exhibit unique
advantages over thermocouples and pyrometers for turbine engine
environments.– Non-contact
– No interference from reflected radiation
– Insensitive to surface emissivity
– Intrinsically surface sensitive
• AFRL VAATE project successfully demonstrated temperature measurements from thermographic phosphor coated Honeywell stator vane doublet in afterburner flame of AEDC J85-GE-5 turbojet test engine.
Component Testing in Engine Afterburner Flame
Vane doublet with temperature
sensing coating in test fixture.
Afterburner flame from
J85 test engine.
• However, overwhelmed by reflected combustion radiation during Honeywell HTF7000 engine test.
• Challenge: Develop thermographic phosphor that emits at wavelength coinciding with greatly reduced reflected radiation intensity.

350 400 450 500 550 600 650
Inte
ns
ity (
arb
. u
nit
s)
Wavelength nm
Thermographic Phosphor Emission vs. Blackbody Background Intensity
YAG:Tm
YAG:Dy
YSZ:Eu
1200°C blackbody
1800°C blackbody
2000°C blackbody
367 nm455 nm
461 nm
484 nm
497 nm606 nm
591 nm
582 nm x190
x2.5
Thermographic Phosphor Emission vs. Blackbody
Background Intensity
• Blue emission effective for low thermal background produced by hot
surface.
• UV emission will be necessary for low thermal background from
reflected combustor radiation.

Objectives
• Implement blue and UV emission bands from YAG:Tm for
engine probe measurements.
• Demonstrate temperature measurements from YAG:Tm-
coated Honeywell stator vane doublet in afterburner
flame of UTSI J85-GE-5 turbojet test stand.
– Monitor vane surface temperature
– Steady-state conditions
– Engine acceleration

Characterize and Calibrate YAG:Tm Luminescence
Decay Temperature Dependence
(blue and UV Emission)
350 400 450 500
Inte
nsit
y (
arb
. u
nit
s)
Wavelength nm
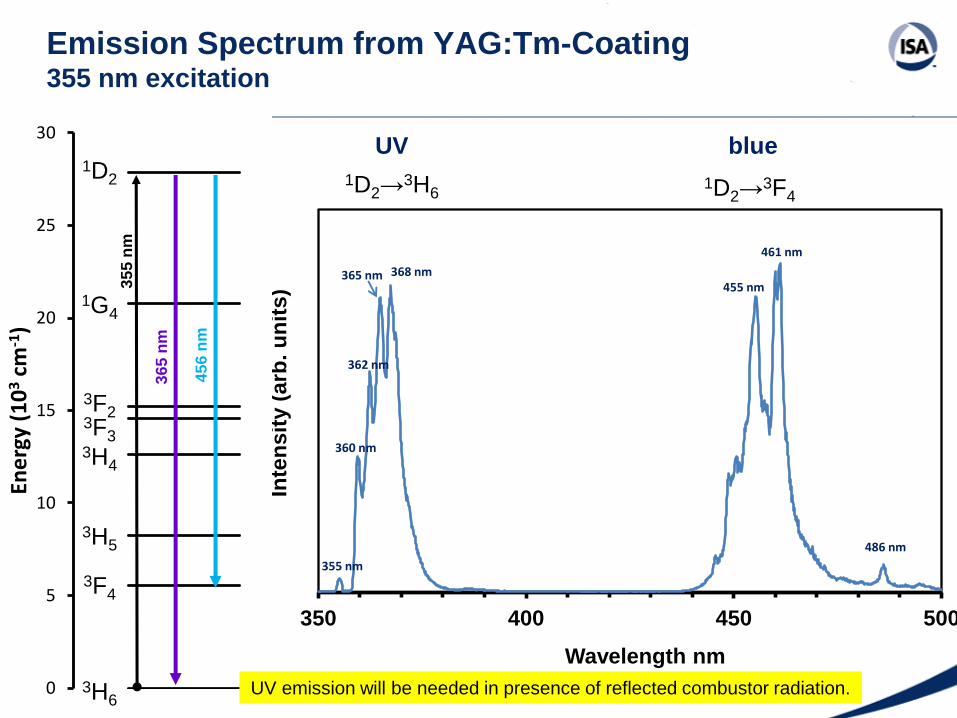
SPPS YAG:Tm-Coated Button355 nm excitation
355 nm
360 nm
362 nm
365 nm 368 nm455 nm
461 nm
486 nm
Emission Spectrum from YAG:Tm-Coating355 nm excitation
0
5
10
15
20
25
30
Ene
rgy
(10
3cm
-1)
3H6
3F4
3H5
3H4
3F3
3F2
1G4
1D23
65
nm
35
5 n
m
45
6 n
m
1D2→3H6
1D2→3F4
UV blue
UV emission will be needed in presence of reflected combustor radiation.

0
100
200
300
400
500
600
700
Ene
rgy
(cm
-1)
27500
27600
27700
27800
27900
28000
28100
28200
Ene
rgy
(10
3cm
-1)
Stark Energy Levels Associated with 3H6→1D2 Absorption and
1D2→3H6 Emission in YAG:Tm Luminescence
0
5
10
15
20
25
30
Ene
rgy
(10
3cm
-1)
3H6
3F4
3H5
3H4
3F3
3F2
1G4
1D2
36
5 n
m
35
5 n
m
3H6(1)
3H6(2)
3H6(3)3H6(4)3H6(5)3H6(6)
3H6(7)
3H6(8)
1D2(1)
1D2(2)
1D2(3)
1D2(5)1D2(4)
27500
27600
27700
27800
27900
28000
28100
28200
Ener
gy (
10
3cm
-1)
27500
27600
27700
27800
27900
28000
28100
28200
Ener
gy (
10
3cm
-1)
27500
27600
27700
27800
27900
28000
28100
28200
Ener
gy (
10
3cm
-1)
0
100
200
300
400
500
600
700
Ene
rgy
(10
3cm
-1)
0
100
200
300
400
500
600
700
Ene
rgy
(10
3cm
-1)
0
100
200
300
400
500
600
700
Ene
rgy
(10
3cm
-1)
357 nm
359 nm
362.5 nm
364.5 nm
367 nm
Five
absorption/emission
bands
1 2 3 4 5
Skipped forbidden transitions between like symmetry Stark levels & transitions involving 3H6(9-13)

0
10000
20000
30000
40000
50000
60000
70000
340 345 350 355 360 365 370
Inte
nsit
y (
arb
.un
its)
Wavelength nm
YAG:Tm(0.8%) Powder Slurry Excitation SpectraEmission @460nm
YAG:Nd third harmonic excitation @354.7 nm
3H6→1D2
1
2
34
5
YAG:Tm(0.8%) Powder Excitation & Emission Spectra
3H6→1D2
350 355 360 365 370 375 380
Inte
nsit
y (
arb
.un
its)
Wavelength nm
YAG:Tm Emission @352nm Excitation powder
352 nm excitation
1
2
3
4 5
1D2→3H6
Excitation Spectrum
@460 nm Emission
Emission Spectrum
@352 nm Excitation
YAG:Nd 3rd harmonic at 355 nm
excites into phonon sideband.
Bandpass
filter
FWHM

5550
5650
5750
5850
5950
6050
6150
6250
Ene
rgy
(cm
-1)
5550
5650
5750
5850
5950
6050
6150
6250
Ene
rgy
(cm
-1)
5550
5650
5750
5850
5950
6050
6150
6250
Ene
rgy
(cm
-1)
5550
5650
5750
5850
5950
6050
6150
6250
Ene
rgy
(cm
-1)
5550
5650
5750
5850
5950
6050
6150
6250En
erg
y (c
m-1
)
27500
27600
27700
27800
27900
28000
28100
28200
Ene
rgy
(10
3cm
-1)
27500
27600
27700
27800
27900
28000
28100
28200
Ene
rgy
(10
3cm
-1)
27500
27600
27700
27800
27900
28000
28100
28200
Ene
rgy
(10
3cm
-1)
27500
27600
27700
27800
27900
28000
28100
28200
Ene
rgy
(10
3cm
-1)
27500
27600
27700
27800
27900
28000
28100
28200
Ene
rgy
(10
3cm
-1)
27500
27600
27700
27800
27900
28000
28100
28200
Ene
rgy
(10
3cm
-1)
Stark Energy Levels Associated with 3H6→1D2 Absorption and
1D2→3F4 Emission in YAG:Tm Luminescence
0
5
10
15
20
25
30
Ene
rgy
(10
3cm
-1)
3H6
3F4
3H5
3H4
3F3
3F2
1G4
1D2
45
6 n
m
35
5 n
m
3F4(1)
1D2(1)
1D2(2)
1D2(3)
1D2(5)1D2(4)
445.3 nm
448.1 nm
450.4 nm
452.7 nm
453.9 nm
Nine emission bands
1 2 3 4 5
3F4(2)
3F4(3)
3F4(4)
3F4(5)
3F4(6)
3F4(7)
3F4(8)
3F4(9)
6 7 8 9
455.1 nm
457.1 nm
459.6 nm
460.8 nm
Skipped forbidden transitions between like symmetry Stark levels & transitions terminating in 3F4(8,9)

440 450 460 470 480
Inte
ns
ity (
arb
.un
its
)
Wavelength nm
YAG:Tm Emission
Coating vs. Powder 355nm Excitation
SPPS coating
powder
YAG:Tm 1D2→3F4 Emission Spectra
1D2→3F4
Emission Spectrum
@355 nm Excitation
1
23
4
5
6
7
89
Bandpass
filter
FWHM
• The 1D2→3F4 emission is more complex than the 1D2→
3H6 emission.
• Broad background in SPPS coating suggests somewhat more disordered structure.

0.00001
0.0001
0.001
0.01
0.0E+00 5.0E-05 1.0E-04 1.5E-04
Inte
nsi
ty (
V)
Time (s)
SPPS YAG:Tm on SS, Batch 1, #G 456nm Decay, 512 Scan Average
15°C
182°C
288°C
384°C
489°C
587°C
636°C
683°C
733°C
782°C
832°C
881°C
930°C
954°C
979°C
1004°C
1028°C
1053°C
1077C
1101°C
0.00001
0.0001
0.001
0.01
0.0E+00 5.0E-05 1.0E-04 1.5E-04
Inte
nsi
ty (
V)
Time (s)
SPPS YAG:Tm on SS, Batch 1, #G 365nm Decay, 512 Scan Average
15°C
184°C
288°C
385°C
489°C
587°C
636°C
684°C
733°C
783°C
832°C
881°C
930°C
954°C
979°C
1004°C
1029°C
1053°C
1078C
1102°C
SPPS YAG:Tm(1.0%) Coating Emission Decay Curves
456 nm Decay
365 nm Decay
1D2→3F4
3H6→1D2
Decay behavior os 365nm emission matches
behavior observed at 456nm emission.
Decay rate (slope) sensitive to temperature
for T > 800°C.

-7.00E+00
-6.50E+00
-6.00E+00
-5.50E+00
-5.00E+00
-4.50E+00
-4.00E+00
-3.50E+00
-3.00E+00
-2.50E+00
-2.00E+00
0.00E+00 2.00E-06 4.00E-06 6.00E-06 8.00E-06 1.00E-05
ln (
Inte
nsity(
V))
Time (sec)
PLA=100, 456nm emission
data
fit
600 ns
60%
10%1 = 961 ns
2 = 5.42 µs
Fitting Procedure for Emission Decay
Fitting Window Selection Based on Probe Data
Model for Emission Decay
12
/
2
/
1 ;
DecayialBiexponent
21
tteIeII
Probe
autofluorescence
spike
Back-reflection of
laser pulse along 50 m
fiber optic cable
1. Select 600 ns as I0. (avoids backreflection peak)
2. Intensity-based fitting window from 60% to 10% I0.
3. Fit with double exponential.
4. Discard1.5. Use 2 for temperature indication.

-8.00E+00
-7.00E+00
-6.00E+00
-5.00E+00
-4.00E+00
-3.00E+00
-2.00E+00
0.00E+00 5.00E-07 1.00E-06 1.50E-06 2.00E-06 2.50E-06 3.00E-06
ln (
Inte
nsity(
V))
Time (sec)
PLA=104, 456nm emission
data
fit
600 ns
60%
10%
= 499 ns
Fitting Procedure for Emission Decay
When fit to double exponential is unstable at high temperatures
Fit with single exponential instead
/0
Decay al ExponentiSingle
teII

Simple model with quenching due to thermally activated nonradiative decay
(by cross-over to charge transfer state).
Modeling Decay Time Temperature Dependence
SPPS YAG:Tm 365 & 456nm emission bands
1
𝝉=
𝟏
𝝉𝑹+
𝟏
𝝉𝑵𝑹𝒆− ∆𝑬
𝒌𝑻
1.00E-07
1.00E-06
1.00E-05
1.00E-04
0 200 400 600 800 1000 1200
De
cay
Tim
e (
s)
T (°C)
456 nm
365 nm
fit

Transitioning from Coupon Specimens to Engine
Component Testing
YAG:Tm coated Honeywell stator vane doubletYAG:Tm coated superalloy coupon
YSZ
NiPtAl (Howmet)
25 m
200 m
Vane
YAG:Tm
EB-PVD
(Penn
State)
SPPS
(UConn)SPPS = solution precursor
plasma spray
EB-PVD = electron-beam
physical vapor deposition
NiPtAl (Chromalloy)
25 m
Rene N5
YAG:TmSPPS
(UConn)
2.54 cm diam
1 cm
30.0°.
FOV-Pressure Side FOV-Suction
Side
.
Turbine Vane Doublet
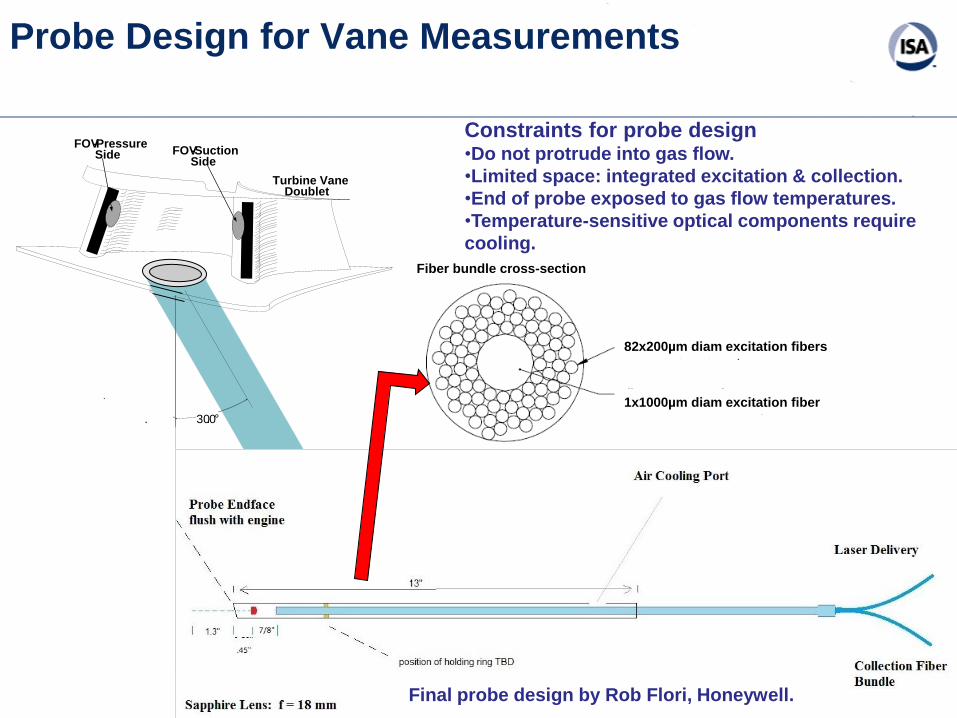
Probe Design for Vane Measurements
Final probe design by Rob Flori, Honeywell.
Constraints for probe design•Do not protrude into gas flow.
•Limited space: integrated excitation & collection.
•End of probe exposed to gas flow temperatures.
•Temperature-sensitive optical components require
cooling.
1x1000µm diam excitation fiber
82x200µm diam excitation fibers
Fiber bundle cross-section

Cooling Fixture for Mounting in Afterburner Flame at
UTSI J85 Test StandHigh-Velocity Exhaust Gas up to 1760ºC
Air-purge
cooling
Water-
cooling
Mounted vane doublet
J85-GE-5 Turbojet Test Stand

0.001
0.01
0.1
1
0.0E+00 5.0E-07 1.0E-06 1.5E-06 2.0E-06 2.5E-06 3.0E-06 3.5E-06 4.0E-06
Inte
nsi
ty (
V)
Time (s)
YAG:Tm 456 nm Decay vs. Temperature from Probe
PLA=96
PLA=98
PLA=100
PLA=102
PLA=104
600 ns
YAG:Tm Emission Decay at Steady-State Afterburner Conditions
456 nm decay
0.001
0.01
0.1
0.0E+00 5.0E-06 1.0E-05 1.5E-05 2.0E-05
Inte
nsi
ty (
V)
Time (s)
YAG:Tm 456 nm Decay vs. Temperature from Probe
PLA=98
PLA=100
PLA=102
PLA=104
Measurements acquired at:
• PLA = 15 (idle)
• PLA = 90 (full military)
• PLA = 94 (with afterburner)
• PLA = 96
• PLA = 98
• PLA = 100
• PLA = 102
• PLA = 104
Each decay was averaged over 16 laser
pulses (20 pulses/s)
PLA = 98 is onset of obvious temperature sensitivity.

0.0001
0.001
0.01
0.1
0.0E+00 5.0E-06 1.0E-05 1.5E-05 2.0E-05 2.5E-05 3.0E-05 3.5E-05
Inte
nsi
ty (
V)
Time (s)
YAG:Tm 365 nm Decay vs. Temperature from Probe
456 nm decay
365 nm decay
0.0001
0.001
0.01
0.1
0.0E+00 5.0E-06 1.0E-05 1.5E-05 2.0E-05
Inte
nsi
ty (
V)
Time (s)
YAG:Tm 365 nm Decay vs. Temperature from Probe
PLA=96
PLA=98
PLA=100
PLA=102
YAG:Tm Emission Decay at Steady-State Afterburner Conditions
Comparison of 456 nm & 365 nm Decay
456 vs 365 nm Decay
PLA = 98
600 ns
2 µs
365 nm Decay
PLA = 96 to 104
2 µs • Much longer, more intense probe
autofluorescence distortion out to 2 µs.
• Can only use decay past 2 µs.
• Data not useable beyond onset of temperature
sensitivity at PLA = 98.
Only 456 nm emission decay could be used
to make temperature measurements for
afterburner tests with probe.
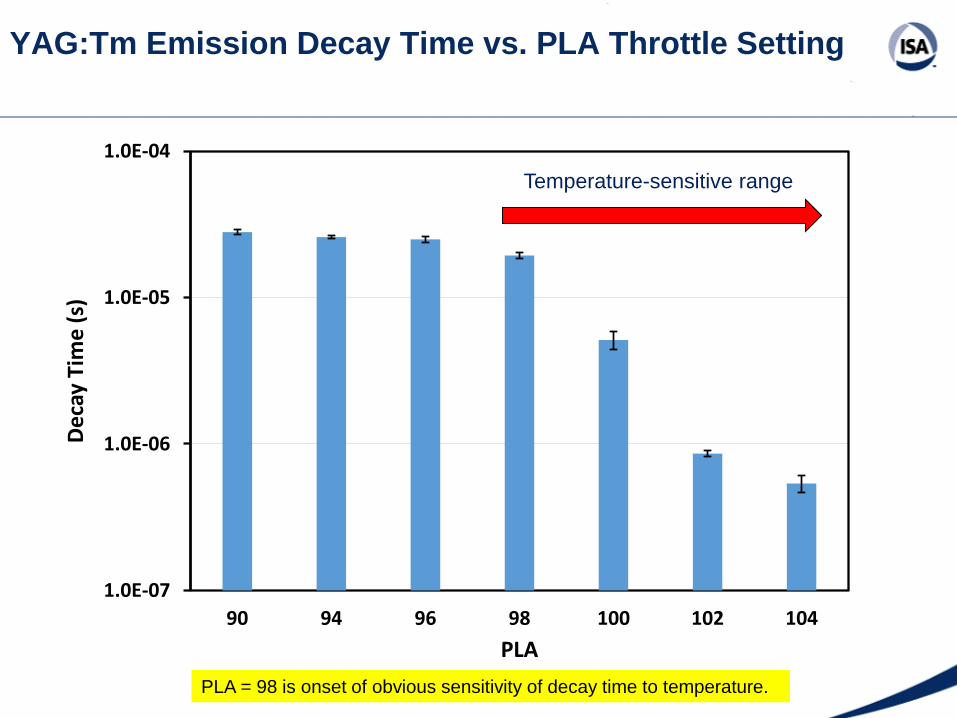
1.0E-07
1.0E-06
1.0E-05
1.0E-04
90 94 96 98 100 102 104
De
cay
Tim
e (
s)
PLA
Decay Time vs PLA Setting
YAG:Tm Emission Decay Time vs. PLA Throttle Setting
Temperature-sensitive range
PLA = 98 is onset of obvious sensitivity of decay time to temperature.

Temperature vs. PLA Throttle Setting(temperature determined from YAG:Tm decay time)
PLA Temp°C
SD°C
98 958.9 +10.0-11.1
100 1114.4 +12.6-11.2
102 1258.0 +4.3-4.1
104 1297.4 +12.3-10.6
• ±5°C at 1250°C!
• 1297°C highest temperature for thermographic phosphor field measurement!

100
101
102
103
104
105
900
950
1000
1050
1100
1150
1200
1250
1300
1350
1400
0 10 20 30 40
PLA
T (°
C)
Time (s)
PLA Ramp 456 nm Emission
Temperature
PLA
T = 1310 ± 14°C
0.001
0.01
0.1
0.0E+00 1.0E-06 2.0E-06 3.0E-06 4.0E-06 5.0E-06 6.0E-06 7.0E-06
Inte
nsi
ty (
V)
Time (s)
456 nm Emission Decay During PLA Ramp
PLA=101
PLA=102
PLA=104
PLA=103
Temperature Measurements During Throttle Accelerationfrom PLA = 94 to 104
~1 Hz temperature reading acquisition rate

Probe Artifacts and Recommended Remedies
• Laser back reflection spike at 530 ns using 50 m
collection fiber optic.
– Remedy: Locate PMT near engine & use short collection fiber.
• Probe introduces distortion of initial decay that is much
more severe for 365 vs. 456 nm emission.
– Greater distortion prevented useful 365 nm emission decay data
from afterburner tests.
– Distortion associated with Raman scattering inside fiber optics
that is worse for 365 nm emission because it is near 355 nm
excitation wavelength.
– Remedy: appropriate short-pass filter at output of laser delivery
fiber and long-pass filter before collection fibers.

Conclusions
• Successfully demonstrated temperature measurements in lab
environment for both blue and UV emission band decays from
YAG:Tm.
• Successfully demonstrated temperature measurements (static &
dynamic) up to 1300°C from YAG:Tm-coated Honeywell stator vane
doublet in afterburner flame of UTSI J85-GE-5 turbojet test stand
using blue YAG:Tm emission band decay.
• Redesign of engine probe optics will allow implementation of UV
YAG:Tm emission band decay for superior rejection of background
reflected combustion radiation.

Acknowledgments
• Funding from NASA Aeronautics Research Mission Directorate.
• AFRL VAATE Project for foundational research and leveraging of
VAATE probe design & cooling mount for afterburner testing.
• Honeywell for providing stator vane doublet & critical aspects of
probe design.
• AEDC/UTSI Propulsion Research Facility Team for conducting J85
afterburner tests.
• Penn State (Doug Wolfe) for EB-PVD coatings.
• UConn (Eric Jordan & Jeff Roth) for SPPS coatings.
• Dave Beshears (EMCO) for testing assistance.