Embed Size (px)
Citation preview

AUTHORS
Michael A. Abrams � Exploration andProduction Technology Apache Corporation,Houston, Texas;[email protected]
Michael A. Abrams is currently the manager ofgeochemistry for Apache Corporation. Beforeworking with Apache, Michael was senior re-search scientist in the University of Utah’s Energyand Geoscience Institute and senior researchgeochemist in Exxon Production Research Com-pany. Michael’s research interests include surfacegeochemistry, petroleum systems evaluation,and migration pathway analysis. Michael re-ceived his Ph.D. from the Imperial College London,a B.S. degree from George Washington Univer-
Surface sediment hydrocarbonsas indicators of subsurfacehydrocarbons: Field calibrationof existing and new surfacegeochemistry methods inthe Marco Polo area,Gulf of MexicoMichael A. Abrams and Nicola F. Dahdah
sity, and an M.S. degree from the University ofSouthern California.
Nicola F. Dahdah � Energy and GeoscienceInstitute University of Utah Salt Lake City, Utah;[email protected]
Nick Dahdah currently manages the organicgeochemistry laboratory at EGI and has beena research scientist with the Institute since 1992,specializing in oil and source rock characteri-zation. He previously worked as a well site ge-ologist for the Natural Resources Authority inJordan. He received a B.S. degree in geologyfrom Southeast Missouri State University andan M.A. degree from the University of SouthCarolina.
ACKNOWLEDGEMENTS
We thank the Surface Geochemistry Calibration(SGC) research project industry supporters andEnergy and Geoscience Institute at the Uni-versity of Utah. Ger van Graas (Statoil), DennisMiller (Petrobras), Harry Dembicki (Anadarko),Neil Frewin (Shell), Andy Bishop (Shell), BradHuizinga (ConocoPhillips), Angelo Riva (ENI),and Peter Eisenach (Wintershall) have all beenextremely helpful during the various phases of
ABSTRACT
Multiple methods are currently used to collect, prepare, ex-tract, and analyze near-surface migrated hydrocarbons frommarine sediments to evaluate subsurface petroleum genera-tion and entrapment. Few have been rigorously tested to eval-uate their effectiveness. A Gulf of Mexico field calibrationsurvey over theMarco Polo field was undertaken as part of anindustry-funded research project to better understand pre-viously published and unpublished seabed geochemical re-sults and determine which gas and liquid hydrocarbon ex-traction methods best characterize migrated hydrocarbons innear-surface sediments.
The Marco Polo calibration data set demonstrates the im-portance of targeted coring and sampling depth. To improvethe detection of seabed migrated thermogenic hydrocarbons,core samples should be collected along major migration path-ways (cross-stratal leakage features) identified by conventionaldeep seismic and high-resolution sea floor imaging. Not alltargeted cores hit the designated feature, and thus, collectingreplicates along key migration features is critical. Collectingsediment samples below the near-surface transition zone knownas the “zone of maximum disturbance” is also important to
the multiyear industry-funded research project.We thank Anadarko Petroleum for allowingthe SGC research project to collect samples atthe Marco Polo field and access to key seismicand geochemical information. We thank HarryDembicki who arranged permission for theMarco Polo location site, chose and monitoredthe core locations, and participated in the
Copyright ©2011. The American Association of Petroleum Geologists. All rights reserved.
Manuscript received August 13, 2010; provisional acceptance November 22, 2010; revised manuscriptreceived January 24, 2011; final acceptance March 21, 2011.DOI:10.1306/03211110130
AAPG Bulletin, v. 95, no. 11 (November 2011), pp. 1907– 1935 1907
cruise. We thank W. L. Gore and Associatesand Taxon Biosciences, which provided staffand laboratory analysis at no cost. We thankFugro and the Seis Surveyor crew as well asthe shipboard research staff Harry Dembicki(Anadarko), Matt Ashby (Taxon), Shuanglin Li(Qingdoa Institute of Marine Geology), RowlandRincon (Peregrine Ventures), and Chris Reny(Peregrine Ventures). The figures were drafted byJeffrey Massara with Apache Corporation. Re-views by Harry Dembicki, Barry Katz, and anunnamed reviewer were very helpful.The AAPG Editor thanks the following for theirwork on this paper: Harry Dembicki Jr., Barry J.Katz, and an anonymous reviewer.
1908 Surface Sediment Hydrocarbons as Indica
avoid possible alteration effects and interference by recent or-ganic matter.
Geochemical analysis should include a full range of hy-drocarbon types: light hydrocarbon gases (C1–C5), gasolinerange (C5–C10+), and high-molecular-weight (HMW) hydro-carbons (C15+). The interstitial sediment gas data should beplotted on a total hydrocarbon gas (S C1–C5) versus wet gasfraction (S C2–C5/S C1–C5) chart to identify background,fractionated, and anomalous populations. Compound-specificisotopic analysis on selected anomalous samples is critical tocorrectly identify migrated subsurface gases from near-surfacegenerated microbial gases. Microdesorption bound gases didnot provide gas compositions or compound-specific isotoperatios similar to the Marco Polo reservoir gases, and thus, thebound gas extraction is not recommended. A gasoline rangeanalysis provides a new range of hydrocarbons rarely examinedin surface geochemical studies that assist in identifying ther-mogenic hydrocarbons. Extraction gas chromatography andtotal scanning fluorescence (TSF) maximum fluorescence in-tensity provided information on the presence of thermogenicHMW hydrocarbons but did not work as well with the low-level microseepage samples. The TSF fluorogram signaturewas similar for both seep and regional reference (background)samples and did not help to identify migrated thermogenichydrocarbons.
The Marco Polo calibration study provides a frameworkto better understand how best to collect (targeted deep cores)and extract migrated hydrocarbons from near-surface marinesediments and to evaluate the results.
INTRODUCTION
Multiple methods are currently applied to collect, prepare,extract, and analyze near-surfacemigrated hydrocarbons frommarine sediments to evaluate subsurface petroleum genera-tion (Horvitz, 1985; Brooks and Carey, 1986; Abrams et al.,2001; Abrams, 2005; Logan et al., 2009; and Abrams andDahdah, 2010). Many of the sediment hydrocarbon extrac-tion procedures currently used by the industry are based onsampling and laboratory protocols initially designed for wellcuttings and have not always been rigorously tested to evaluatetheir effectiveness with unconsolidated marine sediments. Anextensive series of literature and data reviews, laboratory tests,and field studies have been conducted as part of an industry-funded Surface Geochemistry Calibration (SGC) research proj-ect conductedby theUniversity ofUtah’s Energy andGeoscience
tors of Subsurface Hydrocarbons

Institute. The multiphase SGC research projectwas organized to better understand previous sea-bed geochemical results both published and un-published and determine which sediment hydro-carbon (gas and liquid) extraction methods bestcharacterize migrated near-surface sediment hy-drocarbons (Abrams, 2002).
The SGC Gulf of Mexico Marco Polo field cal-ibration survey was designed to field test specificanalytical procedures examined in the laboratorystudies as well as several emerging and existingtechnologies. The Gulf of MexicoMarco Polo fieldwas chosen because it is an area of known petro-leum leakage based on previous seismic and geo-chemical surveys (Chaouche et al., 2004; Dembickiand Samuels, 2007), reservoir geochemical dataavailable (Abrams andDembicki, 2006), and high-quality shallow seismic imaging data acquired(Dembicki and Samuels, 2007).
The near-surface sediment geochemical meth-ods examined in the Marco Polo field calibrationsurvey can be subdivided into three categories:light hydrocarbon gas (C1–C5), gasoline-range hy-
drocarbons (C5–C10+), and high-molecular-weight(HMW) hydrocarbons (C15+). The light hydrocar-bons were examined using two different sedimentgas extraction methods: interstitial (conventionalcan headspace and modified headspace methodcalled “disrupter analysis”) and adsorbed-bound(microdesorption analysis). The gasoline-range hy-drocarbons were examined by two different ana-lytical procedures, disrupter headspace solid-phasemicroextraction (HSPME) and Gore Module. TheHMW hydrocarbons were examined using sol-vent extraction followed by whole-extract gas chro-matography (GC) and total scanning fluorescence(TSF).
The purpose of this article is to provide anoverview of the Marco Polo field SGC survey re-sults for different seepage types and to better un-derstand how the different methods characterizethe seeping hydrocarbons. This article providesguidance on best practices for seabed geochemicalsurveys based on both previously published lab-oratory experiments and the Marco Polo field cal-ibration survey results.
Figure 1. The Marco Polo field is approximately 175 mi (∼281 km) south of New Orleans, Louisiana, in blocks 563, 607, and 608 GreenCanyon Gulf of Mexico in approximately 4000 ft (∼1219 m) of water.
Abrams and Dahdah 1909

FIELD OPERATIONS
Study Area
The Marco Polo field is approximately 175 mi(281 km) southofNewOrleans, Louisiana, in blocks563, 607, and 608GreenCanyonGulf ofMexico inapproximately 4000 ft (1219m) ofwater (Figure 1).The Marco Polo field is located in a salt-boundedminibasin with petroleum production from supra-
1910 Surface Sediment Hydrocarbons as Indicators of Subsurfa
salt Miocene reservoir sands (Chaouche et al., 2004).Geochemical analysis of reservoir fluids by AnadarkoPetroleum indicates that the medium-gravity oiloriginated from amarine type II organic matter typeconsistent with generation from the subsalt upperJurassic source rocks (see Chaouche et al., 2004,for details). Areas of fluid movement from the res-ervoir to near surface had been identified on thewestern side of the field area (Green Canyon Block607) by the presence of mud mounds (volcanoes),
Table 1. Core Description with Target Classification and Depth Information
Seep Feature
ce Hydrocarbons
Core
Depth SubsamplesCore No.
(based on seismic feature, previous survey) Target Type Length (m) A (cm) B (cm) C (cm)1
Outside Marco Polo minibasin Regional reference 3.65 156 239 322 2 Outside seep feature Near seep zone 3.90 181 264 347 3 Outside seep feature Near seep zone 4.77 268 351 434 4 Edge potential seepage Near seep zone 3.72 163 246 329 5 Inside area of seepage Within seep zone 4.96 287 370 453 6 Replicate Core 5 Within seep zone 4.19 210 293 376 7 Previous survey oil stained Within seep zone 4.17 208 291 374 8 Replicate Core 7 Within seep zone 4.23 214 297 380 9 Replicate Core 7 Within seep zone 4.04 195 278 361 10 Inside area of seepage Within seep zone 2.46 37 120 203 11 Inside area of seepage Within seep zone 4.29 220 303 396 12 Outside seep feature Near seep zone 5.33 324 407 490 13 Inside area of seepage–edge Within seep zone 3.79 170 253 336 14 Previous survey oil stained with hydrate Within seep zone 0.31 NA NA 0 15 Edge potential seepage Near seep zone 4.02 193 276 359 16 Outside seep feature Near seep zone 4.42 233 316 399 17 Outside seep feature Near seep zone 3.40 131 214 297 18 Near seeping fault along mud volcano Within seep zone 3.67 158 241 324 19 On mud volcano Within seep zone 3.85 176 259 342 20 Flank mud volcano Near seep zone 3.42 133 216 299 21 On mud volcano Within seep zone 0.70 NA 0 33 22 Flank mud volcano Within seep zone 1.76 NA 60 143 23 Flank mud volcano Within seep zone 0.50 NA NA 10 24 Flank mud volcano Within seep zone 3.78 169 252 335 25 Outside north edge mud volcano Near seep zone 5.33 323 406 489 26 Outside north edge mud volcano Near seep zone 3.66 157 240 323 27 Outside seep feature Near seep zone 3.31 122 205 288 28 Outside seep feature Near seep zone 3.73 164 197 280 29 Outside seep feature Near seep zone 3.63 154 237 320 30 Outside seep feature Near seep zone 3.70 161 244 328 31 Outside seep feature Near seep zone 2.89 80 163 246 32 Outside seep feature Near seep zone 3.14 105 188 271 33 Outside Marco Polo minibasin Regional reference 2.79 70 153 236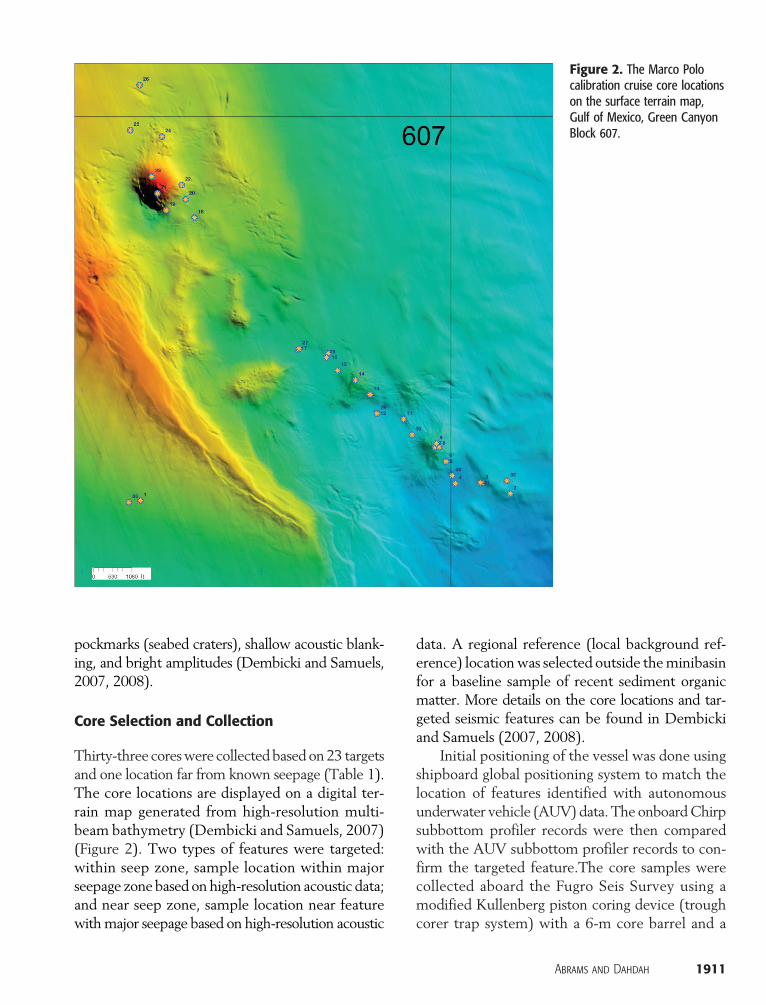
pockmarks (seabed craters), shallow acoustic blank-ing, and bright amplitudes (Dembicki and Samuels,2007, 2008).
Core Selection and Collection
Thirty-three coreswere collectedbased on23 targetsand one location far from known seepage (Table 1).The core locations are displayed on a digital ter-rain map generated from high-resolution multi-beam bathymetry (Dembicki and Samuels, 2007)(Figure 2). Two types of features were targeted:within seep zone, sample location within majorseepage zone based onhigh-resolution acoustic data;and near seep zone, sample location near featurewithmajor seepage based on high-resolution acoustic
data. A regional reference (local background ref-erence) locationwas selected outside theminibasinfor a baseline sample of recent sediment organicmatter. More details on the core locations and tar-geted seismic features can be found in Dembickiand Samuels (2007, 2008).
Initial positioning of the vessel was done usingshipboard global positioning system to match thelocation of features identified with autonomousunderwater vehicle (AUV) data. The onboardChirpsubbottom profiler records were then comparedwith the AUV subbottom profiler records to con-firm the targeted feature.The core samples werecollected aboard the Fugro Seis Survey using amodified Kullenberg piston coring device (troughcorer trap system) with a 6-m core barrel and a
Figure 2. The Marco Polocalibration cruise core locationson the surface terrain map,Gulf of Mexico, Green CanyonBlock 607.
Ab
rams and Dahdah 1911
Table 2. Marco Polo Surface Geochemistry Calibration Can Headspace and Disrupter Interstitial Sediment Gas Data
1912
Surface Se diment Hydrocarbons asCan Headspace
Indicators of Subsurface Hydrocarbons
Disrupter Headspace
Core No.
CoreSectionCore TargetClassification
Methane(ppm)
Sum WetGases (ppm)
Wet GasFraction
Methane(ppm)
Sum WetGases (ppm)
Wet GasFraction
EGI 01
A Regional reference 6 1 0.14 9 2 0.17 EGI 01 B Regional reference 7 1 0.10 16 5 0.23 EGI 01 C Regional reference 8 2 0.18 11 4 0.27 EGI 02 A Near seep zone 11 2 0.14 15 3 0.18 EGI 02 B Near seep zone 19 4 0.16 30 6 0.16 EGI 02 C Near seep zone 16 2 0.12 35 4 0.09 EGI 03 A Near seep zone 11 1 0.11 11 3 0.22 EGI 03 B Near seep zone 22 3 0.10 22 4 0.16 EGI 03 C Near seep zone 13 2 0.13 21 4 0.14 EGI 04 A Near seep zone 8 1 0.12 12 2 0.12 EGI 04 B Near seep zone 59 2 0.03 19 3 0.14 EGI 04 C Near seep zone 12 2 0.12 25 3 0.11 EGI 05 A Within seep zone 21 3 0.11 21 4 0.17 EGI 05 B Within seep zone 10 2 0.17 17 5 0.23 EGI 05 C Within seep zone 22 1 0.05 40 2 0.06 EGI 06 A Within seep zone 10 1 0.11 18 3 0.15 EGI 06 B Within seep zone 10 1 0.08 21 4 0.15 EGI 06 C Within seep zone 16 2 0.10 25 3 0.10 EGI 07 A Within seep zone 31 3 0.08 45 2 0.05 EGI 07 B Within seep zone 42 3 0.06 111 2 0.02 EGI 07 C Within seep zone 112 5 0.04 273 6 0.02 EGI 08 A Within seep zone 168 3 0.02 206 3 0.02 EGI 08 B Within seep zone 206 9 0.04 831 14 0.02 EGI 08 C Within seep zone 14,262 61 0.00 23,710 66 0.00 EGI 09 A Within seep zone 32 3 0.07 92 2 0.02 EGI 09 B Within seep zone 53 4 0.06 126 3 0.02 EGI 09 C Within seep zone 166 4 0.02 249 4 0.01 EGI 10 A Within seep zone 43,083 1177 0.03 71,454 991 0.01 EGI 10 B Within seep zone 120,570 7978 0.06 136,500 3843 0.03 EGI 10 C Within seep zone 147,738 6384 0.04 181,780 5212 0.03 EGI 11 A Within seep zone 191 6 0.03 268 6 0.02 EGI 11 B Within seep zone 2736 25 0.01 4364 27 0.01 EGI 11 C Within seep zone 79,531 121 0.00 202,040 220 0.00 EGI 12 A Near seep zone 407 7 0.02 179 5 0.03 EGI 12 B Near seep zone 9206 2421 0.21 21,398 59 0.00 EGI 12 C Near seep zone 48,260 149 0.00 105,618 205 0.00 EGI 13 A Within seep zone 74,639 224 0.00 110,879 299 0.00 EGI 13 B Within seep zone 39,127 553 0.01 490,720 4331 0.01 EGI 13 C Within seep zone 41,999 123 0.00 87,892 172 0.00 EGI 14 C Within seep zone 5052 89 0.02 4179 58 0.01 EGI 15 A Near seep zone 106,017 1309 0.01 161,053 2176 0.01 EGI 15 B Near seep zone 187,246 552 0.00 234,324 526 0.00 EGI 15 C Near seep zone 64,710 403 0.01 211,839 1199 0.01 EGI 16 A Near seep zone 7 1 0.10 3497 22 0.01 EGI 16 B Near seep zone 2387 5 0.00 223,696 206 0.00
Table 2. Continued
Can Headspace
Disrupter HeadspaceCore No.
CoreSectionCore TargetClassification
Methane(ppm)
Sum WetGases (ppm)
Wet GasFraction
Methane(ppm)
Abrams a
Sum WetGases (ppm)
nd Dahdah
Wet GasFraction
EGI 16
C Near seep zone 185 2 0.01 234,874 202 0.00 EGI 17 A Near seep zone 16 1 0.04 11 2 0.18 EGI 17 B Near seep zone 20 3 0.14 15 4 0.20 EGI 17 C Near seep zone 15 2 0.11 17 4 0.20 EGI 18 A Within seep zone 22 3 0.12 25 5 0.17 EGI 18 B Within seep zone 26 5 0.16 31 5 0.14 EGI 18 C Within seep zone 29 7 0.19 16 6 0.27 EGI 19 A Within seep zone 81 3 0.03 113 3 0.02 EGI 19 B Within seep zone 310 8 0.02 427 10 0.02 EGI 19 C Within seep zone 11,750 78 0.01 24,238 116 0.00 EGI 20 A Near seep zone 180 4 0.02 384 8 0.02 EGI 20 B Near seep zone 4125 31 0.01 13,253 58 0.00 EGI 20 C Near seep zone 111,873 110 0.00 206,623 167 0.00 EGI 21 B Within seep zone 102,222 10,581 0.09 149,638 7484 0.05 EGI 21 C Within seep zone 105,464 16,270 0.13 147,362 11,699 0.07 EGI 22 B Near seep zone 85,849 463 0.01 153,412 395 0.00 EGI 22 C Near seep zone 68,002 69 0.00 133,143 156 0.00 EGI 23 C Near seep zone 49,834 504 0.01 164,486 2163 0.01 EGI 24 A Near seep zone 145 7 0.04 222 5 0.02 EGI 24 B Near seep zone 193 3 0.01 325 8 0.02 EGI 24 C Near seep zone 1076 15 0.01 2259 46 0.02 EGI 25 A Near seep zone 294 3 0.01 381 7 0.02 EGI 25 B Near seep zone 9800 19 0.00 45,563 52 0.00 EGI 25 C Near seep zone 24,673 21 0.00 51,987 48 0.00 EGI 26 A Near seep zone 10 1 0.12 11 4 0.27 EGI 26 B Near seep zone 13 2 0.15 10 4 0.30 EGI 26 C Near seep zone 20 2 0.07 16 6 0.28 EGI 27 A Near seep zone 19 2 0.10 6 3 0.29 EGI 27 B Near seep zone 5 1 0.22 19 4 0.19 EGI 27 C Near seep zone 46 3 0.06 22 4 0.16 EGI 28 A Near seep zone 112 2 0.01 166 4 0.02 EGI 28 B Near seep zone 480 7 0.01 968 17 0.02 EGI 28 C Near seep zone 68,185 75 0.00 87,801 78 0.00 EGI 29 A Near seep zone 22 2 0.08 31 2 0.07 EGI 29 B Near seep zone 56 2 0.03 88 4 0.04 EGI 29 C Near seep zone 91 2 0.02 183 4 0.02 EGI 30 A Near seep zone 7 1 0.14 70 5 0.06 EGI 30 B Near seep zone 9 3 0.25 17 4 0.19 EGI 30 C Near seep zone 13 9 0.40 11 4 0.25 EGI 31 A Near seep zone 14 8 0.35 81 8 0.09 EGI 31 B Near seep zone 17 4 0.18 12 6 0.32 EGI 31 C Near seep zone 21 8 0.28 18 9 0.33 EGI 32 A Near seep zone 25 3 0.10 8 3 0.30 EGI 32 B Near seep zone 22 2 0.07 25 3 0.11 EGI 32 C Near seep zone 37 3 0.07 19 5 0.211913
6.7-cm internal diameter. The deep-water pistoncorer was launched and retrieved using a rotatingA-frame high-speed hydroelectric dual winch. The33 cores range in length from 0.5 to 5.3 m (1.6–17.4 ft) with an average recovery of 3.5m (11.5 ft)(Table 1). Three core sections were collected fromeach sediment core: top (∼0.5–2.0m [∼1.6–6.6 ft]),middle (∼2.0–3.0 m [∼6.6–9.8 ft]), and bottom(∼3.0–5.0 m [∼9.8–16.4 ft]). Each core sectionwas subdivided in the shipboard laboratory andprocessed using the analytical protocols providedby the participating laboratories or established inthe SGC laboratory studies: a 5-cm subsectionplaced in Gore Module sample container with asorber; replicate 10-cm sample splits placed in adisrupter container (500-mLplastic container witha screw on sealing cap, built-in septum, and in-ternal blades; see Abrams and Dahdah, 2010, for
1914 Surface Sediment Hydrocarbons as Indicators of Subsurfa
details) and a metal can for interstitial gas analysis;3-cm sample placed in a plastic bag for micro-desorption analysis; and replicate 10-cm samplesplits were wrapped in aluminum foil for solventextraction.
ANALYTICAL PROCEDURES
Sediment Gas Analysis
The conventional can headspace method is a non-mechanical procedure that uses high-speed shak-ing to release vapor-phase interstitial sediment gasesinto the can headspace (Bernard, 1978). A 500-mLmetal can is filledwith 170mLof sediment, 160mLof 3.5% NaCl in H2O solution, and the remainingheadspace is flushed with N2 gas. The sample can
Table 2. Continued
Can Headspace
ce Hydrocarbons
Disrupter Headspace
Core No.
CoreSectionCore TargetClassification
Methane(ppm)
Sum WetGases (ppm)
Wet GasFraction
Methane(ppm)
Sum WetGases (ppm)
Wet GasFraction
EGI 33
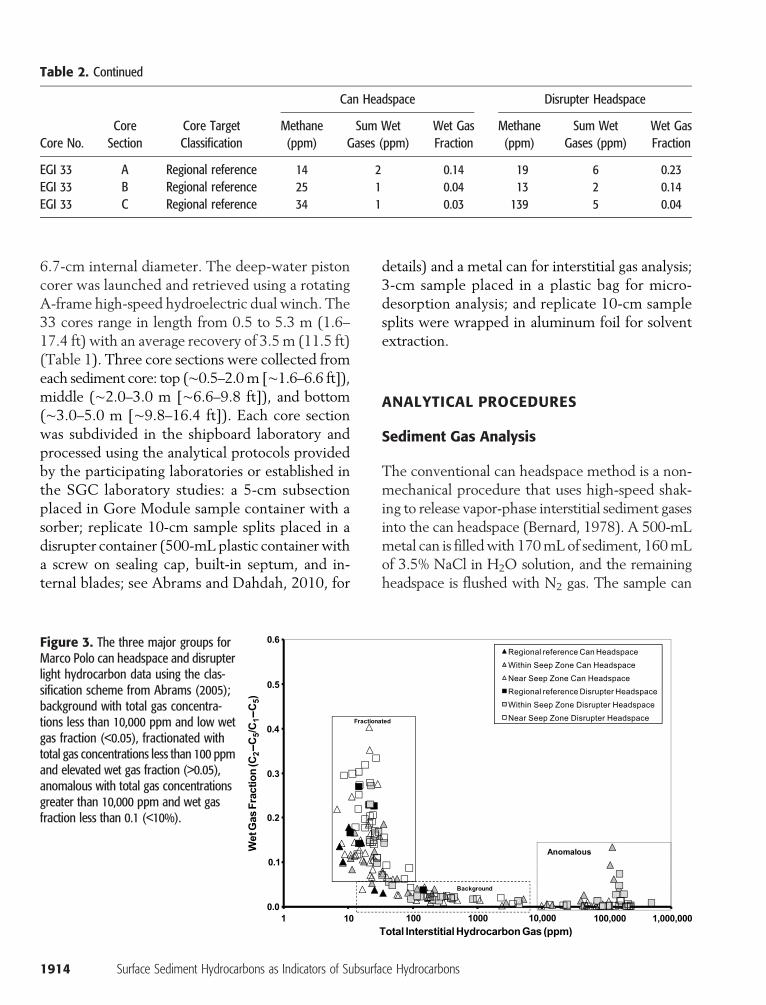
A Regional reference 14 2 0.14 19 6 0.23 EGI 33 B Regional reference 25 1 0.04 13 2 0.14 EGI 33 C Regional reference 34 1 0.03 139 5 0.04Figure 3. The three major groups forMarco Polo can headspace and disrupterlight hydrocarbon data using the clas-sification scheme from Abrams (2005);background with total gas concentra-tions less than 10,000 ppm and low wetgas fraction (<0.05), fractionated withtotal gas concentrations less than 100 ppmand elevated wet gas fraction (>0.05),anomalous with total gas concentrationsgreater than 10,000 ppm and wet gasfraction less than 0.1 (<10%).

with mud and processed water is stored frozen.The can is thawed for 24 hr before analysis, heatedto 40°C for 4 hr, and shaken vigorously using aconventional paint shaker. The headspace gas iscollected by syringe and injected in the gas chro-matograph for compositional analysis. See Bernard(1978) for more details.
The disrupter sediment gas extraction methodwas designed as part of the SGC laboratory studiesto capture interstitial gases not easily released byvigorous shaking (Abrams andDahdah, 2010). Thedisrupter method uses a 165-mL sediment samplethat is placed in a 500-mL disrupter chamber with165 mL of saturated salt brine solution and remain-ing volume air headspace. The disrupter chamberhas a fixed internal blade that breaks apart the sedi-ment, releasing interstitial gases without crushing(Abrams and Dahdah, 2010). The disrupter withsample is frozen on the vessel, then shipped andstored frozen until analysis. The disrupter is thawedto room temperature 24 hr before analysis andshaken for 5min using a high-speed unidirectionalpaint can shaker. A 0.2-mL disrupter headspacesample is collected by a syringe through the dis-rupter cap septum at room temperature and in-jected into the GC inlet. See Abrams and Dahdah(2010) for more details.
The bound gases are believed to be attached toorganic and/or mineral surfaces, entrapped in struc-tured water, or entrapped in authigenic carbonateinclusions and thus require a more rigorous proce-dure to remove (Horvitz, 1985; Bjoroy and Ferriday,2002;Whiticar, 2002). Themicrodesorption boundsediment gas extraction method (Whiticar, 2002)uses a 300- to 400-mL bulk sediment sample thathas been stored frozen in a plastic bag. A fixedweight of wet sediment sample (1–3 g) is placed ina reaction vessel, sealed, and evacuated. A smallamount of saline water is added, and the sediment-water slurry is mixed using a vortex ultrasonic mixer.The interstitial gases are removed by vacuum. Phos-phoric acid is added under reduced pressure wherethe sorbed gas is released to the vessel headspace.Potassium hydroxide is added before GC to reducecarbonate-generated carbon dioxide. The pressureis increased and sample aliquots of gas are collectedfor GC analysis. See Whiticar (2002) for details.
Gasoline-Range (C5–C10+)Hydrocarbon Analysis
Two methods were used in the Marco Polo fieldcalibration survey to evaluate sediment gasoline-range hydrocarbons, theGoreModule and disrupterHSPME. The Gore method evaluates a full rangeof hydrocarbons from C2 to C20+ using a speciallyengineered hydrophobic adsorbent encased in amicroporous expanded Gore Module polytetra-fluoroethylene membrane (Anderson, 2006). TheGore Module is placed in a special glass containerwith a designated volume of sediment and analyzedvia thermal desorption coupled with mass spec-trometry (MS). See theW. L. Gore and AssociatesWeb page for additional details. (www.gore.com)
The HSPME headspace sample is collectedafter the disrupter headspace gas analysis. A 1-cmfused silica fiber coated with 100-mm-thick poly-dimethylsiloxane is inserted into the headspace fora 20-min extraction, then manually injected intothe GC inlet for desorption. The SPME fiber is leftin theGC inlet for 5min. See Abrams et al. (2009)for details.
High-Molecular-Weight Hydrocarbon Analysis
Adried sediment sample is ground to a uniform sizeand an aliquot by weight is extracted using hex-ane in an automated extraction apparatus (DionexASE 200 Accelerated Solvent Extractor). Extractsare concentrated to a final volume of 8 mL usingZymark TurboVap II. The final extracts are sub-mitted for hydrocarbon analysis by GC flame ion-ization detection (FID) and TSF. See Brooks et al.(1983) for additional information.
RESULTS AND DISCUSSION
Sediment Gas Analysis
Interstitial Gas EvaluationThe can headspace and disrupter data are summa-rized in Table 2 and plotted on a total hydrocarbongas (S C1–C5) versus wet gas fraction (S C2–C5/SC1–C5) plot (Figure 3). Both interstitial sediment gas
Abrams and Dahdah 1915

extraction methods provide similar results. Threemajor groups exist for both interstitial sedimentgas data sets using the classification scheme fromAbrams (2005): background with total gas concen-trations less than 10,000 ppm and low wet gasfraction (<0.05); fractionated with total gas con-centrations less than 100 ppm and elevated wetgas fraction (>0.05); and anomalous with total gasconcentrations greater than 10,000 ppm and wetgas fraction less than 0.1 (10%). The cutoffs arebased on an examination of a worldwide surfacegeochemistry database (Abrams, 2005).
Examination of the three sediment gas groupsrelative to the pre-survey core targets (within seepzone, near seep zone, and regional reference) re-veals interesting observations. The regional refer-ence core samples fall within the background andfractionated samples. The fractionated group wasdefined in Abrams (2005) to represent very lowconcentration samples (<100 ppm) with differen-tial volatile loss (methane loss greater than the wetgases) that results in wet gas enrichment. This is acommon feature noted in most interstitial sedimentgas seabed surveys (Abrams, 2005) and SGC lab-oratory experiments (Abrams et al., 2009).
The within-seep-zone and near-seep-zone tar-geted cores fall within all three groups: background,fractionated, and anomalous. Note the relativelylarge number of cores collected from within seepzone and near seep zone based on AUV acousticdata that contain very low total interstitial hydro-carbon gas (<10,000 ppm). Several reasons existwhy near-surface sediment cores collected within aseep feature contain low levels of total interstitialsediment hydrocarbon gas. First, the core sampleswere collected within the transition zone known asthe zoneofmaximumdisturbance (ZMD) (Abrams,1992). Samples collected within the ZMD may bealtered by microbial processes or pore water flush-ing (Abrams, 1996) unless the seepage volume andrate overwhelm the alteration processes (Abrams,2005). A plot of core sampling depth versus totaldisrupter headspace interstitial hydrocarbon gasindicates that the ZMD is approximately 2.0 m(6.6 ft) based on the near-seep-zone samples withelevated total gases (>10,000 ppm) relative to sam-ple depth (Figure 4). Note that the ZMDwill vary
1916 Surface Sediment Hydrocarbons as Indicators of Subsurfa
for each petroleum seepage system (Abrams, 1996,2005).
The second and more fundamental issue iscollecting cores within the chosen targeted fea-ture. Sampling a relatively small target in 4000 ft(1219.2 m) of water with a gravity corer is very dif-ficult. Many of the cores collected within the MarcoPolo survey did not sample the targeted featurebased on the geochemistry results. Abrams (1992)demonstrated the importance of sampling depthand hitting the target by collecting core samplesfrom an anchored drill ship using shallow drillingtechnology on and off a known hydrocarbon seep-ing fault. The drill ship survey showed that themigrated thermogenic signal was quickly lost fromdeep sediment cores collected15 to 25m (49–92 ft)away from the migration pathway (leaky fault).The Marco Polo calibration data set reinforces the
Figure 4. The plot of core sampling depth versus total disrupterheadspace interstitial hydrocarbon gas indicates the zone ofmaximum disturbance (ZMD) is approximately 2.0 m (6.6 ft).The within-seep-zone samples have elevated total gas concen-trations within and below the ZMD, whereas the near-seep-zone samples have elevated total gas concentrations only belowthe ZMD.
ce Hydrocarbons
importance of good seismic data to define the seepfeature and a core collection protocol with theability to hit the targeted feature at 2+m below thewater-sediment interface.
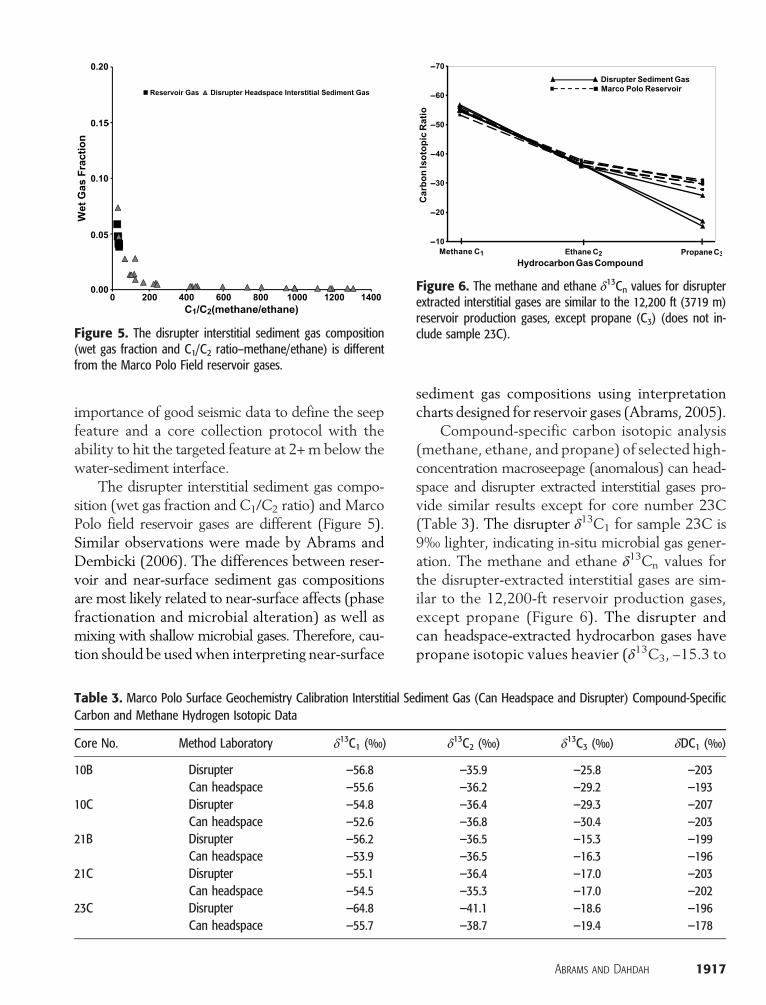
The disrupter interstitial sediment gas compo-sition (wet gas fraction and C1/C2 ratio) and MarcoPolo field reservoir gases are different (Figure 5).Similar observations were made by Abrams andDembicki (2006). The differences between reser-voir and near-surface sediment gas compositionsare most likely related to near-surface affects (phasefractionation and microbial alteration) as well asmixing with shallow microbial gases. Therefore, cau-tion should be used when interpreting near-surface
sediment gas compositions using interpretationcharts designed for reservoir gases (Abrams, 2005).
Compound-specific carbon isotopic analysis(methane, ethane, and propane) of selected high-concentration macroseepage (anomalous) can head-space and disrupter extracted interstitial gases pro-vide similar results except for core number 23C(Table 3). The disrupter d13C1 for sample 23C is9‰ lighter, indicating in-situ microbial gas gener-ation. The methane and ethane d13Cn values forthe disrupter-extracted interstitial gases are sim-ilar to the 12,200-ft reservoir production gases,except propane (Figure 6). The disrupter andcan headspace-extracted hydrocarbon gases havepropane isotopic values heavier (d13C3, –15.3 to
Figure 5. The disrupter interstitial sediment gas composition(wet gas fraction and C1/C2 ratio–methane/ethane) is differentfrom the Marco Polo Field reservoir gases.
Figure 6. The methane and ethane d13Cn values for disrupterextracted interstitial gases are similar to the 12,200 ft (3719 m)reservoir production gases, except propane (C3) (does not in-clude sample 23C).
Table 3. Marco Polo Surface Geochemistry Calibration Interstitial Sediment Gas (Can Headspace and Disrupter) Compound-Specific
Carbon and Methane Hydrogen Isotopic DataCore No.
Method Laboratory d13C1 (‰) d13C2 (‰)A
d13C3 (‰)
brams and Dahdah
dDC1 (‰)
10B
Disrupter −56.8 −35.9 −25.8 −203 Can headspace −55.6 −36.2 −29.2 −19310C
Disrupter −54.8 −36.4 −29.3 −207 Can headspace −52.6 −36.8 −30.4 −20321B
Disrupter −56.2 −36.5 −15.3 −199 Can headspace −53.9 −36.5 −16.3 −19621C
Disrupter −55.1 −36.4 −17.0 −203 Can headspace −54.5 −35.3 −17.0 −20223C
Disrupter −64.8 −41.1 −18.6 −196 Can headspace −55.7 −38.7 −19.4 −1781917

Table 4. Marco Polo Surface Geochemistry Calibration Microdesorption Sediment Gas Data
1918
Depth
Surface S
Core Target
ediment Hydrocarbons a
s Indicators of SuTotal Gas
bsurface Hydr
Wet Gas
ocarbons
Carbon Isotopes
Sample ID
Section Classification C1 (nmol/g) (nmol/g) Fraction C1 C2 C3 iC4 NC4EGI 01
A Regional reference 236 253 0.07 −56.0 −32.3 −32.5 −34.0 −31.0 EGI 01 B Regional Reference 256 278 0.08 −52.3 −32.0 −30.8 −33.0 −31.0 EGI 01 C Regional Reference 277 303 0.09 −48.7 −33.2 −31.5 −31.0 −31.0 EGI 02 A Near seep zone 267 287 0.07 −54.6 −32.4 −31.1 −33.0 −30.0 EGI 02 B Near seep zone 286 309 0.07 −51.1 −31.9 −30.5 −33.0 −30.0 EGI 02 C Near seep zone 200 220 0.09 −48.9 −32.7 −30.7 −30.0 EGI 03 A Near seep zone 232 248 0.07 −52.0 −32.7 −31.4 −32.0 −30.0 EGI 03 B Near seep zone 182 196 0.07 −53.7 −32.6 −31.0 −31.0 EGI 03 C Near seep zone 342 388 0.12 −45.5 −34.3 −31.8 −31.3 −29.9 EGI 04 A Near seep zone 187 201 0.07 −54.7 −32.4 −31.6 −30.0 EGI 04 B Near seep zone 203 218 0.07 −50.2 −32.4 −30.5 −30.0 EGI 04 C Near seep zone 233 251 0.07 −51.2 −32.8 −31.3 −31.0 EGI 05 A Within seep zone 221 240 0.08 −53.7 −32.3 −31.0 −30.0 EGI 05 B Within seep zone 427 475 0.10 −45.9 −34.3 −31.5 −31.2 −29.8 EGI 05 C Within seep zone 247 272 0.09 −49.5 −33.9 −31.8 −32.0 −30.0 EGI 06 A Within seep zone 201 216 0.07 −53.3 −33.1 −30.6 −31.0 EGI 06 B Within seep zone 223 240 0.07 −50.1 −32.2 −31.1 −29.0 EGI 06 C Within seep zone 221 244 0.09 −49.1 −33.9 −31.4 −32.0 −30.0 EGI 07 A Within seep zone 243 263 0.07 −50.2 −32.4 −30.5 −33.0 −28.0 EGI 07 B Within seep zone 312 345 0.10 −47.8 −34.5 −32.4 −31.0 −30.4 EGI 07 C Within seep zone 372 418 0.11 −49.7 −34.5 −32.7 −32.2 −31.0 EGI 08 A Within seep zone 227 241 0.06 −53.5 −32.7 −30.4 −31.0 EGI 08 B Within seep zone 240 257 0.07 −62.0 −31.9 −29.4 EGI 08 C Within seep zone 457 513 0.11 −49.0 −34.8 −30.4 −31.6 −29.1 EGI 09 A Within seep zone 258 274 0.06 −56.8 −32.2 −31.0 −31.0 EGI 09 B Within seep zone 181 194 0.07 −52.8 −32.6 −30.2 −30.3 EGI 09 C Within seep zone 400 430 0.07 −53.0 −32.6 −30.1 −33.0 −29.8 EGI 10 A Within seep zone 227 717 0.68 −52.7 −29.9 −7.7 −31.5 EGI 10 B Within seep zone 678 772 0.12 −56.2 −33.5 −23.4 −32.4 −28.3 EGI 10 C Within seep zone 902 992 0.09 −55.1 −33.8 −26.7 −32.3 −22.1 EGI 11 A Within seep zone 362 384 0.06 −58.7 −32.9 −31.8 −32.2 −29.8 EGI 11 B Within seep zone 300 314 0.04 −62.7 −33.0 −26.5 −32.0 EGI 11 C Within seep zone 725 768 0.06 −57.0 −34.8 −29.1 −32.8 −30.6 EGI 12 A Near seep zone 223 246 0.09 −51.3 −32.9 −28.5 −31.5 −30.4 EGI 12 B Near seep zone 706 807 0.12 −48.3 −34.6 −28.3 −32.1 −30.2 EGI 12 C Near seep zone 898 991 0.09 −58.7 −35.2 −18.1 −31.8 −29.0 EGI 13 A Within seep zone 847 863 0.02 −55.2 −33.5 −24.2 −28.4 EGI 13 B Within seep zone 602 634 0.05 −52.9 −33.2 −27.8 −30.7 EGI 13 C Within seep zone 727 771 0.06 −48.7 −34.6 −30.6 −30.0 −30.1 EGI 14 C Within seep zone 109 121 0.10 −63.0 −31.1 EGI 15 A Near seep zone 479 545 0.12 −56.4 −34.6 −15.6 −28.3 −23.0 EGI 15 B Near seep zone 965 995 0.03 −56.1 −35.3 −21.7 −30.7 −27.7 EGI 15 C Near seep zone 609 640 0.05 −59.6 −34.6 −27.4 −31.9 −29.6 EGI 16 A Near seep zone 385 409 0.06 −58.3 −32.7 −29.3 −34.1 −29.6 EGI 16 B Near seep zone 730 757 0.04 −62.6 −35.3 −29.5 −31.6 −30.1 EGI 16 C Near seep zone 872 899 0.03 −58.9 −36.2 −29.5 −32.2 −29.6 EGI 17 A Near seep zone 83 89 0.07 −49.2 −32.6
Table 4. Continued
Depth
Core Target Total Gas Wet Gas Carbon IsotopesSample ID
Section Classification C1 (nmol/g) (nmol/g) Fraction C1A
C2
brams an
C3
d Dahdah
iC4
NC4EGI 17
B Near seep zone 293 312 0.06 −55.6 −33.3 −30.9 −30.8 EGI 17 C Near seep zone 259 279 0.07 −51.4 −33.0 −31.2 −29.9 EGI 18 A Within seep zone 293 311 0.06 −57.5 −32.5 −31.3 −33.2 −30.7 EGI 18 B within seep zone 362 391 0.07 −48.0 −32.4 −30.6 −31.4 −28.9 EGI 18 C within seep zone 302 325 0.07 −53.7 −33.4 −32.0 −32.5 −32.1 EGI 19 A within seep zone 293 311 0.06 −55.4 −32.5 −32.2 −30.3 EGI 19 B within seep zone 294 316 0.07 −53.1 −33.0 −30.9 −31.5 −29.3 EGI 19 C within seep zone 381 410 0.07 −53.0 −33.8 −31.3 −28.7 EGI 20 A near seep zone 270 287 0.06 −59.8 −32.5 −31.9 −30.5 EGI 20 B near seep zone 346 373 0.07 −50.6 −31.8 −28.7 −32.1 −28.8 EGI 20 C Near seep zone 822 844 0.03 −59.8 −33.0 −28.5 −33.6 −29.7 EGI 21 B Within seep zone 436 835 0.48 −46.5 −33.9 −28.2 −31.7 −26.7 EGI 21 C Within seep zone 591 1736 0.66 −54.2 −34.3 −14.8 −31.8 EGI 22 B Within seep zone 862 937 0.08 −52.0 −37.0 −26.5 −30.3 −27.3 EGI 22 C Within seep zone 993 1020 0.03 −58.0 −35.6 −27.5 −30.8 −27.7 EGI 23 C Within seep zone 215 234 0.08 −55.5 −33.7 −28.9 −30.6 −26.5 EGI 24 A Within seep zone 138 150 0.08 −54.8 −34.0 −30.6 −29.1 EGI 24 B Within seep zone 205 227 0.10 −51.2 −33.3 −25.5 −32.4 −29.3 EGI 24 C Within seep zone 619 701 0.12 −44.2 −34.6 −32.1 −32.1 −30.2 EGI 25 A Near seep zone 215 233 0.08 −54.3 −33.1 −30.3 −33.4 −27.9 EGI 25 B Near seep zone 262 285 0.08 −57.7 −33.9 −31.8 −30.7 EGI 25 C Near seep zone 684 759 0.10 −52.9 −35.0 −32.0 −32.2 −30.2 EGI 26 A Near seep zone 280 296 0.05 −58.3 −32.6 −32.1 −31.9 EGI 26 B Near seep zone 284 305 0.07 −49.3 −32.3 −31.8 −29.6 EGI 26 C Near seep zone 185 204 0.09 −49.6 −32.6 −31.4 −32.4 EGI 27 A Near seep zone 83 91 0.08 −51.4 −32.9 −30.6 EGI 27 B Near seep zone 245 262 0.07 −54.6 −32.7 −29.3 −32.9 −31.2 EGI 27 C Near seep zone 262 283 0.07 −51.5 −32.6 −31.0 −33.9 −30.9 EGI 28 A Near seep zone 174 179 0.03 −62.7 −31.9 EGI 28 B Near seep zone 237 252 0.06 −56.2 −33.6 −31.0 EGI 28 C Near seep zone 398 414 0.04 −64.4 −34.1 −28.8 −28.5 EGI 29 A Near seep zone 243 256 0.05 −59.2 −32.3 −31.5 EGI 29 B Near seep zone 210 223 0.05 −58.2 −33.5 −31.0 EGI 29 C Near seep zone 199 213 0.06 −57.3 −32.4 −30.8 −30.1 EGI 30 A Near seep zone 287 301 0.05 −59.2 −32.3 −31.8 −29.7 EGI 30 B Near seep zone 227 244 0.07 −46.6 −32.5 −30.3 −32.1 −30.0 EGI 30 C Near seep zone 220 237 0.07 −53.8 −32.3 −30.5 −33.0 EGI 31 A Near seep zone 70 77 0.09 −42.5 −31.9 EGI 31 B Near seep zone 256 270 0.05 −58.4 −33.0 −31.6 −30.5 EGI 31 C Near seep zone 194 206 0.06 −55.5 −32.5 −29.7 −30.9 EGI 32 A Near seep zone 61 67 0.09 −44.6 −31.7 EGI 32 B Near seep zone 318 338 0.06 −58.5 −33.4 −32.9 −30.5 EGI 32 C Near seep zone 228 244 0.07 −53.3 −32.9 −29.9 −30.5 EGI 33 A Regional reference 66 74 0.11 −42.0 −31.0 EGI 33 B Regional reference 246 263 0.06 −57.9 −32.5 −30.9 −33.0 −29.1 EGI 33 C Regional reference 233 249 0.07 −52.8 −31.6 −30.2 −29.41919

–29.3‰) relative to the reservoir gases (d13C3,–27.8 to –31.1‰) (Table 3; Figure 6). This is mostlikely related to near-surface microbial alterationof propane. The preferential attack of propanewas noted by James and Burns (1984) in reservoirgases, and microbial fractionation of near-surfacegases is not uncommon for seabed sediment gases(Abrams, 1989).
Microdesorption (Bound) GasesThe microdesorption bound gas data (Table 4) areplotted on the same total hydrocarbon gas (S C1–
C4) versus wet gas fraction (S C2–C4/S C1–C4)evaluation plot using the same core designations(Figure 7). Note that the microdesorption sedi-ment gases are reported in nanomoles per gramby weight, whereas the disrupter headspace gas isreported in parts per million by volume.
The bound gases display a very different trendthan the interstitial gases. No bimodal distributionis present and total microdesorption hydrocarbongas displays significant variability from low- andhigh-concentration samples (Figure 7). Most ofthe samples have wet gas fractions less than 0.12(<12%),with three notable exceptions: 0.48, 0.66,and 0.68 (48–68%). Most of the microdesorption
1920 Surface Sediment Hydrocarbons as Indicators of Subsurfa
extracted sediment gases show higher gas wetnessthan the reservoir gases (Figure 7).
The bound gases compound-specific isotopicratios do not match the reservoir gases (Figure 8).The sediment-bound methane and ethane isotopesare as much as 7‰ heavier than the Marco PoloField reservoir gases. This is not an uncommonobservation for sediment-bound gases removedby acid extraction from both washed and closed-vessel adsorbed-hydrocarbon analysis (Abrams andDahdah, 2010).
Gasoline-Range Hydrocarbon Analysis
The gasoline-range petroleum hydrocarbons com-prise molecules with 5 to 12 carbon atoms (C5–
C12) arranged in linear, branched, and cyclic ali-phatic structures along with monoaromatic hydro-carbons, such as benzene, toluene, and o-, m-, andp-xylenes. This group of hydrocarbons is normallyderived from thermogenic processes associatedwith a mature generating source rock unlike meth-ane and ethane (C1 and C2) that could be derivedfrom either thermogenic or microbial processes(Whiticar, 1999). The gasoline-range hydrocarbonsare volatile and migrate within key oil migrationavenues to the sediment surface and should be an
Figure 7. The bound gases display different trends from theinterstitial gases. No bimodal distribution and total microde-sorption hydrocarbon gas displays significant variability from thelow- and high-concentration samples. Most have wet gas frac-tions less than 0.12 (<12%) with three notable exceptions: 0.48,0.66, and 0.68. Most display higher gas wetness than the res-ervoir gases.
Figure 8. Most Marco Polo sediment-bound gases do notmatch the reservoir gas isotopic values. Bound gases are up to7‰ heavier than the Marco Polo Field reservoir gases.
ce Hydrocarbons

important target for most surface geochemicalsurveys (Abrams et al., 2009).
To date, few surface geochemical surveys at-tempt to evaluate the gasoline-range hydrocarbonsin near-surface marine sediments. Conventionalheadspace light hydrocarbon analysis is not an ef-fective method to evaluate the C6 to C12 hydro-carbons because of higher boiling points and lowvapor pressures relative to the hydrocarbons’ gases(C1–C5) (Abrams and Dahdah, 2010).
Headspace Solid-Phase MicroextractionThe HSPME data are reported as the area sum ofa single carbon number (SCN) within the mainboiling point range detected using the SPME fiber.The unresolved complex mixture (UCM) is in-cluded in the area of each SCN (Abrams et al.,2009) (Table 5). A plot of the disrupter total hy-drocarbon interstitial gas (S C1–C5) versus HSPMESCN (Figure 9) displays moderate correlation be-tween sediment interstitial gas and the concentra-tion of gasoline-range hydrocarbons.
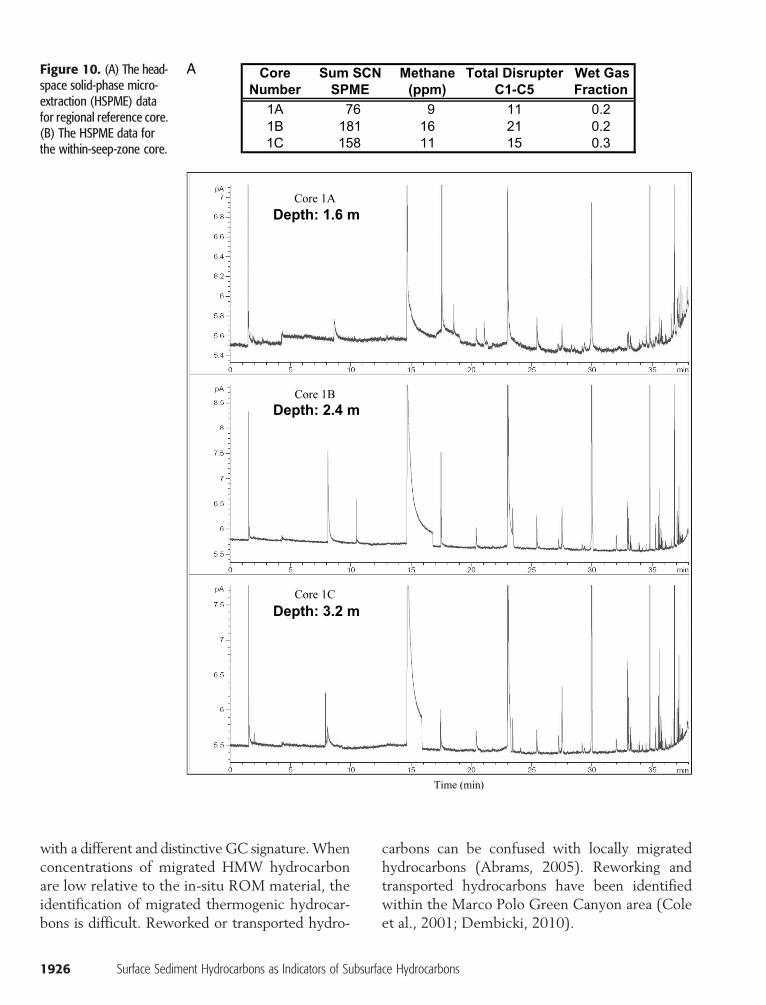
The regional reference HSPME gas chromato-grams contain very low overall signal responses(<10 total GC area) that are dominated by SPMEfiber peaks (Figure 10A) (Abrams et al., 2009). Incontrast, the high-concentration within-seep-zoneHSPME gas chromatograms have an elevated over-all signal response increasing with depth, significantresolvable compounds, depleted light end, and ele-vated baseline hump or UCM (Figure 10B).
Compound distributions for the within-seep-zone chromatograms are very different to an unal-tered reservoir oil whole-oil chromatogram. TheHSPMEwithin-seep-zone chromatograms containvery low n-alkanes (C5, C6, C7, and C8), aromatics(benzene, toluene, and xylenes), cycloalkanes (cy-clopentane and cyclohexane), and cycloalkaneswith one methyl group (methyl-cyclopentane andmethyl-cyclohexane) but elevated isoalkanes andcycloalkanes with more than one methyl group.This unique compound distribution is commonlyfound in biodegraded oils (George et al., 2002),indicating that the macroseepage seabed gasoline-range hydrocarbons are rapidly and heavily altered(Abrams et al., 2009).
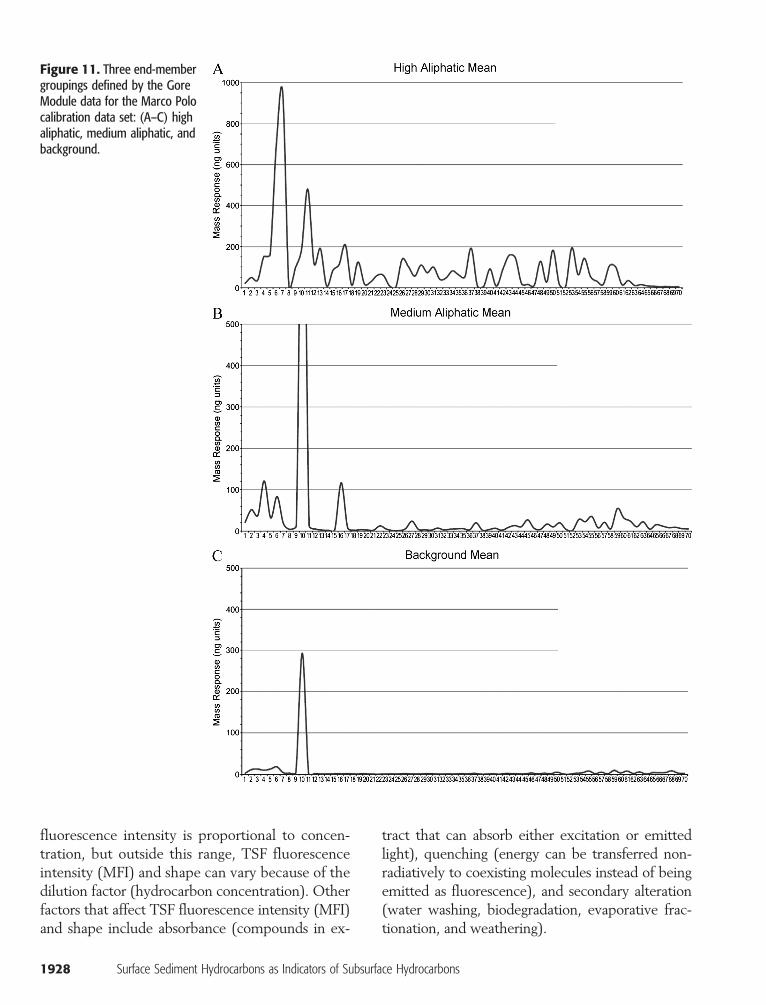
Gore ModuleThe Gore Module examines as much as 150 vola-tile compounds using cluster analysis and linear dis-criminate classification for defining petroleum andbackground character end members (Anderson,2006). Three end-member groupings were de-fined by the Gore statistical evaluation: high ali-phatic, medium aliphatic, and background (Table 5;Figure 11A–C).
The Gore high aliphatic group contains thehigher concentration (based on headspace gasand HSPME data) within-seep-zone samples, withtwo exceptions (Table 5). The key compoundsthat characterize this end member group include2-methylbutane, 3-methylpentane, methylcyclo-hexane, cyclohexane, 1-octene, cyclopentane,c1314 dimethylcyclohexane, and ethylcyclohex-ane (Figure 11A).
The Gore medium aliphatic group contains amix of the within-seep-zone and near-seep-zonesamples (Table 5). The key compounds that char-acterize this end member group include carbondisulfide, 2,4-dimethylpentane, 2,5-dimethylhex-ane, pristane, ethane, and cyclooctane (Figure 11B).
The Gore background group contains theregional reference samples as well as the low-concentrationwithin-seep-zone and near-seep-zonesamples (Table 5). The key compounds that char-acterize this end member group include carbon di-sulfide, propene, ethane, octanal, decanal, propane,1-butene, butane, and tetradecane (Figure 11C).
A plot of Gore Module total reported hydro-carbons versus total disrupter HSPME SCN indi-cates that both gasoline-range sediment extractionmethods provide similar results (Figure 12). Bothmethods provide strong gasoline-range signals withinthe interstitial sediment gas high-concentrationwithin-seep-zone and near-seep-zone samples andminimal signal in the regional reference and inter-stitial sediment gas low-concentrationwithin-seep-zone and near-seep-zone targeted cores. The GoreModule thermal desorption MS analysis providesgreater compound specific information than couldbe achieved with the HSPME GC-FID approach.This could prove to be important to characterizeseep origin (source facies, level of maturity, and/orseep to oil correlation). In addition, the desorption
Abrams and Dahdah 1921

Table 5. Marco Polo Surface Geochemistry Calibration Headspace Solid-Phase Microextraction and Gore Module Gasoline Plus Data
with Statistical Grouping ClassificationsCore No.
1922
CoreSection
Surface S
Core TargetClassification
ediment Hydrocarbons
Core Depth
as Indicators of S
Gore Grouping
ubsurface Hydrocarbon
Total GoreHydrocarbons
s
Total DisrupterC1–C5
Total SPMESCN–UCM
EGI 01
A Regional reference 156 Background 142 15 158 EGI 01 B Regional reference 239 Background 303 21 181 EGI 01 C Regional reference 322 Background 243 11 76 EGI 02 A Near seep zone 181 Background 131 18 493 EGI 02 B Near seep zone 264 Background 174 36 129 EGI 02 C Near seep zone 347 Background 148 39 189 EGI 03 A Near seep zone 268 Background 131 14 70 EGI 03 B Near seep zone 351 Background 205 26 299 EGI 03 C Near seep zone 434 Background 216 25 175 EGI 04 A Near seep zone 163 Background 146 14 119 EGI 04 B Near seep zone 246 Background 159 22 73 EGI 04 C Near seep zone 329 Background 370 28 154 EGI 05 A Within seep zone 287 Background 214 26 82 EGI 05 B Within seep zone 370 Background 278 22 271 EGI 05 C Within seep zone 453 Background 134 42 153 EGI 06 A Within seep zone 210 Background 173 21 86 EGI 06 B Within seep zone 293 Background 193 25 74 EGI 06 C Within seep zone 376 Background 160 28 163 EGI 07 A Within seep zone 208 Background 129 48 252 EGI 07 B Within seep zone 291 Background 134 113 146 EGI 07 C Within seep zone 374 Background 185 279 119 EGI 08 A Within seep zone 214 Background 124 209 83 EGI 08 B Within seep zone 287 Background 179 845 1467 EGI 08 C Within seep zone 380 Medium Aliphatic 1558 23,775 2334 EGI 09 A Within seep zone 194 Background 150 94 178 EGI 09 B Within seep zone 278 Background 154 129 188 EGI 09 C Within seep zone 361 Background 155 253 171 EGI 10 A Within seep zone 37 High aliphatic 6212 72,445 4588 EGI 10 B Within seep zone 120 High aliphatic 132,986 140,343 4859 EGI 10 C Within seep zone 203 High aliphatic 153,739 186,992 34,294 EGI 11 A Within seep zone 220 Medium Aliphatic 443 274 116 EGI 11 B Within seep zone 303 Background 331 4391 547 EGI 11 C Within seep zone 396 Medium aliphatic 1106 202,259 2426 EGI 12 A Near seep zone 324 Background 159 184 92 EGI 12 B Near seep zone 407 Background 202 21,456 116 EGI 12 C Near seep zone 490 Medium aliphatic 856 105,824 151 EGI 13 A Within seep zone 170 High aliphatic 24,625 111,178 9948 EGI 13 B Within seep zone 253 High aliphatic 59,660 495,051 9155 EGI 13 C Within seep zone 336 High aliphatic 47,206 88,064 6387 EGI 14 C Within seep zone 10 Medium aliphatic 516 4237 1807 EGI 15 A Near seep zone 193 High aliphatic 34,715 163,229 9502 EGI 15 B Near seep zone 276 High aliphatic 42,592 234,851 12,214 EGI 15 C Near seep zone 359 High aliphatic 23,301 213,038 16,784 EGI 16 A Near seep zone 233 Background 150 3519 510 EGI 16 B Near seep zone 316 Medium aliphatic 1390 223,903 921 EGI 16 C Near seep zone 399 Medium aliphatic 517 235,076 508
Table 5. Continued
Core No.
CoreSectionCore TargetClassification
Core Depth Gore GroupingTotal GoreHydrocarbons
Abra
Total DisrupterC1–C5
ms and Dahdah
Total SPMESCN–UCM
EGI 17
A Near seep zone 131 Background 133 13 97 EGI 17 B Near seep zone 214 Background 318 18 153 EGI 17 C Near seep zone 297 Background 215 22 107 EGI 18 A Within seep zone 158 Background 244 29 124 EGI 18 B Within seep zone 241 Background 201 36 100 EGI 18 C Within seep zone 324 Background 256 22 97 EGI 19 A Within seep zone 176 Background 145 116 145 EGI 19 B Within seep zone 259 Background 111 437 105 EGI 19 C Within seep zone 342 Medium aliphatic 1757 24,355 13,076 EGI 20 A Near seep zone 133 Medium aliphatic 2332 392 235 EGI 20 B Near seep zone 216 Background 115 13,312 179 EGI 20 C Near seep zone 299 High aliphatic 882 206,790 1875 EGI 21 B Within seep zone 10 High aliphatic 19,134 157,122 14,087 EGI 21 C Within seep zone 33 High aliphatic 226,976 159,061 21,952 EGI 22 B Within seep zone 60 High aliphatic 26,428 153,807 11,747 EGI 22 C Within seep zone 143 High aliphatic 6983 133,299 6689 EGI 23 C Within seep zone 10 High aliphatic 79,866 166,649 16,515 EGI 24 A Within seep zone 169 Background 147 227 215 EGI 24 B Within seep zone 252 Background 247 333 177 EGI 24 C Within seep zone 335 Background 277 2305 342 EGI 25 A Near seep zone 323 Background 124 389 188 EGI 25 B Near seep zone 406 Background 201 45,616 126 EGI 25 C Near seep zone 489 Medium aliphatic 482 52,034 165 EGI 26 A Near seep zone 157 Background 269 15 152 EGI 26 B Near seep zone 240 Background 291 15 263 EGI 26 C Near seep zone 323 Background 200 22 107 EGI 27 A Near seep zone 122 Background 206 9 105 EGI 27 B Near seep zone 205 Background 116 9 105 EGI 27 C Near seep zone 288 Background 175 26 82 EGI 28 A Near seep zone 164 Background 102 170 147 EGI 28 B Near seep zone 197 Background 210 985 235 EGI 28 C Near seep zone 280 Background 281 87,879 689 EGI 29 A Near seep zone 154 Background 130 34 143 EGI 29 B Near seep zone 237 Background 120 92 64 EGI 29 C Near seep zone 320 Background 112 187 74 EGI 30 A Near seep zone 161 Background 184 75 136 EGI 30 B Near seep zone 244 Background 193 21 86 EGI 30 C Near seep zone 328 Background 144 15 264 EGI 31 A Near seep zone 80 Background 255 88 102 EGI 31 B Near seep zone 163 Background 351 18 142 EGI 31 C Near seep zone 246 Background 313 27 111 EGI 32 A Near seep zone 105 Background 151 12 158 EGI 32 B Near seep zone 188 Background 162 28 97 EGI 32 C Near seep zone 271 Background 235 24 290 EGI 33 A Regional reference 70 Background 195 15 148 EGI 33 B Regional reference 153 Background 180 25 102 EGI 33 C Regional reference 236 Background 246 144 1311923

MS analysis can detect much lower concentra-tions than other seabed geochemical analysis meth-ods. However, it could not discriminate the low-concentration within-seep-zone and near-seep-zonesamples any better than the disrupter headspacegas or HSPME gasoline-range analysis.
The 8, 11, 16, 19, and 25 within-seep-zone andnear-seep-zone core shallow subsamples were clas-sified by Gore in the background group, whereasthe deeper subsamples fall in themedium aliphaticgroup. This observation reinforces the importanceof sampling depth and placing the corer directly onthe targeted feature.
High-Molecular-Weight Hydrocarbon Analysis
Extract GC: The sediment extract GC evaluationincludes the chromatogram signature, total UCM,and total n-alkanes. Table 6 contains extract GCtotal UCM and total n-alkanes for the Marco Polocalibration samples. Samples with UCM valuesless than 25 mg/g are considered to be background,whereas samples with UCM greater than 100 mg/g
1924 Surface Sediment Hydrocarbons as Indicators of Subsurfa
are associated with migrated hydrocarbon seepage(Cole et al., 2001;Abrams, 2005). Six of the 15 corescollected at the within-seep-zone targets did nothave elevated UCM (>100 mg/g), indicating thatthe samples may not have hit the targeted feature(Table 6). One near-seep-zone sample containselevated UCM (Table 6).
Sediments containing migrated thermogenicHMW hydrocarbons typically have GC-FID chro-matograms characterized by a large unresolved com-plex mixture (UCM) with some discernible C15–
C32 n-alkanes and isoprenoids peaks, depending onthe severity of microbial alteration (Figure 13A)(Brooks and Carey, 1986). All but one of the within-seep-zone samples have extremely high UCM val-ues (>1000 mg/g) and a sumof total alkanes less than1. This is a common observation with sediment ex-tract chromatograms and is related to the severenear-surface bacterial alteration that has destroyedmost of the resolvable normal alkane compoundsvery quickly. Sediments containing mainly the re-cent organic matter (ROM) signature with somemigrated thermogenic signal will contain lowerUCM and overprint of odd n-alkanes greater thanC23 (Figure 13B) (Brooks and Carey, 1986).
Extract TSF: The sediment extract TSF evalu-ation includes examination of the fluorogram sig-nature and maximum fluorescence intensity (MFI).Samples with significant seepage require dilutionbefore TSF analysis. The MFI values are adjustedby multiplying the measured MFI by the dilutionfactor to obtain a corrected MFI (Brooks et al.,1983).
The extract TSF MFI ranges from 30,140 to73,260,000MFIunits (Table 6) for the SGCphase IIIGOM calibration samples. Most of the samples col-lected in the within-seep-zone targets contain high-extract TSFMFI values (100,000MFI units) (Coleet al., 2001; Abrams, 2005). Several near-seep-zonesamples as well as one shallow regional-referencesample also have extract TSF MFI greater than100,000 units.
An extract GC total UCM versus TSFMFI plotdemonstrates a relatively strong correlation betweenthe two HMW screening tools (Figure 14), but ex-amination of the TSF fluorogram signatures indi-cate a potential problem with the extract TSF
Figure 9. The headspace solid-phase microextraction (HSPME)data reported as sum of single carbon number (SCN) within thedetection range of SPME fiber. The unresolved complex mixtureis included in the area of each SCN. A plot of disrupter totalhydrocarbon interstitial gas (S C1–C5) versus HSPME SCN dis-plays a moderate correlation between sediment interstitial gasand concentration of gasoline-range hydrocarbons with notableexceptions.
ce Hydrocarbons

method (Figure 15). The fluorogram signatures fora regional-reference sample with low-interstitialsediment gas, UCM, andTSFMFI; andwithin-seep-zone sample with highly elevated interstitial sedi-ment gas, UCM, and TSF MFI should have verydifferent shapes and locations of the maximum ex-citation wavelength (MFI Max Ex) and maximumemission wavelength (MFI Max EM), yet they aresimilar (Figure 15A, B). This indicates that thefluorogram shape, MFI Max Ex, and MFI Max EMmay not assist in the identification of thermogenicseepage in marine sediments.
KEY OBSERVATIONS
Sediment Gases
The can headspace and disrupter extraction meth-ods provide similar interstitial sediment gas data,indicating that the disrupter plastic container withscrew cap and sealing gasket, built-in septum, andblades to break up the sediment did not providesignificantly better results than the conventionalcan headspace method. Both methods providehighly variable gas compositions compared withthe Marco Polo reservoir gases. Very few of thehigh-concentration within-seep-zone samples havesediment gas compositions similar to the MarcoPolo reservoir gases. In contrast, the can headspaceand disrupter interstitial sediment gas compound-specific isotopes are similar to the Marco Polo res-ervoir gases, except for the propane carbon iso-tope value. The propane isotopic values are muchheavier most likely because of preferential micro-bial alteration (James and Burns, 1984; Abrams,1989, 2005). The bound gas extraction methoddid not provide gas compositions or compound-specific isotopes similar to the Marco Polo reser-voir gases. This could be related to the bound gasremoval process, which may fractionate the sedi-ment gas sample (Abrams and Dahdah, 2010).
Proper identification of anomalous versus back-ground interstitial (free) sediment gas is required toseparate background samples that may seem to bethermogenic because of phase fractionation. Phasefractionation (preferential loss of methane relative
to ethane plus gases) results in background low-concentration sediment gases having elevatedwet gasfractions. The fractionated samples are commonlyconfused withmigrated thermogenic hydrocarbons(Abrams, 2005) because of thehigher relativewet gascomponent.Only the high-concentration samples arelikely to be derived from migrated thermogenic gas.Compound-specific isotopic measurements are crit-ical to confirm the thermogenic origin, assuming thatisotopically distinctive changes are present.
Many samples collected at within-seep-zone ornear-seep-zone targets identified by conventionaland high-resolution surface seismic data have onlylow concentrations (background) of interstitial gas.We believe that these samples did not hit the in-tended target or were collected within the ZMD.
Gasoline-Range Sediment Hydrocarbons
Both the HSPME and Gore Module extractionmethods provide strong gasoline-range seepage sig-nals for the high-concentration within-seep-zoneand near-seep-zone samples and minimal to no sig-nal in the regional reference and low-concentrationwithin-seep-zone and near-seep-zone samples. TheGore Module thermal extraction combined withMS provides much greater compositional detailthan the HSPME GC-FID method.
The HSPME chromatograms show evidencefor significant near-surfacemicrobial alteration. The“lack” of an unaltered oil, even in zones of highfluxmacroseepage, leads us to believe that the rate ofalteration is rapid. It is our belief that despite mi-crobial alteration, gasoline-range hydrocarbons pro-vide key information for a boiling point range notexamined inmost offshore surveys, and this type ofdata is very important to help identify subsurfacehydrocarbon generation (Abrams et al., 2009).
High-Molecular-WeightSediment Hydrocarbons
The within-seep-zone samples with elevated HMWhydrocarbons (macroseepage) have extremely highUCM values and a distinctive GC signature. Theregional reference samples have much lower UCM
Abrams and Dahdah 1925
with a different and distinctive GC signature.Whenconcentrations of migrated HMW hydrocarbonare low relative to the in-situ ROM material, theidentification of migrated thermogenic hydrocar-bons is difficult. Reworked or transported hydro-
1926 Surface Sediment Hydrocarbons as Indicators of Subsurfa
carbons can be confused with locally migratedhydrocarbons (Abrams, 2005). Reworking andtransported hydrocarbons have been identifiedwithin the Marco Polo Green Canyon area (Coleet al., 2001; Dembicki, 2010).
Figure 10. (A) The head-space solid-phase micro-extraction (HSPME) datafor regional reference core.(B) The HSPME data forthe within-seep-zone core.
ce Hydrocarbons

Figure 10. Continued.
The Marco Polo extract TSF data indicate thatMFI measurements provide information on thepresence of anomalous hydrocarbons, but TSFfluorogram shapes do not change with target typeor other geochemical measurements (interstitial
gas, gasoline-range hydrocarbons, or extract UCM).Edwards and Crawford (1999) demonstrated thata linear relationship between oil concentration andtotal fluorescence intensity can only be obtainedbetween 0.10 and 10 ppm oil. Within this range,
Abrams and Dahdah 1927
fluorescence intensity is proportional to concen-tration, but outside this range, TSF fluorescenceintensity (MFI) and shape can vary because of thedilution factor (hydrocarbon concentration). Otherfactors that affect TSF fluorescence intensity (MFI)and shape include absorbance (compounds in ex-
1928 Surface Sediment Hydrocarbons as Indicators of Subsurfa
tract that can absorb either excitation or emittedlight), quenching (energy can be transferred non-radiatively to coexisting molecules instead of beingemitted as fluorescence), and secondary alteration(water washing, biodegradation, evaporative frac-tionation, and weathering).
Figure 11. Three end-membergroupings defined by the GoreModule data for the Marco Polocalibration data set: (A–C) highaliphatic, medium aliphatic, andbackground.
ce Hydrocarbons

Figure 11. Continued.
CONCLUSIONS
The Marco Polo SGC and previous SGC labora-tory studies provide a strong empirical data set toevaluate surface geochemical methods used byindustry for marine surface geochemical surveys.
The Marco Polo SGC calibration data set dem-onstrates the importance of targeted coring andsampling depth. To improve the detection of sea-bed migrated thermogenic hydrocarbon seepage,core samples should be collected along major mi-gration pathways (cross-stratal leakage features)identified by conventional deep seismic and high-resolution sea floor imaging technology. Not alltargeted cores will hit the designated feature, andthus, collecting replicates along key migration fea-tures is recommended. Collecting sediment sam-ples below theZMD is also important to reduce thetransition zone alteration interference.
Figure 12. A plot of the Gore Module total reported hydrocar-bons versus total disrupter headspace solid-phase microextraction(HSPME) single carbon number (SCN) indicates that both gasoline-range sediment extraction methods provide similar results: stronggasoline-range signals within the interstitial sediment gas high-concentration within-seep-zone and near-seep-zone samples andminimal signal in the regional reference and interstitial sediment gaslow-concentrationwithin-seep-zone and near-seep-zone targeted cores.
Abrams and Dahdah 1929

Table 6. Marco Polo Surface Geochemistry Calibration Extract Gas Chromatography and Total Scanning Fluorescence Data
1930
Surface Sedimen t Hydrocarbons as IndicatorExtract GC
s of Subsurface Hydrocarbons
Extract TSF
Core ID Depth (cm) Core Target ∑ n–Alkanes UCM (mg/g) UCM > n-C23 (mg/g) MFIEGI 01
156 Regional reference 875 11 7 60,920 EGI 01 239 Regional reference 486 6 5 51,430 EGI 01 322 Regional reference 1841 12 8 56,480 EGI 02 181 Near seep zone 1414 19 16 89,960 EGI 02 264 Near seep zone 1209 9 8 43,670 EGI 02 347 Near seep zone 1618 11 9 34,140 EGI 03 268 Near seep zone 1037 10 9 94,720 EGI 03 351 Near seep zone 1562 18 16 30,215 EGI 03 434 Near seep zone 3044 19 13 68,370 EGI 04 163 Near seep zone 1110 17 13 57,310 EGI 04 246 Near seep zone 1233 32 21 57,770 EGI 04 329 Near seep zone 1255 9 7 49,170 EGI 05 287 Within seep zone 881 8 6 26,205 EGI 05 370 Within seep zone 1953 12 8 127,420 EGI 05 453 Within seep zone 1071 10 8 54,600 EGI 06 210 Within seep zone 1120 9 7 54,440 EGI 06 293 Within seep zone 833 8 6 46,760 EGI 06 376 Within seep zone 2259 12 9 107,660 EGI 07 208 Within seep zone 1216 10 8 47,810 EGI 07 291 Within seep zone 996 8 7 51,410 EGI 07 374 Within seep zone 2034 14 11 119,600 EGI 08 214 Within seep zone 1260 16 12 53,760 EGI 08 287 Within seep zone 0 6359 4876 42,712,000 EGI 08 380 Within seep zone 0 3971 2815 26,892,000 EGI 09 194 Within seep zone 1026 16 11 55,900 EGI 09 278 Within seep zone 1269 13 9 50,920 EGI 09 361 Within seep zone 1236 81 55 716,400 EGI 10 37 Within seep zone 0 664 399 4,288,000 EGI 10 120 Within seep zone 0 1070 598 6,926,000 EGI 10 203 Within seep zone 1508 20 15 4,558,000 EGI 11 220 Within seep zone 0 322 264 90,100 EGI 11 303 Within seep zone 0 941 469 2,171,500 EGI 11 396 Within seep zone 2302 63 28 563,000 EGI 12 324 Near seep zone 989 17 14 49,420 EGI 12 407 Near seep zone 3869 26 22 230,600 EGI 12 490 Near seep zone 2880 17 14 201,650 EGI 13 170 Within seep zone 0 2497 1648 20,516,000 EGI 13 253 Within seep zone 0 1130 712 7,032,000 EGI 13 336 Within seep zone 0 224 126 2,382,000 EGI 14 10 Within seep zone 0 3700 2456 36,080,000 EGI 15 193 Near seep zone 0 3660 2344 27,768,000 EGI 15 276 Near seep zone 0 3393 2265 27,560,000 EGI 15 359 Near seep zone 0 5254 3400 46,752,000 EGI 16 233 Near seep zone 1098 20 14 57,700 EGI 16 316 Near seep zone 935 10 8 71,900 EGI 16 399 Near seep zone 1793 19 12 121,320 EGI 17 131 Near seep zone 696 16 12 195,600
Table 6. Continued
Extract GC
Abrams and Dahdah
Extract TSF
Core ID Depth (cm) Core Target ∑ n–Alkanes UCM (mg/g) UCM > n-C23 (mg/g) MFIEGI 17
214 Near seep zone 1194 15 10 99,680 EGI 17 297 Near seep zone 988 12 9 76,980 EGI 18 158 Within seep zone 1314 18 13 78,780 EGI 18 241 Within seep zone 1293 16 14 249,300 EGI 18 324 Within seep zone 979 7 7 22,530 EGI 19 176 Within seep zone 1419 22 17 98,420 EGI 19 259 Within seep zone 1661 115 100 1,147,600 EGI 19 342 Within seep zone 3375 207 139 2,335,000 EGI 20 133 Near seep zone 1364 19 14 63,100 EGI 20 216 Near seep zone 2213 258 228 2,759,500 EGI 20 299 Near seep zone 1240 13 10 24,380 EGI 21 10 Within seep zone 0 3537 3016 35,512,000 EGI 21 33 Within seep zone 0 7423 4789 73,260,000 EGI 22 60 Within seep zone 54,864 6754 4452 67,845,000 EGI 22 143 Within seep zone 0 2678 1745 22,896,000 EGI 23 10 Within seep zone 0 1983 1523 18,772,000 EGI 24 169 Within seep zone 1425 11 9 78,700 EGI 24 252 Within seep zone 2048 10 8 98,360 EGI 24 335 Within seep zone 3008 32 18 122,820 EGI 25 323 Near seep zone 1382 15 14 76,370 EGI 25 406 Near seep zone 2621 12 10 15,965 EGI 25 489 Near seep zone 3720 27 23 368,800 EGI 26 157 Near seep zone 1370 24 18 72,980 EGI 26 240 Near seep zone 1397 13 11 39,515 EGI 26 323 Near seep zone 827 6 4 53,680 EGI 27 122 Near seep zone 958 19 14 118,260 EGI 27 205 Near seep zone 1553 16 13 85,520 EGI 27 288 Near seep zone 1133 11 9 77,400 EGI 28 164 Near seep zone 1096 14 9 66,580 EGI 28 197 Near seep zone 1140 16 14 150,510 EGI 28 280 Near seep zone 1016 9 7 74,580 EGI 29 154 Near seep zone 1243 19 13 117,300 EGI 29 237 Near seep zone 1245 15 13 57,530 EGI 29 320 Near seep zone 1157 12 9 82,760 EGI 30 161 Near seep zone 1385 24 16 84,160 EGI 30 244 Near seep zone 1446 15 11 60,170 EGI 30 328 Near seep zone 1016 10 8 34,250 EGI 31 80 Near seep zone 460 8 7 58,780 EGI 31 163 Near seep zone 1211 17 11 58,970 EGI 31 246 Near seep zone 1408 11 9 26,695 EGI 32 105 Near seep zone 436 9 8 30,040 EGI 32 188 Near seep zone 1367 20 14 32,670 EGI 32 271 Near seep zone 1607 13 10 54,070 EGI 33 70 Regional reference 424 18 15 269,800 EGI 33 153 Regional reference 1467 22 16 84,220 EGI 33 236 Regional reference 1101 14 11 65,4701931

Geochemical analysis should include a full rangeof hydrocarbon types; light hydrocarbon gases (C1–
C5), gasoline range (C5–C10+), and HMW hydro-carbons (C15+).
1932 Surface Sediment Hydrocarbons as Indicators of Subsurfa
The two interstitial sediment gas extractionmethods, can headspace and disrupter, providesimilar results in both laboratory (Abrams andDahdah, 2010) and field calibration studies. The
Figure 13. The MarcoPolo Surface Geochem-istry Calibration (SGC) ex-tract gas chromatograms.(A) Upper: within seepzone. (B) Lower: regionalreference.
ce Hydrocarbons

interstitial sediment gas data should be plotted ona total hydrocarbon gas (S C1–C5) versus wet gasfraction (S C2–C5/S C1–C5) chart to identify back-ground, fractionated, and anomalous populations(Abrams, 2005). The Marco Polo survey anom-alous interstitial sediment gases have variable gascompositions compared with the reservoir gases,thus, caution should be used when plotting seabedgases on conventional gas interpretation charts.The methane and ethane stable carbon isotopesfrom selected anomalous samples are similar tothe Marco Polo reservoir gases. However, propaneisotope values are much heavier, indicating thatpropane is more easily modified by in-situ micro-bial alteration.
The microdesorption bound gases have gascompositions and compound-specific isotopes un-like the Marco Polo reservoir gases. The microde-sorption sediment gases tend to have more wet gasfraction and highly variable methane carbon iso-topes with heavier ethane carbon isotopes. TheSGC laboratory studies indicate that prewashing toremove interstitial gases can have a major impacton bound gas results (Abrams and Dahdah, 2010).We do not recommend using bound gas extrac-tion methods to evaluate subsurface hydrocarbonsbased on the Marco Polo and previous laboratorycalibration studies reported in Abrams and Dahdah(2010).
The gasoline-range analysis provides a newrange of hydrocarbons rarely examined in surfacegeochemical studies. Both the HSPME and GoreModulemethods used in theMarco Polo calibrationstudies provide strong gasoline-range seep signalshaving useful information in the macroseepage(high-flux) andmicroseepage (low-flux) seep sites.The Gore Module thermal extraction combinedwith MS provides more compositional detail thanthe HSPME GC-FID method, which may be help-ful to evaluate the seep hydrocarbon source andmaturity.
Extraction GC and TSF analyses provide in-formation on the presence of HMWhydrocarbonsin the Marco Polo calibration survey. The GCchromatogram signature and total UCM trackedthe migrated thermogenic hydrocarbon macroseep-age but did not work as well with the low-level
Figure 14. The extract gas chromatography (GC) total unre-solved complex mixture (UCM) versus total scanning fluorescence(TSF) maximum fluorescence intensity (MFI) plot demonstratesrelatively strong correlation between two high-molecular-weightscreening tools for Marco Polo extract GC and TSF data.
Figure 15. Fluorogram signatures for regional reference sam-ple with low interstitial sediment gas, unresolved complex mixture(UCM), and total scanning fluorescence (TSF) maximum fluores-cence intensity (MFI); and within-seep-zone sample with highlyelevated interstitial sediment gas, UCM, and TSF MFI should nothave similar shapes and locations of maximum excitation wave-length (MFI Max Ex) and maximum emission wavelength (MaxEM). (A) Regional reference target EGI-1 (322 cm [127 in.]): MFI =56,480 and DIL 1:10. (B) Within-seep-zone target EGI-22 (60 cm[24 in.]): MFI = 67,845,000 and DIL 1:4000.
Abrams and Dahdah 1933

microseepage samples. The TSF MFI data also di-rectionally tracked migrated thermogenic hydro-carbon macroseepage and microseepage samples,but the fluorogram shape could not distinguishwithin-seep-zone and regional reference samples.We do not recommend extraction TSF to evalu-ate migrated HMW hydrocarbons in near-surfacemarine sediment seep surveys based on the aboveresults.
Follow-up studies by Dembicki (2010) withAnadarko examined extract saturate and aromaticfraction GC-MS to evaluate biomarker signaturevariability. Results of Dembicki (2010) demon-strate the importance of biomarker data to assist indetecting and interpreting low-concentration pe-troleum seepage (microseepage). Biomarker dataprovide a means to characterize the ROM con-tribution and in turn allow for the identificationof thermogenic hydrocarbons when the seep oilconcentration is low relative to ROM.
The above conclusions are based on theMarcoPolo calibration study as well as previous labora-tory calibration studies (Abrams et al., 2009; Loganet al., 2009; Abrams and Dahdah, 2010). Theyprovide a framework to better understand howbest to collect and extract migrated hydrocarbonsfrom shallow-marine sediments and evaluate theresults. However, it is also very important to in-tegrate sediment hydrocarbon results with basingeology to fully understand how surface geochem-istry observations relate to subsurface generationand potential entrapment (Abrams, 2005). A fullyintegrated evaluation provides the best petroleumsystems interpretation model.
REFERENCES CITED
Abrams, M. A., 1989, Interpretation of surface methane car-bon isotopes extracted from surficial marine sedimentsfor detection of subsurface hydrocarbons: AssociationPetroleum Geochemical Explorationist Bulletin, v. 5,p. 139–166.
Abrams, M. A., 1992, Geophysical and geochemical evi-dence for subsurface hydrocarbon leakage in the BeringSea, Alaska:Marine and PetroleumGeology Bulletin, v. 9,p. 208–221, doi:10.1016/0264-8172(92)90092-S.
Abrams, M. A., 1996, Distribution of subsurface hydrocar-bon seepage in near-surface marine sediments, in D.
1934 Surface Sediment Hydrocarbons as Indicators of Subsurfa
Schumacher and M. A. Abrams, eds., Hydrocarbon mi-gration and its near-surface effects: AAPG Memoir 66,p. 1–14.
Abrams, M. A., 2002, Surface geochemical calibration re-search study: An example of research partnership be-tween academia and industry (abs.), in New insights intopetroleum geoscience research through collaboration be-tween industry and academia, abstract volume: Geologi-cal Society (London).
Abrams, M. A., 2005, Significance of hydrocarbon seepagerelative to subsurface petroleum generation and entrap-ment: Marine and Petroleum Geology Bulletin, v. 22,no. 4, p. 457–478, doi:10.1016/j.marpetgeo.2004.08.003.
Abrams, M. A., and N. Dahdah, 2010, Surface sedimentgases as indicators of subsurface hydrocarbons: Examin-ing the record in laboratory and field studies: Marine andPetroleum Geology, v. 27, p. 273–284, doi:10.1016/j.marpetgeo.2009.08.005.
Abrams, M. A., and H. Dembicki, 2006, Variation in seabedgeochemical signature relative to reservoir hydrocarbons(abs.): AAPG Search and Discovery article, http://www.searchanddiscovery.net/documents/2006/06088houston_abs/abstracts/abrams.htm (accessed July 7, 2011).
Abrams, M. A., M. P. Segall, and S. G. Burtell, 2001, Bestpractices for detecting, identifying, and characterizingnear-surface migration of hydrocarbons within marinesediments: Proceedings of theOffshore Technology Con-ference, Houston, Texas, OTC Paper 13039, 14 p.
Abrams, M. A., N. Dahdah, and E. Francu, 2009, Develop-ment of methods to collect and analyze gasoline plusrange (C5 to C12) hydrocarbons from seabed sedimentsas indicators of subsurface hydrocarbon generation andentrapment: Applied Geochemistry, v. 24, p. 1951–1970,doi:10.1016/j.apgeochem.2009.07.009.
Anderson, H. S., 2006, Amplified geochemical imaging: Anenhanced view to optimize outcomes: European Associ-ation of Geoscientists and Engineers First Break, v. 24,p. 77–81.
Bernard, B.D., 1978, Light hydrocarbons inmarine sediments:Ph.D. thesis, Texas A&M University, College Station,Texas, 144 p.
Bjoroy, M., and I. Ferriday, 2002, Surface geochemistry as anexploration tool: A comparison of results using differentanalytical techniques (abs.): AAPGHedberg Conference,Vancouver, British Columbia, Canada, 2 p.
Brooks, J. M., and B. D. Carey, 1986, Offshore surface geo-chemical exploration: Oil & Gas Journal, v. 84, p. 66–72.
Brooks, J.M.,M. C. Kennicutt II, L. A. Bernard, G. J. Genoux,and B. D. Carey, 1983, Applications of total scanningfluorescence to exploration geochemistry: Proceedingsof theOffshore TechnologyConference,Houston, Texas,May 2–5, 1983, OTC Paper 4624, p. 393–400
Chaouche, A., P. Gamwell, and J. Brooks, 2004, Surface geo-chemical evaluation of Green Canyon Block 608, Gulfof Mexico: A comparison of sea floor seeps and reservoirfluids (abs.): AAPG Annual Meeting, Dallas, Texas,April 18–20, 2004.
Cole, G., R. Requejo, J. DeVay, A. Yu, F. Peel, C. H. Taylor,J. Brooks, B. Bernard, J. Zumberge, and S. Brown, 2001,The deep-water GOM petroleum system: Insights from
ce Hydrocarbons

piston coring, defining seepage, anomalies, and back-ground: 21st Annual GCS-SEPM Research Conference,p. 315–342.
Dembicki, H., 2010, Recognizing and compensating for in-terference from recent organic matter and biodegrada-tion during interpretation of biomarker data from seafloor hydrocarbon seeps: An example from the MarcoPolo area seeps, Gulf of Mexico: Marine and PetroleumGeology, v. 27, p. 1936–1951, doi:10.1016/j.marpetgeo.2010.06.009.
Dembicki Jr., H., and B. M. Samuels, 2007, Identification,characterization, and groundtruthing of deep-waterthermogenic hydrocarbon macroseepage utilizing high-resolution AUV geophysical data, Offshore TechnologyConference, Houston, Texas, April 30 to May 3, 2007.OTC Paper 18556, 11 p.
Dembicki Jr., H., and B. M. Samuels, 2008, Improving thedetection and analysis of seafloor macro-seeps: An ex-ample from the Marco Polo Field, Gulf of Mexico: Inter-national Petroleum Research Conference, Kuala Lum-pur, Malaysia, December 3–5, 2008, IPTC Paper 12124.
Edwards, D., and N. Crawford, 1999, UVF fluorimetry: Aus-tralian Geological Survey Organization Research Report.
George, S., C. J. Boreham, S. A. Minifie, and S. C. Teerman,
2002, The effect of minor to moderate biodegradationon C5 to C9 hydrocarbons in crude oils: Organic Geo-chemistry, v. 33, p. 1293–1317, doi:10.1016/S0146-6380(02)00117-1.
Horvitz, L., 1985, Geochemical exploration for petroleum:Science, v. 229, p. 812–827.
James, A. T., and B. J. Burns, 1984, Microbial alteration ofsubsurface natural gases accumulations: AAPG Bulletin,v. 68, p. 957–960.
Logan, G. A., M. A. Abrams, N. Dahdah, and E. Grosjean,2009, Examining laboratory methods for evaluating mi-grated high-molecular-weight hydrocarbons in marinesediments as indicators of subsurface hydrocarbon gen-eration and entrapment: Organic Geochemistry, v. 40,p. 365–375, doi:10.1016/j.orggeochem.2008.11.009.
Whiticar, M. J., 1999, Carbon and hydrogen isotope system-atics of bacterial formation and oxidation of methane:Chemical Geology, v. 161, p. 291–314, doi:10.1016/S0009-2541(99)00092-3.
Whiticar, M. J., 2002, Characterization and application ofsorbed gas by microdesorption CF-IRMS: Near-surfacehydrocarbon migration: Mechanisms and seepage rates:AAPGHedberg Conference, Vancouver, British Colum-bia, Canada, April 7–10, 2002.
Abrams and Dahdah 1935