Embed Size (px)
Citation preview

RI 9523 REPORT OF INVESTIGATIONS/1994
PLEASE DO NOT REMOVE FROM LIBRARY
Surface Mine Blasting ear ressurlze Transmission Pipelines
By David E. Siskind, Mark S. Stagg, John E. Wiegand, and David L. Schulz
UNITED STATES DEPARTMENT OF THE INTERIOR
BUREAU OF MINES
UBAARY SPOKANE RESEARCH CENTER
F\ECEtVED
.I,,~,<j 1995
U6 eUREAU OF MINES e. 315 MQNTOOMERY AVE.
8PQt<ANE. WA 0025J7

U.S. Department a/the Interior Mission Statement
As the Nation's principal conservation agency, the Department of the Interior has responsibility for most of our nationally-owned public lands and natural resources. This includes fostering sound use of our land and water resources; protecting our fish, wildlife, and biological diversity; preserving the environmental and cultural values of our national parks and historical places; and providing for the enjoyment of life through outdoor recreation. The Department assesses our energy and mineral resources and works to ensure that their development is in the best interests of all our people by encouraging stewardship and citizen participation in their care. ,The Department also has a major responsibility for American Indian reservation communities and for people who live in island territories under U.S. administration.
Cover. U.S. Bureau of M'BIU!S ruetlf'Chers instDll strain and vibmtion sensors 011 transmission pipelines be/cw 1M pipelines Q1f! buried and bockjiJJed 011 a sur/lICe coal mine hit/twall. Five pipe sections were tested for their N!SpOIISe to blast vibmtions and poteTItial tlamage.

Report of Investigations 9523
Surface Mine Blasting Near Pressurized Transmission Pipelines
By David E. Siskind, Mark S. Stagg, John E. Wiegand, and David L. Schulz
UNITED STATES DEPARTMENT OF THE INTERIOR Bruce Babbitt, Secretary
BUREAU OF MINES Rhea L. Graham, Director
III
1':
1
il 'I i,i I [II
'.
··1'.1 '. , I.

International Standard Serial Number ISSN-l066-5552
-1 I

r
CONTENTS Page
Abstract. . . . . . . . . . . . . . . . . . . . . . . . . . . . . . . . . . . . . . . . . . . . . . . . . . . . . . . . . . . . . . . . . . . . . . . . . . . 1 Introduction . . . . . . . . . . . . . . . . . . . . . . . . . . . . . . . . . . . . . . . . . . . . . . . . . . . . . . . . . . . . . . . . . . . . . . . . 2 Background ........................................................................ 2
Pipeline impacts from large vibration events .............................................. 2 Southwest Research Institute studies . . . . . . . . . . . . . . . . . . . . . . . . . . . . . . . . . . . . . . . . . . . . . . . . . . . . 2 Other analyses of pipelines . . . . . . . . . . . . . . . . . . . . . . . . . . . . . . . . . . . . . . . . . . . . . . . . . . . . . . . . . . . 3
Experimental procedures .............................................................. 4 Test pipelines . . . . . . . . . . . . . . . . . . . . . . . . . . . . . . . . . . . . . . . . . . . . . . . . . . . . . . . . . . . . . . . . . . . . . 4 Material properties . . . . . . . . . . . . . . . . . . . . . . . . . . . . . . . . . . . . . . . . . . . . . . . . . . . . . . . . ; . . . . . . . . 5 Monitoring . . . . . . . . . . . . . . . . . . . . . . . . . . . . . . . . . . . . . . . . . . . . . . . . . . . . . . . . . . . . . . . ... . . . . . . 5 Mine site and production blasting . . . . . . . . . . . . . . . . . . . . . . . . . . . . . . . . . . . . . . . . . . . . . . . . . . . . . . 5 Strain gages . . . . . . . . . . . . . . . . . . . . . . . . . . . . . . . . . . . . . . . . . . . . . . . . . . . . . . . . . . . . . . . . . . . . . . 8 Vibration measurement ............................................................. 8 Surveying for settlement . . . . . . . . . . . . . . . . . . . . . . . . . . . . . . . . . . . . . . . . . . . . . . . . . . . . . . . • . . . . . 8 Pressurization .................................................................... 8 Vertical well and telephone cable ...................................................... 8
Monitoring results ................................................................... 9 Vibrations ....................................................•.................. 9 Strains. . . . . . . . . . . . . . . . . . . . . . . . . . . . . . . . . . . . . . . . . . . . . . . . . . . . . . . . . . . . . . . . . . . . . . . . . . 10 Stresses .......................................................................... 22 Settlement ............. . . . .. . . . . . . . . . . . . . . . . . . . . . . . . . . . . . . . . . . . . . . . . . . . . . . . . . . . . . . 31 Well and telephone cable ............................................................ 31 Final blast ....................................................................... 33
Analyses of fmdings .................................................................. 34 Blasting criteria for steel pipes ..........................................•....••....... 34 Blasting criteria for PVC pipeline ...................................................... 36
Conclusions ........•............................................................... 36 Acknowledgtnents . . . . . . . . . . . . . . . . . . . . . . . . . . . . . . . . . . . . . . . . . . . . . . . . . . . . . . . . . . . . . . . . . . . . 36 References . . . . . . . . . . . . . . . . . . . . . . . . . . . . . . . . . . . . . . . . . . . . . . . . . . . . . . . . . . . . . . . . . . . . . . . . . 37 Appendix A.-Southwest Research Institute studies ........................................... 38 Appendix B.-Vibration and strain data. . . . . . . . . . . . . . . . . . . . . . . . . . . . . . . . . . . . . . . . . . . . . . . . . . . . 44 Appendix C.-Survey data for five pipelines ............ . . . . . . . . . . . . . . . . . . . . . . . . . . . . . . . . . . . . . 51
ILLUSTRATIONS
1. Minnehaha Mine pipeline test area and the closer-in production blasts monitored ............... 5 2. Pipeline test area . . . . . . . . . . . . . . . . . . . . . . . . . . . . . . . . . . . . . . . . . . . . . . . . . . . . . . . . . . . . . . . 6 3. Placement of 16.8-cm pipeline in trench ........................................... , . . 6 4. Installing weldable strain gages on large steel pipe ...................................... 6 5. Strain gage and vibration sensor .... : . . . . . . . . . . . . . . . . . . . . . . . . . . . . . . . . . . . . . . . . . . . . . . . 6 6. Radial ground vibration versus pipeline vibration response ................................ 11 7. Vertical ground vibration versus pipeline vibration response ............................... 11 8. Vibration and response records for blast of September 28, 1992 ............................ 12 9. Vibration and response records for blast 27 ........................................... 13
10. Vibration and response records for blast 25 ........................................... 14 11. Comparisons of two pipelines' responses for blast 23 .................................... 15 12. Propagation plots of maximum vibration amplitudes ..................................... 16 13. Pipeline strains for blast 22 ....................................................... 17 14. Pipeline strains for blast 27 ....................................................... 18 15. Pipeline strains for blast 25 ....................................................... 19 16. Propagation plots of circumferential strains ........................................... 20

ii
IllUSTRATIONS-Continued Page
17. Propagation plots of longitudinal strains. . . . . . . . . . . . . . . . . . . . . . . . . . . . . . . . . . . . . . . . . . . . . . 21 18. Circumferential strain versus radial ground vibration . . . . . . . . . . . . . . . . . . . . . . . . . . . . . . . . . . . . . 23 19. Circumferential strain versus vertical ground vibration ................................... 23 20. Front longitudinal strain versus radial ground vibration . . . . . . . . . . . . . . . . . . . . . . . . . . . . . . . . . . . 24 21. Top longitudinal strain versus vertical ground vibration. . . . . . . . . . . . . . . . . . . . . . . . . . . . . . . . . . . 24 22. Circumferential strain versus transverse ground vibration ............................•...• 25 23. Longitudinal strain versus transverse ground vibration . . . . . . . . . . . . . . . . . . . . . . . . . . . . . . . • . . . • 25 24. Circumferential strain versus horizontal pipeline vibration response normal to axes .............. 26 25. Circumferential strain versus vertical pipeline vibration response . . . . . . . . . . . . . . . . . . . . . . . . . . . . 26 26. Front longitudinal strain versus horizontal pipeline vibration response . . . . . . . . . . . . . . . . . . . . . . . . 27 27. Top longitudinal strain versus vertical pipeline vibration response ........................... 27 28. Principal strain analysis for blast 25 ................................................. 28 29. Maximum strains versus 0.4 scaled distance ........................................... 30 30. Maximum stresses versus 0.4 scaled distance . . . . . . . . . . . . . . . . . . . . . . . . . . . . . . . . . . . . . . . . . . . 30 31. Strain from settlement versus time . . . . . . . . . . . . . . . . . . . . . . . . . . . . . . . . . . . . . . . . . . . . . . . . . . 32 32. Strain from settlement versus vibration amplitude . . . . . . . . . . . . . . . . . . . . . . . . . . . . . . . . . . . . . . . 32 33. Uplifted pipes following blast 31 ...............................•................... 33 34. Radial velocity criteria based on maximum circumferential strain and grade of pipe . . . • . . . • . . . . . . 35 35. Vertical velocity criteria based on maxim\un circumferential strain and grade of pipe . . . . . . . . . . . . . 35
TABLES
1. Pipeline characteristics • . . • . . . . . . . . . . . . . . . . • . . . . . . . . . . . . . • . . . . . . . . . . . . . . . . . . . . . . . . 4 2. Blasts monitored for pipeline response . . . . . . . . . . . . . . . . . . . . . . . . . . • . . . . . . . . . . . . . . . . . . . . 7 3. Highest vibrations and strains measured on any pipe . . . . . . • . . . . . . . . . . . . . . . . . . . . . . . . . . . . . . 9 4. Pipeline stresses .......................•....................................... 29 5. Accumulative pipe settlement. . . . . . . . . . . . . . . . . . . . . . . . . . . . . . . . . . . . . . . . . . . . • . . . . . . . . . 31 6. Maximum possible accumulative strain from vibration-induced settlement •................•... 31 7. Postblast tests of steel pipe ......................................•...............• 34
A-1. SwRI pipeline blasting experiments in soil .........................•.................. 38 A-2. SwRI pipeline blasting experiments in rock. . . . . . . . . . . . . . • . . . . . . . . . . . . • . . . . . . . . . . . . . . . . 41 A-3. Predicted stresses for three USBM blasts based on the SwRI equations . . . . . . . . . . . . . . . . . . . . . . . 43
, "

UNIT OF MEASURE ABBREVIATIONS USED IN THIS REPORT
Metric Units
em centimeter m/s meter per second
dB decibel min minute
g/cm3 gram per cubic centimeter mm millimeter
GPa gigapascal mm/s millimeter per second (particle velocity)
h hour MPa megapascal (million newtons per
Hz hertz square meter)
kg kilogram ms millisecond
km kilometer Pa pascal (newton per square meter) (pressure and stress)
m meter pct percent
m/k~.33 meter per scaled kilogram, cube root scaled distance s second
m/k~.4 meter per scaled kilogram, J.'mm/mm micromillimeter per millimeter 0.4 root scaled distance ( microstrain)
m/k~.s meter per scaled kilogram, square root scaled distance
U.S. Customary Units
cal/g calorie per gram in/s inch per second (particle (specific energy) velocity)
ft foot lb pound
ft/lh foot per pound Ib/ft2 pound per square foot (pressure)
ft-Ib foot pound (energy) Ib/in2 pound per square inch
ft-Ib/lb foot pound per pound (pressure and stress) (specific energy)
.lb-s2/~ pound second squared per
ft/s foot per second (propagation velocity)
foot to the fourth (mass density)
in inch Ib/yd3 pound per cubic yard
Reference to specific products does not imply endorsement by the U.S. Bureau of Mines.

r
SURFACE MINE BLASTING NEAR PRESSURIZED TRANSMISSION PIPELINES
By David E. Siskind,1 Mark S. Stagg,2 John E. Wiegand,3
and David L. Schuhz4
ABSTRACT
The U.S. Bureau of Mines and the State of Indiana cooperated with AMAX Coal Co. and its consultants to determine the effects of coal mine overburden blasting on nearby pipelines. Five pressurized 76-m pipeline sections were installed on the Minnehaha Mine highwall near Sullivan, IN, for testing to failure. Four 17- to 51-cm-diameter welded steel pipes and one 22-cm PVC pipe were monitored for vibration, strain, and pressure for a period of 6 months while production blasting advanced up to the test pipeline field. In contrast to previous studies of small-scale, close-in blasting for construction, these tests involved overburden blasts of up to 950 kg per delay in 31-cm blastholes.
Analyses found low pipe responses, strains, and calculated stresses from even large blasts. Ground vibrations of 120 to 250 mm/s produced worst case strains that were about 25 pct ofthe strains resulting from normal pipeline operations and calculated stresses of only about 10 to 18 pct of the ultimate tensile strength. No pressurization failures or permanent strains occurred even at vibration amplitudes of 600 mm/s.
lSupeIVisory geophysicist, Twin Cities Research Center, U.S. Bureau of Mines, Minneapolis, MN. 2Civil engineer, Twin Cities Research Center. 3Proprietor, Vibronics, Inc., Evansville, IN. 4Electronics technician, Twin Cities Research Center.

:i'i ,I,
1
i, 1
Ii
2
INTRODUCTION
The U.S. Bureau of Mines (USBM) participated in a study of surface mine blasting impacts on gas and water transmission pipelines in a cooperative effort with the Division of Reclamation of the Indiana Department of Natural Resources (IDNR), AMAX Coal Co.; and its consultants, Vibronics, Inc., New Mexico Institute of Mining and Technology, and Ohio Valley Pipeline, Inc. AMAX had concerns about blasting near active pressuru..ed transmission pipelines at its Minnehaha Mine, near Sullivan, IN, as well as at other mines. As a result, the company approached the USBM and other cooperators in the fall of 1991 about the feasibility of conducting a study involving a variety of test pipelines subjected to full-scale overburden blasts at one of its surface coal mines.
This project provided an opportunity to study a problem of widespread concern. Numerous requests for advice on blasting near pipelines have been received by the USBM over the. years, many related to mine or quarry operations. In a blast vibrations research planning document fIrst prepared in March 1989, the USBM identified blasting near pipelines as a key research topic and industry need. Although some work was done in the 1970's and 1980's on blasting near pipelines, none to the authors' knowledge involved large-scale production mine blasting. Most, if not all, previous work examined close-in, small-scale blasts representative of excavation for pipeline installations next
to existing lines. The industry and regulatory agencies need reali.,tic guidelines for mine blasting near pressurized transmission pipelines to ensure both maximum resource recovery and the safety of such utilities.
The USBM role was to install and operate monitoring equipment for measuring strain and vibration and to in· terpret the results of those measurements. Other cooperators had responsibilities for pipeline installation (Ohio Valley Pipeline). supplemental vibration monitoring and continuous monitoring of internal pressures (Vibronics), and analysis, interpretation, and monitoring support (IDNR and New Mexico Tech.). AMAX provided the site, costs of pipeline installation, security fence and other facility improvements, and shot coordination.
Installation and monitoring began in March 1992, ensuring reasonable weather for the difficult installation phases. Monitoring locations were chosen so that initial vibration levels would be about 50 mm/s. Five total mining cycles of roughly 45 days each brought the blasting adjacent to the pipelines.
This report is an expanded version of a paper given at the Ninth Annual Symposium on Explosives and Blasting Research sponsored by the International Society of Exn plosives Engineers, January 31 - February 4, 1993, in San Diego, CA (1).5
BACKGROUND
PIPELINE IMPACTS FROM LARGE VIBRATION EVENTS
Some previous work has been done on vibratiQn impacts on transmission pipelines. An examination of earthquake-induced pipeline responses concluded that buried pipelines move with the ground and not differentially. The most serious concern was for locations where the soil-rock characteristics abruptly change (2).
The U.S. Army Corps of Engineers tested pipeline responses to a concentrated 9,OOO-kg TNT blast (3). One end of a 15-em-diameter, 67-m-Iong, pressurized pipeline was located only 24 m from ground zero. Although that end was in the crater and ejecta zone and experienced some permanent deformation, no visible breaks occurred. Internal pressure had dropped from 3.45 to 2.76 MPa, but no leaks could be seen. Peak dynamic strains, all measured longitudinally, were 1,100 to 1,400 J.'mm/mm, and estimated total strains, including those from pressurization, were about 1,550. The authors of the Corps
report estimated yield stresses and strains of 414 MPa and 2,000 p,mm/mm, respectively, and reported measured radial vibration of 4,270 mm/s (168 in/s).
SOUTHWEST RESEARCH INSTITUTE STUDIES
The most extensive studies of blasting and pipelines were those of Southwest Research Institute (SwRI) for the Pipeline Research Committee of the American Gas Association (4-1). SwRI and its sponsors were concerned with both mining and close-in construction blasts, particularly in the installation of new pipelines next to existing ones. However, because the initial soil tests and the followup tests involving blasting in rock all used small charges and short distances, there is a question of how applicable their results would be to the much larger mining blasts. Many if not all of the SwRI tests involved pipelines close to or
------------.----------------------------sItalic numbers in parentheses refer to items in the list of references preceding the appendixes at the end of this report.

r f .:':
within the zone of inelastic strain and permanent deformation. Appendix A describes the SwRI tests and results and also the adjustments made to the SwRI predictions in a more recent paper by Lambeth (8).
OTHER ANALYSES OF PIPELINES
Lewis L. Oriard, in his capacity as consultant for many pipeline projects, commented on the USBM's pipeline measurements given in Siskind's 1993 paper (1) in two personal communications to the senior author (9-10). His involvement with many large pipeline projects as well as roughly 350 urban pipeline and utility projects has led him to conclude that the blasting risk to pipelines is from block motion (permanent strain) or from having the pipeline in the actual blast crater zone. He suspects that no elastic wave (vibration velocity) criterion is needed, nor is it meaningful. Oriard also concludes that failure is initiated in the surrounding ground, which is weaker than the pipe, and that it is better to apply either vibration criteria or blasting criteria to the ground around the pipe rather than to the pipe alone. Oriard reported on a 2,000-km pipeline project adjacent to an existing high-pressure gas line. Blasting was as near as 4 m, with a safe-level criterion of 300 mm/s. Several unscheduled blasts were detonated, the largest consisting of nearly 27,000 kg (60,000 Ib) of explosives along 2.1 km (7,000 ft) of trench, detonated instantaneously. Particle velocities were calculated to range as high as 2,500 to 3,700 mm/s. No damage occurred. Oriard also commented on very large strains (bending) observed during installation or relocation of pipes, even while the pipes were still pressurized, without damage.
Oriard's first communication also included a description of a blasting study he conducted on an unpressurized 37-m-Iong section of 91-cm pipeline with 11.13-mm wall. These were close-in tests with charges of 2.7 to 10.9 kg per delay. No damage was found even from the highest blast vibration: 318 mm/s, 1,494 JAmm/mm strain, and calculated circumferential and longitudinal stresses of 248 MPa (36,000 Ib/in2
) and 379 MPa (55,000 Ib/in2), respectively.
Jack L. Kiker who has consulted with Oriard on a variety of pipeline blasting projects, also commented on Siskind's 1993 paper (1). In a personal communication to the senior author, Kiker reported his experiences blasting within 3 to 6 m of an existing high-pressure pipeline (11). He reported one case in which a parallel ditch within 4 m of the blast had ground rupture cracks extending to the existing pipeline and in which peak particle velocities were 64 mm/s, without damage.
In another case, Kiker assisted on a project that involved blasting within 1.2 m of a 30-cm PVC sewer pipe. Vibration amplitudes up to 1,450 mm/s produced no damage. He also reported that vibration amplitude decreased 40 to 70 pct with depth at the typical pipeline
3
burial depth of 1 to 1.2 m. Agreeing with Oriard, Kiker believes that risk to pipelines comes from ground rupture and movement of fractured rock into the pipe at high velocity, and not from vibrations per se. His reasoning is based on the short duration of these stresses, the strength of the pipe relative to the surrounding ground, and the limits on the amount of stress that can be transmitted from ground to pipeline because of these strength differences. As with the SwRI tests, all the tests of Oriard and Kiker involved small, close-in blasts.
Dowding's book (12) contains analyses of both unlined tunnels and buried pipelines. He addresses the cases where pipelines have low stiffnesses compared with the confining media, defining a flexibility ratio (J):
J = -=---__ E...:..../(~l_+_II.....[.)....._-
[6EpIp/(1 - II~) ](1/r3)'
where E and Ep = Young's moduli of ground and pipe, respectively,
and
II and lip = Poisson's ratio of ground and pipe, respectively,
Ip = moment of inertia of pipe, 1/12h3b,
r ::; pipe radius,
h = pipe wall thickness,
b = unit length along axis of pipe.
Citing work by Peck and others (13), Dowding states that, for J greater than 10, the restrained pipelines can be considered to be completely flexible and to deform with the ground. For lower J values, the strains in the pipes will be smaller than those in the surrounding medium. Using Dowding's values for soil of E ::; 10" Ib/in2 and II ::; 0.25, J values are 28, 8.3, and 2.7, respectively, for the 50.8-, 32.4-, and 16.8-cm steel pipelines studied by the USBM and 82 for the 21.9-cm PVC pipe. The two smaller steel pipelines do not appear to meet the flexibility criteria. Considering the very wet conditions for the USBM tests, an E of 10" Ib/in2 for the soil is probably too high, potentially reducing the J value. In addition, there are possible stiffening effects from internal pressurization that are not addressed here.
For cases of high J (> 10), such as those of the larger steel and PVC pipelines tested by the USBM, Dowding gives formulas for bending and stretching strains (f) for plane wave vibrations propagating parallel to the pipeline (worst case):

;1
II' '1
4
Bending: u21!"fr
e =--, 2 cs
where u = peak particle velocity,
f = frequency, Hz,
r == pipe radius,
and Cs = seismic S·wave velocity.
Stretching: U e "'_, cp
where cp == seismic P·wave velocity.
For circumferential strains perpendicular to the axial strains and conditions of pure shear, Dowding gives a maximum strain:
u e =-,
2cs
where Cs = seismic S-wave velocity.
The difference in stiffness between the steel and PVC is consistent with the significantly higher longitudinal strains (bending) measured by the USBM on the PVC. In this case, the strains are bending responses of the pipelines resulting from the components of compressional waves normal to the pipe axes or shear waves parallel to the axes.
O'Rourke and Wang give nearly similar relationships for bending and stretching of pipelines in totally confined and rigid conditions (2). For ground motion along the axis of the pipeline, they specify a maximum axial strain of
which is the same as Dowding'S. For ground motion perpendicular to the pipeline, they give a maximum curvature (bending) of
B d· 2·".{u en mg .. --, 2
cs
where velocity units are consistent. Because of the lack of the pipe radius term, it appears that "bending" is defmed here as elr.
EXPERIMENTAL PROCEDURES
TEST PIPEliNES
Five 76-m-Iong sections of transmission pipeline, with properties described in table 1, were installed on the AMAX Coal Co.'s Minnehaha Mine highwall bench for testing to destruction. They were all parallel to each other, with 3-m spacings, and also to the highwaU face at an initial distance of about 150 m, as shown in figure 1. The pipe positions, in increasing distance from the highwall face, are in the same order as listed in table 1. Ohio Valley Pipeline crew welded and installed the pipelines, using their standard procedures, after the USBM workers attached longitudinal and circumferential strain gages and sensors for vibrations in the center areas of the pipelines. All pipes were placed in trenches and covered with about 1 m of the excavated clay soil. Some pipes, particularly the 50.S-cm pipeline, were installed under very wet conditions. The area was compacted by a loader and dozer; however, the soil did settle a few centimeters during
the 7-month monitoring period. The pipes had three uprights each to provide access for pressurization and placement of pressure-measuring gages, and also to provide survey points to measure settlement and any other statictype responses. Figures 2 to 5 show pipe installation activities.
Table 1.-Plpellne characteristics
Outside Wall thick- Fill Age Material diam, cm ness, mm material type
Steel:1
16.8 4.78 Gas ..... Used X-42
32.4 6.35 Gas ..... Used Grade B
32.4 6.35 Gas ..... New X-42
50.8 6.63 Water .•.• Used X-56
PVC:2
21.9 8.43 Water .••. Used SDR26
Ilnltial preslMization 6.2 MPa (900 Ib/in2).
21nitlal pressurization 0.62 MPa (90 Ib/ln~.

r I r
t
It,: !
r
FiguM 1
• -H-.. 0 r--_J
, ...... , ...... I .. (, 17)
... I ...... ,,/
N
t
LEGEND
Closest blasthole for each shot Fence around pipeline field Instrument shed Outline of overburden blast Outline of parting blast
MATERIAL PROPERTIES
The grade of steel pipe refers to its specified minimum yield strength (SMYS) in pounds per square inch. Therefore, X-42 means a SMYS of 290 MPa (42,000 Ib/in2).
Grade B is equivalent to 241 MPa (35,000 Ib/in2). The PVC pipe has a yield tensile strength of 48.3 MPa (7,000 Ib/in2). Young's moduli for the two materials are 203 GPa (29.5 x 1()6lb/in2) and 2,760 MPa (4 x lOS Ib/in2), respectively. Poisson's ratio was assumed to be 0.3, consistent with SwRI analyses.
MONITORING
Measurements began as soon as the first pipeline was installed and the trench backfilled and continued until the fmal blast beneath the pipes 7 months later. After an instrumental shakedown period, complete monitoring of strains, vibrations, and pipeline pressures wag, done
0 !
445,000 E. +562,500 N.
100 I
Scale, m
5
200 I
whenever overburden blasting occurred in front of the pipeline field (figure 1). Monitoring procedures were modified in response to a variety of problems, particularly water-caused failures of some strain gages and buried vibration sensors and two instances of lightning strikes in the test area. Toward the end of the study, recorders were moved from the instrumentation shack to a van for improved vibration isolation. Also, toward the end, Vibronics installed additional vibration equipment in the area, including two strong-motion three-component systems. By the time the blasting reached within 50 m of the closest pipeline, five seismic systems were in place on the surface and two on the pipelines.
MINE SITE AND PRODUCTION BLASTING
The Minnehaha Mine is a surface coal mine, which blasts overburden by casting and also blasts a thick parting, using hole diameters of 31 em (12-1/4 in) and
I' I' I,
!i

6
Fi1:fn 4
JnstJIlling weldoble strain gages on Iorge steel pipe.
P/ocement of 16.8-an pipeline in trench. Strain gage and vibf'tllion sensor.

7
27 em (10-5/8 in), respectively. Charge weights per delay to account or adjust for the nearby pipeline field. The are as high as 950 kg. The highwaU, including the pipeline larger casting blasts were generally 5 rows of 10 holes field area, has about 2 m of clayey soil overlying about each. As hole depths varied, charge weights per hole and 12 m of shale. All nearby overburden blasts and a se- per delay also varied; those listed in table 2 are the lected number of parting blasts were monitored over a maximums. Hole depths were typically 20 m (66 ft) and 7-month period (figure 1 and table 2). The missed over- 13 m (43 ft) for overburden and parting, respectively. burden blast (blast 28) was at the pit's far west end and Delays between rows and holes in a row were 126 and not near the pipelines. 25 ms, respectively. Smaller parting blasts also used rei-
All blasts except the last (blast 31) were full-size over- atively long between-row delays of 67 ms, likely intended ~- burden casting or parting rounds. No changes were made to produce a modest cast.
Table 2.-Blasts monitored for pipeline response
Blast Date Time Charge weight, kg Distance,! Type of
Total Per delay m blast
1 .... 3-18 11:07 9,162 435 338 Parting. 2 .... 3-20 11 :11 11,166 135 1,064 Overburden. 3 .... 3-20 13:43 10,938 435 381 Parting. 4 .... 3-20 13:53 9,841 435 436 Parting. 5 .... 4-02 17:15 15,954 588 869 Parting. 6 .... 4-02 17:40 30,547 751 180 Overburden. 7 .... 4-02 18:41 10,202 218 933 Parting. 8 .... 4-29 11:24 14,175 464 802 Parting. 9 .... 4-29 19:20 13,561 539 347 Parting. 10 ••. 6-02 11:20 22,482 626 756 Parting. 11 6-02 17:21 24,398 639 146 Overburden. 12 ••. 6-05 11:15 27,524 n3 125 Overburden. 13 6-05 11:24 7,399 301 920 Parting.
r 14 6-05 14:07 8,073 181 951 Parting. 15 6-05 17:14 29,162 689 131 -Overburden. 16 6-10 09:23 32,968 959 192 Overburden. 17 8-03 14:13 10,408 465 387 Parting. 18 8-05 11:14 14,804 828 506 Parting. 19 8-06 14:55 17,245 600 552 Parting. 20 8·06 17:09 30,373 731 88 Overburden. 21 8-06 18:04 30,374 964 88 Overburden. 22 ... 8-07 18:18 31,741 884 116 Overburden. 23 9·16 11:08 32,157 964 67 Overburden. 24 9-18 14.33 NO NO NO Parting. 25 9-18 10:54 30,526 839 50 Overburden. 26 9-19 14:25 27,072 872 74 Overburden. 27 9·21 12:09 25,249 668 158 Overburden. 28 10-21 Missed NO NO NO Overburden. 29 10-23 11:18 34,457 839 15 Overburden. 30 10-24 15:54 19,575 706 52 Overburden. 31 10-24 16:25 2,880 743 1.5 Overpurden.
NO Not determined. IDistance is from closest blasthole to center of 16.8-cm (6-in) pipeline, which is closest to the
highwall, measured on the ground surface.

8
STRAIN GAGES
All pipelines had longitudinal strain gages on the top and front, and the 16.8~ and 50.8~cm pipes had circumfer~ ential gages as well. Two techniques for mounting strain gages on steel pipe were available, spot welding and adhesive bonding. Measurements Group type CEA-06-W250 C-350 weldable strain gages were initially chosen because of their ruggedness for the long monitoring period and the cold and wet field conditions. Weldable gages are precision foil strain gages bonded by the manufacturer to a metal carrier for spot welding to metal structures by the user. After surface preparation with a sanding disk, a sample metal carrier, supplied with each package of gages, was used to determine the proper energy setting and electrode force required to obtain a good spot weld. The twoelement, 90° strain gage rosettes were aligned on the pipe and held in place with masking tape. The metal carrier was then tacked in place by a few spot welds on each side, and the tape was removed. The gage was then welded around the edges by two rows of spot welds.
Following welding, a layer of butyl rubber and a sheet of thick aluminum foil was added for mechanical protection. To keep out moisture, which causes most of the field installation failures in strain gages, a liquid sealant (M-coat FBT) was used around all the edges of the aluminum sheet and also around the lead wires, as recommended by the strain gage manufacturer. Two two-element strain gages were installed, one on top and one on the front face, at the approximate center of each 76-m length of test pipe, and were aligned with longitudinal and circumferential directions.
About a month before the end of testing, Measure~ ments Group type CEA~06-250 UW 350 strain gages were epoxied to the 50.8-cm pipe. These were three-element 45° rectangular rosette configurations for principal strains. All strain gages used on the PVC pipe were also adhesive mounted. Figures 4 and 5 show instrumentation installation activities.
VIBRATION MEASUREMENT
Vibration transducers were attached to the top and front of the 50.8- and 16.8-cm pipelines. These were accelerometer-integrating amplifier systems with flat responses down to 1.0 Hz. The accelerometers on the larger pipe eventually failed from water intrusion in the satnrated clay soil. They were replaced by an immersible Alpha-Seis velocity transducer with flat responses down to 2 Hz, starting with blast 22.
Vibrations were also measured on the ground surface above the pipelines with sensors in shallow-buried impedance-matching boxes. Both a Vibronics Alpha-Seis
unit and a USBM three-component velocity gage were used throughout the study. Additionally, Vibronics installed two strong-motion systems (Dallas Instruments SR-4's) in the pipeline area starting with blast 20.
For all blasts, the radial direction was fIXed as the horizontal perpendicular to the pipelirie axes, with the transverse then being parallel to the axes. It was not possible to re-orient the monitoring systems for true "radial" and "transverse" with respect to the blasts nor was it desirable for assessing pipe responses.
SURVEYING FOR SETTLEMENT
Periodic surveying was done by AMAX using a laser transit to detect settlement, both natural settlement and any that could be attributed to the blasting. Of particular concern was strain-producing differential settlement of the type found by Linehan and others from pile driving near pipelines (14). Each pipe had three uprights extending above the ground surface, one near each end and one in the middle. Using these as indicators, eight surveys were done during the 7-month monitoring period with an emphasis on the last 5 weeks, during the heaviest blasting. Data are tabulated in appendix C.
PRESSURIZATION
Following installation, all five pipes were pressurized as shown in table 1. Pressures gradually increased in the steel pipelines, by 5 to 35 pct, as the ground warmed up from early spring to late summer. In the PVC pipe, by contrast, pressure dropped to less than half of initial (down to 0.276 MPa), consistent with information that Dring-jointed water pipes such as this leak continuously. There was no way to visually verify leakage for the buried PVC pipe, and no joints were instrumented. Pressures were monitored and recorded every 15 min by an automated system installed by Vibronics.
VERTICAL WEll AND TELEPHONE CABLE
AMAX had arranged for the installation of a vertical well off the east end of the 16.8-cm pipeline and both coaxial and fiber-optic telephone cables in front of the pipeline field. The 37-m-deep cased well was cemented to the coal and shale formations and monitored continuously by Vibronics for pressure during the study period. On four occasions, cement bond logs were run to evaluate the bond quality between the cement and both the well casing and the formation. The four logs were done on March 19, June 11, September 24, and October 27, when maximum particle velocities had been obtained of 13, 121, 242, and greater than 600 mm/s, respectively.

Indiana Bell technicians spliced together the six individual 84-m fiber-optic strands to make a single 466-mlong telephone cable. The total cable was then long enough for light-loss measurements and also contained six
9
additional weakness points. Tests were made by Indiana Bell before and after blast 29 using an optical time domain reflectometer and an optical attenuation meter.
MONITORING RESULTS
Up to 34 data channels, provided by both USBM and Vibronics, were used for each blast. Table 3 lists the highest measured ground vibrations, pipeline vibration responses, and strains for each blast. A complete list of all peak values is contained in the appendix B.
VIBRATIONS
Vibration amplitudes of the buried pipelines were less than corresponding motion components measured on the
ground directly above. There was a consistent and significant reduction of about 40 pet at a depth of only about 1 m, which was surprising. However, it is entirely in agreement with other studies (14) including USBM RI 8969 (15), which compared vibration monitoring on the ground surface and basement walls and floors. Figures 6 and 7 compare peak values for ground vibrations and 50.8-cm pipeline vibration responses for the radial and vertical components of motion.
Table 3.-Hlghest vibrations and strains measured on any pipe
Blast Vibration amplitude, mm/s Strain, I'mm/mm
Ground Pipeline Circumferential, steel Longitudinal, steel Longitudinal, PVC
1 ..... 13.2 9.4 5.3 4.3 6.9 2 ..... 3.8 1.8 2.8 1.18 2.5 3 ..... 10.7 5.3 2.2 2.9 4.9 4 ..... 9.1 6.4 8.0 1.6 7.0 5 ..... 9.1 3.8 3.6 1.1 2.0 6 ..... 67.1 30.5 28.0 12.5 30.3 7 ..... 5.1 1.8 2.5 0.7 1.0 8 ..... 7.9 NA 10.0 2.9 4.8 9 ..... 6.9 NA 6.3 1.8 3.6 10 5.3 NA NA NA NA 11 93.5 NA 66.4 26.0 35.0 12 121 NA 51.3 31.0 47.3 13 3.3 2.3 1.8 1.4 2.0 14 3.8 1.5 NA 1.1 2.5 15 88.4 48.0 48.3 32.4 38.5 16 67.1 35.8 20.9 15.6 25.5 17 17.3 NA 13.6 6.0 10.1 18 17.0 5.8 2.7 3.5 9.6 19 16.5 6.9 10.7 4.8 15.9 20 136.1 86.9 63.0 31.1 97.5 21 166.6 102.1 33.5 51.7 102.5 22 126.0 57.9 55.8 30.8 76.2 23 205.7 148.3 43.2 50.8 92.9 24 NA NA NA NA NA 25 241.8 211.3 53.5 60.8 137 26 148.3 95.5 44.0 44.0 63.0 27 81.3 41.1 25.4 24.3 37.6 28 NA NA NA NA NA 29 647.7 274.3 94.8 156 499 30 530.9 146.3 55.8' n,5 NA 31 NA NA 490 3,170 NA
NA Not available.
,
! :

10
The "Background" section raised the question of how faithfully the pipelines move with the ground. Figures 8 to 10 provide an answer. They show time history record comparisons for the 50.8-cm pipeline for three blasts of increasing size. The smallest blast (figure 8) produced nearly identical waveforms for the pipe and the ground above blast. With amplitudes about five times higher, blast 27 (figure 9) had ground vibrations and pipe responses that were similar but not nearly so alike as those in figure 8. The third and largest blast of the three (blast 25, figure 10) shows considerable differences, particularly for the radial components. This blast also produced a much higher pipe response frequency. Apparently, the degree to which the pipeline response matched the ground vibration was vibration level dependent. Maximum accelerations for the three examples were 13, 53, and 340 pct of 1 gravity, respectively, suggesting a possible influence on response of pipe weight in addition to confinement.
Comparisons between responSeS of the two pipelines instrumented with vibration sensors are shown in figure 11. These pipes, representing both the largest and smallest steel pipelines tested, showed similar response amplitudes, although with some differences in the vertical waveforms.
Vibration frequencies were low for the relatively small blast-to-pipeline distances. This was likely a site phenomenon with a clay-soil layer over the shale. When blasts were in front of the pipeline (e.g., 15, 21, 25), the radial components had much 7- to 9-Hz energy. For these very close-in blasts, high-frequency vibrations were also present, which would normally be highly and selectively attenuated at any appreciable propagation distance in the clay-soil layer .
Propagation plots for maximum measured vibration amplitudes are shown in figure 12 for 0.4, square root, and cube root scaled charge weights. Maximums were used rather than individual components because radial and transverse components were aligned with the pipelines rather than adjusted for the direction to each blast. Over the range of distances and charge sizes represented in the plots, any of these plots can be reliably used to predict vibration amplitudes, with the scaling factor having no significant influence for this specific test site.
The cube root scaled propagation plot can be compared with the similarly scaled summary in Esparza's SwRI paper (7). The SwRI measurements go up to only 8 m/kgO.33 (20 ft/lb°.33), with the prediction line extrapolated to higher values. The attenuation exponent for USBM data is -1.33, compared with the SwRI value of -2.37. This is likely related to the relatively low attenuation of seismic energy in rock (USBM) compared with soil (SwRI) and possibly to seismic wave energy in contrast to plastic yielding. For conversion of the metric scaled distances
shown (m/kgX) to traditional engineering units of ft/lbX use
the following:
Scaling factor (x)
0.33 0.40 0.50
STRAINS
Multiply by
2.52 2.39 2.21
Sets of strain recordings from three of the larger blasts are shown in figures 13 to 15. For lower amplitude blasts, less than about 80 mm/s, the traces are symmetric about the zero line. Because tensions and compressions were about equal, bendings were approximately symmetrical and behavior was strictly elastic. Above this amplitude, some strain records show jumps that were either instrumental or represent real "adjustments" in pipeline positions, e.g., permanent vibration-induced displacements and settlements.
Strain propagation plots of strain amplitudes versus scaled distances are given in figures 16 and 17. These are strains from blasting alone and do not include the effects of pressurization. There is considerably more scatter than in the vibration propagation plots, probably because of response variations discussed previously, less than ideal coupling, and amplitude-dependent responses. At large distances (and relatively small vibration amplitudes), circumferential strains dominate. Closer in, there appears to be a limit on the amount of circumferential strain produced, and longitUdinal strain becomes dominant. This limiting in circumferential strain could be related to imperfect coupling and relatively strong resistance to ovaling (out-of-round) deformation. Unfortunately, some strain gage failures late in the study hampered a more complete comparison (appendix B). For the O.4-scaled plot, the USBM data can be compared with the SwRI prediction without "correction factors," which is similarly scaled. The SwRI stress and strain predictions depend weakly on pipe wall thicknesses. The lines representing their predictions and shown in figw'es 16, 17, and others were computed for their 61-cm pipe with a wall of 7.92 mm. A recomputed line corresponding to the USBM's 51-em pipe (wall of 6.63 mm) would be only about 9 pct higher, an amount that would make it indistinguishable from the one shown on the figures. Within the range of the actual SwRI values (low scaled distances), USBM-measured strains are lower. At larger distances, corresponding to a large extrapolation of the SwRI prediction, USBM values exceed the SwRI prediction. A plot through the USBM data (excepting blast 31, the final ground-motion-producing blast at a scaled distance of 0.98 m/kgoA) would have a shallower slope than the SwRI equation. Most of this difference is

11
Figure 6
250 I I I I I
~ KEY E 200 I- Pipeline -Z • 16.8-cm steel
0 0 0 50.8-cm steel
~ 150 ,.. -a:: (Q
> • • w 100 I- 0 0 -a. a. 0 i .....J t5' • 0 • < 0
0
Cl 50 f- 0 -< 000 0 .. CC 0 •
~ 0 1
....... I I I I I
0 50 100 150 200 250 300
RADIAL GROUND VIBRATION, mm/s
R6diIIl ground vibnIIion venus pipeline vibration response.
Figure 7
250 I I I I I
~ E KEY 0 E 200 I- Pipeline -Z • 16.8-cm steel 0 o 50.S-cm steel
~ 150 - • -m > 0
W • a. 100 -a. - 0
.....J
<:§ 0 • ·0 • ~ 50 I- 0 0 -dJ ~ w 0 0 II > 01+ 0
.IA iii I I I I I 0 0 50 100 150 200 250 300
VERTICAL GROUND VIBRATION, mmls
VerticoJ ground vibration and pipeline vibration response.

12
,
J
Figure 8
~ ro E
.:::t:. U :;:; '-(l) c. .se E E
LO
W o .::J I....J a.. ~ « z o ~ a: co >
0.0 0.2 0.4
Surface ground vibration
Radial
Vertical
Pipe response vibration··
Radial
Vertical
Transverse
0.6 0.8 1.0 1.2 1.4 1.6 1.8
TIME,s Vibration and response records for blast of September 2J4 1992 This blast was pad of a followuplUUllysis.

i .
Figure 9
~ ro E
.::s:. o :;::. ~ Q) a.
~ E o C\J
w o :::> J....J 0.. ~ <C Z Q ~ cr: co >
0.0
Surface ground vibration
Pipe response vibration
0.2 0.4 0.6 0.8 1.0
TIME,s
JlibTrllion and response records for blast 27.
13
Radial
Vertical
Transverse
Radial
Vertical
Transverse
1.2 1.4 1.6 1.8

14
Figu.re 10
~ E ~ "+=' '-Q) a.
~ E o (0
~
W o :::> I:J 0.. ~ « z o ~ a:: c:o >
0.0 0.2 0.4
Surface" ground vibration.
Radial
Vertical
Transverse
Pipe response vibration
Radial
Vertical
Transverse
0.6 0.8 1.0 1 .2 1 .4 1 .6 1.8
TIME,s

Figrn 11
.::J:. (ij E
.::t:. o +=i ~
(I) a. !!!. E E o LO
Z o ~ a: aJ > W 0.. 0..
0.0 0.2 0.4
CompIIIisons of two pipelines' TeSJ1OIISe3 for blost 23.
15
Vertical
16.8-em steel
50.8-em steel
Radial
50.S-em steel
0.6 0.8 1.0
TIME,s

16
Figure 12
~ E z o ~ a; co > o z => o a: (!l
..................... ·::T:::::r::::r:::~::·~:·.J. ..... :.::::::::::: ..... , , 1 ,000 r.::::::::::::::::::::
'! ,:::: :j,:~~~)i~ .... :,;:; ... Vf.: ... :,;.,.O •. ~3.3) .. ,.";3., .... . .. ::::,::;,::: ,:;;,::;[1 .....:T
100
10 , •.•..•..•....•......... t··· ............. !,., ....... ~.
··········:::;:::··:::::: .. :::1,:: :
. .....•.... !, ..•...... : .. ';' . "
; ........ j ...... '''1' ·· .. ····· .. ·'1·· .. ···· .. ·' .. 1· "r
2 3 4 56789 2 345678
1 ° SCALED DISTANCE, mlkgO. 333
4,000~------~--~--~,-~~~~------~---r--~-r-r~~~------~
1 ,00 0 ~::::::::~"""'::::::"I.: .. · ........ : .. l:·:.: .. · .. I": ...... I,, ... :.: .. :.::::: .. ": .... : .•.... ].', .. : .•.. : ... ;,i, .... .:..:.:::1,,,.::: •. :.:: .•.. : ...... : ... : .... : ....... I ....... : .. :~y = 1, ;o~'( R/Wo. 4) ·1 .31.:;:,,:.; ..
, .. ; ...... :::::::.::::: "iT ···i:+.+:·T'T .. . r:::'" .......... "i '-1" , ro ,,,,,
j·~·.........i'.,.....I"'.l'···i··I·II]·I:~·::··:::·: 100
1 ° ..................
2 3 4 56789 2 3 4 5 2 10
SCALED DISTANCE, mlkgO.4
1,000
100
1 0 ....... ,. ...... .. . .......... :: :~: -, , .... -... ,.).. . ....... ~ .. ,.,
..........•.• ::.': ..••.••.• :: .• ,]· •. · ••• ···.1 •.•• · ••. :[:.· •• :; .... y ....... , ....... :., ·········r ·······1· 1 5~~~~~~--------~----~3--~4~~5~~6~7~8~9~--------~----~3--~~~5~~6~7~8~9~
10 100
SCALED DISTANCE, mlkgO. 5
Proptlgtltion plots of nuaimum vibration amplitudes using cube root; 0.4 root and SIJ.llllN root cJuuge wei/llt scoling. GV is ground vibration (nunjs), R is distance (m). and W is cJuuge wei/llt per delay (leg).

Fig.ue 13
~ as E
.::t:. o ;:; ... CJ) a. E E E ~ o C\I
~
Z <C a: ~
0.0
Pipeline strains for blllst 22
0.5 1.0
TIME,s
17
21.9-cm PVC, front longitudinal
50.S-cm steel, top circumferential
50.S-cm, front circumferential
1.5 2.0

18
Figln 14
~ E
.::s! (,) +:: .. '-(J) c. E .E E E :i. o C\J
Z « 0: Ien
0.0
Pipeline strrJins for blost 27.
16.8-cm steel, front circumferential
16.8-cm steel, front longitudinal
0.5 1.0 1 .5 2.0
TIME,s

Figure 15
~ I-m E
...:v::: (.)
':+= I-Q) a.. E E -E E ::1.
0
""" Z « a: r en
0.0 0.5
Pipeline strains for blast 25.
1.0
TIME,$
21.9-cm PVC, top longitudinal
16.8-cm steel, front longitudinal
16.8-cm steel, front circumferential
16.8-cm steel, top circumferential
32.4-cm steel (new), top longitudinal
32.4-cm steel (used), top longitudinal
50.8-cm steel, top circumferential
50.8-cm steel, front circumferential
50.S-cm steel, top 45°
50.8-cm steel, top longitudinal
1.5 2.0
19
',-

, "
J
20
Figure 16
2,000.-----.---~_r_.._~~------r_--._._._~~TT----_.,__,
100
1 0
2 3 456789 2 3456789 2 3 10 100
SCALED DISTANCE, mlkgO. 333
2,000rr------r---T--T~_T~~~----~--~~~_r~~~~----_,
1,000
100
1 0
100
10
•....• ~ ..•.. j ····r . r "T
.. ,.,"',.:,::::::,·······:··,:,::::.:.::-::t[:] i i
56789 2 3 10
, ,
KEY Pipeline
• 16.8-em steel o 50.8-em steel
X .): *
: . --SwRl, 61.0-em steel SwRl, 76.2-em steel
SCALED DISTANCE, mlkgO.4
........ ~, ... ~ ... ···!····r'
2
.' 1 4~~5~~6~7~8~9~--------~----~--~4--~5~6~7~8~9~--------*2----~3~~~~~~~~ 110
SCALED DISTANCE, mlkgO. 5
Propagation plots of circumferential stmins.

Figure 17
4,000~-'r-'---'-~~-r'-rrr-----'---'-~-'~-rrTT------r--~
E E -E E ::i
Z
~ ~ ...J <3:: Z Q ::> I-CJ z 9 ::: ::> ::: ~ ::2
100
10
100
10
5 6 7 8 9 10
SCALED DISTANCE, mlkgO. 333
0.58 9 2 4 5 6 7 8 9 2 3 5 6 7 8 9 2 1 10 100
SCALED DISTANCE, mlkgO. 4
4,000~ __ ~~~------~--~~ __ ~~~~----~--~~~~-r~~
100
0.54 ·····s······6····7····8 .. ~ ... ··························2··············3·········4·······s······6····7···ii··~··· ··························2··············3··········4·······5·····~ ·7···0··9
. 1 10 100
SCALED DISTANCE, mlkgo.s
Propagation plots of longitudinol strains.
21
it 1
! ;

:1:'
i"
I' I"
22
likely because of the medium involved, rock instead of soil, and the extrapolation of the SwRI data to compare with mining-sized blast situations. The same conclusion was found for the vibration data. The USBM's final blast, blast 31, did match the SwRI prediction; however, this blast, which lifted both the ground pipes, was defInitely not an elastic wave case, e.g., not a vibrations situation.
Measured peak strains versus ground vibrations are shown in figures 18 to 23 and strains versus pipeline vibration responses in figures 24 to 27, all strains being maximums. Comparisons shown in these plots are based on deformations expected to correlate with particular components of motion. For example, radial vibration compression waves (horizontal component perpendicular to the pipeline axes) are expected to flex the pipeline horizontally, causing maximum response on a longitudinal strain gage on the pipe's front (or back) side and to have little or no effect on a longitUdinal strain gage on the top (or bottom). By contrast, a vertical vibration would produce exactly the opposite response.
There is also ambiguity about particle motion directions for close-in blasts. The depth of the explosive for blasts within about 60 m causes the true radial direction to have a significant upward angle. This situation makes the vertical component more important in this study than in ,actual production blasting where distances would not generally be so close. Relatively high longitudinal strains were measured on the PVC pipeline compared with strains on the four steel pipes, consistent with the lower PVC stiffness. If the pipelines were all fully coupled and moving with the ground, this difference should not exist. Generally, similar measurements on the steel pipelines gave similar amplitudes (e.g., the front longitudinal strain of one pipe agreed roughly with other front longitudinal measurements). Circumferential strains were often, although not always, the highest, particularly when measured on top rather than on the side.
Measured strains were relatively low for the given particle velocities. The large blasts involved in this study produced high particle velocities at relatively large distances. Hence, the pipelines experienced high vibration amplitudes at distances far enough to be clearly beyond the inelastic damage zone. By contrast, the SwRI studies measured high amplitUdes only in the likely inelastic near zone. In addition, charges were in blastholes, vertical columns longer than the closest blast-to-pipeline separations. Again, this setup contrasts with that of the previous SwRI studies involving close-in "point" sources. Direct comparisons are difficult because of the vast differences in charge sizes and distances between the SwRI tests and the USBM tests, and for other reasons such as the ambiguil'; in some of the constants, as discussed in appendix A. Another complication in making comparisons is the
possibility that the spatially extended mine charge with its relatively long detonation time impacts the pipeline less than a point-source-type blast. One comparison, using Lambeth's version of the SwRI prediction equations, is given in appendix A, table A-3.
For blasts 25 to 31, a three-gage strain rosette was used on top of the 50.8-cm (20-in) pipeline. Principal strains were calculated for these blasts, and in no cases did the peaks of the individual components occur in phase. Figure 28 shows an example of the principal strain analysis, with compression positive. In all cases measured, the components added in such a way that the principal strain peak was never much more than the maximum of those computed from single axes.
STRESSES
Stresses can be calculated from strains using the biaxial stress-strain equation given in the appendix A description of the SwRI analyses (5):
Use of these equations with the maximums rather than time-related values represents a worst case, assuming that circumferential and longitudinal peak strains occur at the same time and are of the same sense (both tensional or compressional). This computation of maximum possible stress is analogous to a pseudo vector sum compared with a true vector sum for three-component vibration analyses. Time-correlated strains should be employed to calculate true stresses. In addition, if e c and e 1 are of significantly different amplitudes, one will dominate the stress calculations. These equations generally overestimate stresses by up to 30 pct.
The principal strain analysis discussed previously showed that peaks did not coincide in time for the blasts analyzed and that simplified biaxial equations could be used:

Figure 18
250~------~------~-------r-------'--------r-------' E E -E E :i
Z
~ tn ....J
~ W a:: w u.. ~ :::J () a:: ()
200
150
100
50
KEY Pipeline
• 16.8-cm steel o 50.8-cm steel
0 0 0
• ~ 9.. • • •
0
• 50 100
0 0
0
• • •
150 200
RADIAL GROUND VIBRATION, mm/s
Cin:umferentitll stmin venus TtJdiol ground vibTtJlion.
Figure 19
E 250 I I I I
E -E KEY
E 200 - Pipeline :i • 16.8-cm steel
Z 0 50.8-cm steel
~ 150 -tn ....J < !z 100 I-
W a:: w 0 0 u.. ~ 50 - El 0 ~ :::J 0 0 • ()
~. 0 0 • • • ~ a:: • () oi. • • • I I I I
0 50 100 150 200
VERTICAL GROUND VIBRATION, mmls
Cin:umferentitll strain venus vertical ground vibration.
250 300
I
-
-
-
• 0 -
I
250 300
23

!
I::'
·1
< :
.,1
,
I, 1 ,
24
FiguN20
E 250 E I I I I -E E KEY ::i 200 - Pipeline
Z • i6.S-cm steel
~ • 32.4-cm (used) steel o 50.S-cm steel
~ 150 I- + 21.9-cm PVC
..J « Z 0 100 I- + + :::> .-(!) + Z • 9 50 l- • I- ~ • z ,,61 ~ iii • !AI ~ +
O~· I I I I U.
0 50 100 150 200
RADIAL GROUND VIBRATION, mm/s Front 1onfitudiM] strain wnw' TtUliIIl ground vibTlllion.
Figure 21
E 250
E -E [ 200
Z ~ 150 ~ ..J « Z
100 0 :::> I-(!) z 50 9 a.. ~
KEY Pipeline
. 0' 32.4-cm (new) steel • 32.4-cm (used) st~el o 50.S-cm steel + 21.9-cm PVC
+ +
++ +
gli! 0 • !il •
100
+
9 + + 6 0 Q !il
150 200
VERTICAL GROUND VIBRATION, mmls
Top longitudinal strain versus vertical ground vibTlllion.
I
-
-
-
-
I
250 300
+
0 0
•
250 300

25
Figtn22
E 250 I I I I I
E -~ E KEY
E 200 - Pipeline -::::t. • i6.8-cm steel
,~ Z 0 50.8-cm steel
~ 150 ~ -~ ...J « I- 100 - -Z • w ex:: 0 w 0 0 u.. 0 • ~ :::E 50 I- Cb -
0 0 0 :::> • () ~ 0 •• •• • ~
ex:: 0 • () O~~ • • I I I I I
0 50 100 150 200 250 30Q
TRANSVERSE GROUND VIBRATION, mm/s Cimunferentit.d sI1rIin vemu tmnsveTse ground vibradoll.
Figtn23
250 I I I I I
E E KEY -E 200 - Pipeline' -E • 16.8-cm steel ::::t. 0 32.4-cm steel (new and used)
Z o 50.8-cm steel + 21.9-cm PVC 0
~ 150 ~ -
~ +
...J < 100 - + + -Z + 0 + ° ~ :::> 1- .. + II (!) 50 - + C • ° -
0 Z + ~6 °Il 9 + + • I:l i, ~i !J ~
i i e
r I I L I , .. 0 I 0 50 100 150 200 250 300
I /'!I
TRANSVERSE GROUND VIBRATION, mmls ,I:, .,,',
i' ,
LongitutlinDl stmin venus transverse ground vibradoll. Ii,: I'II .' : :r' ; ,I;

26
Figure 24
250 E I I I I I
E - KEY E E 200 I- Pipeline -:1. • 16.S-cm steel
Z 0 50.S-cm steel
~ 150 - -'Ii ~ Ii 'j .....J
: , oct:: , i
~ 100 I- -W a: 0 w
0 LL :IE 50 I-
o. -:::>
0 0 0 0
,!i 0 o. !I. 0 • 0 ..
Iii a: 0 O~ • • 11:" I I I I I
I' I,; 0 50 100 150 200 250 300
RADIAL PIPE VIBRATION, mm/s Cin:umfemttilll strain versus horizontIIl pipeline vibmtion TUpOIISe nomIIIl to IIXU.
,1:1
Figure 25
250 II E I I I I I :i
I' E - KEY i E I:
200 Pipeline E i- -:1. • 16.S-cm steel
Z 0 50.S-cm steel
~ 150 - -!n .....J oct::
I !z 100 - • -I' w a: 0
, W 0 U. I
:IE 50 0 • - 0 0 0 -:::> 0
i i () .0 ~
o. • • " I cr:
() ~. • ,: : I I I I I 0 0 50 100 150 200 250 300
VERTICAL PIPE VIBRATION, mm/s Cin:umferentiol strain versus venical pipeline vibration TUpOIISe.

27
Figure 26
E 250 E I I I I I -
~I(;- E KEY E
::i 200 - Pipeline -Z • 16.8-cm steel
i·~ ~
0 50.8-cm steel
~ 150 I- --' « z Q 100 - -:::> l-e!) z 9 50 - • -l- •• Z o 0 ~ o • ~ cf. 0
o~ I I I I I LL.
0 50 100 150 200 250 300
RADIAL PIPE VIBRATION, mm/s Front longiIudinIIl strain versus horizontol pipeline vibration n!SpOIISe.

28
Fi~28
~ '-ro E ~ .2 ..... '-Q) a. E E -E E ::i 0 C\I
Z <C a:
i' ! l-I en
I' .1'
0.0 0.5
Principal strain IlIIIllysis for blllst 25.
Top longitudinal
Top circumferential
Top 45°
Principal strains resolved from 450 rosette
1.0
TIME,s
1.5 2.0

~o,
(0\
Figures 29 and 30 show the maximum strains and computed stresses using the SwRI values of 203 GPa (29.5 x 1()6 Ib/in2) for Young's modulus and 0.3 for Poisson's ratio and based on the simplified biaxial equations. Also shown are the large-pipe SwRI measurements for these 0.4 scaled data and the SwRI prediction line extrapolated to large scaled distances. Generally, it is risky to use scaled distance plots to compare two sets of data with such different absolute distances. If comparisons are valid, the USBM data wolild be represented by a shallower slope than the SwRI prediction (rock versus soil), as already discussed. Close in, USBM stresses are relatively low except for the fmal blast (blast 31) just beneath the pipes and at a scaled distance of 0.98 m/kgOA • There was no question that permanent deformation of pipes and ground occurred with this final blast, and it is reasonable that responses were more similar to those found by SwRI than were the earlier, more distant, strictly elastic case USBM measurements. This blast is discussed in more detail later in the report in the section "Final Blast."
Circumferential or hoop stresses produced by internal pressurization can be easily calculated from the thin-walled cylinder equation:
Stress = PD /2t,
where P = pressure, Pa,
29
D = inside diameter,
and t = wall thickness, in consistent units.
Table 4 lists pipeline specifications and hoop stresses produced by internal pressurization. As the table shows, the pressurization-induced circumferential or hoop stresses for the two larger steel pipes are close to 72 pct of yield strengths (and would be exact if D was equal to the outside rather than inside diameters). The pressure used in the PVC pipe is considerably lower, probably because of the O-ring slip joints. Also in table 04 are both stresses and strains equivalent to 18 pct of yield strength. This 18-pct level is used by some transmission companies as an informal guideline for transient environmental effects such as traffic over a pipeline beneath a highway.
The minimum biaxial strain values in table 4 (last column) were calculated from the full biaxial stress-strain equation and represent the worst case assumption that the two strain components peak at the same time, are the same sense, and are the same peak amplitudes. They are minimums in that they are the lowest (most restrictive) values that correspond to the 18 pct of SMYS stress. More discussion of this 18-pct criterion follows in the section "Blasting Criteria for Steel Pipes."
Tabl. 4.-Plpelln • • tr .....
Pipe outside SMYS,l MAOP,2 Hoop stress from internal diam, cm MPa MPa pressurization, MPa
Steel: 16.8 •••• 290 3.86 64.2 32.4 .... 241 6.82 167 32.44 .... 290 8.18 200 50.8 386 7.23 270
PVC: 21.9 •••• 48 1.10 13.2
NAp Not applicable. lSMYS = specified minimum yield strength (1 MPa = 145Ib/in2). 2MAOP = maximum allowable operating pressure.
72 pct of SMYS, 18 pet of Minimum microstrain3
MPa SYMS, MPa at 18 pet of SMYS
209 52 179 174 43 150 209 52 179 278 70 239
35 NAp NAp
3Minimum strain that would produce stress equal to 18 pct of SMYS based on worst case biaxial equation prediction. 4New. All other pipes were used. 0
I. ,. '.
I ~
,
i i'

30
;:;
Figure 29,
E E -E E :::i;
1000'
100
10
, .... ·· .... · .. · .. ·· .. ·· .. , .. · .... · .. r· .... ·' .... ,j-.·! ':... .... . .. "r'kEY , ..'. .." ... '... ........ ... , .. ..... ~: ........ , .. ~. . ... . ... ~ .. .
Pipeline • i6.a-cm steel ... o 32.4-cm steel (new and used):::: o 50,8-cm steel'" + 21,9-cm PVC
I ! i'~ * i i ! i j ! i X SwRI 61,O-cm steel
2 3 456789 34 1 0
SCALED DISTANCE, mlkgO.4
Maximum stmiM lW3W' 0.4 sCilled distmu:e.
FiIjl4l'e 30
100"0
100
~ ::2: en 10 ffi 0: t;
........ ,.,. ........ " ...................... , ................................................................................... , ................................. .. ........... ... ..... ........ . ............... .. .... ..... .... .... , ..... .;., .. ,' ""'~ .... ~ .......... ".,.,' ........... , .. ,", ... , ... , ... "~, .. , .. " .. ,~ ....... ,' .... ,.~ ...... " .... ,.,., ~ .. ,
5 6 7 8 9 10
······f····
KEY Pipeline
• i6.8-cm steel o 32.4-cm steel (new and used) o 50.8-cm steel
5 6 7 8
SCALED DISTANCE, mlkgO. 4
2
1

SETTLEMENT
All transit survey data are given in appendix C. From elevation data, analyses were made of center-post settlement and maximum possible resulting strains based on Dowding's bending equation (12), as ground vibrations increased to over 600 mm/s. These results are given in tables 5 and 6 and figures 31 and 32, respectively. For this worst case analysis, the assumption was made that elevation changes did result only from vibrations, and not from natural compaction; water intrusion, the simple passage of time, or other causes. This is a significant assumption as clay soils are not particularly susceptible to vibrationinduced settlement. To do justice to the settlement issue, a careful and controlled study is needed. Settlement and strains for vibrations below about 120 mm/s are small and irregular enough to be attributed to measurement scatter and normal "settling-in." The next two levels, up to 240 mm/s, appear to be more significant, with strains approaching 20 pct of those resulting directly from blasting vibrations (figures 18 to 27). The highest vibration, exclusive of blast 31, produced about 650 mm/s and appears associated with a significant increase in both settlement and predicted strains. However, at 12 to 55 p.mm/mm, all
31
strains were an insignificant fraction of an 830-p.mm/mm level corresponding to the theoretical yield for Grade B pipe.
WELL AND TELEPHONE CABLE
For the well, three characteristics were evaluated: casing cement bond, zone isolation to control fluid migration, and casing integrity. The initial cement'bond logs showed greater than 90 pct bonding to the well wall including the Coal VII and VI Seams. After the 12O-mm/s blast at a distance of 124 m, some bonding loss ,was found for two zones of gray sandy shale. Overall, bonding was better than 85 pct and zone isolation was still maintained.
Another bond log after 240tn.m/s (blast at 51 m) showed additional loss in one of the~e same shale zones. However, bonding was still better than 90 pct in intervals of 3 m directly above and below this zone, and zone isolation was maintained. The fmal test after all the blasting showed a total bond loss. The closest blast had been blast 29 at about 17 m, which produced a particle velocity of over 600 mm/ s. In all cases, the well maintained pressure and the casing was undamaged.
Table 5.-Accumulatlve pipe seWementl of center upright post, millimeter.
Maximum vibrations, mm/s
77.2 .................... . 120.9 ................... . 103.6 •................... 166.6 ..•......•.......... 241.8 ................... . 647.7 ............•.......
NO No data.
16.a-cm
-0.91 o 4.00 7.32 5.79
30.8
32.4-cm
-4.88 -2.13
0.91 5.49 4.57
32.0
Steel
2a2.4-cm
-0.305 4.27 7.01
11.3 11.6 41.1
5O.8-cm
-2.13 -0.91
1.22 6.10 8.84
37.8
PVC, 21.!km
NO 3.05 7.62
11.3 ~.75
38.4
IMeasurement accuracy is ±0.8 mm at the survey-to-midpoint upright distance of 53 to 55 m. 2New. All other pipes were used.
Table 6.-Maxlmum possible accumulative strain from vibration-Induced seWement of pipes, micromillimeter. per millimeter
Maximum vibrations, mm/s
16.8-cm
77.2 . . . ... . . . . . . . . . .. .. . . 1.5 120.9 . . . . . . . . . . . . . . . . . . . • 1.5 103.6 .. . . . . . . . . . . . . . . . . . . 3.5 166.6 ... '" . . . . . . . . . . .. . . 3.7 241.8 . . . . . . . . . . . . . . . . . . . . 4.3 647.7 .......... .......... 11.7 INew. All other pipes were used.
Steel
32.4-cm 132.4-cm
4.6 4.5 6.6 5.7 6.3 7.9
10.1 8.0 10.9 9.7 26.7 28.4
5O.8-cm
6.7 7.2
14.2 17.0 16.6 55.0
PVC, 21.!km
8.5 8.5
13.8 16.2 16.8 21.9 I'
i'

32
j':
Ii I
Figrn3J
60~----------~1------------~1-------------r-1-----------'
50 i-
40 f-
30 f-
20 f-
KEY Pipeline
• 16.8-em steel • 32.4-em steel (used) o 32.4-em steel (new) o 50.8-em steel + 21.9-em PVC
o ®
9 •
·0 o ••
o -
-
o -• + -
• -
O~------·~----I~~.--------~I~----------~I------------~ o 50 100 150 200
TIME, days
Figrn32
60~----~1-------1~-----~1----~1-------r-,----~,------~
50 I-
40 I-
30 -
20 -
10 f-
KEY Pipeline
• 16.8-em steel • 32.4-cm steel (used) o 32.4-cm steel (new) o 50.8-em steel + 21.9-em PVC
Q ffi ~
~ 9a • • 0 o • •
o -
-
-o • + -
• -O~---~·~I~. _____ ~I _______ I~ ____ ~I _______ J~ ______ I~ ____ ~ o 100 200 300 400 500 600
MAXIMUM VIBRATION, mm/s StTain from settlement vema vibration amplitude.
700

1 I
"
Indiana Bell's tests on the fiber-optic telephone cable found no breaks and an attenuation slightly lower after blast 29 than before (13.2 dB versus 13.9). This slight difference was attributed to warming from sunshine on both the equipment and exposed fiber ends. Admitting that the blast at over 600 mm/s had no immediate effect on the fiber optic, the Indiana Bell technicians could not guarantee that damage of an unspecified nature would not show up later. The buried copper coaxial cable was also undamaged by the blasting.
FINAL BLAST
Following production blasts 29 and 30 next to the fenced-in pipeline field (ftgure 1), a single row of four blastholes was drilled between the individual pipes to complete the testing program (blast 31). Figure 33 shows the results, with the severely bent but unbroken 16.8-cm pipe and the new 32.4-cm pipeline arching above the highwall swell. The largest pipe, the water-filled 50.8-cm pipe, was uplifted, parted, and fell back down, and the used 32.4-cm pipe was cleanly broken. The PVC pipe simply came apart at the O-ring joints. This blast produced severe uplift, with the explosive being below rather than next to the pipes. The distance listed in table 2 for blast 31 is the
Figure 33
Uplifted pipes following blost 31.
33
horizontal or surface projection; the true distance from each pipe to the closest explosive column top was 5 to 6m.
This blast was clearly different from the previous 30, producing permanent ground and pipe strain. Vibration levels were above 900 mm/s, although not meaningful for this situation, representing non-elastic responses. Strains shown in table 6 are possibly underestimates, as pipeline movement eventually parted the signal wires. All pipes lost pressure. The two unbroken pipes sheared off the end uprights as the center uplift pulled the ends closer. Pressure was then lost at the upright joints.
Strain values and computed stresses from this blast are included in figures 16, 17,29, and 30 for comparison with the SwRI prediction equations, as discussed in the section on stress. They were not included in the strain-versusvelocity plots (figures 18 to 28) because they were not true elastic wave particle velocities.
Following blasting, Texas Gas Transmission Corp. removed samples from the four steel pipes and tested them for strengths. All pipes had yield strengths above design minimums (table 7). In particular, the two that did not rupture from shot 31 had considerable margins, suggesting a significant factor of safety in the SMYS specifications.

--:-11 :
, I:
, :
i' 1 I ,'Ji
34
Table 7.-Postblast tests of steel pipe by Texas Gas Transmission Corp., megapascala
Outside diameter, cm
16.8 ......•...... 32.4 ............ . 32.42 ••••••••••••
50.8 ..........•..
290 241 290 386
Measured strengths
Yield at 5-pct elongation Ultimate tensile
456 610 267 354 436 521 417 494
lSMYS = specified minimum yield strength (1 MPa = 145 Ib/ln2). 2New. All other pipes were used.
ANALYSES OF FINDINGS
The last mining cycle brought the production blasting within 15 m of the closest pipeline (blast 29). There was little backbreak and no apparent permanent ground displacement at this minimum distance of 44 hole diameters. Vibration levels were 635 mm/s for this blast on the ground surface and 234 to 274 mm/s on the two instrumented pipelines, with no loss of pipe integrity (pressure drops). Figures 18 through 28, showing measured strains, are composites from two types of blasts, parting and overburden, different azimuthal directions, and five pipelines of two different materials. It is not surprising that considerable scatter exists in the summary figures, and a pipeby-pipe analysis reduces this scatter. Also in common with other studies, there were problems with continual use of strain gages and electronics in an unfriendly environment for an extended period of time. Generally, circumferential strains were higher than longitudinal by a rough factor of 2 for the lower vibration levels and were comparable or lower in amplitude at high vibrations (table 3). PVC pipe strains were slightly higher, probably because of their lower stiffness and more faithful conformance to ground displacement.
BLASTING CRITERIA FOR STEEL PIPES
Criteria are needed for blasting near pipelines that will ensure that damage will not occur and yet be reasonable with regard to resource recovery and other requirements for blasting. The pipeline industry itself must deal with this problem whenever blasting is needed for repair, replacement, or installation of an adjacent new pipeline. "Damage" is defined here as any failures leading to pressure or product loss and any plastic deformation (yield or permanent bending).
The Enron standard (6) specifies allowable stresses of 6.9 MPa for electrically welded and 3.45 MPa for gaswelded or mechanically joined steel pipes. Corresponding strains are 30.8 and 15.4 J,tmm/mm, considerably less than many measured values in table 3.
The previously mentioned criterion of 18 pet of yield strength is applied to transient excitation such as traffic on a highway crossing a buried pipeline. If this is adopted as a blasting criterion, the stresses and strains listed in table 4 would apply. It is not unreasonable to allow such a criterion for blasting, as it is unlikely that a pipeline would simultaneously be subjected to traffic stress and high-level blast vibration.
Internal pressurization at the MAOP produces circumferential stresses corresponding to about 72 pct of yield or the SMYS (table 4). The addition of a maximum dynamic stress of 18 pct brings this total to 90 pct. Esparza's SwRI fmal report includes five yield theories for biaxial states of stress (5). He says "many engineers tend to use the distortional energy criteria, sometimes called the HuberHencky-Mises Theory, as they believe it is the most accurate." The appropriate yield equation is then given as
f:J + :; ;~ + f;J · 1,
where 0 C' oland 0 y = circumferential, longitudinal, and yield stresses, respectively.
For a total circumferential stress of 90 pct of SMYS (0 c
= 0.90), the equation gives a maximum total longitudinal stress (oJ of 0.18 or, again, 18 pet of SMYS. This means that both stresses are limited to 18 pct of SMYS.
An initial estimate of a safe-level criterion for blasting is possible from the particle velocity strain comparisons from figures 18 to 23 and extrapolating particle velocities corresponding to 150 to 239 pmm/mm from table 4. Th~ vibration amplitudes corresponding to Grade B, X·42, and X-56 pipelines are then 127, 150, and 200 mm/s, respectively, for vertical vibrations and slightly higher for radial. These are shown in figures 34 and 35.

r FilJ.W 34
250~------~------~--------~------~------~~----~ E E -E
~ Z ~ tn ~ ~ w a: w LL ::E G a: o
x-56
200 x-42
150 Grade B
100
50 • ~ •
0 0 0 0
Q+ •• • •
0
0
• •
1
KEY Pipeline
• 16.8-cm steel o 50.8-cm steel
O~~-----L--------~------~~----~~--------~------~ o 50 100 150 200
RADIAL GROUND VIBRATION, mm/s RJJdUJl velodly aiterio btlsed on mo.rimum cimunferentiol strain and grade of pipe..
FiIJ.W35
250 300
250 ~-----r----__ ~---"""'----~I"""'7'----r-----' E E -E ~ Z ~ tn ~ !z w a: w LL ::E :::> ~ o
x-56
200 x-42
150 Grade B
100
50 0
•
0 ~
0 10
• I • I .
•
KEY Pipeline
• 16.8-cm steel o 50.S-cm steel
• 0
~
O .. ~----~--------~--~--~~------~--~----~------~ o 50 100 150 200 250 300
VERTICAL GROUND VIBRATION, mmls
Vertical velocity criteria based on maximum cimunfenmtial strain and grade of pipe.
35
Iii ii I"~

, , !
I ! 1.1 I i
36
It is important to consider if this approach is conservative. The 18-pct criterion allowed for traffic still includes a safety factor; the SMYS itself has a safety factor in that it is a "minimum"; and the blast data are well contained by the maximum value envelopes. Strains are calculated as worst case biaxial. Furthermore, the low frequency (and potentially higher strain-producing vibration) found here (S.6 Hz) is about as low as could be expected for such close-in blasting (16). On the other hand, the pipeline may not yet be fully coupled after only 6 months in the ground. The soil over the pipelines was softer than nearby undisturbed ground even after 6 months, despite the use of standard installation procedures. The problem of incomplete coupling and reduced responses at higher vibration amplitudes was addressed by deVeloping an envelope of maximums by extrapolating strains from lower level responses (flgures 34 and 35). Any additional work on pipeline responses from blasting should include consideration of improved or ideal coupling, or alternatively, a simple· and practical way of directly monitoring pipe response under backfilled conditions.
All the analyses in this study are based on elastic waves and the total absence of any permanent ground deformations or block movements into the pipeline vicinity. Distances between pipes and blasting must be sufficiently large to preclude direct blast-produced ground cracks, on the order of 100 blasthole radii. For a typical large surface mine blast, this would be about 16 m (S2 ft). Blasting
for construction, excavation, and new pipeline installation would likely be within this range, and there the concerns of Oriard and Kiker (9-11) and SwRI analyses (4-8) would apply.
BLASTING CRITERIA FOR PVC PIPELINE
Unlike the steel pipeline, the PVC pipe at the speru.ed maximum pressure experienced far less hoop stress than 72 pct of SMYS (table 4). It is likely that there is some other limiting factor, such as the O-ring couplings. The strain corresponding to the maximum operating pressure 1.1 MPa (160 Ib/in2) is 4,800 ISmm/mm, a fraction of the yield failure strain of 17,SOO. Again, a rough estimate of particle velocity is possible from the strain figures and a doubling for circumferential strain, which was not monitored on the PVC pipe. Assuming a maximum environmental strain equal to S pet of that produced by pressurization, or 1.3S pet that of yield, and the worst case maximum strain envelope (from figure 20), the corresponding strain would be 240 ISmm/mm and velocity would be about 250 mm/s. Because of the lack of actual circumferential strains and uncertainty about failure modes for PVC pipe, this level should be further reduced until more data are available. Again, a 125-mm/s (S-in/s) criterion seems reasonable. Possibly, users of PVC pipe have an environmental criterion similar to the 18-pct SMYS suggested for steel.
CONCLUSIONS
This report describes a study of full-scale blasting near pressurized pipelines. Although particle velocities of over 600 mm/s were sustained without loss of pipe integrity, it is recommended that 125 mm/s measured at the surface is a safe-level criterion for large surface mine bla~ts for Grade B or better steel pipelines. The same criterion is recommended for SDR 26 or better PVC pipe. The basis for this recommendation is that the pipes can tolerate a dynamic load equal to 18 pet of SMYS. It is suggested
that this criterion not be applied at construction sites if· experience has shown that higher or lower particle velocities are tolerable or appropriate. Also, no adjustment is believed needed for pipeline age, assuming the protective coating is intact, unless the pipeline is known to be at higher risk from previous damage or other causes. The same safe-level criterion also appears applicable, at a minimum, to vertical wells and telephone lines.
ACKNOWLEDGMENTS
The authors wish to thank AMAX Coal Co. and particularly John W. Brown, manager of drilling and blasting, for planning and sponsoring this study. USBM personnel, including Steven V. Crum, geophysicist, and Rolfe E. Otterness, mechanical engineer, provided valuable field assistance with installation and repairs to equipment. Willard E. Pierce, blasting specialist, then with the Indiana Department of Natural Resources, Division of Reclamation, assisted in the planning and execution as well as
monitoring activities from the regulatory standpoint. Ohio Valley Pipeline, Inc., installed the test sections and Texas Gas Transmission Co. provided useful technical reviews and suggestions, sections of pipes, and test results. Suggestions were also received from Catherine Aimone, department chair, mining, environmental and geological engineering, New Mexico Institute of Mining and Technology.

I I 1 'I
37
REFERENCES
1. Siskind, D. E., and M. S. Stagg. Response of Pressurized Pipelines to Production Size Mine Blasting. Paper in Proc. 9th Annu. Symp. on Explosives and Blasting Research (San Diego, CA, Jan. 31-Feb. 4, 1993). Int. Soc. Explos. Eng., 1993, pp. 129-148.
2. O'Rourke, M., and L. R. Wang. Earthquake Response of Buried Pipeline. . Paper in Proc. ASCE Geotechnical Engineering Division Specialty Conference, Earthquake Engineering and Soil Dynamics (Pasadena, CA, June 19-21, 1978). Am. Soc. Civ. Eng., 1978, pp. 720-731.
3. Huff, W. L. Essex-Diamond Ore Research Programj POL Storage and Distribution Facilities Test, ESSEX V, Phase 3. U.S. Army Eng. WatelW. Exp. Stn., Struct. Lab., Vicksburg, MS, Rep. WES TR SL-79-6, Sept. 1979, 101 pp.
4. Westine, P. S., E. D. Esparza, and A. B. Wenzel. Analysis and Testing of Pipe Response to Buried Explosive Detonation. Southwest Res. Inst., Rep. for Pipeline Research Committee, Am. Gas Assoc., July 1978, 173 pp.
5. Esparza, E. D., P. S. Westine, and A. B. Wenzel. Pipeline Response to Buried Explosive Detonations, v. II-Technical Report. Southwest Res. Inst., Final Rep., A.G.A. Project PR-15-109, SwRI Project 02-5567 for Pipeline Research Committee, Am. Gas Assoc., Aug. 1981, 249 pp.
6. ,Enron Gas Pipeline Group. Allowable Blasting Near Buried Pipelines, Engineering Standards 7155. Enron Corp., Houston, TX, Apr. 1988,12 pp.
7. Esparza, E. D. Pipeline Response to Blasting in Rock. Southwest Res. Inst., Final Rep., A.G.A. Project PR 15-712, SwRI Project 06-1609 for Pipeline Research Committee, Am. Gas Assoc., Sept. 1991, 68 pp.
8. Lambeth, A. Blasting Adjacent to In-Service Gas Pipelines. Proc. American Gas Association Transmission/Distribution Conference,
Operating Section Proceedings (Orlando, FL, May 17,1993). Am. Gas Assoc., 1993, pp. 455467.
9. Oriard, L. L. (Lewis L. Oriard, Inc.). Personal communication, Jan. 7, 1993. Available from D. E. Siskind, USBM, Twin Cities Res. Cent., Minneapolis, MN.
10. _. Personal communication, Jan. 20, 1993. Available from D. E. Siskind, USBM, Twin Cities Res. Cent., Minneapolis, MN.
11. Kiker, J. L. (Kiker Technical Services, Inc.). Personal communication, Jan. 15, 1993. Available from D. E. Siskind, USBM, Twin Cities Res. Cent., Minneapolis, MN.
12. Dowding, C. H. Blast Vibration Monitoring and Control. Prentice-HaU, 1985, pp. 169-171.
13. Peck, R. B., A. J. Hendron, and B. Mohraz. State of the Art of Soft Ground Tunneling. Paper in Ploc. First North American Rapid Excavation and Tunneling Conf. (Chicago, IL). Soc. Min. Eng., 1972, pp. 259-286.
14. Linehan, P. W., A. Longinow, and C. H. Dowding. Pipeline Response to Pile Driving and Adjacent Excavation. Paper in J. Geotech. Eng., v. 118, No.2, Feb. 1992, pp. 300-316.
15. Siskind, D. E., and M. S. Stagg. Blast Vibration Measurement Near and on Structure Foundations. USBM RI 8969,1985,20 pp.
16. Siskind, D. E., S. V. Crum, R. E. Otterness, and J. W. Kopp. Comparative Study of Blast Vibrations From Indiana Surface Coal Mines. USBM RI 9226,1989,41 pp.
17. Wiss, J. F., and P. Linehan. Control of Vibration and Blast Noise From Surface Coal Mining (contract J255022, Wiss, Janney, Elstner, and Assoc., Inc.). USBM OFR 103(2)-79, 1978,.v. 2, 280 pp.j NTIS PB 299 888.

: I
38
APPENDIX A.--SOUTHWEST RESEARCH INSTITUTE STUDIES
The extensive studies of blasting near pipelines by Southwest Research Institute (SwRI) for the Pipeline Research Committee of the American Gas Association (4-7) were primarily for construction blasting for the installation of new pipelines next to existing ones. The original SwRI comprehensive "fmal report" authored by Westine and others in 1978 -(4) was superseded by a more comprehensive report by Esparza and others in 1981 (5), which included additional tests, analyses, and revised stress prediction equations.
SwAl EXPERIMENTAL RESULTS
Six series of tests involVed pipelines and blasting in soil (5). Pipeline sizes and other test parameters are listed in table' A-l. The two smallest pipes were approximately 1/8- and l/4-scale models of a 61-cm (24-in) diameter pipeline. Those two and the 4O.6~cm pipe were specially installed for the study (test Series A). The 61- and 76.2-cm pipelines were located in Kansas City, MO, and Madisonville, KY, respectively, with only the latter pipeline pressurized (to 2~76 MPa, 400 Ib/in2) during the blasting tests (series B and C)" Except for the in-service Madisonville pipeline, all tests were on relatively short pipe sections of 2.1 to 13.7 m. For all tests, the pipe lengths were at least twice the distance to the explosive charge.
Test series D and E studied lines and grids of charges oriented parallel and at various angles to the pipelines. The distances in table A-1 correspond to the closest charge, with each individual charge so small as to be a point source. Only a few of the grid tests used delays between charges of 3 to 6 ms.
The two-media tests (series F) had small point charges in holes in a 3- by 3- by 0.9-m-thick concrete slab 0.9 m from a test section of pipeline. This was intended to simulate blasting in rock, which was also addressed more seriously by SwRI in a followup study (7).
None of the SwRI tests approximated mine or quarry blasting, both of which have larger and more distant explosives, are frred in rock, and have mostly rock travel paths for the vibrations. Strain and vibration records from SwRI tests were very highly damped (e.g., 30 pet) with only one to two cycles of motion at extremely long periods of 60 to 250 ms, despite the closeness of the blasts. Some of the strain and vibration measurements had only one pulse and no rebound at all, suggesting permanent ground strain rather than elastic waves. SwRI ground vibrations were measured off to the side or on the opposite side of the blast from the pipe rather than above, next to, or on the pipelines. The authors avoided measuring in the disturbed ground but at the cost of an easy comparison with directly measured strains and vibrations. Because some directionality is possible for all blasts and likely for those done with multiple charges, this monitoring procedure could have contributed to th~ vibration amplitude scatter.
Only a few SwRI measurements involved pipelines under internal pressurization, mainly test C in table A-l. This large pipeline in Madisonville, KY, is rated at 414 MPa (60,000 Ib/in2
) specified minimum yield strength (SMYS) and was being operated at a reduced pressure of 2.76 MPa (400 Ib/in2) during the blasting tests. A maximum allowable operating pressure (MAOP) of 6.8 MPa (990 Ib /in2) for this pipeline would produce circumferential stresses of about 290 MPa, corresponding to about 70 pct of SMYS. Blasting-induced stresses ranged up to 103 MPa (15,000 Ib/in2
) from particle velocities of roughly 500 mm/s (20 in/s), without damage. This represents about 25 pet of the pipeline's SMYS to be added to stresses from pressurization. The pipe-to-charge distance was 2.74 m, and the actual measured velocities were 1,831 mm/s at 1.83 m and 358 mm/s at 3.66 m. It is not known if the pipe would have failed if it had been operating at MAOP.
Table A-1.-SwRI pipeline bl.stlng experlmentaln soli (5)
Test Pipe dlam, Pipe wall, Distance range, Charge size, cm mm m kg
A. Point source ..... 7.5 1.50 0.23-3.35 0.014 -0.50 15.1 2.36 0.30-6.86 0.014 -1.82 40.6 13.1 0.30-0.91 0.014 -0.027
B. Point source ..... 61.0 7.92 1.83-3.96 2.27 -6.82 C. Point source ..... 76.2 8.74 2.74-4.57 1.36 -2.27 D. Une of charges .•. 7.5 1.50 0.45-4.57 10.Q153-0.182
15.1 2.36 0.45-4.57 10.0153-0.182 E. Grid of charges .•. 15.1 2.36 0.45·1.22 20.025 -0.153 F. 2-media tests .... 15.1 2.36 1.52-3.35 0.114 -0.182
lWeight of explosive per hole, seven holes in a line. ~eight of explosive per hole, three rows of four holes.

SwRl THEORETICAL ANALYSES OF VIBRATION
The SwRI authors derived relationships for ground motion and strains based on similitude theory, theoretical energy, conservation of mass and momentum, 11" theorem, and shock front propagation (5). Because the authors used empirical vibration data to derme the equations' terms, it is not clear how predictions from these equations differ from the USBM's traditional and relatively simple charge weight scaling. The SwRI authors call any charge weight scaling other than cube root scaling "dimensionally illogical." The SwRI equations are complex, contain some difficult terms and parameters difficult to measure, and sometimes predict unrealistic amplitudes. Their equation, in its original U.S. customary units is
[
W jO.852 0.00617 pcz;.3
For easy comparison with the referenced reports, all units in the following discussions are being kept in the authors' original measurement system. A similar equation was also derived for displacement. Equation parameters are
and
U = peak radial ground particle velocity, ft/s,
R = standoff distance, ft,
We = explosive energy release, ft-Ib,
p = mass density of soil or rock, Ib-s2/ft4,
c = seismic P-wave velocity in soil or rock, ftls,
Po = atmospheric pressure, Ib/ft2.
The explosive energy release (We) requires some calculation. For example, ANFO is 912 callg, which is equivalent to 1.28 x 1()6 ft-Ib/lb (SwRI uses 1.52 x 10⁶). Multiplication by the amount of explosive (in pounds) gives the appropriate W. value. Mass density (p) and propagation velocity ( c) are not typically known with any precision or even adequately dermed for this analysis. For the SwRI tests, they pertain to the soil. For more distant blasts (e.g., > 10 m), it is not clear if they would pertain to the surface soil or the medium that provides most of the
39
vibration propagation path. Most situations will include a mixture of rock and surface soil.
Predictions from this SwRI equation were compared with measurements from single-charge blasts reported in USBM RI 9226 (15). Particle velocities were reasonably close for p and c of 2.7 g/cm3 (5.23 Ib-s2/ft4) and 3,000 mls (10,000 ft/s), respectively, but far too low for soil-type values of these two parameters. The plot of the SwRI equation velocity parameter also suggests two range regimes with a shallower propagation slope for the distant tests (left side) than for the close-in tests (right side) in their figure 64 (5). This again suggests a different strain mechanism close in or at least a different seismic wave type.
SwRI authors also derived simplified versions of their propagation equations for cases where
Few, if any, mining-type blasts fall within this range because of their relatively large distance (R); therefore, the simplified equations appear applicable only to construction blasts.
SwRI THEORETICAL ANALYSIS OF STRESS AND STRAIN
Two types of pipeline responses can occur, out-of-round deformation (ovaling) and bending, represented by circumferential and longitudinal strains, respectively. The circumferential strain is a measure of pipe deformation by ovaling. SwRI developed an equation for pipe ovaling natural frequency:
~Rr4 T = 8.11 S . ,
Eh3
where T = period (1/!),
Ps = soil density,
R = standoff distance,
r = pipeline radius,
E = Young's modulus,
and h = pipe thickness.

I,: ,
l,
40
The above equation assumes perfect ground-to-pipeline coupling. It al$O assumes that all the ground between the source and the pipeline contributes to the pipe's natural frequency, that is, all the ground within the distance specified by the R term. This equation must apply to only close-in cases (e.g., < 10 m). It is not reasonable to expect a pipe's response period to increase without limit for increasing R, nor for the ground at 100 m or more distance to contribute to the stiffness of a ground-pipeline system. The SwRI authors also say that the equation "may not apply for media with a significant elastic constant (perhaps rock)" (5) .. Applying this equation to the USBM's pipelines gives long periods of 6 to 50 s for even the closest blasts at 15 m.
Others (2, 13) subscribe to the assumption that a buried pipeline is relatively flexible and therefore will deform with the medium. If so, the dominant period of the motion is only a function of the wave propagation effects of the surrounding medium and the excitation motion itself. Interaction of delays will affect the excitation motion and is a function of delay interval, location, and the propagation medium.
The SwRI-developed strain relationships were based on theoretical considerations and contained constants that the authors said could not be explicitly evaluated. This required a statistical fit approach to their experimental data. Their resulting equations were
478 0.805
fcir = . X ,
0.735 flong = 1.98 X ,
where, for point sources,
nW X = . IEfi R 2.5
The terms in the X equation are as follows:
and
n = equivalent energy release (nondimensional, equals 1 for ANFO),
W = charge weight, Ib,
E modulus of elasticity, Ib/in2, typically 29.5 x 10⁶ for steel,
h pipe wall thickness, in,
R = distance between pipe and charge, ft.
For stress determination, SwRI used the biaxial stressstrain equation as a reasonable approximation for the relatively thin-walled pipes:
where v = Poisson's ratio,
and 1 and 2 = either the circumferential or longitudinal directions.
Depending on the particular strains used, such as maximums or real-time, the computed stresses can be true values or worst case maximums, analogous to pseudo vector sums in vibration analysis. Using the biaxial equation, SwRI produced a stress prediction equation:
0' = 4.44 E xO·77, Ib/in2 ,
which they report provides a good match for both circumferential and longitUdinal stresses, having standard errors of about 34 pct.
In addition to point sources, SwRI developed strain and stress equations for lines and grids of charges. These required some adjustments to the charge (W) and distance (R) parameters in the X equation. With a minor ex~ption, all these arrays used simultaneous initiation and, therefore, were not comparable to traditional delayed mining-type blasts.
SwRI authors also developed an adjustment factor for the strain and stress prediction equations to account for charge depths. Their concern was with the amount of soil backing up and stiffening the pipeline. This depth factor (F) is added to the X equation, which then becomes
X = nW . VEhFR2.5
The F factor is determined as follows:
where
F = 1 for R/H S 4,
F = - + _P_ for R/H > 4, [H P h] R PsR
R = actual charge-to-pipeline distance, ft,
H = amount of soil behind pipe along same line as R, ft,

'J
I
P p = pipe material density,
Ps = soil density (density units are arbitrary),
and h = pipe wall thickness, ft.
They also warn that this factor is based on only four measurements with 2O-lb charges at 70 to 200 ft and should be used very cautiously for stresses greater than the values corresponding to X = 10-6 (a = 3,142Ib/in2).
A sensitivity analysis was performed by the SwRI authors that shows some of the problems with their prediction equations. They found parameters R and W strongly influencing strains and stresses (and these parameters will also strongly influence vibration amplitudes). However, p and c had no influence at all on strains and are not included in either the strain or the stress prediction equations. By contrast, the complete vibration prediction equation given previously does include both p and c, as do the simplified versions. For vibrations, a doubling of c in the SwRI equation roughly doubles computed peak particle velocity, making it about as strong an influence as charge weight W. Using a simplified and approximate relationship for ground displacement, the SwRI authors were able to eliminate the dependence of stresses on p and c. This differs from many USBM and other studies that generally found particle velocity amplitudes unrelated (or, at best, weakly related) to these parameters. By contrast, frequency, and therefore by inference, displacement, was found to be strongly dependent (15). The reason for this disparity between blasting experience and SwRI predictions is not clear, as strains should in some way be proportional to particle velocity amplitudes or, at the very least, to displacements.
Based on the comprehensive 1981 SwRI report (5), the Enron Gas Pipeline Group published a standard for allowable blasting near buried pipelines (6). They used the SwRI stress equation along with the depth adjustment factor F. The Enron standard also provided two safe-level criteria of 6.9 MPa (1,000 Ib/in2) for welded pipeline and 3.45 MPa (500 Ib/in2
) for jointed or acetylene welded pipelines. The reason for these particular and very restrictive limits was not specified.
SwRI EVALUATION OF BLASTING IN ROCK
A highway construction project enabled SwRI to collect data on pipeline response that are more applicable to traditional millisecond delayed rock blasting (7). This study of two large pipelines involved larger sized charges, larger pipeline-to-blast distances (table A-2), and delays
41
between charges of 25 ms for 21 production blasts. The pipes were placed in trenches that were backfilled with sand and coarser material. Production blasting was in rock as was virtually all of the seismic wave travel path.
Table A-2.-SwRI pipeline blaatlng experiments In rock (7)
Pipe diam, Pipe wall, Distance Charge sizes, cm mm range, m kg
30.65 ..... 9.53 25 ·59 4.5-9.09 76.2 ...... 11.9 1.2-43 4.5-9.09
The resulting strain records have the appearance of elastic wave responses with many cycles of motion, in contrast to the results of the previous highly damped and close-in soil tests. Unfortunately, this appearance could be due to the multiple delayed charges and not to the elastic versus plastic responses. The one exception showing subdued response was from a blast at only 1.2 m, which, like the soil tests, appeared to produce soil permanent deformation strains. Stresses were computed from strain measurements and compared with the stress prediction equation previously presented for point sources in soil. Charge weights used were the amounts per delay because the delay intervals were long compared with the pipeline natural frequencies. This time relationship also justified using the point source rather than the array source equation. No depth factor (F) was used.
Stresses obtained were considerably less than those from the soil tests; in many cases they were single digit microstrains and barely larger than record noise. SwRI authors attribute this difference primarily to the larger distances. They also suggest an effect from the partitioning of explosive energy between fragmentation and vibrations, more relief for the rock blasting, and the use of delays in the rock tests. However, an alternative explanation is that the soil tests were so close as to involve nonelastic and permanent deformation responses while the rock blasting tests are more representative of responses to elastic waves. This possibility was presented in the earlier discussion of SwRI vibration monitoring in the main text (5).
SwRI recommends that the soil prediction equation also be used for rock cases with a free face parallel to the explosive array. The soil tests provide an almost perfect upper bound on the scatter from the rock blasting tests. It is likely that the measurements from the rock blasting tests are more realistic than the measUrements from the soil tests for evaluating surface mine and quarry blasting, although still only addressing small charge weights.

42
Alan Lambeth presented a paper at the 1993 American Gas Association Conference, which contained some new pipeline monitoring data and an analysis based on the modified version of the SwRI stress prediction equation (8). The monitoring was done on an out-of-service 61-cm pipeline with 1.6- to 12.5-kg charges at distances of 3.4 to 7.6 m. Again, there is a question of close proximity and whether elastic waves or plastic deformation were measured. Lambeth's paper showed no strain or vibration time histories to provide an evaluation of this question. Lambeth's str,ess amplitudes did reasonably agree with the SwRI prediction curve (5) for close-in blasts in soil.
Desiring to provide a universal blasting criterion, Lambeth started with the SwRI stress prediction equation version that includes the soil backing factor (F). To this, he added additional adjustments for powder factor, larger distances, skill of the blaster, and confinement, to predict a stress upper bound.
where Fc = confmement factor,
Fp = powder factor,
FL = large-distance factor,
E= Young's modulus, Ib/in2,
W = maximum charge, lb,
Fw = "who is blasting factor,"
lis = specific energy of explosives,. cal/ g (ANFO = 9(0),
t = pipe wall thickness, in,
Fh = soil backing factor,
and R = distance, ft.
The confmement factor (Fc), is 1;0 for blasting with free faces and 2.0 if movement is restricted.
Powder factor (PF) is also assumed to relate to vibrations. When in the range of 2.0 to 3.5 Ib/yd3, there is no penalty (Fp = 1). If PF is >3.5, then Fp = PF /3.5. If PF is below 2.0, than Fp = (2/PF)°.5. While it is possible that high powder factors can increase vibrations, penalties for low values are less justified. Weak rock can be effectively
blasted with low powder factors, with specific powder factors chosen for appropriate fragmentation and throw. Both the confmemeot factor (Fc) and charge weight (W) already account for the amount of energy and relief. Extensive studies of blast parameters for mining found these confmement factors to be of no significance to ground vibration, although important for airblast (17).
The large-distance factor (FJ was developed from Lambeth's analysis of USBM measurements. It is unity for distances under 200 ft and [0.009 (R - 200) + 1] for greater distances. This factor increases without bounds (e.g., 1 for 200 ft, 4.6 for 600 ft, 10 for 1,200 ft). Possibly it cancels out some of the excess distance attenuation represented by the Rl.925 factor elsewhere in the equation (based 00 Fh "" H/R; see below). A mOre direct approach would be to drop the FL correction and use a more ap-propriate attenuation exponent. ,
The ''who is blasting" factor (Fw) assigns a small penalty of 1.2 if someone other than the pipeline company is responsible for the blasting.
The soil backing factor (FJ comes into use when the charge depth is more than five times the pipe depth and was previously given in the SwRI report discussion. This multiplying factor increases indefinitely with increasing charge depth. For cases of potential permanent ground strain (close-in blasts), a good backing may constrain differential pipeline movement. However, its need is not evident in the more distant elastiC~wave~oiilycases:1\:t the same time, SwRI authors and those adapting the SwRI analyses have assumed perfect ground-to-pipeline coupling, which is not necessarily true because coupling can be highly variable. Although a free-surface multiplying factor of two times is justilled from dynamics theory, there is no rationale for an unbounded factor. For the USBM tests, described in table A-3, the depth ratios are about 10, and the corresponding stress increase factor from this Fh term is about 2.43.
Lambeth's version of the SwRI stress equation was tested on three of the largest USBM blasts, and the results were compared with measured values. Using the various adjustment factors, the predicted stresses greatly exceeded the measured values (based on worst case stress-strain conversions), the extrapolated worst cases based on ideal coupling, and theoretical stresses computed from Dowding's equations (12) (table A-3). Eliminating the questionably applicable factors gives more comparable results. For example, a blast 21 prediction with Fp, FL, and Fh equal to unity gives 25.8 MPa. This is exactly the USBM value for a worst case extrapolation from the measured strains, assuming they represent an ideal-coupled pipeline (table A-3). A similar computation for blast 29 was only about two times too high.
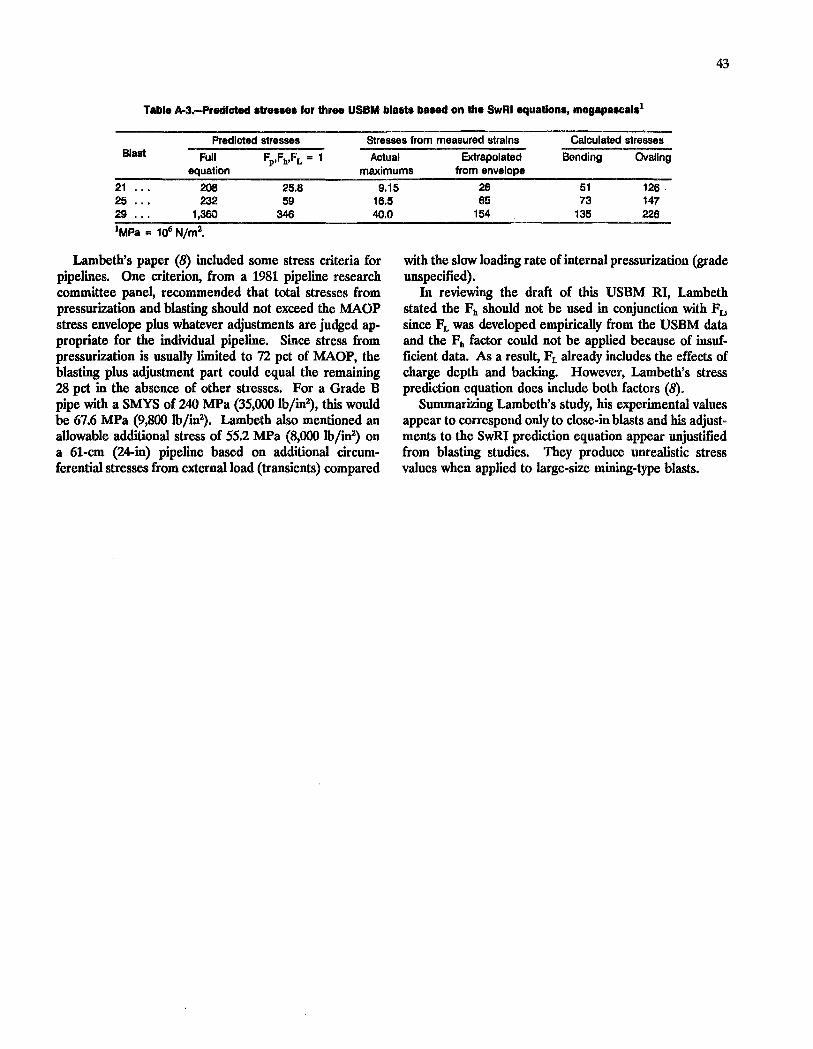
43
Tabl. A-3.-Predlcted .Ir ..... for three USBM bla.ts baaed on the SwRI equation., megapaacal.1
Predicted stresses Stresses from measured strains Calculated stresses Blast Full Actual Extrapolated Bending Ovallng
equation Fp,Fh,FL = 1
maximums from envelope
21 208 25.8 9.15 25 232 59 16.5 29 1,360 346 40.0
IMPa = 106 N/m2.
Lambeth's paper (8) included some stress criteria for pipelines. One criterion, from a 1981 pipeline research committee pane~ recommended that total stresses from pressurization and blasting should not exceed the MAOP stress envelope plus whatever adjustments are judged appropriate for the individual pipeline. Since stress from pressurization is usually limited to 72 pct of MAOP, the blasting plus adjustment part could equal the remaining 28 pet in the absence of other stresses. Por a Grade B pipe with a SMYS of 240 MPa (35,000 Ib/in2
), this would be 67.6 MPa (9,800 Ib/in2). Lambeth also mentioned an allowable additional stress of 55.2 MPa (8,000 Ib/in2) on a 61-cm (24-in) pipeline based on additional circumferential stresses from external load (transients) compared
26 51 126 65 73 147
154 135 226
with the slow loading rate of internal pressurization (grade unspecified).
In reviewing the draft of this USBM RI, Lambeth stated the Ph should not be used in conjunction with PLJ since PL was developed empirically from the USBM data and the Ph factor could not be applied because of insufficient data. As a result, PL already includes the effects of charge depth and backing. However, Lambeth's stress prediction equation does include both factors (8).
Summarizing Lambeth's study, his experimental values appear to correspond only to close-in blasts and his adjustments to the SwRI prediction equation appear lwjustified from blasting studies. They produce unrealistic stress values when applied to large-size mining-type blasts.
jl 'I :1:
"I ii,
i!
I I,
1
1:1
I I
, II
! i

"~--~----i
44
APPENDIX B.-VIBRATION AND STRAIN DATA
The following data table summarizes the peak values collected data and also to produce the plots comparing the of all the USBM and key Vibronics, Inc., measurements. various parameters of vibration and strain. Following the
.1 Blank spaces mean no reliable reading was obtained. table is a key to column headings. This Cricket Graph table was used to summarize all the
Shot Date Hour Min 20 GV V 20 GV R 6 GV V 6 GV R tvIlR MB V MB T
1 31892 1107 9.3 13.08 7.06 8.76
2 32092 1110 1.5 1.7 1.42 3 32092 1343 5.28 3.94 4.42 4 32092 1353 6.22 4.29 3.33 5 40292 1715 1.55 3.81 1.19 3.05
6 40292 1740 15.24 30.48 11.68 22.1 7 40292 1841 1.22 1.8 1.07 8 42992 1124 1.27 7.62 1.98
9 42992 1920 1.32 0.81 0.91 6.1 1.42 10 60292 1120 3.86 1.45
11 60292 1721 12 60592 1115 13 60592 1124 2.11 2.18 0.66 2.92 1.6 14 60592 1407 1.4 1.3 0.99 2.36 1.45 15 60592 1714 34.29 48.01 33.53 30.23 88.14 50.8
16 61092 923 35.81 16 19.05 19.3 67.06 30.99 17 80392 1413 18 80592 1114 4.57 5.84 17.09 7.52 19 80692 1455 6.91 6.3 5.59 4.6 16.51 5.59 20 80692 1709 47.24 86.87 63.75 84.33 97.28
21 80692 1804 52.58 102.11 70.36 109.47 147.83 130.56 22 80792 1818 35.81 35.31 34.8 79.76 44.2 23 91692 1108 121.41 105.92 113.03 125.98 205.74 24 91892 1433 25 91892 1054 187.96 209.8
26 91992 1425 59.18 65.28 97.79 169.42 27 92192 1209 65.28 28 102192 1255 29 102392 1118 274.32 184.15 30 102492 1554 146.3 63.5 205.74 219.96 222.5
31 102492 1625 2252.98 1653.54
45
Shot Alpha S R Alpha S V Alpha S T PVC TL PVC FL 20 S TL 20 S TC 20 S FL 20 S FC -1 13.08 7.06 8.76 6.9 4 4.3 5.3 2 3.81 1.52 3.3 2.45 0.73 2.81 0."73 3 10.41 10.67 7.87 4.9 3 2.2 2.2 1.5 iii
"
4 9.14 7.11 8.38 6.98 3.62 1.54 7.98 1.04 I :!;
5 9.14 2.03 7.11 2 1.59 0.6 3.62 0.95 "
I' 6 67.06 20.83 51.31 30.3 8.61 9.8 28 12.5 I
'I 7 5.08 1.52 3.05 1.04 0.45 2.5 0.63 I! 8 7.87 2.03 5.84 4.81 2.94 10 2.54 3.76 :!
9 6.86 1.52 4.83 3.62 1.77 6.25 1.59 2.45
10 4.32 1.52 5.33 : ~ i,
III1 11 69.09 55.88 35 24.2 66.4 16.7 93.47
Ii 12 120.9 61.98 84.33 47.3 26.5 51.3 29.1 1'1 13 3.3 1.02 2.54 2 1.77 1.18 , ,il 14 3.81 1.02 1.78 2.45 I,
15 83.31 61.98 88.39 38.5 28.6 48.3 19 ;1 1
:Ii
16 60.96 31.5 36.58 25.3 12.8 20.9 12.4 4.35
17 16.26 5.08 17.27 10.1 4.49 4.22 3.67
18 16.26 7.52 8.64 9.61 3.36 2.72 3.45 2 19 14.22 9.14 10.67 15 15.9 4.76 10.7 3.4 20 136.14 109.73 125.98 57.1 97.5 31.1 63 24 25.8
21 166.62 119.89 156.46 57.1 102.5 24.9 33.5 21.3 :1 il
22 85.34 67.06 125.98 42.6 76.2 19.5 55.8 17.2 13.1 " I'
23 164.59 144.27 144.27 92.9 50.8 43.2 :1
II 24 I,
I!' 25 168.66 241.81 231.65 137 60.8 46 31.1 'I,
,I I,'
"
26 93.47 148.34 119.89 63 44 44 III 27 81.28 42.67 62.99 37.6 24.3 25.4
28 III 29 227.58 237.74 156.46 499 156 77 I' 30 76.1 51.6
Iii 31 3169 490 !
.,' I I, I' II; 1
It
II '1
:1, :1 ,I'
r Ii'
/jI: ;1 :
Ii I II' [I
II' ,I t
Ir II

46
:1
Shot 12 N S TL 12 0 S TL 12 0 S FL 6 S FC 6 S TC 6 S FL AS 20 R AS 20 V AS 20 T j ."
1 ~ 2 1.18 I 3 2.9 J 4 1.63 ~
1 5 1.13 0.77
6 6.6 8.7 11.5 9.1 23 10.5 7 0.63 0.54 0.68 8 2.4 2.04 1.59 9 1.59 1.4 1.54 1.31
10
11 26 17.2 14.1 12.7 39 14 12 21 23.4 19.6 26.7 31 13 1.18 0.91 1.36 14 1.09 15 26.1 23.7 12.8 30.5 32.4
16 13.3 13.3 10.1 8.4 15.6 17 14.4 5.17 13.6 5.98 18 3.45 2.72 1.45 3.08 19 4.08 3.63 2.04 20 19.9 22.7 13.1 22.2
21 23.6 19.5 29.5 51.7 22 18.1 17.7 22.7 30.8 57.91 41.15 33.02 23 49.6 16.2 31.1 26.3 62.99 130.05 148.34 24 25 50.8 37.6 38 53.5 59.9 178.82 211.33 79.25
26 32 28.8 36.7 20.5 28.8 87.38 95.5 67.06 27 18.8 22.2 17.7 14.3 18.8 15.6 41.15 34.04 39.62 28 29 82 41.2 94.S 239.78 233.68 103.63 30 77.5 22.1 55.8
31 3140 499 664

47
Shot Distance Kg delay 20 S 45 SR4 1 R SR41 V SR4 1 T SR42 R SR42 V SR42 T tt
1 338 435 2 1064 135 3 381 435 4 436 435 5 869 588
6 180 751
7 933 218 8 802 464 9 847 539
I:
10 756 626
f' II ii
11 146 639 :1,
12 125 773 :1 13 920 301
14 951 181 I' ,I
15 131 689 'I ,,!
~ I: , 1;1
16 192 959 17 387 465· 18 506 828
ii I
19 552 600 Ii 20 88 731
,I
21 88 964 228.6 88.9 165.1 188.72 241.30
22 116 884 I' 23 67 964 139.7 88.9 279.4 II 24 :1
25 50 839 32.5 203.2 165.1 241.3 647.70 276.86 190.50 I:,' I,
368.30 125.73 228.60 ,I
,II 26 74 872 21 88.9 76.2 152.4 665.48 812.80 736.60 !!
27 158 668 9.97 63.5 25.4 101.6 i
28 i'l :!
29 20 839 68 584.2 444.5 254 30 52 706 27.8 152.4 152.4 279.4
" 31 14 743 2035 889 698.5

48
Shot B&KR B&K V B&K T 1 2 3 4 5
6 7 8 9 10
11 12 13 14 15
16 17 18 19 20
21 167.64 185.42 22 100.08 114.81 23 60.96 60.96 24 25 520.70 191.26
530.86 207.52 26 982.98 3200.40 27 28 29 30
31

~ , 1
!
Key to Column Headings, Appendix B
Date ....... 31892.00000 is March 18, 1992
Hour_Min •••• 1107.000 is 11:07 on 24-h clock
20_GV_V .... Vertical vibration of 50.8-cm (20-in) pipe, mm/s
20_GV_R .... Radial vibration of 50.8-cm (20-in) pipe, mm/s
6_GV_V ..... Vertical vibration of 16.8-cm (6-in) pipe, mm/s
6 GV R ..... Radial vibration of 16.8-cm (6-in) pipe, mm/s
MB R ....... Radial ground vibration above 50.8-cm (20-in) pipe, mm/s
MB V ....... Vertical ground vibration above 50.8-cm (20-in) pipe, mm/s
MB_T ....... Transverse ground vibration above 50.8-cm (20-in) pipe, mm/s
Alpha_S_R .. Radial ground vibration above point midway between 50.8-cm (20-in) steel pipe and PVC water pipe, mm/s
Alpha_S_V .. Vertical ground vibration above point midway between 50.8-cm (20-in) steel pipe and PVC water pipe, mm/s
Alpha_S_T .. Transverse ground vibration above point midway between 50.8-cm (20-in) steel pipe and PVC water pipe, mm/s
PVC_TL ..... Top longitudinal strain of PVC pipeline, ~mm/mm
PVC_FL ..... Front longitudinal strain of PVC pipeline, ~mm/mm
20_S_TL .... Top longitudinal strain of 50.8-cm (20-in) steel pipe ~mm/mm
20_S_TC .... Top circumferential strain of 50.8-cm (20-in) steel pipe ~mm/mm
20_S_FL .... Front longitudinal strain of 50.8-cm (20-in) steel pipe ~mm/mm
20_S_FC .... Front circumferential strain of 50.8-cm (20-in) steel pipe ~mm/mm
12_N_S_TL .. Top longitudinal strain of new 32.4-cm (I2-in) steel pipe ~mm/mm
12_0_S_TL .. Top longitudinal strain of old 32.4-cm (I2-in) steel pipe ~mm/mm
12_0_S_FL. .Front longitudinal strain of old 32.4-cm (12-in) steel pipe ~mm/mm
6_S_FC ..... Front circumferential strain of 16.8-cm (6-in) steel pipe ~mm/mm
6_S_TC ..... Top circumferential strain of 16.8-cm (6-in) steel pipe ~mm/mm
6_S_FL ..... Front longitudinal strain of 16.8-cm (6-in) steel pipe ~mm/mm
AS_20_R .... Alpha-Seis monitoring of radial vibration of 50.S-cm (20-in) pipe, mm/s
49

50
AS_20_V .... Alpha-Seis monitoring of vertical vibration of 50.S-cm (20-in) pipe, mm/s
AS_20_T .... Alpha-Seis monitoring of transverse vibration of 50.S-cm (20-in) pipe, mm/s
Distance •.. Vector distance from top of closest blasthole to 16.a-em (6-in) pipeline, m
Kg-delay ... Maximum charge weight per 8-ms delay
20 S 45 •.•• Top 45° angle strain, of 50.S-em (20-in) steel pipe, ~mm/mm
SR4 I R •.•• Strong-motion monitoring of radial vibration above I6.S-cm (6-in) - - pipe, mm/s
SR4 I V .... Strong-motion monitoring of vertical vibration I6.S-em (6-in) - - pipe, mm/s
SR4 1 T .•.. Strong-motion monitoring of transverse vibration I6.S-cm (6-in) - - pipe, mm/s
SR4 2 R .... Strong-motion monitoring of radial vibration above and between two . - - 32.4-cm (12-in) pipes
SR4 2 V .... Strong-motion monitoring of vertical vibration above and between two - - 32.4-cm (la-in) pipes
SR4 2 T .... Strong-motion monitoring of transverse vibration above and between two - - 32.4-cm (12-in) pipes
B&K_R •...•. Radial ground vibration above 50.S-em (20-in) pipe, mm/s
B&K V ....•. Vertieal ground vibration above 50.S-em (20-in) pipe, mm/s
B&K_T ...... Transverse ground vibration above 50.S-em (20-in) pipe, mm/s
1 .,
oj" i
I
I I I j
! I ! I i I I 1
I I i !
r

51
APPENDIX C.-SURVEY DATA1 FOR FIVE PIPELINES
East uQright Center uQright West uQright Date North East Elev North East Elev North East Elev
16.S-cm STEEL
4-8 ...... 0.628 0.470 0.696 0.771 0.498 0.559 0.789 0.274 0.144 5-7 ...... 0.619 0.470 0.682 0.776 0.480 0.562 0.791 0.271 0.144 6-11 .... 0.622 0.480 0.682 0.777 0.491 0.559 0.779 0.281 0.142 8-5 ...... 0.614 0.469 0.685 0.794 0.496 0.546 0.S24 0.293 0.114 9-14 .... 0.618 0.484 0.675 0.779 0.479 0.535 0.791 0.286 0.105 9-18 .... 0.603 0.476 0.671 0.780 0.517 0.540 0.797 0.315 0.113 10-24 .. 0.618 0.472 0.583 0.804 0.538 0.458 O.S17 0.300 0.065 10-26 .. 2.959 -2.385 0.273 0.839 0.474 0.1.1.3
32.2-cm STEEL (USED)
4-8 ...... 0.672 0.416 0.7'14 0.071 0.939 0.299 0.396 0.223 0.988 5-7 ...... 0.660 0.404 0.702 0.054 0.945 0.315 0.383 0.221 0.988 6-11 .... 0.648 0.428 0.692 0.047 0.946 0.306 0.377 0.232 0.982 7-5 ...... 0.673 0.432 0.691 0.055 0.952 0.296 0.411 0.223 0.962 9-14 .... 0.659 0.439 0.675 0.038 0.947 0.281 0.400 0.225 0.948 9-18 .... 0.658 0.446 0.674 0.045 0.974 0.284 0.393 0.235 0.952 10-24 .. 0.688 0.445 0.579 0.065 0.964 0.194 0.421 0.249 0.910 10-26.. 0.841 -0.207 0.392 0.820 -2.736 0.455 0.405 0.674 0.S92
32.2-cm STEEL (NEW)
4-8 ...... 0.741 0.459 0.656 0.771 0.970 0.60S 0.271 0.362 0.589 5-7 ...... 0.723 0.431 0.647 0.757 0.968 0.609 0.276 0.367 0.597 6-11.. .. 0.741 0.425 0.643 0.761 0.976 0.594 0.277 0.377 0.600 7-5 ...... 0.740 0.429 0.648 0.761 0.980 0.565 0.314 0.346 0.585 9-14 .... 0.731 0.430 0.638 0.749 0.979 0.571 0.284 0.372 0.569 9-18 .... 0.738 0.432 0.639 0.765 0.004 0.570 0.285 0.391 0.559 10-24 .. 0.775 0.413 0.540 0.805 0.008 0.473 0.318 0.394 0.506 10-26 .. 0.922 -3.849 2.859 0.287 0.585 O.5§;3
50.S-cm STEEL
4-8 ...... 0.102 0.291 0.049 0.220 0.261 0.423 0.470 0.756 0.637 5-7 ...... 0.10S 0.314 0.047 0.220 0.276 0.430 0.462 0.754 0.643 6-11.. .. 0.131 0.299 0.032 0.223 0.285 0.426 0.471 0.763 0.641 7-5 ...... 0.116 0.275 0.031 0.231 0.269 0.419 0.497 0.752 0.611 9-14 .... 0.130 0.313 0.017 0.220 0.274 0.403 0.477 0.716 0.594 9-18 .... 0.129 0.309 0.014 0.220 0.283 0.394 0.481 0.755 0.598 10-24 .. 0.171 0.297 -0.092 0.271 0.302 0.299 0.518 0.766 0.540 10-26.. 0.105 2.252 -1.685 -1.561 -5.930 0.487 0.577 0.831 0.573 -
21.9-em PVC
5-7 ...... 0.436 0.353 0.251 0.794 0.218 0.999 0.633 0.690 0.068 6-11 .... 0.364 0.356 0.245 0.794 0.176 0.989 0.650 0.737 0.072 7-5 ...... 0.310 0.369 0.251 0.826 0.128 0.974 0.658 0.719 0,048 9-14 .... 0.268 0.328 0.237 0.808 0.146 0.962 0.626 0.737 0.029 9-18 .... 0.246 0.301 0.236 0.812 0.165 0.967 0.633 0.744 0.032 10-24.. 0.403 0.276 0.143 0.866 0.146 0.873 0.627 0.762 -0.037 10-26 .. 0.242 1.11 0.125 -0.112 -2.823 0.933 1As measured by Amax Coal Co.; relative elevations in feet.
INf.BU.OF MINES,PGH.,PA 30014
,i