Embed Size (px)
Citation preview

Page | 1
Surface Finish Control by Electrochemical Polishing in Stainless Steel 316 Pipes
A. A. Gomez-Gallegosa,*, F. Milla, A. R. Mountb
a School of Engineering, The University of Edinburgh, Edinburgh, EH9 3JL, United Kingdom
b School of Chemistry, The University of Edinburgh, Edinburgh, EH9 3JJ, United Kingdom
*Corresponding author: [email protected]
Abstract
Electrochemical machining (ECM) is a non-conventional machining process which is based on the localised
anodic dissolution of any conductive material. One of the main applications of ECM is the polishing of
materials with enhanced characteristics, such as high strength, heat-resistance or corrosion-resistance, i.e.
electrochemical polishing. The present work presents an evaluation of the parameters involved in the ECM
of Stainless Steel 316 (SS316) with the objective of predicting the resulting surface finish on the sample.
The interest of studying ECM on SS316 resides on the fact that a repeatable surface finish is not easily
achieved. ECM experimental tests on SS316 pipes of 1.5” (0.0381 m) diameter were conducted by varying
machining parameters such as voltage, interelectrode gap, electrolyte inlet temperature, and electrolyte
flow rate. The surface finish of the samples was then evaluated in order to find the significance of each of
these parameters on the surface quality of the end product. Results showed that overvoltage, which is
dependent on the interelectrode gap and the electrolyte temperature, is one of the main parameters
affecting the surface finish; additionally there is a strong relationship between the resulting surface finish
and the electrolyte flow. The interelectrode gap and inlet electrolyte temperature also affect the resulting
surface finish but their influence was not so evident in this work. Finally, the variation of the electrolyte
temperature during the process was found to have a great impact on the uniformity of the surface finish
along the sample. We believe that this contribution enables the tailoring of the surface finish to specific
applications while reducing manufacturing costs and duration of the ECM process.
Keywords: electrochemical machining, stainless steel 316, surface finish.
Introduction
ECM of metals with special characteristics, such as enhanced strength, heat or corrosion resistance, is a
manufacturing option to produce products that could be difficult or impossible to get with conventional
manufacturing processes. ECM allows manufacturers to shape any conductive material without affecting
the properties of the tool or the workpiece. In addition, ECM can generate a high quality surface finish at
the workpiece.
ECM consists of an electric circuit formed by the tool and the workpiece connected to an external electrical
source. The electrodes are submerged in an electrolyte bath that closes the circuit. When current passes
through the circuit, a localised anodic dissolution occurs at the workpiece. This results more or less in the
negative shape of the tool profile [1]. The electrolyte is pumped through the interelectrode gap dragging
the dissolved material away and cooling down the electrodes. Unfortunately, the ECM process is difficult to

Page | 2
predict due to the wide variety of physical phenomena involved and the lack of sufficient quantitative and
qualitative data that can be used to develop of an accurate simulation model [2, 3].
One of the main applications of ECM is the polishing of materials, i.e. electrochemical polishing. Several
studies of electrochemical polishing can be found in the published research [4-10], and studies on applying
electrochemical polishing for the manufacture of biomedical implants [11], solar cells [12] and electrodes
for photoelectron guns [13], are still under development. However, electrochemical polishing is a process
that regularly generates non repeatable results, e.g. the application of the process on stainless steels (SS)
typically generates widely variable surface finish. Therefore, in many of these studies, special attention has
been given to ECM on steels with high chromium content. Iron-chromium alloys, such as stainless steels,
have wide applications in industry due to their characteristic behaviour (oxidation resistance). The
chromium in SS induces the formation of a protective film of oxide on the material surface that prevents
further corrosion [8]. However, this oxide film also modifies the ECM at the surface of the material; it has
low electrical conductivity and prevents the workpiece from making direct contact with the electrolyte.
Hence, normal anodic dissolution cannot be implemented without the breakdown of the oxide film. Partial
breakdown of this film often occurs, which causes pitting on the surface [4, 8] or a non-uniform surface
finish [6, 7, 14].
The surface finish of the samples results from the specular or non-specular reflection of light from the
crystal faces that have been electrochemically dissolved at different rates during the ECM process [1, 15].
An electrochemically polished surface is usually associated with the random removal of atoms from the
anode (workpiece) [15]. Datta and Landolt [16] observed that an active dissolution of material at low
current density leads to surface etching, and a transpassive dissolution at high current density leads to
surface brightening. This was also noted by Lee [5] and McGeough [1]; in their studies when the current
density was raised, the surface finish on the workpiece became smoother. Lozano-Morales [14] found the
same behaviour with ECM in Niobium samples. Elsewhere, Wagner, T. and Wang, et. al. [17, 18] gave a
plausible explanation of the effect of the electrolyte flow rate on the surface finish on SS. They argue that
during ECM, the electric current breaks the oxide film and local electrolyte flow turbulences would ideally
remove the film particles (oxides, chromium carbides and reaction products). If the turbulence is not
sufficient for removing these lose particles, Fen+_ diffusion through the surface layer is possible, and the
current density efficiency decreases drastically, thus affecting the surface finish.
In other works, Lee [5] found that when electropolishing stainless steel 316L, better electropolishing
results were obtained at a temperature close to 68 °C than at 30 °C. Later on, Deconinck [2] demonstrated
how the electrochemical reactions rates depend strongly on the electrolyte temperature, which in turn
depends on the electrolyte flow rate, interelectrode gap and potential applied.
Mount et al. [6-8] built a segmented tool for the further analysis of the ECM process when applied on SS.
Their results described a change in the surface finish of the samples along the electrolyte flow. It was found
that this special behaviour is due to the change of the dissolution valence of the alloy. Their results showed

Page | 3
that for high dissolution valences, z = 3.5 ±0.1, the resulting surface was reflective and bright. This surface
fish is characteristic of iron and chromium dissolving in their high valence states (as Fe(III), Fez =3, and
Cr(VI), Crz =6); however, if z was lower, 2.5 ±0.1, the surface finish was passivated. This surface finish is
also characteristic of iron and chromium dissolving but now in their low valence states (as Fe(II), Fez =2,
and Cr(III), Crz =3) [8]. These results are in agreement with the study of Lohrengel et al. [3] and
Murkherjee, et al. [19].
From the above, we can conclude that it is essential to understand how the ECM parameters affect the
surface finish. The effective removal of this film is governed by a combination of metal-electrolyte-
machining parameters. Hence, in the present work, the ECM machining parameters, gap, voltage, flow rate
and inlet electrolyte temperature, are modified in order to evaluate their role on the achievement of the
expected surface finish and a homogeneous breakdown of the oxide film. To the best of our knowledge, this
is the first time that the inner surface finish of stainless steel commercial pipes has been enhanced by
electrochemical polishing to tailor it for industrial applications and large scale production.
Experimental method
Sample preparation
The pipes machined were commercial stainless steel 316 (SS316) pipes of 0.17 m length and 0.0381 m
diameter, which were manufactured by rolling and welding. The surface finish of the pipe prior to
processing was dark and opaque and its quality was uniform along the pipe. Welding left behind a weld-
flash at the interior face of the pipe. The exterior of the pipe was not treated.
Electrochemical (ECM) setup
Page | 4
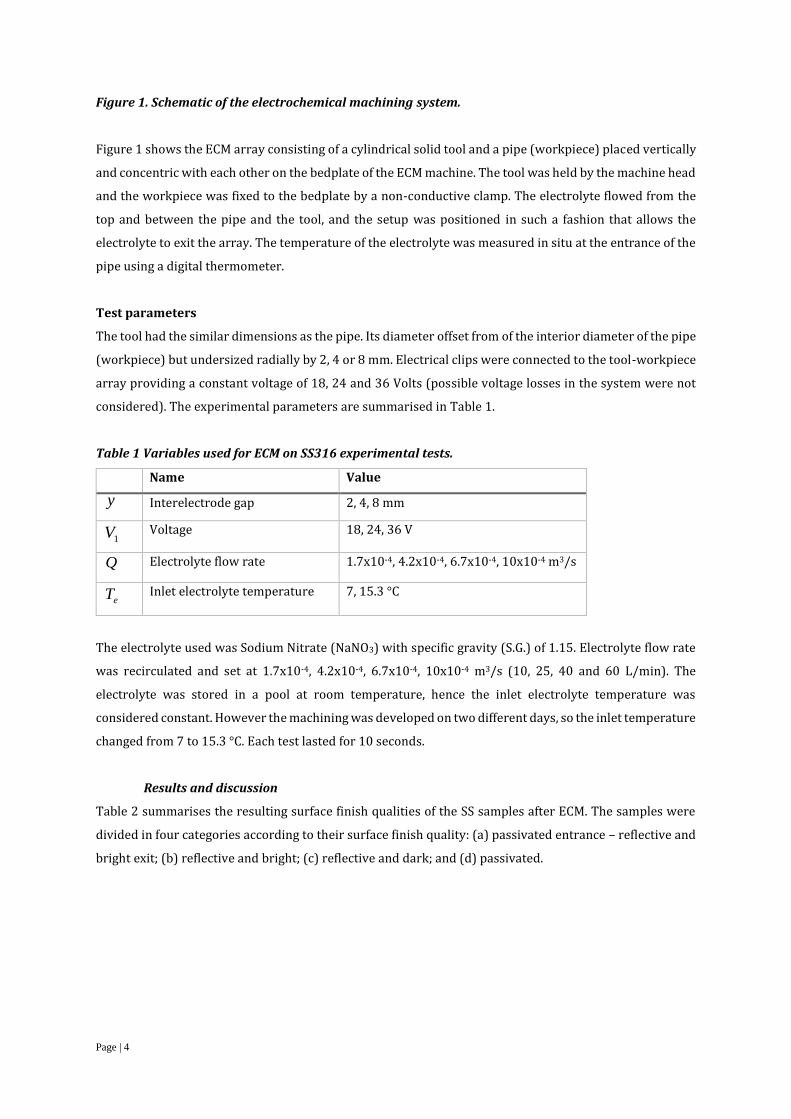
Figure 1. Schematic of the electrochemical machining system.
Figure 1 shows the ECM array consisting of a cylindrical solid tool and a pipe (workpiece) placed vertically
and concentric with each other on the bedplate of the ECM machine. The tool was held by the machine head
and the workpiece was fixed to the bedplate by a non-conductive clamp. The electrolyte flowed from the
top and between the pipe and the tool, and the setup was positioned in such a fashion that allows the
electrolyte to exit the array. The temperature of the electrolyte was measured in situ at the entrance of the
pipe using a digital thermometer.
Test parameters
The tool had the similar dimensions as the pipe. Its diameter offset from of the interior diameter of the pipe
(workpiece) but undersized radially by 2, 4 or 8 mm. Electrical clips were connected to the tool-workpiece
array providing a constant voltage of 18, 24 and 36 Volts (possible voltage losses in the system were not
considered). The experimental parameters are summarised in Table 1.
Table 1 Variables used for ECM on SS316 experimental tests.
Name Value
y Interelectrode gap 2, 4, 8 mm
1V Voltage 18, 24, 36 V
Q Electrolyte flow rate 1.7x10⁻⁴, 4.2x10⁻⁴, 6.7x10⁻⁴, 10x10-4 m3/s
eT Inlet electrolyte temperature 7, 15.3 °C
The electrolyte used was Sodium Nitrate (NaNO3) with specific gravity (S.G.) of 1.15. Electrolyte flow rate
was recirculated and set at 1.7x10⁻⁴, 4.2x10⁻⁴, 6.7x10⁻⁴, 10x10-4 m3/s (10, 25, 40 and 60 L/min). The
electrolyte was stored in a pool at room temperature, hence the inlet electrolyte temperature was
considered constant. However the machining was developed on two different days, so the inlet temperature
changed from 7 to 15.3 °C. Each test lasted for 10 seconds.
Results and discussion
Table 2 summarises the resulting surface finish qualities of the SS samples after ECM. The samples were
divided in four categories according to their surface finish quality: (a) passivated entrance – reflective and
bright exit; (b) reflective and bright; (c) reflective and dark; and (d) passivated.

Page | 5
Table 2. Surface finish classification of the SS316 pipes machined by ECM.
(a) Passivated entrance –
reflective and bright exit
(b) Reflective and bright
(c) Passivated
(d) Reflective and dark
Passivated entrance – reflective and bright exit
Table 1(a) presents a typical sample with a passivated surface finish at the entrance and a reflective and
bright surface finish at the exit. An average roughness in the top part of the sample (passivated entrance)
of 2.303 μm was measured with a Mitutoyo® profilometer. A small ring of passivated surface at the exit of
the pipe is visible; this passivation is due to the accumulation of the electrolyte in this area forming a small
pool before it can exit the array. The weld-flash is also visible but just at the entrance of the pipe.
Passivated
Table 1(b) shows an example of a sample with passivated surface finish. Average roughness of 540 nm was
measured with a Mitutoyo® profilometer. The sample presented in Table 1(b) exhibits flow marks. This
was characteristic of the 8 mm gap, and this behaviour of the electrolyte flow in an annulus system has
been observed before in fluid dynamics studies [20][15].
Reflective and Bright
A typical reflective and bright sample is presented in Table 1(c). An average roughness of 116 nm was
measured with a Mitutoyo® profilometer and 265 nm with an optoelectronic ZYGO® microscope. These
values are higher than the expected values of an electrochemical machined surface; this variation however
is believed to be due to the curvature of the samples, which made difficult the roughness measurement. A
small ring of passivated surface at the exit of the pipe is visible, similar to the passivated entrance –
reflective and bright exit samples; this passivation is due to the accumulation of the electrolyte in this area
forming a small pool before it can exit the array. The weld-flash is also visible in the entire length of the
pipe, and some flow marks can also be observed.
Reflective and Dark

Page | 6
A typical example of the samples with reflective and dark surface finish is presented in Table 1(d). Average
roughness of 308 nm was measured with a Mitutoyo® profilometer and 426 nm using the optoelectronic
ZYGO® microscope. Similar to the results obtained for the reflective and bright samples, this roughness is
higher than the expected one due to the curvature of the samples. The same small ring of passivated surface
is visible at the exit of these samples, but the weld-flash is barely visible along the length of the pipe. No
flow marks can be observed.
Visual similarity between the passivated surface (Table 1(b)) and the reflective and dark surface (Table
1(d)) can be observed; this is due to the presence of the oxide film in both cases. The difference is that in
the first case this film is loose, and in the second the film is firmly attached to the surface of the metal.
The ECM parameters, such as current density ( J ), overpotential ( 0V ) and temperature difference ( T ),
which are dependent on the controlled parameters (voltage, gap, electrolyte inlet temperature and flow
rate), were compared with the objective of finding which of them had an influence, if any, on the resulting
surface finish of the sample. By properly adjusting the process parameters, we expected to achieve a
reflective and bright surface finish.
Overpotential ( 0V )
Metal dissolution was accomplished by the deliberated application of an external potential difference
between the electrodes during the ECM process. The potential needed to ensure a continuous discharge of
metal between the electrode and the electrolyte is named overpotential ( 0V ). The overpotential was
calculated by using equation (1) [21]:
y
AVVkI e )( 01
(1)
where ek (S/m) is the electrolyte conductivity, y (m) is the interelectrode gap, 0V (V) is the overpotential,
and A (m2) is the tool surface area.
The results of the present work show the importance of 0V in the resulting surface finish at the SS316
samples. Previous works [4, 6, 7] found that a bright and reflective surface finish is achieved when 0V is in
the range of 9.7 and 12.4 V. In our study, this range is wider, 9.1 – 15.0 V. See Figure 2.

Page | 7
Figure 2. Power, P , and overpotential, 0V , in relation with the surface finish: passivated entrance –
reflective and bright exit (rhomboids), reflective and bright (squares), reflective and dark (triangles),
and passivated (circles).
Power supply (P) in ECM is a function of the voltage applied and the current measured. P controls the
volume and rate of material removed during the process and affects the resulting surface finish. Tailor [22]
explained that with a very low combined current-voltage value, the material removal is minimal, and
attained this behaviour to the formation of a very thin passive film on the surface of the anode that stops
further reactions. At a moderate level of current-voltage combination, brightening of the surface is
observed. In this region, the current is high enough to dissolve the material at the surface of the anode. A
further increase in voltage generates over-polishing or pitting, and further cause of electrolytic by-products
that may generate a dull surface finish [22]. This behaviour is evident in Figure 2 and Figure 3.
The samples that present a more uniform reflective surface finish (squares and triangles in Figure 2) are
observed when the power is over 7KW and the overpotential is limited between 7 and 15 V. In the samples
where the surface finish is not uniform (rhomboids), i.e. a passivated surface was found at the entrance and
a reflective and bright surface at the exit; the overpotential is over 14 V and the power is low (below 7 KW).
Published studies [4, 16] have shown that the mass transport control of the dissolved material is a critical
factor for the resulting surface finish. Therefore a plausible explanation for this behaviour is that the
potential difference is not sufficient to maintain a steady ion migration though the oxide film. Hence a non-
uniform surface finish is attained. This is consistent with other studies [8, 16] where the areas of variable
surface finish were related with a variation in the valence ( z ) of SS316. In the present work, however it
was not possible to measure the valence during the ECM process, and therefore, these findings could not

Page | 8
be verified. Additionally, when the overpotential is below 7 V, the surface finish is passivated (circles in
Figure 2). In these cases the potential drop between the electrodes is considered too high. Thus, even
though the oxide film is broken, the dissolution of the metal is uncontrolled [23].
Current density ( J )
Current density, J , can be explained simply as the quantity of electric current that flows on a unit of area
during ECM. The current during the ECM process was recorded by a data acquisition software, and the
dimensions of the tool/workpiece were known. Hence these data are used to calculate the current density.
Figure 3 presents the influence of J in the resulting surface finish. For J over 4.5 A/cm2 (squares and the
triangles in Figure 3) a reflective surface is achieved. However, when J dropped below those values, there
was not sufficient energy to break the oxide film uniformly. Hence, a passivated or non-uniform surface
finish was obtained. This is in agreement with the work presented by Wang [18] where ECM on stainless
steel was carried out under low current density (up to 2.5 A/cm2). It was found that at low current density
a compact oxide film is formed on the surface of the metal and it can hinder the metal dissolution.
Moreover when V0 is too high and J is not sufficient to maintain a stable migration of ions from the
workpiece, a non-uniform surface finish is attained (rhomboids in Figure 3).
Figure 3 Current density, J , and voltage within the cell, V, in relation with the surface finish:
passivated entrance – reflective and bright exit (rhomboids), reflective and bright (squares), reflective
and dark (triangles), and passivated (circles).
There is an evident relationship between the overvoltage and the current density. A variation in 0V is
evidence of a change in the electrochemical reactions at the electrode surface [24] and this affects the

Page | 9
surface finish of the sample. Figure 4 presents this relationship. It can be observed that when 0V increases,
more energy is needed to drive the reactions at the sample surface. If this energy is not enough to maintain
a stable migration of ions from the workpiece, a non-uniform surface finish is attained (blue rhomboids in
Figure 4).
Figure 4 Current density, J , and overpotential, 0V , in relation with the surface finish: passivated
entrance – reflective and bright exit (rhomboids), reflective and bright (squares), reflective and dark
(triangles), and passivated (circles).
In practice, not all the current is used for the removal of material, which influences the results presented
here. Other side reactions such as oxide precipitation, or metal dissolution due to high valence, may exist
and affect the current density efficiency. Moreover, the electrolyte conductivity plays a crucial role in J ,
ek , in turn, is dependent on the temperature, electrolyte flow rate, electrolyte concentration, etc. [25], thus
affecting the overall outcome.
Flow rate
The role of the electrolyte flow rate is twofold: it flushes away the metal ions (ECM products) dissolved
from the anode before they can reach the cathode and, at the same time, mitigates the temperature increase
of the system. The accumulation of the machining products could lead to a shortcut of the system, and the
increase of the temperature affects the conductivity of the electrolyte [1]. Hence, there is an impact of the
flow rate in the overpotential during the process.
Figure 5 demonstrates the influence of the electrolyte flow rate on the surface finish. Low flow rates
(<3.3x10⁻⁴ m3/s) or low electrolyte velocities (<1 m/s) led to the formation of a passive oxide film (which

Page | 10
are subject to pitting) [4] or resulted in a non-uniform surface finish along the sample. This may be due to
the heat generated during the ECM process which was not well dissipated. Usually the change in
temperature results in a change in the conductivity of the electrolyte, which is temperature dependent, thus
affecting the resulting surface finish. McGeough [1] stated that the surface was smoother when the
electrolyte velocity was increased. However, if the flow rate is too high (>6.7x10⁻⁴ m3/s) or the electrolyte
velocity is over 2 m/s, the process results in a dark surface (triangles in Figure 5). From previous works
[26], it is known that this film is mainly formed by Fe, C and small traces of Cr, and that it is strongly attached
to the metal surface. Additionally, this oxide film limit the current efficiency [18, 27] during the ECM
process. Results show that the flow rate that generates a reflective and bright surface finish is
approximately 4.2x10⁻⁴ m3/s, electrolyte velocities between 1 – 2 m/s (squares in Figure 5 and Figure 6).
In addition, high flow rates lead to a small diffusion layer at the anode, hence a higher current density is
needed to achieve surface brightening [15]; however, from previous works [28, 29], it was observed that
an stable and even flow is critical to keep the supersaturated films (presented by Lohrengel [29]) and to
obtain smoother surface finish.
Figure 5. Electrolyte flow rate, Q , and overpotential, V0 , in relation with the surface finish: passivated
entrance – reflective and bright exit (rhomboids), reflective and bright (squares), reflective and dark
(triangles), and passivated (circles).
Interelectrode gap
The distance between the electrodes and in where the electrolyte flows is named interelectrode gap; and it
has been demonstrated to be another important parameter determining the resulting surface finish of the
sample. Figure 6 shows that a big gap (≈8 mm) and low electrolyte flow rates (<1 m/s) generates a
passivated surface finish. This is due the fact that the interelectrode gap is related inversely to the current

Page | 11
density of the ECM process [15, 16, 28, 30]; when J is reduced, e.g. by increasing the gap, there is not
enough energy during the process to break the oxide film uniformly.
Figure 6 shows the relationship between the surface finish, the electrolyte flow and the interelectrode gap.
From fluid dynamic studies, it is known that the velocity of the flow increases when the interelectrode gap
is smaller, and that when the electrolyte velocity is too low, the turbulence in the fluid is not sufficient for
flushing away of the ECM products, hence affecting the process. This behaviour was also observed by Lee
[5], where an optimum gap of 1 mm, in order to obtain a smooth surface, was found.
Figure 6. Electrolyte velocity and overpotential, 0V , in relation with the surface finish: passivated
entrance – reflective and bright exit (rhomboids), reflective and bright (squares), reflective and dark
(triangles), and passivated (circles).
Temperature difference ( T )
Some samples were found to have two different surface finish along their length following the flow path of
the electrolyte. This non-uniform surface finish is usually characterised by a passivated section at the
entrance and a reflective and bright one at the exit. We believe that this behaviour is as a result of an
increment in temperature of the electrolyte while flowing along the length of the sample due to Joule
heating. Hence, for this study the electrolyte inlet temperature for each sample was measured in situ, and
the electrolyte outlet temperature was calculated applying heat transfer equations based on the ECM
parameters used.
When the temperature increases, the conditions of the ECM process change, resulting in a different surface
finish. The change in temperature along the workpiece surface observed in the samples presented here
may be a result of a change in the electrolyte flow rate. Hence, the electrolyte cannot control efficiently the

Page | 12
temperature of the electrodes, promoting the change in valence at different points on their surface. It is
known that the electric conductivity is directly related with the temperature of the electrolyte [31, 32].
When the conductivity changes, the electrochemical reactions during the ECM also change, thus affecting
the resulting surface finish on the sample.
The difference in temperature within the sample may be also affected by the interelectrode gap. ECM
products are more easily accumulated in a small gap than in a larger one, equivalently the velocity of the
electrolyte flow is higher in the small gap compared with the larger gap. If the electrolyte velocity within
the interelectrode gap is not enough, some ECM products may be accumulated at the end of the pipe,
provoking a change in the concentration and conductivity of the electrolyte at this point. This effect was
also observed by Tang et al. [28] when the surface finish of their samples improved when adding
backpressure to the electrolyte flow, hence avoiding the accumulation of products at the surface of the
workpiece. For a uniform surface finish, the temperature difference, T , of the electrolyte across the
length of the pipe, and in consequence its variation in conductivity, should be small (<8 ˚C).
Figure 7. Temperature difference, T , between the electrolyte inlet and outlet temperature, and
overpotential, 0V , in relation with the surface finish: passivated entrance – reflective and bright exit
(rhomboids), reflective and bright (squares), reflective and dark (triangles), and passivated (circles).
Figure 7 shows T along the length of the samples and their relationship with the resulting surface finish.
The samples that present two different surface finish (rhomboids in Figure 7) are the ones whose T is
high. This difference is usually result of an electrolyte flow rate that is not enough (<25 L/min) to dissipate

Page | 13
the heat of the ECM process. Additionally, it can be observed that a uniform surface finish is presented when
T is low (squares, triangles and circles in Figure 7).
Valence, z
Valence, z , has also been demonstrated to influence the surface finish on SS during the ECM process. The
transition from active to transpassive dissolution, and in turn the surface finish, is accompanied by a change
in the anode potential, surface microstructure and change in the valence of the metal, as observed in Figure
3 [6, 16]. As it has been seen previously [7, 8, 16], the decrease in dissolution valence corresponds with a
progressive change in the electrode surface, i.e. from a smooth bright surface to a passivated one. In the
present work the valence during the ECM process could not be measured, so these findings could not be
verified for our samples.
Conclusions
The paper presented an experimental analysis of the parameters that influence the surface finish of SS316
samples machined with ECM. The machining parameters, voltage, gap, electrolyte flow rate, and electrolyte
inlet temperature, were varied in turn, and the samples were divided according to the resulting surface
finish.
Results highlighted a strong relationship between surface finish and overpotential during ECM. The
overpotential is dependent of the current density and the characteristics of the electrolyte. Thus the
electrolyte flow rate, conductivity and inlet temperature directly affect the resulting surface finish. An
overpotential between 9 and 15 V is necessary to obtain the desirable reflective and bright surface finish;
if the overpotential was lower, a passivated surface usually was obtained. The variation in the electrolyte
temperature during the process was found to have a great impact on the uniformity of the surface finish
along the sample. A non-uniform surface finish along the length of some samples was characteristic of a
low electrolyte flow rate, and hence deficient heat and ECM products dissipation. Additionally the
interelectrode gap also affect the resulting surface finish but its influence was not so evident, however a big
interelectrode gap, 8 mm, usually results in a passivated surface finish. Current density (J) during the ECM
process also demonstrated to have a big influence in the resulting surface finish; J higher than 4.5 A/cm2
is needed to obtain a reflective surface finish. However it’s important to remember that J is related with
the interelectrode gap, and the temperature and conductivity of the electrolyte.
The results presented in this paper could be used as a tool for the achievement of the desired surface finish
on a sample of SS316. We believe that this analysis and subsequent further development could be applied
with other metal alloys. Moreover, it is an important step towards the understanding of the ECM process
and an adequate prediction of the resulting surface finish. The accurate determination of the fundamental
relationships between the power, overpotential, interelectrode gap, current density and electrolyte flow
rate and electrolyte temperature, will lead to more accurate computational simulations of the ECM process
and aid the tool design techniques. However more experimental work is still needed.

Page | 14
Acknowledgements
The author would like to thank Steve Duffield from pECM systems Ltd, UK. for the experimental samples
and practical tests experience; and to The Mexican National Council for Science and Technology (CONACyT)
for the support and provision of the scholarship to Ares Argelia Gomez Gallegos for the development of this
project.
References
1. McGeough, J.A., Electrochemistry Encyclopedia: Electrochemical Machining (ECM). http://electrochem.cwru.edu/encycl/, 2005.
2. Deconinck, D., et al., Study of the effects of heat removal on the copying accuracy of the electrochemical machining process. Electrochimica Acta, 2011. 56: p. 5642 - 5649.
3. Lohrengel, M.M., et al., Microscopic investigations of electrochemical machining of Fe in NaNO3. Electrochimica Acta, 2003. 48: p. 3203 - 3211.
4. Landolt, D., Fundamental aspects of electropolishing. Electrochimica Acta, 1987. 32(1): p. 1-11.
5. Lee, E.S., Machining characteristics of the electropolishing of stainless steel (STS316L). International Journal of Advanced Manufacturing Technology, 2000. 16(8): p. 591-599.
6. Mount, A.R., et al., An integrated strategy for materials characterisation and process simulation in electrochemical machining. Journal of Materials Processing Technology, 2003. 138: p. 449-454.
7. Mount, A.R., P.S. Howarth, and D. Clifton, The use of a segmented tool for the analysis of electrochemical machining. Journal of Applied Electrochemistry, 2001. 31: p. 1213-1220.
8. Mount, A.R., P.S. Howarth, and D. Clifton, The Electrochemical Machining Characteristics of Stainless Steels. Journal of The Electrochemical Society, 2003. 150: p. D63-D69.
9. Ramousse, J., et al., Modelling of heat, mass and charge transfer in a PEMFC single cell. Journal of Power Sources, 2005. 145: p. 416-427.
10. Rosset, E., M. Datta, and D. Landolt, Electrochemical dissolution of stainless steels in flow channel cells with and without photoresist masks. Journal of Applied Electrochemistry, 1990. 20: p. 69-76.
11. Baron, A., et al., Electropolishing and chemical passivation of austenitic steel. Journal of Achievements in Materials and Manufacturing Engineering, 2008. 31: p. 197-202.
12. Lee, S.-J., C.P. Liu, and T.J. Fan, Electrochemical Mechanical Polishing of Flexible Stainless Steel Substrate for Thin-Film Solar Cells. Int. J. Electrochem. Sci., 2013. 8: p. 6878 - 6888.
13. BastaniNejad, M., et al., Evaluation of electropolished stainless steel electrodes for use in DC high voltage photoelectron guns. Journal of Vacuum Science & Technology A, 2015. 33(4): p. 041401.
14. Lozano-Morales, A., Niobium Electropolishing Using an HF-free Electrolyte, in Plating & Surface Finishing. 2009, NASF: Washington DC.
15. Landolt, D., P.F. Chauvy, and O. Zinger, Electrochemical micromachining, polishing and surface structuring of metals: fundamental aspects and new developments. Electrochimica Acta, 2003. 48: p. 3185 - 3201.
16. Datta, M. and D. Landolt, On the role of mass transport in high rate dissolution of iron and nickel in ECM electrolytes—II. Chlorate and nitrate solutions. Electrochimica Acta, 1980. 25: p. 1263-1271.
17. Wagner, T., High rate electrochemical dissolution of iron-bassed alloys in NaCl and NaNO3 electrolytes. 2002, Universitat Stuttgart.

Page | 15
18. Wang, D., et al., Investigation of the electrochemical dissolution behavior of Inconel 718 and 304 stainless steel at low current density in NaNO3 solution. Electrochimica Acta, 2015. 156: p. 301-307.
19. Mukherjee, S.K., et al., Effect of valency on material removal rate in electrochemical machining of aluminium. Journal of Materials Processing Technology, 2008. 202: p. 398-401.
20. Khalil, M.F., et al., Laminar Flow in Concentric Annulus with a Moving Core, in Twelfth International Water Technology Conference. 2008: Alexandria, Egypt. p. 439-457.
21. Kozak, J., K.P. Rajurkar, and Y. Makkar, Selected problems of micro-electrochemical machining. Journal of Materials Processing Technology, 2004. 149: p. 426-431.
22. Tailor, P.B., A. Agrawal, and S.S. Joshi, Evolution of electrochemical finishing processes through cross innovations and modeling. International Journal of Machine Tools and Manufacture, 2013. 66: p. 15-36.
23. Bannard, J., On the electrochemical machining of some titanium alloys in bromide electrolytes. J. Appl. Electrochem. Soc., 1976. 6: p. 477.
24. Muir, R., The Parameterisation of Electrochemical Machining. 2006. p. 269. 25. Zhang, Y., Investigation into current efficiency for pulse electrochemical machining of nickel
alloy. 2010. p. 80. 26. Haisch, T., E. Mittemeijer, and J.W. Schultze, Electrochemical machining of the steel 100Cr6 in
aqueous NaCl and NaNO3 solutions: microstructure of surface films formed by carbides. Electrochimica Acta, 2001. 47: p. 235 - 241.
27. McGeough, J.A., Principles of electrochemical machining. 1974: p. xv,255p. 28. Tang, L., et al., The effect of electrolyte current density on the electrochemical machining S-03
material. The International Journal of Advanced Manufacturing Technology, 2014. 71(9): p. 1825-1833.
29. Lohrengel, M.M., K.P. Rataj, and T. Münninghoff, Electrochemical Machining—mechanisms of anodic dissolution. Electrochimica Acta, 2016.
30. Hackert-Oschätzchen, M., S.F. Jahn, and A. Schubert, Design of Electrochemical Machining Processes by Multiphysics Simulation, in COMSOL Conference 2011, COMSOL, Editor. 2011: Stuttgart.
31. Deconinck, D., et al., A temperature dependent multi-ion model for time accurate numerical simulation of the electrochemical machining process. Part I: Theoretical basis. Electrochimica Acta, 2012. 60: p. 321 - 328.
32. Kozak, J., K.P. Rajurkar, and R. Balkrishna, Study of Electrochemical Jet Machining process. Journal of Manufacturing Science and Engineering-Transactions of the Asme, 1996. 118: p. 490-498.


![Surface Finish Control by Electrochemical Polishing in ... · In other works, Lee [5] found that when electropolishing stainless steel 316L, better electropolishing results were obtained](https://img.dokumen.tips/doc/110x75/5e6b0b8e933d8e13c63078e1/surface-finish-control-by-electrochemical-polishing-in-in-other-works-lee-5.jpg)