Embed Size (px)
Citation preview

ARTICLE
Received 28 Mar 2015 | Accepted 12 Aug 2015 | Published 18 Sep 2015
Suppressed phase transition and giant ionicconductivity in La2Mo2O9 nanowiresWei Liu1, Wei Pan1, Jian Luo2, Andy Godfrey1, Gang Ou1, Hui Wu1 & Wei Zhang1
Improving the ionic conductivity of solid electrolytes at low temperatures represents a major
challenge and an opportunity for enabling a variety of solid-state ionic devices for energy
conversion and storage, as well as for environmental protection. Here we report a giant
ionic conductivity of 0.20 Scm� 1, achieved at 500 �C, in the La2Mo2O9 nanowires with a
bamboo-wire morphology, corresponding to a 1000-fold enhancement in conductivity over
conventional bulk material. Stabilization of the high-temperature phase is observed to
account for about a 10-fold increase in the conductivity. We further demonstrate that fast
surface conduction in B3 nm thick, partially ordered, surface ‘amorphous’ films, under
strain on the curved surfaces of the nanowires (as a non-autonomous surface phase or
complexion), contributes to an enhancement of the conductivity by another two orders of
magnitude. Exemplified here by the study of the La2Mo2O9 nanowires, new possibilities for
improvement of conductivity and for miniaturization of solid-state ionic devices by the careful
use of one-dimensional nanomaterials can be envisioned.
DOI: 10.1038/ncomms9354 OPEN
1 State Key Lab of New Ceramics and Fine Processing, School of Materials Science and Engineering, Tsinghua University, Beijing 100084, China. 2 Departmentof NanoEngineering, Program of Materials Science and Engineering, University of California, San Diego, La Jolla, California 92093-0448, USA.Correspondence and requests for materials should be addressed to W.P. (email: [email protected]) or to J.L. (email: [email protected]).
NATURE COMMUNICATIONS | 6:8354 | DOI: 10.1038/ncomms9354 | www.nature.com/naturecommunications 1
& 2015 Macmillan Publishers Limited. All rights reserved.
As a result of the continued drive towards increased energyefficiency and reduction of air pollution, solid oxygen-ionconductors have been developed as crucial components
for various energy and environmental technologies, such as gassensors, solid oxide fuel cells and oxygen-separation membranes.Interest in improving the ionic conductivity of solid oxygen-ionconductors, resulting in lower operating temperatures, hasintensified over recent years, mainly driven by the necessity toreplace conventional zirconia-based electrolytes with alternativematerials with improved ion mobility at intermediate and lowtemperatures (below 750 �C)1,2. At the same time, rapid progresshas been achieved in the development of miniaturized andportable electrochemical devices by the application of nano-structured materials. One-dimensional nanomaterials continue tobe at the forefront of research into the application of functionalmicro-devices, both for the scientific community and forindustry, on account of their exceptional performance3–5. Asthe size of a functional material is reduced to the nanoscale, thestructure, phase stability and properties can all differ markedlyfrom those in bulk counterparts, owing to both surface and nanoeffects6.
The use of La2Mo2O9 (LMO) as a solid oxygen-ion electrolytewas first reported by Lacorre et al.7 LMO exhibits fast oxygen-ionconducting properties at elevated temperatures, with an ionicconductivity slightly higher than stabilized zirconia7,8, the mostwidely used electrolyte at present. However, the ionicconductivity of LMO at low temperatures is poor, as a result ofa reversible phase transition around 580 �C from the cubic bphase to a distorted monoclinic structure with a 2� 3� 4supercell (the a phase), which causes a large reduction in ionicconductivity7,9,10. Moreover, LMO suffers from severe damageafter cycling as a result of the volume change accompanying thisfirst-order phase transition, thereby further limiting its practicalapplication. It is highly desirable, therefore, to stabilize the high-temperature b phase at room temperature (RT). Various attemptshave been made to achieve such a stabilization of the b phase bypartial substitution of either the La site by cations such as Ca2þ ,Ba2þ , Sr2þ (ref. 10), Nd3þ , Gd3þ and Y3þ (ref. 11), or of theMo site by Nb5þ (ref. 12) and W6þ (refs 9,13). Although suchdoping provides some improvement in the low-temperature ionicconductivity, it does not yield significant improvement in thehigh-temperature ionic conductivity13,14.
Here we report for the first time stabilization of the high-temperature b phase down to RT, without use of dopants, in theLMO nanowires with a bamboo-wire morphology, prepared byelectrospinning, an efficient, cost-effective and versatile method15.The nanowires show an enhancement in ionic conductivity overconventional LMO by three orders of magnitude, attributed bothto the phase stabilization and to fast surface conduction.Moreover, the enhancement from surface conduction is greaterthan predicted from a simple composite rule, suggesting acurvature-dependent true size effect.
ResultsConfirmation of the b phase in the nanowires at RT. As seen inFig. 1a and Supplementary Fig. 2, powder X-ray diffraction(XRD) analysis suggests that both LMO nanowires calcined attemperatures between 550 and 700 �C, and the LMO powder, arecrystallized and monophase. Step-scanning XRD (Fig. 1b) revealsa lattice constant for the LMO nanowires of 7.1565±0.0005 Å,which is close to the value of 7.155 Å in the PDF card. A moresensitive indicator for the presence of the monoclinic a phase is,however, a splitting of diffraction peaks in high-resolution XRDpatterns16. As seen in Fig. 1b, we indeed find that high-resolutionXRD patterns of the LMO powder show an obvious splitting of
the pseudo-cubic reflection (321) at around 2y¼ 46.5–48.5�,indicating the presence of the monoclinic a phase. In contrast, noevidence of peak splitting is seen for the LMO nanowires,confirming the absence of the a phase and the completestabilization of the b phase to RT in LMO nanowires.
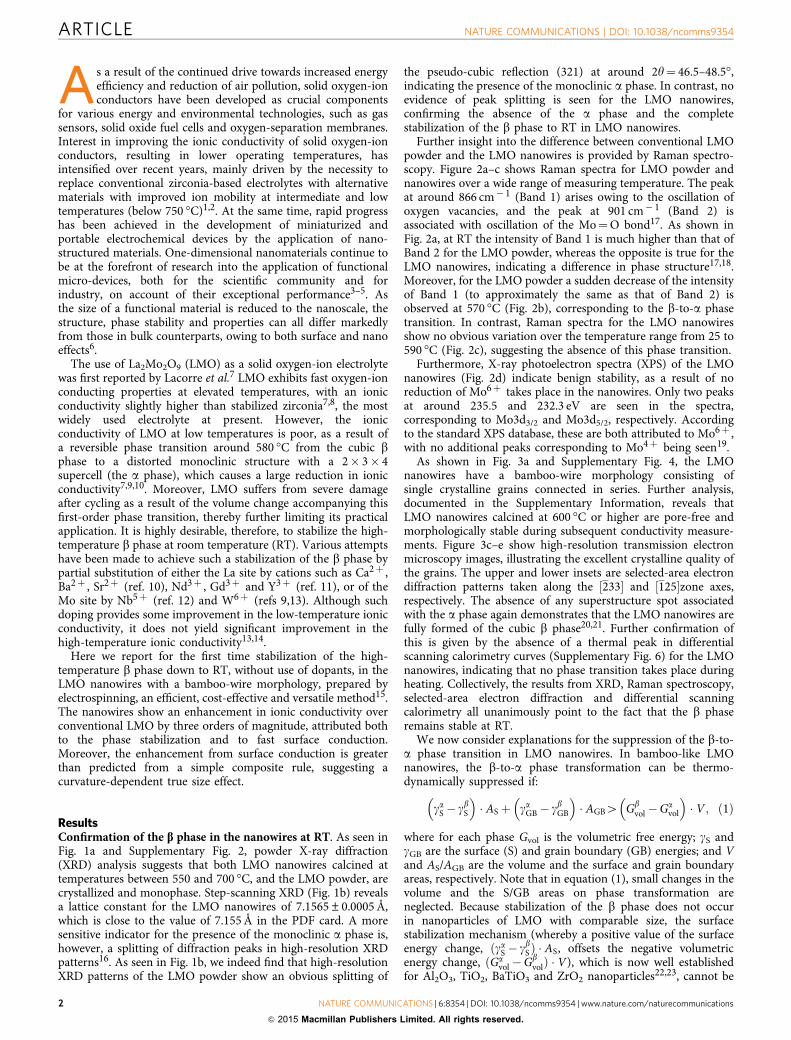
Further insight into the difference between conventional LMOpowder and the LMO nanowires is provided by Raman spectro-scopy. Figure 2a–c shows Raman spectra for LMO powder andnanowires over a wide range of measuring temperature. The peakat around 866 cm� 1 (Band 1) arises owing to the oscillation ofoxygen vacancies, and the peak at 901 cm� 1 (Band 2) isassociated with oscillation of the Mo¼O bond17. As shown inFig. 2a, at RT the intensity of Band 1 is much higher than that ofBand 2 for the LMO powder, whereas the opposite is true for theLMO nanowires, indicating a difference in phase structure17,18.Moreover, for the LMO powder a sudden decrease of the intensityof Band 1 (to approximately the same as that of Band 2) isobserved at 570 �C (Fig. 2b), corresponding to the b-to-a phasetransition. In contrast, Raman spectra for the LMO nanowiresshow no obvious variation over the temperature range from 25 to590 �C (Fig. 2c), suggesting the absence of this phase transition.
Furthermore, X-ray photoelectron spectra (XPS) of the LMOnanowires (Fig. 2d) indicate benign stability, as a result of noreduction of Mo6þ takes place in the nanowires. Only two peaksat around 235.5 and 232.3 eV are seen in the spectra,corresponding to Mo3d3/2 and Mo3d5/2, respectively. Accordingto the standard XPS database, these are both attributed to Mo6þ ,with no additional peaks corresponding to Mo4þ being seen19.
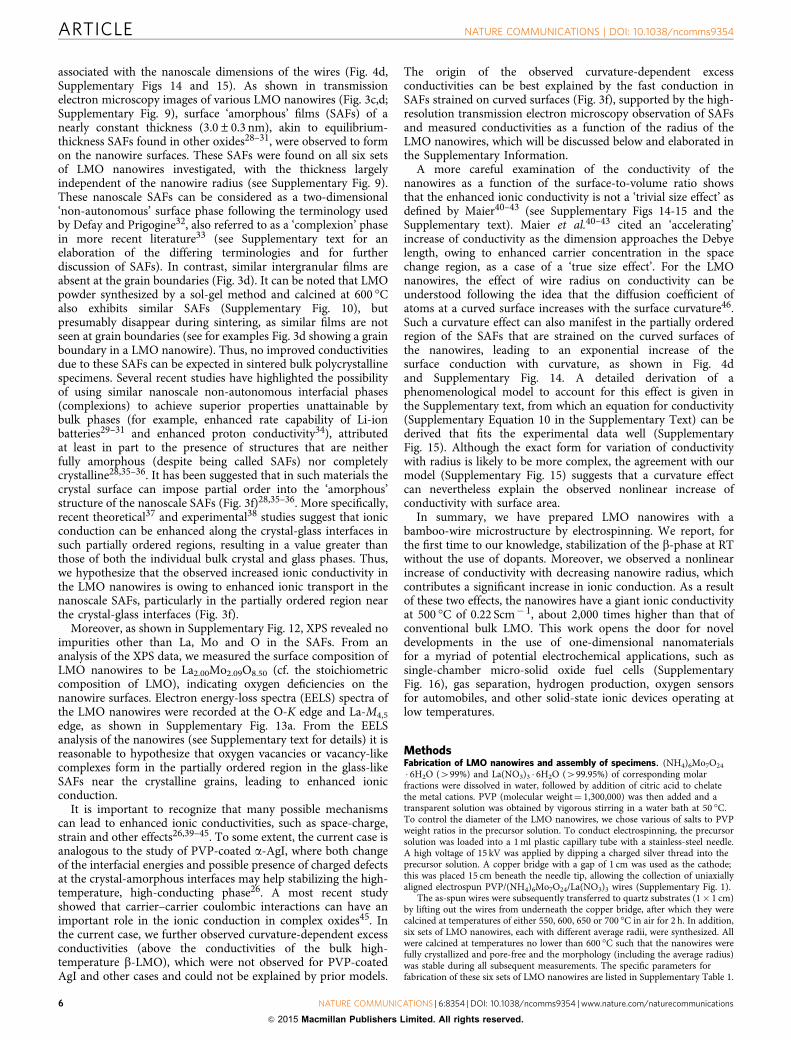
As shown in Fig. 3a and Supplementary Fig. 4, the LMOnanowires have a bamboo-wire morphology consisting ofsingle crystalline grains connected in series. Further analysis,documented in the Supplementary Information, reveals thatLMO nanowires calcined at 600 �C or higher are pore-free andmorphologically stable during subsequent conductivity measure-ments. Figure 3c–e show high-resolution transmission electronmicroscopy images, illustrating the excellent crystalline quality ofthe grains. The upper and lower insets are selected-area electrondiffraction patterns taken along the ½233� and ½125�zone axes,respectively. The absence of any superstructure spot associatedwith the a phase again demonstrates that the LMO nanowires arefully formed of the cubic b phase20,21. Further confirmation ofthis is given by the absence of a thermal peak in differentialscanning calorimetry curves (Supplementary Fig. 6) for the LMOnanowires, indicating that no phase transition takes place duringheating. Collectively, the results from XRD, Raman spectroscopy,selected-area electron diffraction and differential scanningcalorimetry all unanimously point to the fact that the b phaseremains stable at RT.
We now consider explanations for the suppression of the b-to-a phase transition in LMO nanowires. In bamboo-like LMOnanowires, the b-to-a phase transformation can be thermo-dynamically suppressed if:
gaS � gbS� �
� ASþ gaGB� gbGB
� �� AGB4 Gb
vol�Gavol
� �� V ; ð1Þ
where for each phase Gvol is the volumetric free energy; gS andgGB are the surface (S) and grain boundary (GB) energies; and Vand AS/AGB are the volume and the surface and grain boundaryareas, respectively. Note that in equation (1), small changes in thevolume and the S/GB areas on phase transformation areneglected. Because stabilization of the b phase does not occurin nanoparticles of LMO with comparable size, the surfacestabilization mechanism (whereby a positive value of the surfaceenergy change, ðgaS � gbSÞ � AS, offsets the negative volumetricenergy change, ðGa
vol�GbvolÞ � V), which is now well established
for Al2O3, TiO2, BaTiO3 and ZrO2 nanoparticles22,23, cannot be
ARTICLE NATURE COMMUNICATIONS | DOI: 10.1038/ncomms9354
2 NATURE COMMUNICATIONS | 6:8354 | DOI: 10.1038/ncomms9354 | www.nature.com/naturecommunications
& 2015 Macmillan Publishers Limited. All rights reserved.

the sole reason for the observed stabilization of the b phase inthe LMO nanowires. A positive value of the grain boundaryenergy contribution, ðgaGB� gbGBÞ � AGB, may, however, be a more
effective and dominant driving force for stabilization of the bphase. In fact, it is reasonable to expect the a phase to have highervalue of gGB, because the low symmetry of this phase, combined
a
20 30 402 Theta (deg.)
La2Mo2O9
2 Theta (deg.)50 60
Powder
Powder
Nanofibers calcined at
Nanofibers
700 °C
700 °C
650 °C
650 °C
600 °C
600 °C
550 °C
550 °C
JCPDF#28–0509
70 80 46.8 47.2 47.6 48.0 48.4
b
Figure 1 | Phase identification of the LMO nanowires. (a) XRD patterns taken at RT of LMO nanowires calcined at various temperatures and of
corresponding bulk LMO powder. (b) High-resolution XRD patterns showing the pseudo-cubic (321) reflection for the LMO powder whereas no peak
splitting is seen for the nanowires.
a d
b
c
e
f
Room temperature
Various temperatures
Various temperatures
Band 1
Band 2
Powder
Powder
Nanofibers
Nanofibers
590 °C580 °C
580 °C
550 °C
570 °C
540 °C
560 °C540 °C
520 °C500 °C
520 °C
25 °C
25 °C
La3d5/2
Mo3d5/2
Mo3d3/2
Raman shift (cm–1)
200 400 600 800 1,000 1,200 528
832
230 232 234 236 238
Cou
nts
(s)
Inte
nsity
(a.
u.)
834
O1s
836 838 840
530 532 534
Binding energy (eV)
Figure 2 | Raman and XPS spectra. Raman spectra for (a) LMO powder and LMO nanowires measured at RT; (b) LMO powder measured at various
temperatures; and (c) LMO nanowires measured at various temperatures. Also show are XPS spectra for LMO nanowires calcined at 600 �C, showing
the peaks of (d) Mo3d, (e) La3d and (f) O1s. See Supplementary fig. S12 for the complete spectrum.
NATURE COMMUNICATIONS | DOI: 10.1038/ncomms9354 ARTICLE
NATURE COMMUNICATIONS | 6:8354 | DOI: 10.1038/ncomms9354 | www.nature.com/naturecommunications 3
& 2015 Macmillan Publishers Limited. All rights reserved.

with a larger unit cell and ordered oxygen vacancies, implymore structural mismatching at the boundaries. Moreover, thishypothesis is supported by prior work22 suggesting that theb-to-a transition temperature is lower in sintered LMO with asmaller grain size.
It should be noted also that a similar suppression of phasetransformation, also resulting in high conductivity at lowtemperatures, has been observed for a-AgI confined inglass24,25. Moreover, a recent study demonstrated that polyvinyl
pyrrolidone (PVP)-coated a-AgI nanoparticles can be stabilizedto RT (to maintain the high ionic conductivity) and the authorsattributed the suppression of the a- to b-/g-phase transition notonly to a surface energy effect but also to the presence of defectsand associated charge imbalance at the PVP/AgI interface26. Inthe current case, the LMO nanowires were annealed at Z600 �Cin air so that the polymer component decomposed; yet, as we willelaborate later, nanoscale, La-Mo-O oxide-based, amorphousfilms formed on the surfaces of LMO nanowires (Fig. 3c–e),which may also induce defects and charge separation at/near thecrystal-amorphous interfaces to contribute to the suppression ofthe b-to-a transition in LMO.
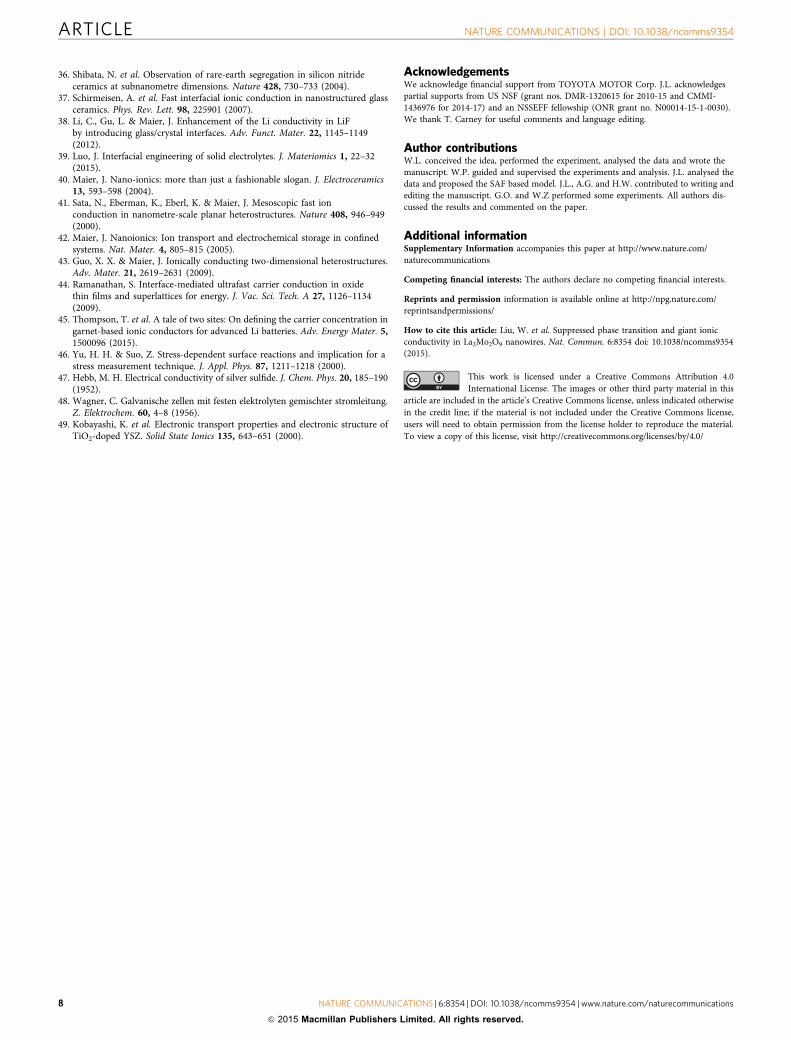
Electrical property of the nanowires. For investigations ofconductivity, LMO nanowires with consistent alignment, andcovering a large area up to the wafer scale, were fabricated(Fig. 4a). Numerable nanowires were prepared on a quartz sub-strate by precise control of the collection time during electro-spinning. To allow impedance spectroscopy measurements to bemade, parallel Pt electrodes separated by a B50-mm-gap weresputtered on top of the nanowires (Fig. 4a). A schematicillustration of the assembly for testing the oriented nanowires isillustrated in Fig. 4b. The conductivity was determined frommeasured values of resistance, obtained by fitting the impedancespectra for the LMO nanowires (Supplementary Fig. 7). Thetemperature dependence of the total conductivity for the LMOnanowires as a function of radius is shown in Fig. 4c, togetherwith data for corresponding bulk LMO. To measure the radius-dependent conductivities shown in Fig. 4c, six sets of LMOnanowires with different average radii (r¼ 22.5–65.0 nm) weremade primarily by changing the radius of the as-spun fibres viatuning of the salt-to-polymer ratio in the precursor solutionduring electrospinning. In addition, high-temperature (650 or700 �C) calcination was used in two cases to achieve smalladjustments of the nanowire radius (see Supplementary Table S1for details of the specific fabrication conditions of the six sets ofnanowires, and the Supplementary text for a discussion of theeffects of calcination). It is important to note that all six sets ofsamples were calcined at temperatures no lower than 600 �C forsufficiently long durations to ensure that the LMO nanowireswere fully crystallized, pore-free and morphologically stable; thatis, no appreciable changes in morphology (including the averageradius) took place during subsequent impedance measurementsconducted at temperature up to 600 �C (as directly verified inSupplementary Figs 8a-d). Further experiments also verified nosignificant changes in the measured conductivity after as manyas five heating and measurement cycles, as shown inSupplementary Fig. 8e.
For bulk LMO, an abrupt decrease in the conductivity by aboutone order of magnitude is seen, resulting from the phasetransformation from the high-conductivity b phase to the low-conductivity a phase. In contrast, no such loss of conductivity isobserved for the LMO nanowires, implying a suppression of thea-phase transition. The conductivity at 500 �C was measured as0.22 Scm� 1 for LMO nanowires of radius (r) of 22.5 nm and8.38� 10� 5 Scm� 1 for bulk LMO; at 600 �C the correspondingvalues are 1.18 Scm� 1 and 6.66� 10� 3 Scm� 1, respectively. Theconductivity of LMO nanowires (r¼ 22.5 nm) is therefore morethan 2,000 times higher than that of the bulk a-phase (500 �C)and 200 times higher than that of the bulk b-phase (600 �C).Careful measurements showed that the conductivity of the quartzsubstrate without LMO nanowires was negligibly small (lowerthan the detection limit of the instrument) in the temperaturerange of 400–600 �C. Thus, the measured conductivities are fromthe nanowires.
a
b c
d
Surface “Amorphous” film(SAF)
rδ ��-LMO-LMO
Partial layering ordernear the interface
Partial (decaying) lateral order(imposed by the crystal surface)
--strained by the surface curvature
f
e
(210)
(200)
(110)
Zone axis [233]
~3.2 nm
~3.0 nm
~3.3
nm
311
2 1/nm
2 1/nm
210
Disordered Surfa
ce la
yer
Disordered surface layer
surface layerD
isordered110-
-
-
Zone axis [125]
-
121-
Disordered surfce layer
Figure 3 | Structural characterization of the LMO nanowires.
(a) Transmission electron microscopy image of an individual nanowire
calcined 650 �C. (b) Transmission electron microscopy image of two grains.
Also shown are high-resolution transmission electron microscopy images of
nanowires calcined at (c and d) 600 �C and (e) 700 �C. The insets in panel
(c) are the corresponding selected-area electron diffraction patterns.
(f) Schematic illustration of the partial order in the glass-like structure near
the crystalline grain in the SAF and the possible influence of surface
curvature. It is well established that the crystal surface can impose both
partial layering and lateral order to the glass structure at the crystal-glass
interface, where the partial order decays away from the interface28,35,36.
Recent modelling37 and experimental38 studies suggest enhanced ionic
conduction along the crystal-glass interfaces (in the partially ordered
region) that can be greater than that in either the crystal or glass phases.
We hypothesize that such partial order in the SAF region, which is known to
exist28,35,36, leads to enhanced ionic conduction. This is further enhanced
by hoop strains arising from the high surface curvature, in agreement with
our experimental observation of the curvature-dependent surface ionic
conductivity.
ARTICLE NATURE COMMUNICATIONS | DOI: 10.1038/ncomms9354
4 NATURE COMMUNICATIONS | 6:8354 | DOI: 10.1038/ncomms9354 | www.nature.com/naturecommunications
& 2015 Macmillan Publishers Limited. All rights reserved.

The nature of the conductivity in the LMO nanowires, and inparticular whether or not it is ionic, is of significant importancewith respect to their potential application. Figure 4e shows thedependence of conductivity on oxygen partial pressure. Theresults reveal a constant conductivity over a wide range of pO2
values, suggesting that the conduction originates mainly fromoxygen ions, and not from electron migration. In addition,Hebb–Wagner DC polarization measurements also confirmedthat the conduction is largely ionic (with ionic transfer numbersof B0.95; see Supplementary Table 2). Moreover, Fig. 4f showsthat the conductivity is almost unchanged over a large range ofhumidity at various temperatures, which indicates that protonicsurface conduction should be negligible. It is concluded thereforethat the LMO nanowires are ionic conductors.
Typical AC impedance spectra for LMO nanofibers(Supplementary Fig. 7) measured at various temperatures show
only one well-defined semicircle at high and intermediatefrequencies that can be ascribed to the total resistance. Grainand grain boundary responses for oxides typically showcapacitance values of around 10� 12 F and 10� 9 F in impedancemeasurements, respectively27. Supplementary Table 3 lists thecorresponding capacitance values for LMO nanowires measuredat various temperatures. In each case the capacitance of thenanowires is closer to values expected for grains, suggesting thatthe grains provide a larger contribution to the total resistancethan the grain boundaries.
DiscussionIn addition to the effect of phase stabilization, the further increaseof the ionic conductivity with decreasing radius of the LMOnanowires should be attributed to fast surface conduction
c
e f
0
–2
–2
100 80 60 40 20
500 °C
r (nm)
Logσ
(Scm
–1)
Log pO2 (atm) RH (%)
Inσ
(Scm
–1)
σ (S
cm–1
)
σ (S
cm–1
)
–4
–4
–6
–6
–81.1
0.8 0.8
0.6
0.6
0.4
0.2
–0.2
0.0
0.4
0.2–30 –20 –10 0 0 30 60 90 120
550 °C
Bulk
22.5 nm
Nanofibers with various radii
27.0 nm
475 °C450 °C
34.0 nm
500 °C
43.5 nm
525 °C
51.0 nm65.0 nm
550 °C
1.2
1,000/T(K–1)
1.3 1.4 0.01 0.02 0.03
�total ∝ �surf exp(B/r)
At a given temperature
1/r (nm–1)
0.04 0.05
d
a
Pt wires
Pt Pt
Substrate
Electrochemistryworkstation
LMO nanofibers
b
r
δ
Figure 4 | Measurement and analysis of the conductivities for the LMO nanowires. (a) Image of aligned wires placed on electrodes. (b) Schematic
illustration of the configuration for the AC impedance spectroscopic measurements. (c) Arrhenius plots of the conductivities of LMO nanowires with
various radii (made primarily by changing the salt-to-polymer ratio in the precursor solutions), together with the measured conductivities for corresponding
bulk LMO. (d) Plot of ln(s) versus 1/r for the nanowires (see Supplementary fig. S15 for the complete fitting with a model). Evidence of oxygen-ion
conduction in LMO nanowires with an average diameter of 45 nm. (e) Conductivity of LMO nanowires versus oxygen partial pressure at 550 �C.
(f) Conductivity of LMO nanowires versus humidity at various measuring temperatures.
NATURE COMMUNICATIONS | DOI: 10.1038/ncomms9354 ARTICLE
NATURE COMMUNICATIONS | 6:8354 | DOI: 10.1038/ncomms9354 | www.nature.com/naturecommunications 5
& 2015 Macmillan Publishers Limited. All rights reserved.
associated with the nanoscale dimensions of the wires (Fig. 4d,Supplementary Figs 14 and 15). As shown in transmissionelectron microscopy images of various LMO nanowires (Fig. 3c,d;Supplementary Fig. 9), surface ‘amorphous’ films (SAFs) of anearly constant thickness (3.0±0.3 nm), akin to equilibrium-thickness SAFs found in other oxides28–31, were observed to formon the nanowire surfaces. These SAFs were found on all six setsof LMO nanowires investigated, with the thickness largelyindependent of the nanowire radius (see Supplementary Fig. 9).These nanoscale SAFs can be considered as a two-dimensional‘non-autonomous’ surface phase following the terminology usedby Defay and Prigogine32, also referred to as a ‘complexion’ phasein more recent literature33 (see Supplementary text for anelaboration of the differing terminologies and for furtherdiscussion of SAFs). In contrast, similar intergranular films areabsent at the grain boundaries (Fig. 3d). It can be noted that LMOpowder synthesized by a sol-gel method and calcined at 600 �Calso exhibits similar SAFs (Supplementary Fig. 10), butpresumably disappear during sintering, as similar films are notseen at grain boundaries (see for examples Fig. 3d showing a grainboundary in a LMO nanowire). Thus, no improved conductivitiesdue to these SAFs can be expected in sintered bulk polycrystallinespecimens. Several recent studies have highlighted the possibilityof using similar nanoscale non-autonomous interfacial phases(complexions) to achieve superior properties unattainable bybulk phases (for example, enhanced rate capability of Li-ionbatteries29–31 and enhanced proton conductivity34), attributedat least in part to the presence of structures that are neitherfully amorphous (despite being called SAFs) nor completelycrystalline28,35–36. It has been suggested that in such materials thecrystal surface can impose partial order into the ‘amorphous’structure of the nanoscale SAFs (Fig. 3f)28,35–36. More specifically,recent theoretical37 and experimental38 studies suggest that ionicconduction can be enhanced along the crystal-glass interfaces insuch partially ordered regions, resulting in a value greater thanthose of both the individual bulk crystal and glass phases. Thus,we hypothesize that the observed increased ionic conductivity inthe LMO nanowires is owing to enhanced ionic transport in thenanoscale SAFs, particularly in the partially ordered region nearthe crystal-glass interfaces (Fig. 3f).
Moreover, as shown in Supplementary Fig. 12, XPS revealed noimpurities other than La, Mo and O in the SAFs. From ananalysis of the XPS data, we measured the surface composition ofLMO nanowires to be La2.00Mo2.09O8.50 (cf. the stoichiometriccomposition of LMO), indicating oxygen deficiencies on thenanowire surfaces. Electron energy-loss spectra (EELS) spectra ofthe LMO nanowires were recorded at the O-K edge and La-M4,5
edge, as shown in Supplementary Fig. 13a. From the EELSanalysis of the nanowires (see Supplementary text for details) it isreasonable to hypothesize that oxygen vacancies or vacancy-likecomplexes form in the partially ordered region in the glass-likeSAFs near the crystalline grains, leading to enhanced ionicconduction.
It is important to recognize that many possible mechanismscan lead to enhanced ionic conductivities, such as space-charge,strain and other effects26,39–45. To some extent, the current case isanalogous to the study of PVP-coated a-AgI, where both changeof the interfacial energies and possible presence of charged defectsat the crystal-amorphous interfaces may help stabilizing the high-temperature, high-conducting phase26. A most recent studyshowed that carrier–carrier coulombic interactions can have animportant role in the ionic conduction in complex oxides45. Inthe current case, we further observed curvature-dependent excessconductivities (above the conductivities of the bulk high-temperature b-LMO), which were not observed for PVP-coatedAgI and other cases and could not be explained by prior models.
The origin of the observed curvature-dependent excessconductivities can be best explained by the fast conduction inSAFs strained on curved surfaces (Fig. 3f), supported by the high-resolution transmission electron microscopy observation of SAFsand measured conductivities as a function of the radius of theLMO nanowires, which will be discussed below and elaborated inthe Supplementary Information.
A more careful examination of the conductivity of thenanowires as a function of the surface-to-volume ratio showsthat the enhanced ionic conductivity is not a ‘trivial size effect’ asdefined by Maier40–43 (see Supplementary Figs 14-15 and theSupplementary text). Maier et al.40–43 cited an ‘accelerating’increase of conductivity as the dimension approaches the Debyelength, owing to enhanced carrier concentration in the spacechange region, as a case of a ‘true size effect’. For the LMOnanowires, the effect of wire radius on conductivity can beunderstood following the idea that the diffusion coefficient ofatoms at a curved surface increases with the surface curvature46.Such a curvature effect can also manifest in the partially orderedregion of the SAFs that are strained on the curved surfaces ofthe nanowires, leading to an exponential increase of thesurface conduction with curvature, as shown in Fig. 4dand Supplementary Fig. 14. A detailed derivation of aphenomenological model to account for this effect is given inthe Supplementary text, from which an equation for conductivity(Supplementary Equation 10 in the Supplementary Text) can bederived that fits the experimental data well (SupplementaryFig. 15). Although the exact form for variation of conductivitywith radius is likely to be more complex, the agreement with ourmodel (Supplementary Fig. 15) suggests that a curvature effectcan nevertheless explain the observed nonlinear increase ofconductivity with surface area.
In summary, we have prepared LMO nanowires with abamboo-wire microstructure by electrospinning. We report, forthe first time to our knowledge, stabilization of the b-phase at RTwithout the use of dopants. Moreover, we observed a nonlinearincrease of conductivity with decreasing nanowire radius, whichcontributes a significant increase in ionic conduction. As a resultof these two effects, the nanowires have a giant ionic conductivityat 500 �C of 0.22 Scm� 1, about 2,000 times higher than that ofconventional bulk LMO. This work opens the door for noveldevelopments in the use of one-dimensional nanomaterialsfor a myriad of potential electrochemical applications, such assingle-chamber micro-solid oxide fuel cells (SupplementaryFig. 16), gas separation, hydrogen production, oxygen sensorsfor automobiles, and other solid-state ionic devices operating atlow temperatures.
MethodsFabrication of LMO nanowires and assembly of specimens. (NH4)6Mo7O24
� 6H2O (499%) and La(NO3)3 � 6H2O (499.95%) of corresponding molarfractions were dissolved in water, followed by addition of citric acid to chelatethe metal cations. PVP (molecular weight¼ 1,300,000) was then added and atransparent solution was obtained by vigorous stirring in a water bath at 50 �C.To control the diameter of the LMO nanowires, we chose various of salts to PVPweight ratios in the precursor solution. To conduct electrospinning, the precursorsolution was loaded into a 1 ml plastic capillary tube with a stainless-steel needle.A high voltage of 15 kV was applied by dipping a charged silver thread into theprecursor solution. A copper bridge with a gap of 1 cm was used as the cathode;this was placed 15 cm beneath the needle tip, allowing the collection of uniaxiallyaligned electrospun PVP/(NH4)6Mo7O24/La(NO3)3 wires (Supplementary Fig. 1).
The as-spun wires were subsequently transferred to quartz substrates (1� 1 cm)by lifting out the wires from underneath the copper bridge, after which they werecalcined at temperatures of either 550, 600, 650 or 700 �C in air for 2 h. In addition,six sets of LMO nanowires, each with different average radii, were synthesized. Allwere calcined at temperatures no lower than 600 �C such that the nanowires werefully crystallized and pore-free and the morphology (including the average radius)was stable during all subsequent measurements. The specific parameters forfabrication of these six sets of LMO nanowires are listed in Supplementary Table 1.
ARTICLE NATURE COMMUNICATIONS | DOI: 10.1038/ncomms9354
6 NATURE COMMUNICATIONS | 6:8354 | DOI: 10.1038/ncomms9354 | www.nature.com/naturecommunications
& 2015 Macmillan Publishers Limited. All rights reserved.

To allow electrical conductivity measurements to be made, parallel Pt electrodesseparated by a B50 mm gap were sputtered on top of nanowires placed on a quartzsubstrate (Fig. 4a). A schematic illustration of the assembly and device for testing ofthe oriented LMO nanowires is illustrated in Fig. 4b. The collection time duringelectrospinning was controlled precisely to enable obtaining a sufficient (but notexcessive) number of well-aligned and non-overlapping LMO nanowires on thesubstrate. The number of the nanowires between the electrodes is around 100,which varies according to different sample.
Fabrication of LMO bulk specimens. For comparison with the nanowires,LMO powders were prepared by a sol-gel synthesis using starting materials of(NH4)6Mo7O24 � 6H2O, La(NO3)3 � 6H2O and citric acid. A transparent viscous gelwas obtained by stirring these materials together at 90 �C. The dry gel was calcinedin the temperature range of 550–900 �C for 3 h in air. The as-synthesized LMOpowder was then ground, sieved, dry pressed into pellets, and sintered at 1,200 �Cfor 12 h in air. Pt was sputtered as an electrode for AC measurement of thebulk LMO.
Materials characterization. XRD experiments were conducted using aD/max-2500 H diffractometer (Rigaku, Akishima-Shi, Japan; using Cu Ka
radiation of 0.15406 nm) for phase identification, crystal structure analysis anddetermination of the lattice constants. Additional high-resolution XRD spectrawere taken for the range of 2y¼ 46.5–48.5� at RT using a step-scanning mode.The phase structure and phase transition characteristics of the wires were probedby Raman spectroscopy (Model LabRAM HR800, HORIBA Jobin Yvon, Paris,France). The element valence state was determined by XPS using a PHI QuanteraSXM system (ULVAC-PHI, Kanagawa, Japan). Specimens for transmissionelectron microscopy were examined using a JEM-2010 F microscope (JEOL, Tokyo,Japan). EELS spectra were obtained using a JEM-ARM200F (JEOL, Tokyo, Japan)aberration-corrected electron microscope, operated at 200 kV.
Electrical measurements. Values of pO2 were measured and controlled usinga ceramic oxygen sensor (assembled from a commercially sourced YSZ tube;measurements were conducted in a separated high-temperature chamber).Impedance spectra of the LMO nanowires were measured under conditionscovering a range of humidity (using dry air bubbled through a H2O bath) andtemperature. A digital humidity metre was used to measure the relative humidity.To further clarify the nature of the charge carriers in LMO nanowires, DCHebb–Wagner polarization measurements were carried out. The results were usedto determine the ionic transport number following refs 47–49. Specifically, DCHebb–Wagner polarization measurements were performed using an ion-blockingelectrode to determine the electronic conductivity of the LMO nanofibers. Theblocking electrode was prepared from a low melting point glass such that it fullycovered one of the Pt electrodes forming the measurement cell. To avoid damage ofthe LMO nanofibers, we selected a glass with a melting point of 450 �C andcarefully printed the glass paste on the electrode. After calcination at 500 �C for ashort time, we confirmed that the blocking electrode was fully covered by the glassby inspection using an optical microscope. A potentiostatic DC voltage rangingfrom 0.2 to 1.1 V was applied between the reversible and blocking electrode, andthe obtained current–voltage dependence was used to calculate the electronicconductivity. From these data, the electronic and ionic transfer numbers werecalculated and are listed in Supplementary Table S2. Electrical conductivity wasinvestigated using AC impedance spectroscopy (IM6, Zahner, Kronach, Germany)over a frequency range from 0.1 Hz to 8 MHz in air.
The conductivity, s, of the nanowires was calculated from the resistance (R)measured at various temperatures using the following relationship:
s ¼ aLRnpr2
; ð2Þ
where L is the distance between the two Pt electrodes, a is a geometrical factor (thatis equal to the mean of 1/siny, where y is the measured angle between the nanowireand parallel electrodes), n is the number of LMO nanowires (typically about 100),and r is the average radius of the nanowires.
References1. Pergolesi, D. et al. High proton conduction in grain-boundary-free yttrium-
doped barium zirconate films grown by pulsed laser deposition. Nat. Mater. 9,846–852 (2010).
2. Li, M. et al. A family of oxide ion conductors based on the ferroelectricperovskite Na0.5Bi0.5TiO3. Nat. Mater. 13, 31–35 (2014).
3. Lieber, C. M. One-dimensional nanostructures: chemistry, physics &applications. Solid State Commun. 107, 607–616 (1998).
4. Xia, Y. et al. One-dimensional nanostructures: synthesis, characterization, andapplications. Adv. Mater. 15, 353–389 (2003).
5. Cui, Y., Wei, Q., Park, H. C. & Lieber, M. Nanowire nanosensors for highlysensitive and selective detection of biological and chemical species. Science 293,1289–1292 (2001).
6. Campbell, M. G. et al. Synthesis and structure of solution-stableone-dimensional palladium wires. Nat. Chem. 3, 949–953 (2011).
7. Lacorre, P., Goutenoire, F. O., Bohnke, O., Retoux, R. & Laligant, Y. Designingfast oxide-ion conductors based on La2Mo2O 9. Nature 404, 856–858 (2000).
8. Wachsman, E. D. & Lee, K. T. Lowering the temperature of solid oxide fuelcells. Science 334, 935–939 (2011).
9. Yang, J. H., Gu, Z. H., We, Z. Y. & Yan, D. S. Preparation and characterizationof solid electrolytes La2-xAxMo2-yWyO9 (A¼ Sm, Bi). Solid State Ionics 176,523–530 (2005).
10. Subasri, R., Matusch, D., Nafe, H. & Aldinger, F. Synthesis and characterizationof (La1-xMx)2Mo2O9-d; M¼Ca2þ , Sr2þ or Ba2þ . J. Eur. Ceram. Soc. 24,129–147 (2004).
11. Georges, S. et al. Thermal, structural and transport properties of the fastoxide-ion conductors La2-xRxMo2O9 (R¼Nd, Gd, Y). Solid State Ionics 161,231–241 (2003).
12. Basu, S., Devi, P. S. & Maiti, H. S. Nb-doped La2Mo2O9: a new material withhigh ionic conductivity. J. Electrochem. Soc. 152, A2143–A2147 (2005).
13. Marrero-Lopez, D., Canales-Vazquez, J., Ruiz-Morales, J. C., Irvine, J. T. S. &Nunez, P. Electrical conductivity and redox stability of La2Mo2� xWxO9
materials. Electrochim. Acta 50, 4385–4395 (2005).14. Goutenoire, F. O. et al. Structural and transport characteristics of the LAMOX
family of fast oxide-ion conductors, based on lanthanum molybdenum oxideLa2Mo2O9. J. Mater. Chem. 11, 119–124 (2001).
15. Wu, H., Lin, D. D. & Pan, W. Fabrication, assembly, and electricalcharacterization of CuO nanowires. Appl. Phys. Lett. 89, 133125–133127(2006).
16. Selmi, A. G. et al. Complex effect of partial substitution of La3þ by Ca2þ onthe stability of fast oxide-ion conductor La2Mo2O9. Eur. J. Inorg. Chem. 1,1813–1821 (2008).
17. Zhou, D. F. Synthesis, characterization and electrical properties of solid stateelectrolyte materials La2-xCaxMo1.7W0.3O9-d (0rxr0.2). Chin. J. Inorg. Chem.1, 81–85 (2007).
18. Hayward, S. & Redfern, A. S. A. T Thermodynamic nature of and spontaneousstrain below the cubic-monoclinic phase transition in La2Mo2O9. J. Phys.Condens. Matter 16, 3571–3583 (2004).
19. Jin, T. Y., Rao, M. V. M., Cheng, C. L., Tsai, D. S. & Hung, M. H. Structuralstability and ion conductivity of the Dy and W substituted La2Mo2O9. SolidState Ionics 178, 367–374 (2007).
20. Marrero-Lopez, D. et al. Synthesis and transport properties in La2� xAxMo2O9� d
(A¼Ca2þ , Sr2þ , Ba2þ , Kþ ) series. Electrochim. Acta 52, 5219–5231 (2007).21. Corbel, G., Chevereau, E., Kodjikian, S. & Lacorre, P. Topological metastability
and oxide ionic conduction in La2-xEuxMo2O9. Inorg. Chem. 46, 6395–6404(2007).
22. Castro, R. H. R. On the thermodynamic stability of nanocrystalline ceramics.Mater. Lett. 96, 45–56 (2013).
23. Navrotsky, A., Ma, C., Lilova, K. & Birkner, N. Nanophase transition metaloxides show large thermodynamically driven shifts in oxidation-reductionequilibria. Science 330, 199–201 (2010).
24. Saito, T., Tatsumisago, M. & Minami, T. Phase transformation and lattice strainof Alpha-Agl stabilized in superionic glass. J. Electrochem. Soc. 143, 687–691(1996).
25. Brightwell, J. W., Buckley, C. N., Miller, L. S. & Ray, B. Electrical transportand phase stability in silver iodide—cadmium iodide. Phys. Stat. Soli. (a) 76,391–398 (1983).
26. Makiura, R. et al. Size-controlled stabilization of the superionic phase to roomtemperature in polymer-coated AgI nanoparticles. Nat. Mater. 8, 476–480(2009).
27. Chen, L. et al. Electrical properties of a highly oriented, textured thin film of theionic conductor Gd: CeO2-d on (001) MgO. Appl. Phys. Lett. 83, 4737–4739(2003).
28. Luo, J. & Chiang, Y. M. Wetting and prewetting on ceramic surfaces. Annu.Rev. Mater. Res. 38, 227–249 (2008).
29. Huang, J. & Luo, J. A facile and generic method to improve cathodematerials for lithium-ion batteries via utilizing nanoscale surface amorphousfilms of self-regulating thickness. Phys. Chem. Chem. Phys. 16, 7786–7798(2014).
30. Kang, B. & Ceder, G. Battery materials for ultrafast charging and discharging.Nature 458, 190–193 (2009).
31. Kayyar, A., Qian, H. J. & Luo, J. Surface adsorption and disordering in LiFePO4
based battery cathodes. Appl. Phys. Lett. 95, 221905 (2009).32. Defay, R. & Prigogine, I. Tension Superficielle Et Adsorption (Desoer Liege,
1951).33. Cantwell, P. R. et al. Grain boundary complexions. Acta Mater. 62, 1–48
(2014).34. Harley, G., Yu, R. & De Jonghe, L. C. Proton transport paths in lanthanum
phosphate electrolytes. Solid State Ionics 178, 769–773 (2007).35. Kaplan, W. D. & Kauffmann, Y. Structural order in liquids induced by
interfaces with crystals. Annu. Rev. Mater. Res. 36, 1–48 (2006).
NATURE COMMUNICATIONS | DOI: 10.1038/ncomms9354 ARTICLE
NATURE COMMUNICATIONS | 6:8354 | DOI: 10.1038/ncomms9354 | www.nature.com/naturecommunications 7
& 2015 Macmillan Publishers Limited. All rights reserved.
36. Shibata, N. et al. Observation of rare-earth segregation in silicon nitrideceramics at subnanometre dimensions. Nature 428, 730–733 (2004).
37. Schirmeisen, A. et al. Fast interfacial ionic conduction in nanostructured glassceramics. Phys. Rev. Lett. 98, 225901 (2007).
38. Li, C., Gu, L. & Maier, J. Enhancement of the Li conductivity in LiFby introducing glass/crystal interfaces. Adv. Funct. Mater. 22, 1145–1149(2012).
39. Luo, J. Interfacial engineering of solid electrolytes. J. Materiomics 1, 22–32(2015).
40. Maier, J. Nano-ionics: more than just a fashionable slogan. J. Electroceramics13, 593–598 (2004).
41. Sata, N., Eberman, K., Eberl, K. & Maier, J. Mesoscopic fast ionconduction in nanometre-scale planar heterostructures. Nature 408, 946–949(2000).
42. Maier, J. Nanoionics: Ion transport and electrochemical storage in confinedsystems. Nat. Mater. 4, 805–815 (2005).
43. Guo, X. X. & Maier, J. Ionically conducting two-dimensional heterostructures.Adv. Mater. 21, 2619–2631 (2009).
44. Ramanathan, S. Interface-mediated ultrafast carrier conduction in oxidethin films and superlattices for energy. J. Vac. Sci. Tech. A 27, 1126–1134(2009).
45. Thompson, T. et al. A tale of two sites: On defining the carrier concentration ingarnet-based ionic conductors for advanced Li batteries. Adv. Energy Mater. 5,1500096 (2015).
46. Yu, H. H. & Suo, Z. Stress-dependent surface reactions and implication for astress measurement technique. J. Appl. Phys. 87, 1211–1218 (2000).
47. Hebb, M. H. Electrical conductivity of silver sulfide. J. Chem. Phys. 20, 185–190(1952).
48. Wagner, C. Galvanische zellen mit festen elektrolyten gemischter stromleitung.Z. Elektrochem. 60, 4–8 (1956).
49. Kobayashi, K. et al. Electronic transport properties and electronic structure ofTiO2-doped YSZ. Solid State Ionics 135, 643–651 (2000).
AcknowledgementsWe acknowledge financial support from TOYOTA MOTOR Corp. J.L. acknowledgespartial supports from US NSF (grant nos. DMR-1320615 for 2010-15 and CMMI-1436976 for 2014-17) and an NSSEFF fellowship (ONR grant no. N00014-15-1-0030).We thank T. Carney for useful comments and language editing.
Author contributionsW.L. conceived the idea, performed the experiment, analysed the data and wrote themanuscript. W.P. guided and supervised the experiments and analysis. J.L. analysed thedata and proposed the SAF based model. J.L., A.G. and H.W. contributed to writing andediting the manuscript. G.O. and W.Z performed some experiments. All authors dis-cussed the results and commented on the paper.
Additional informationSupplementary Information accompanies this paper at http://www.nature.com/naturecommunications
Competing financial interests: The authors declare no competing financial interests.
Reprints and permission information is available online at http://npg.nature.com/reprintsandpermissions/
How to cite this article: Liu, W. et al. Suppressed phase transition and giant ionicconductivity in La2Mo2O9 nanowires. Nat. Commun. 6:8354 doi: 10.1038/ncomms9354(2015).
This work is licensed under a Creative Commons Attribution 4.0International License. The images or other third party material in this
article are included in the article’s Creative Commons license, unless indicated otherwisein the credit line; if the material is not included under the Creative Commons license,users will need to obtain permission from the license holder to reproduce the material.To view a copy of this license, visit http://creativecommons.org/licenses/by/4.0/
ARTICLE NATURE COMMUNICATIONS | DOI: 10.1038/ncomms9354
8 NATURE COMMUNICATIONS | 6:8354 | DOI: 10.1038/ncomms9354 | www.nature.com/naturecommunications
& 2015 Macmillan Publishers Limited. All rights reserved.