Embed Size (px)
Citation preview

1
Bowers & Krumm (2021)
Supporting the Initial Work of Evidence-Based Improvement Cycles Through a Data-Intensive Partnership 1,2,3
Alex J. Bowers Teachers College, Columbia University
Andrew E. Krumm University of Michigan
ABSTRACT:123 Purpose: Currently in the education data use literature there is a
lack of research and examples that consider the early steps of
filtering, organizing, and visualizing data to inform decision
making. The purpose of this study is to describe how school
leaders and researchers visualized and jointly made sense of data
from a common learning management system (LMS) used by
students across multiple schools and grades in a charter
management organization operating in the United States. To
make sense of LMS data, researchers and practitioners formed a
partnership to organize complex data sets, create data
visualizations, and engage in joint sensemaking around data
visualizations to begin to launch continuous improvement
cycles.
Design: We analyzed LMS data for n=476 students in Algebra I
using hierarchical cluster analysis heatmaps. We also engaged in
a qualitative case study that examined the ways in which school
leaders made sense of the data visualization to inform
improvement efforts.
Findings: The outcome of this study is a framework for
informing evidence-based improvement cycles using large,
complex datasets. Central to moving through the various steps in
the proposed framework are collaborations between researchers
and practitioners who each bring expertise that is necessary for
organizing, filtering, and visualizing data from digital learning
environments and administrative data systems.
Originality: We propose an integrated cycle of data use in
schools that builds on collaborations between researchers and
school leaders to inform evidence-based improvement cycles.
1 This document is a preprint of this manuscript published in the journal
Information and Learning Sciences. Citation:
Bowers, A.J., Krumm, A.E. (2021) Supporting Evidence-Based
Improvement Cycles Through a Data-Intensive Partnership. Information
and Learning Sciences, 122(9/10) 629-650. https://doi.org/10.1108/ILS-
09-2020-0212 2 This material is based upon work supported by the National Science
Foundation under Grant No. DRL-1444621; SMA-1338487. Any
opinions, findings, and conclusions or recommendations expressed in
this material are those of the authors and do not necessarily reflect the
views of the National Science Foundation. 3 Acknowledgements: We thank Mingyu Feng and Timothy Podkul for
their discussions of the early stages of this study, and their work with
the schools and leadership throughout the partnership detailed in the
study.
Keywords:
Data Analysis, Data Interpretation, Data Use, Data Driven
Decision Making, Evidence Based Improvement Cycles,
Researcher Practitioner Partnerships, Data Science, School
Leadership, Algebra I, Cluster Analysis, Case Study, Visual
Data Analytics, Heatmaps
INTRODUCTION:
It was a totally different way of visualizing data that I
think we haven’t seen before… It was just a really,
really interesting way to think about data. Because we
think about it in simpler terms here and so it's nice to
see the larger possibilities with what we can do with the
data that we have. -Participant CMO education leader
Strategies for turning newly expanding volumes of data into a
resource for school and instructional improvement is an
important area of research and practice (Agasisti & Bowers,
2017; Bowers, Bang, Pan, & Graves, 2019; Farley-Ripple,
Jennings, & Jennings, 2021; Krumm, Means, & Bienkowski,
2018; Mandinach, Friedman, & Gummer, 2015; Schildkamp,
Poortman, Luyten, & Ebbeler, 2017). This broad topic spans
multiple areas of education research including data-driven
decision making, education policy studies, and educational data
science. Educational data science is an emerging term that
encompasses the fields of learning analytics, educational data
mining, artificial intelligence in education, and education
leadership data analytics (Agasisti & Bowers, 2017; Bowers et
al., 2019; Piety, 2019; Piety, Hickey, & Bishop, 2014). Using
data for school and instructional improvement is a complex
process that has been studied and intervened on in a variety of
ways with varying degrees of success (Coburn & Turner, 2011;
Halverson, 2010; Harris Little, Cohen-Vogel, Sadler, & Merrill,
2019; Mandinach & Schildkamp, 2021). In this paper, we report
on a case study of the first steps of a partnership-based approach
that sought to put educational data scientists closer to the work
of practitioners and practitioners closer to the work of data
scientists (Penuel & Gallagher, 2017), with a particular focus on
the first two steps of the work of data use in schools of
organizing, filtering, analyzing, and visualizing.

2
Bowers & Krumm (2021)
Both federal and state policies have motivated teachers and
administrators to engage in data-driven improvement cycles
(Cho & Wayman, 2015; Farley-Ripple et al., 2021; Mandinach
& Schildkamp, 2021; Schildkamp, 2019; Wachen, Harrison, &
Cohen-Vogel, 2018). To date, important parts of this literature
have been practitioner-focused (Bowers, 2017; Coburn &
Turner, 2012), addressing issues like using student-level data as
a context to build trusting and collaborative relationships
between teachers in schools as they develop capacity for
continuous improvement (Bambrick-Santoyo, 2010; Boudett,
City, & Murnane, 2013; Bryk, Gomez, & Grunow, 2010;
Cosner, 2014; Datnow, Choi, Park, & St. John, 2018; Farley-
Ripple & Buttram, 2015; Lasater, Albiladi, Davis, & Bengtson,
2020; Riehl, Earle, Nagarajan, Schwitzman, & Vernikoff, 2018;
Supovitz & Morrison, 2015; Wayman & Stringfield, 2006).
As new types of data have become available and accessible,
there is an open question as to whether traditional data analysis
tools and workflows are up to the challenge of making sense of,
for example, students’ activity within multiple digital learning
environments (Agasisti & Bowers, 2017; Bowers, 2021; Farley-
Ripple et al., 2021; Krumm et al., 2018; Piety, 2019). Building
on the growing scholarship around research-practice
partnerships in schools (Penuel et al., 2020), the partnership
described in this paper between researchers and a charter
management organization (CMO) operating in the Western
United States set out to wrangle, explore, and model thousands
of observations across hundreds of students to answer teachers’
and leaders’ questions related to students’ use of a common
learning management system (LMS). Through intentional cycles
of design and reflection, the partnership also sought to
understand the ways in which researchers and practitioners can
collaborate around gathering, analyzing, and interpreting data
from multiple digital learning environments and administrative
data systems.
This paper is organized as follows. First, we present a theory of
action that the partnership developed and used to organize
partnership activities as well as to identify potential
contributions to research on data driven decision making,
educational data science, and data use practices. Thus, this
theory of action represents an analysis of data use research that
helped in crafting design conjectures used to orient the
partnership’s work (e.g.,) (Cobb & Jackson, 2012). As one study
from the larger partnership, this paper describes the initial
improvement cycle undertaken around data that captured
students’ assessment taking behaviors that were collected by the
CMO’s LMS. While the overall project was organized as a
design research effort that included iterative, theory-driven
cycles, this paper is structured as a case study of two early
partnership meetings that were organized around a handful of
data visualizations. After presenting the partnership’s theory of
action, we describe the data visualization that anchored the
meetings around which researchers and practitioners engaged in
joint sensemaking. Based on the dynamics of these meetings and
the roles of the data product and researchers, we reflect on the
potential for more partnership-based data-intensive projects to
help school leaders overcome the challenges of working with
new and novel data sources.
A THEORY OF ACTION FOR DATA USE IN
SCHOOLS
To develop the partnership’s “data use theory of action,” we
built on existing research (Coburn & Turner, 2012; Ikemoto &
Marsh, 2007; Lai & Schildkamp, 2013; Mandinach, Honey, &
Light, 2006; Mandinach, Honey, Light, & Brunner, 2008;
Marsh, 2012; Schildkamp & Kuiper, 2010; Schildkamp &
Poortman, 2015; Schildkamp, Poortman, & Handelzalts, 2016;
Tichnor-Wagner, Wachen, Cannata, & Cohen-Vogel, 2017) and
adapted a figure from Marsh (2012, p.4). In Figure 1, the
continuous improvement process starts with 1) data access and
collection, then proceeds through 2) organization, filtering and
analysis moving then to 3) knowledge generation through the
work of teachers and administrators coming together around the
evidence in which that knowledge is then 4) applied through
action informed by the data with a subsequent impact on
outcomes. The cycle then completes as 5) outcomes are assessed
for effectiveness and then feed back into the data. At each stage
in the process, information flows through feedback loops to
inform decisions, creating a continuous cycle.
Important aspects of the research in the data use literature have
focused on building trusting evidence-based environments
(Cosner, 2014; Huguet, Marsh, & Farrell, 2014; Marsh,
Bertrand, & Huguet, 2015; Riehl et al., 2018; Schildkamp &
Poortman, 2015; Schildkamp et al., 2016). The vast majority of
this literature is focused on cultivating teachers’ and
administrators’ ability to have high evidence, low inference
conversations (Bowers, Shoho, & Barnett, 2014; Schildkamp &
Poortman, 2015). This research focuses specifically on steps 3, 4
and 5 in the theory of action (see Figure 1) (Datnow et al., 2018;
Jimerson, Garry, Poortman, & Schildkamp, in press; Supovitz &
Morrison, 2015) and is consonant with much of the current
normative practitioner training literature around data use, such as
Harvard University’s DataWise (Boudett et al., 2013) and
Bambrick-Santoyo’s Driven by Data (Bambrick-Santoyo, 2010).
To a lesser extent, some of the practitioner training literature has
also focused on what data to examine (Bowers, 2009, 2017;
Bowers et al., 2019), i.e., step 1 in the data use theory of action.
For example, this training literature includes Popham’s focus on
the essentials of assessment for leading evidence-based practice
in schools (Popham, 2010) and Bernhardt’s strategies for
working with data beyond test scores (Bernhardt, 2013). Indeed,
recent research has shown that teachers more often focus on
formative assessments as opposed to standardized test scores
(Wilkerson, Klute, Peery, & Liu, 2021). Across these examples
of building trust, supporting low inference/high evidence
collaborative conversations, and selecting data, the work of
organizing, filtering, and analyzing data, i.e., step 2, is only
recently starting to gain attention.

3
Bowers & Krumm (2021)
INFORMATION KNOWLEDGE
Feedback
1 Access
Collect
2
Organize
Filter
Analyze
3
Combine with
understanding &
expertise
4
Apply
5Assess
effectiveness
Response &
Action
OUTCOMESDATA
Figure 1: Data use theory of action for teachers, students, school administrators and central office staff -
adapted from: Coburn & Turner (2012); Ikemoto & Marsh (2007); Lai & Schildkamp (2013); Mandinach,
Honey, & Light (2006); Mandinach, Honey, Light, & Brunner (2008); Marsh (2012); Schildkamp & Kuiper
(2010); Schildkamp & Poortman (2015); Schildkamp, Poortman, & Handelzalts (2016).
A Focus on Step Two of the Data Use Theory of Action
While some attention has been paid to organizing, filtering, and
analyzing traditional student assessment data in the recent
literature (Agasisti & Bowers, 2017; Farley-Ripple et al., 2021),
evidence suggests that schools do not have adequate capability
to locate, combine, and analyze data from digital learning
environments and learning management systems (LMS) (Clow,
2014; Hao, Smith, Mislevy, von Davier, & Bauer, 2016). The
often messy work of bringing together multiple datasets as well
as aligning student and teacher identifiers across longitudinal
data files – known in the data science and data warehouse fields
as Extract, Transform, Load (ETL) (Mukherjee & Kar, 2017;
Vassiliadis, 2009) – is being addressed by a growing number of
researchers under the banner of learning analytics and
educational data mining (i.e., data-intensive research).
Researchers in these fields, for example, focus on developing
data workflows and data pipelines that combine, analyze, and
translate analyses into data products like predictive models and
dashboards (Agasisti & Bowers, 2017; Bienkowski, Feng, &
Means, 2012; Bowers, 2021; Fischer et al., 2020; Ifenthaler,
2021; Koedinger, D'Mello, McLaughlin, Pardos, & Rosé, 2015;
Krumm et al., 2018).
It is reasonable to question, however, whether or not data from
digital learning environments can be valuable to practitioners
outside of the dashboards and visualizations provided by the
environments themselves (DiCerbo & Kobrin, 2016; Farley-
Ripple et al., 2021). Researchers and technology developers
have demonstrated the potential value of these data through
products like early warning systems for course success and high
school dropout prevention (Bowers, 2021; Ifenthaler, 2021).
Using these data, researchers have also demonstrated how to
effectively operationalize learning behaviors and strategies as
well as how to intervene on them in order to improve
downstream learning outcomes (R. S. J. d. Baker et al., 2006;
Walonoski & Heffernan, 2006). Furthermore, the idea of
unobtrusive measurement and assessment has opened up the
possibility of monitoring and supporting learners around
behaviors like wheel spinning (Beck & Gong, 2013), productive
persistence (Krumm et al., 2016), perseverance (DiCerbo, 2014),
gaming the system (R. S. Baker, Corbett, Koedinger, & Wagner,
2004), and help seeking (Aleven, Roll, McLaren, & Koedinger,
2016). While many of these behaviors are possible to identify in
the data, they require interested potential users and the data to
support educators’ decision making.

4
Bowers & Krumm (2021)
In contrast to this generally positive stance of the learning
analytics literature, the evidence from recent data use practices
research is less positive. Recent examples include low
engagement by educators in popular data systems such as
NWEA MAP (Farley-Ripple et al., 2021), few if any significant
relationships between teacher instructional clicks in a data
dashboard and student outcomes in a large US school district
(Wayman, Shaw, & Cho, 2017), and a tendency to reify
problematic inferences about student knowledge and learning
when observing teacher data team meetings to discuss individual
student assessment answer data (Garner, Thorne, & Horn, 2017).
An issue rarely noted throughout the literature on school data
use was recently highlighted by Selwyn et al. (in press) in that
more often than not “data analytics” takes the form of having the
“data person” in the school work in spreadsheets to create
“simple frequency counts, colour-coding and modest cross-
tabulations" (p.13). Moreover, technological tools that were
intended to support more inspired data analyses were, according
to Selwyn and colleagues:
…largely inadequate and unhelpful forms of digital
technology that were failing to ‘support’ the generation
and use of data within the school... One key point was
the limited capacity of schools’ data systems to collate,
store and share data with staff... Above all, was an over-
riding sense that people working within these schools
(in contrast to any imagined possibilities) retained
relatively limited ambitions for their actual use of
data… Tellingly, any broader insights from these
analyses were yet to translate into follow-up action
within the school (p.14) (Selwyn, Pangrazio, & Cumbo,
2021)
These authors conclude in this study that the advocacy for data
use in schools “…needs to be set against the observation that
schools do not appear to be particularly motivated to respond to
(or even look for) novel insights and unexpected patterns and
correlations in their data. In short, school data is not a place for
surprises, counterintuition and ‘outside-the-box’ thinking” (p.15)
(Selwyn et al., 2021). Thus, for these reasons, in the present
study we focus exclusively on the second step of the data use
cycle of organize, filter and analyze (Figure 1), as an under-
researched area in which we aim to describe the case of bringing
together the domains of data visualization and education data
science in application to a data use cycle to potentially cultivate
school capacity to identify novel insights, unexpected patterns,
and correlations in the data that can create surprise, and new
ways for educators to see their own data from their school to
make decisions.
While multiple researchers have helped to inform the process of
implementing evidence-based improvement cycles in schools
(Mandinach et al., 2006; Marsh, 2012; Schildkamp & Ehren,
2013; Schildkamp et al., 2016; Tichnor-Wagner et al., 2017), the
difficult work of turning data into actionable information is thus
underdeveloped around data stemming from digital learning
environments and large scale administrative data systems. This
underdeveloped line of inquiry throws into relief the multiple
capabilities needed to accomplish the goal of school and system
improvement—from accessing and joining data to visualizing
and interpreting data products (Bowers et al., 2019). The
importance of finding ways to work with and learn from data
stemming from digital platforms is only increasing due to the
expanded use of digital technologies in classrooms and central
offices (Bowers, 2021; Graves & Bowers, 2018; Krumm &
Bowers, in press; Piety, 2019).
Engaging in a Research-Practice Partnership for Data Use
The current capability gaps that can exist around working with
data from digital technologies can be addressed in multiple
ways, from engaging in the normative practitioner literature to
schools contracting with outside service providers and technical
support. In what follows, we describe a case study of the first
steps of a partnership-based approach where we as researchers
set out to explore the ways in which a formal research-practice
partnership could address the needs of practitioners in schools
around working with large, complex datasets (Coburn & Penuel,
2016; Penuel, Allen, Coburn, & Farrell, 2015; Penuel et al.,
2020), with the specific focus here on the case of focusing on the
often unexamined step of filtering, organizing, and visualizing
the data to make it accessible for decision making by school
leaders. Coburn, Penuel, and Giel (2013) define research-
practice partnerships (RPPs) as “long-term collaborations, which
are organized to investigate problems of practice and generate
solutions for improving district outcomes” (p. 1). Under this
general definition, these authors identified five common
characteristics across the partnerships they studied: “(1) long-
term; (2) focused on problems of practice; (3) committed to
mutualism; (4) use intentional strategies to foster partnerships;
and (5) produce original analyses” (p. 2) (Coburn, Penuel, &
Geil, 2013). For the partnership described in the present study,
we initially framed these five characteristics as inputs into what
makes a typical project a partnership. Using these characteristics
as proximal goals, along with building on the work of others
(Bryk et al., 2010; Cohen-Vogel et al., 2015), we viewed this
partnership not only as an opportunity to support practitioners
gaining novel insights on their learners using previously
unexplored data, but we also saw it as an opportunity to begin
providing case-based examples of what it means to engage in
collaborative data-intensive improvement and education
leadership data analytics for the growing field of educational
data science.
Partnership context
At the start of the partnership, we analyzed data from 5 high
schools in the CMO, with total enrollment of approximately
1,500 students. Students in grades 9-12 were 12% Asian, 3%
Black, 55% Hispanic, 23% White, and 5% Multiracial and 43%
of students qualified for free or reduced priced lunch. The
purpose of the partnership was twofold: (1) support the CMO’s

5
Bowers & Krumm (2021)
use of data from multiple digital platforms as a resource for
improvement and (2) use theory and prior research to develop
partnership activities in order to learn about collaborative data-
intensive improvement and education leadership data analytics.
To meet these twofold aims, we used a design-based research
approach (Cobb, Confrey, diSessa, Lehrer, & Schauble, 2003)
to, as Dede (2004) notes, “introduce evocative, theory-
influenced designs, then draw out implications for new
theoretical ontologies of phenomena” (p.111) (Dede, 2004), to
develop what Coburn and Turner (2011) refer to as “data use
interventions.” As outlined in relation to our theory of action, we
set out to intervene on step 2 of Figure 1—organize, filter, and
analyze data originating from a common LMS—and produce
data products that were intended to support educational leaders’
understanding of students’ actions in the LMS in order to
identify opportunities to improve. Our analyses centered on 9-
10th grade students across multiple subject areas. The CMO was
in the process of developing an instructional model that
privileged not only how well students did on specific
assessments but what they did in terms of strategies and
behaviors, such as how students used the assessment system, for
example the number of times a student may opt to retake
summative assessments within the LMS. An organizing idea for
the partnership, therefore, centered on researchers wrangling
data, developing data visualizations, and jointly interpreting data
products with practitioners. CMO leaders expressed particular
interest in Algebra I around which we analyzed data for n=476
students. In what follows we briefly describe our analytical
approach for the central data product used early on in the
partnership and then describe our approach for analyzing
educational leaders’ reactions to the data products using a
qualitative case study design.
Data Product Development
An early meeting in the partnership highlighted the importance
of students’ assessment taking within the LMS. Courses in the
CMO were structured around self-directed learning where
students accessed digital resources and completed assessments
all within a common LMS. Given the freedom and choice
offered to students, a core interest of the CMO was students’
assessment taking patterns in Algebra I (e.g., When do students
take them? In what order do students take them? How successful
are students?). Thus, the CMO’s instructional model created the
potential for high degrees of variation in what students did as
they worked to complete assessments in the LMS. To model this
variation, we used agglomerative hierarchical cluster analysis
(HCA) techniques combined with a heatmap visualization. This
approach had multiple benefits. As a technique, which we
describe in more detail below, it does little summarization of
data; instead the algorithm and chosen visualization approach
groups, or clusters, observations (i.e., students) based on the
available data for a student. For this first analysis, and based on
joint problem and priority definitions between members of the
partnership, we set out to understand students’ assessment taking
patterns within the LMS. In particular, we focused on 9th grade
data across the CMO, including data from n=476 students in
Algebra I. We focus on the number of attempts per student
across nine sub-sections within Algebra I. Assessment taking
was a key open question to CMO leaders because of the self-
directed nature of math instruction and how this goal was
translated into policies where students could take assessments as
many times as they like until they pass the exam. To best
understand the HCA patterns, we also included students’ final
grade in Algebra I for each student.
HCA heatmaps are an emerging method in education data
science (Bowers, 2021) for visualizing individual student data
patterns, clustered and visualized in such a way that each
student’s information is retained (to avoid averaging all students
to a single number or best fit line), yet providing the ability to
compare similar student data patterns and outcomes together
(Bowers, Zhao, & Ho, in submission). For a review of cluster
analysis methods in education see (Alfredo, Félix, & Àngela,
2010; Bowers, 2007, 2010). Here we draw on the literature on
visual data analytics in education (Bienkowski et al., 2012;
Johnson, Levine, Smith, & Stone, 2010) to inform step 2 of the
data use cycle of filter, organize, analyze, and now here visualize
using visual data analysis, which along with education data
mining and learning analytics “have the potential to make visible
data that have heretofore gone unseen, unnoticed, and therefore
unactionable” (p.ix) (Bienkowski et al., 2012). Visual data
analysis “blends… computational methods with sophisticated
graphics engines to tap the ability of humans to see patterns and
structure in complex visual presentations (Johnson et al., 2010).
Visual data analysis is designed to help expose patterns, trends,
and exceptions in very large heterogeneous and dynamic
datasets collected from complex systems” (p.15) (Bienkowski et
al., 2012), which we draw on here as a means to organize, filter,
analyze, and visualize the data in an effort to help educators
identify “novel insights and unexpected patterns and correlations
in their data” (p.15) (Selwyn et al., 2021).
As a form of visual data analysis (Johnson et al., 2010; Keim,
Mansmann, Schneidewind, & Ziegler, 2006), HCA heatmaps are
a form of data mining and descriptive analysis in which similar
data patterns of students (rows) are matched together across
columns of data features (here assessment attempts) and placed
next to each other through hierarchical cluster pattern analysis
(Bowers, 2010; Gu, Eils, & Schlesner, 2016; Wilkinson &
Friendly, 2009). A “heatmap” was then generated to display the
data for each student row across all nine assessments, whereby
low or no attempts are represented by white, and ranging up
through grey to black which represents a high number of
attempts by a student for that summative assessment (as will be
discussed later on, missing data was meaningful). To improve
interpretability, we square root transformed the number of
assessment attempts per student for each summative assessment.
Similarity of clusters of student data are then represented with a
cluster tree, i.e., dendrogram, in which longer horizontal lines
indicates more dissimilar data patterns. Following
recommendations from the literature on cluster analysis in
education (Bowers, 2010; Bowers et al., in submission; Jorion et

6
Bowers & Krumm (2021)
al., 2020; Lee, Recker, Bowers, & Yuan, 2016), we used
Euclidean distance as the distance metric and average linkage as
the agglomeration method in the R statistical package, including
gplots and heatmap.2 (R Development Core Team, 2019;
Warnes et al., 2020).
METHODS:
This section describes the case study data and our analytical
approach for understanding two meetings where researchers and
practitioners came together to make sense of and make plans
based on the heatmap described above. Our analysis of
practitioners’ sensemaking is organized around two research
questions:
1) In what ways can an RPP support educational leaders’ use
of new and complex datasets to inform improvement
cycles?
2) How do educational leaders make sense of data products
that are built on complex LMS datasets meant to inform step
2 of the data use cycle?
These two questions address practitioners’ reaction to the
partnership and how the multidimensional nature of the
partnership (e.g., data wrangling, visualization, and joint
sensemaking) helped CMO leaders identify opportunities to
improve.
For this study we drew on qualitative case study design (Yin,
2017) informed by the design-based research literature. As noted
across this literature, design-based research is “(a) pragmatic
(i.e. design-oriented and intervention-oriented); (b) grounded in
theory and research; (c) interactive, iterative and flexible; (d)
integrative; and (e) contextual" (p.37) (Reimann, 2011). As our
focus is on the interactive collaborative work around a specific
data visualization (the HCA heatmap), the focus of our data
collection was a case study examining the meeting discourse
across two meetings in which the data visualization was
discussed. As Goodwin (1994) notes:
The ability to build and interpret a material cognitive
artifact... is embedded within a web of socially
articulated discourse. Talk between coworkers, the lines
they are drawing, measurement tools, and the ability to
see relevant events... all mutually inform each other
within a single coherent activity. Simultaneously, the
practices clustered around the production, distribution,
and interpretation of such representations provide the
material and cognitive infrastructure that make... theory
possible. (p.626) (Goodwin, 1994).
Given this perspective, our data for the case study was limited to
the discourse across meetings that included CMO leaders and
researchers, focusing on the HCA heatmap as the artifact.
Meeting participants for the two meetings outlined in this study
included four researchers and two CMO leaders in the first
meeting and one leader in the second meeting. A previous
meeting where data were outlined and research questions
surfaced included seven CMO leaders, including the CEO, head
of academics, and technology/information leads. Follow-on
meetings included a consistent group of three CMO leaders and
expanded as needed to involve groups of teachers and members
of the CMO technology and information teams.
Each meeting was audio recorded and transcribed, then
combined with field notes that were collected by participating
researchers. Data analysis for the case study drew on the
research literature to guide our selection of an initial round of
deductive codes to focus on the second step of the data use
theory of action noted above, including organize, filter, analyze,
visualize, understanding, expertise, collaboration, and
information-to-knowledge generation, along with emergent
codes of connection, application, exploration, and surprise.
Each coded passage was discussed by the researchers, and we
combined this analysis with analytic memos written by the
researchers, examining similarities, differences, and patterns
across the data (Miles & Huberman, 1994).
ANALYSIS:
Figure 2 is the data product that was central to the two meetings
that we examine in depth, below. We draw attention to this
figure because, as we argue, it played a central role in generating
subsequent opportunities for improvement discussed in two
meetings. Moreover, Figure 2 is a concrete outcome of what we
mean by focusing on step 2—organize, filter, and analyze—from
the data use theory of action presented earlier. At the start of the
partnership, the CMO was in the early years of its efforts to
rethink and redesign teaching and learning across the CMO, and
integrating various technologies was central to their vision for
achieving quality instruction. The newness of the LMS and the
accompanying data meant that the partnership was a direct
infusion of support in making sense of newly available data.
Beyond providing technical assistance in wrangling LMS data,
we as researchers also facilitated meetings where members of
the partnership discussed research questions and priorities as
well as jointly interpreted data products with CMO leaders and
teachers. Later partnership activities included professional
development sessions, just-in-time data analyses, and continued
efforts to organize, filter, and analyze data from changing digital
learning environments. The routines that were established in the
development of Figure 2 were continually refined over of the life
of the partnership in line with our evolving Data Use Theory of
Action. For the analysis and meetings discussed in this paper,
researchers in the partnership used the general idea of "clustering
students based on assessment” to organize and filter data. Much
of the data that was available within the LMS was initially
ignored by the CMO, such as students’ accessing of learning
resources. The focus on assessment taking, general idea of
clustering, and the emphasis on Algebra I helped to shape the
joint sensemaking meetings.

7
Bowers & Krumm (2021)
Figure 2: Hierarchical Cluster Analysis Heatmap of Student Algebra I Sub-Section Summative Assessments and
Course Grades. The standardized number of summative assessment attempts for each student (rows) for each
course sub-section in 9th grade Algebra I (columns) is represented by a color block, ranging from white (zero
attempts) to black (many attempts). The similarity or dissimilarity of student assessment attempt pattern is
represented on the far left by the cluster tree, with shorter horizontal lines indicating more similar patterns,
while longer horizontal lines indicate dissimilarity. Final course grade with similar color coding, from darker
(lower grades) to lighter (higher grades) is represented between the heatmap and the cluster tree. Of note, the
majority of students clustered into the five top clusters, with different patterns of summative assessment
attempts associated with different grades. Four clusters are denoted by the numbered boxes on the right, with
clusters 1 and 2 representing moderate levels of summative assessment attempts and the highest grades while
cluster 3 represents high numbers of attempts with moderate to low grades, and cluster four represents the
cluster of lowest number of attempts (note the lighter pattern across the heatmap) with the lowest grades. Across
the assessments columns, students made the most attempts in Exponential Functions and Linear Functions
(darker columns) with the least attempts in Domain and Range, Quadratic Expression and Two Variable
Inequalities (lighter columns).

8
Bowers & Krumm (2021)
Hierarchical Cluster Analysis Heatmap of Student Algebra I
Summative Assessment Attempts
In Figure 2, the nine assessments that comprised Algebra I are
displayed as columns: 1) Domain and Range, 2) Quadratic
Expressions, 3) Two Variable Inequalities, 4) Exponential
Functions, 5) Linear Functions, 6) Representing Functions, 7)
Quadratic Functions, 8) Systems of Equations, and 9) Quadratic
Equations. Each row in the heatmap represents one of 476
students. The intersection of student and assessment is
represented by color coded cells where lighter colors denote few
attempts and darker colors denote more attempts per student and
assessment. The agglomerative hierarchical cluster analysis
algorithm ordered students, such that individual rows with
similar assessment-taking patterns are next to each other.
Similarity and dissimilarity of student patterns is represented by
a cluster tree, or dendrogram, in which longer horizontal lines
represent greater dissimilarity. Lastly, final course grade in
Algebra I for each student is represented by light (higher grade)
to dark (lower grade) for each row in the column between the
cluster tree and the summative assessment heatmap in Figure 2.
Clusters of interest are denoted by 1, 2, 3 or 4 on the far right of
the cluster analysis heatmap (Figure 2, right). Cluster 1 is
comprised of students who have a consistently high number of
assessment attempts across all Algebra I modules, and they
receive the high grades. Cluster 2 is very similar to Cluster 1
(note proximity in the row order of the two clusters, and
similarity denoted by the cluster tree). Cluster 2 differs from
Cluster 1 in that for Cluster 2, these students appear to have
similar patterns of assessment attempts across all of the modules
except the first “Domain and Range” module. For this module,
Cluster 2 students have a very low number of summative
assessment attempts. All of the Cluster 2 students received the
highest grade for the course. In contrast, Cluster 3 students have
a low number of attempts for the first three modules of Domain
and Range, Quadratic Expressions, and Two Variable
Inequalities, a very high number of attempts for Exponential
Functions and Linear Functions (darkest in the heatmap) and
somewhat higher number of attempts for the other modules.
Many of these students receive a low grade for the course. And
finally, Cluster 4 students have the lowest grades, and have the
least number of summative assessment attempts across all
modules (Figure 2: lighter cells in the heatmap left to right).
Thus, while for Domain and Range, Clusters 2 and 4 have
similar data patterns for the number of assessment attempts,
these patterns are very different from each other once all of the
rest of the data for Algebra I summative assessment attempts is
included across all modules. Of note, when examining the
pattern of data across the columns (Figure 2, columns), it is
evident that overall the least number of summative assessment
attempts are in the first three modules on the left of Figure 2
(lighter color on the heatmap), while the greatest number of
attempts overall are by far in Exponential Functions and Linear
Functions (darkest color on the heatmap).
Informing the Data Use Theory of Action – Data to Information
to Knowledge:
The development of Figure 2 represents a core way in which
researchers in the partnership supported CMO leaders. To create
it, researchers worked with data the CMO had not analyzed
before and developed a visualization that communicated patterns
across student behaviors and choices. Early in the year, we met
with the school leadership team to receive feedback on the
visualization in Figure 2 and provided them with an opportunity
to delve into the data and identify opportunities for
organizational and instructional improvement.
After providing an overview of the figure, the school leaders had
the following impressions. One of the network leaders noted
when asked what they see in the heatmap and if it makes sense:
“So first thoughts, it totally makes sense that some [students]
have more [attempts] than others”. He went on to note the
specifics in the heatmap in an exchange with the data analyst:
CMO Leader: So do we have a different number of
attempts... I’m really super intrigued by
there’s a lot of white. That means that
they’ve never took it… And then yes, I
guess I didn’t expect there to be any two
students who were exact. I think students
[in cluster 1] makes it like we’re pretty
darn close, if I look in the shadings, right?
Those are probably… kids who were
doing pretty well in the class overall, yes?
Analyst: Few attempts and high grades
CMO Leader: So I’m looking at like Systems of
Equations [on the heatmap in Figure 2].
Linear Functions have a much higher
number [of attempts] than Quadratics…if
the Quadratics is the hardest part of the
Algebra piece, you’re going to have less
people even taking it.
Throughout this quote, this CMO leader is able to use the
visualization to see the patterns and relationships in the data.
Within the context of a joint interpretation session, this
particular visualization allowed the leader to ask questions of
researchers in real-time. Furthermore, in this quote, the CMO
leader notes that he is “intrigued” and immediately sees that
because there is a lot of white in the figure versus darker cells,
there are interesting differences and patterns across students and
assessments in Algebra I. Later on in the meeting, the CMO
leader discusses an unexpected result from Figure 2:
What is fascinating to me on this is a couple of
thoughts: One general takeaway is not all assessments
are created equal, even though we treat them that way.
It is so clear, if you had your year broken into nine
chunks of time [like in Figure 2] that the two in the
middle need more time [Exponential Functions and
Linear Functions], like the tests are harder… So we

9
Bowers & Krumm (2021)
could smooth them out or figure out how to represent
that those weigh more. They should have more weight
on the way we think about helping a kid go through
this.
Through this quote, this CMO leader sees something
unexpected, and through the visualization of students’ data, the
row by column patterns show that two modules of the year-long
curriculum are much more difficult for students than other
modules, as evidenced by the higher rates of taking and retaking
of the assessment. This prompts the leader to wonder if either
more time or more score weighting should be applied to those
two specific modules of the curriculum – an idea that leads
directly from the visualization. This leader continues by stating
that:
[Second] the Linear Functions thing is much harder
and those are the ones we haven’t done. So that’s in
the design question [of Figure 2]….if we took out the
two hardest [columns in the heatmap], do we still have
groups [of kids by rows] kind of clustered the way
we’ve got, or would those clusters sort of smoosh
close? Because the things that I’m wondering about are
there literally key, specific points in an individual
course that are the differentiators, that are one test is
causing 25 kids to not pass it?
Note in this next quote, the leader then turns back to the analyst,
and generates ideas for restructuring the figure, to ask new
questions that are of interest to the school in an effort to find
solutions for specific students on specific curriculum modules
and assessments. The visualization helps the practitioner rework
the problem of practice, and turn the question back to the data
analysts. This move points to an important takeaway from the
partnership approach attempted in this project: joint data
interpretation meetings matter. By this, and in the language of
Coburn and Turner (2011), this meeting is an important point of
intervention. In this meeting with the support of analysts,
practitioners were helped in making sense of the visualization
and scaffolded toward principled takeaways. Importantly, for the
analysts, many of the subtleties in the data patterns could not
have been disentangled absent the practitioners.
The central concern of this study is the role of the partnership in
filtering, organizing and analyzing data. Given the unique
complexities of the data, both researchers and CMO leaders
were needed to make sense of the CMO’s LMS data. CMO
leaders provided direction on what questions to ask. Researchers
provided expertise on how to wrangle, analyze, and visualize
data using hierarchical cluster analysis with a heatmap
visualization. Leaders provided necessary context for ensuring
proper interpretation of students’ actions represented in the
visualization, and researchers provided necessary context for
interpreting the visualization itself. Importantly, participating
researchers did not draw conclusions from the visualization and
report these to the CMO leaders. Rather, the CMO leaders drew
their own inferences and conclusions and communicated these
back to the researchers in a way that promoted joint
sensemaking.
Informing the Data Use Theory of Action – Combining
Understanding with Expertise:
As noted throughout this study, our goal was to understand how
a partnership between researchers and practitioners could turn
new and novel data sources into information and knowledge. To
this end, detailing an entire sequence through the full data use
cycle in Figure 1 is outside the scope of the present study.
However, to provide an indication of where the CMO would go
next, at a subsequent follow-up meeting that was explicitly
structured to reflect on the process and utility of the presented
data product, one of the other CMO leaders reflected on the
previous discussion from above and noted that they had sent a
web-based version of the figure to other leaders in the CMO.
And so they were looking at it and I think they came
away at least with the Algebra piece that they kind of
confirmed for them what they were thinking of Linear
Functions and Quadratics. They've kind of been hearing
that that was an issue, so it's been good confirmation for
them.
As the leader observes, the data product had a confirmatory
function related to some assessments.
And so currently… our course level teams go through
and look through the different focus areas and
assessments and try to determine which ones are too
hard to too easy… This [the Figure 2 discussion] is I
think leaps and bounds beyond that in terms of looking
at over the course of this focus area [of Algebra I] what
are the patterns that we see. What are different focus
areas within each course that seem to be having the most
difficulty and what are the different things that we can
do to address that?.... Or is it at the same difficulty level
as other assessments?
I think that this [the Figure 2 discussion] just opened up
a huge frame of conversation for us to have with course
level teams and provide them data that I think they'll be
able to dig deep on and start to revise a lot of these
courses…Like when [the other leader] was talking about
let's remove Exponential Functions and Linear
Functions and see how the segments look differently
then, I think without fully having that explanation from
you guys in the first place we wouldn’t have come to
those types of realizations.
It was a totally different way of visualizing data that I
think we haven’t seen before… It was just a really, really
interesting way to think about data. Because we think
about it in simpler terms here and so it's nice to see the
larger possibilities with what we can do with the data
that we have.

10
Bowers & Krumm (2021)
Thus, this leader’s reflection on the discussion shows the utility
of both the researchers and the practitioners coming together to
collaboratively address the problems of practice in the
organization.
In reflecting on the data product, the leader noted that in addition
to the ways in which it supported efforts to reevaluate different
assessments, it also had an at the time unanticipated partnership-
building effect:
I think it was also illuminating for us to kind of see the
kind of analyses that you guys can do and just put a
little more understanding on our part on where we can
go with some of this data.
The success of this data product was seemingly an important
step in building trust within the partnership, such as
demonstrating competency and follow-through, similar to
building trust within schools (Bryk & Schneider, 2002). The
joint interpretation meeting was a trust building activity through
the ways in which having multiple researchers present helped in
setting up and interpreting the focal data product, as noted by
one of the school leaders at the second meeting:
I think we really appreciated the ramp up for this
visualization and I think the amount of time you guys
put into it was totally appropriate because just
understanding it allows us to dive into it a lot deeper
and also to think about what are other additions and
subtractions that we can make from it. Whereas if we
had a more cursory understanding I don’t think we
could have got it.
The work of the partnership takes shape across these quotes.
While as researchers we focused on a concrete problem of
helping the CMO organize, filter, analyze, and visualize new and
novel data, our efforts to understand the partnership itself,
through a reflexive analysis of meeting notes and transcripts,
helped in elaborating the ways in which the data product and the
meeting in which it was discussed—along with critical pre-work
activities of jointly surfacing research questions—all helped in
translating LMS data into a resource for improvement, namely
for rethinking and reevaluating assessments in Algebra I.
DISCUSSION:
The purpose of this paper was to describe the process of a
collaborative researcher-practitioner partnership focusing on step
2 of the data use theory of action of organize, filter, analyze, and
here visualize the data for educator decision making, supporting
leaders in the partnering CMO through wrangling and
visualizing large and complex datasets. Our findings are
potentially significant in three main ways. First, this study
provides a novel use of hierarchical cluster analysis heatmaps in
education for visualizing digital learning environment data,
through the use of visual data analytics in education research
(Bienkowski et al., 2012; Bowers et al., 2019; Bowers et al., in
submission; Johnson et al., 2010; Lee et al., 2016). Second, this
study is one of the first to dive deeply into step 2 of the data use
theory of action (Figure 1), in which all of the other steps have
received significant attention in the research. Third, our case
study provides an example that can inform future research
related to collaborative meetings that are intended to support
researchers and CMO leaders jointly identifying instructional
improvement opportunities using complex data from digital
learning environments. Generating the next steps to plan for
instructional improvement required the unique skills and
expertise of both researchers and practitioners. Thus, through
this study, we provide an example of applying educational data
science to addressing pressing problems of practice. Our hope is
that this study can help spur further research at the intersection
of researcher-practitioner partnerships and the application of
educational data science.
In describing how CMO leaders reacted to the focal data
product, our intent is not to make any claim that this type of data
analytic partnership “works” in the sense that it may cause
leader and teacher instructional improvement. Rather, through
describing the initial steps of working with school practitioners,
our goal is to provide examples of how researchers and
practitioners could work together to turn data into useful
information for knowledge generation. Given the recent sobering
research that has indicated that step 2 of the data use cycle may
be a problematic sticking point for many schools (Farley-Ripple
et al., 2021; Selwyn et al., 2021; Wayman et al., 2017), our
results highlight how data science workflows (Agasisti &
Bowers, 2017; Krumm et al., 2018) can be integrated into
current ongoing improvement cycles within a school or district
to help address the needs of practitioners. It is our contention
that collaborative educational data science (Agasisti & Bowers,
2017; Bowers, 2017; Bowers et al., 2019; Piety, 2019; Piety et
al., 2014) can and should be included within the logic model of
data use in schools.
The Application of Educational Data Science to the Data use
Theory of Action:
Our results provide evidence for the role of data science to
inform the data use theory of action. As noted in Schutt and
O’Neil (2013), a data scientist is someone who brings together
visualization and data sense, and communicates results to
stakeholders in ways that help specific audiences derive
actionable next steps. This work includes the traditional work of
collecting data, processing the data, cleaning the data, and then
using exploratory data analysis, but then also includes data
mining, pattern analysis, visualization, reporting the findings,
and building data products that then can inform decision making
(Schutt & O'Neil, 2013).

11
Bowers & Krumm (2021)
Raw Data
Collected
Data
ProcessedClean Data
Stakeholders
• Students
• Teachers
• Principals
• Schools
• District
Descriptive
Data
Summary
Statistical
Models
&
Machine
Learning
Algorithms
Build Data
Product
Visualizations
Report Data
Analysis
FindingsMarsh (2012) Data Use for Decision Making
Flow of Information and Analysis in Current Practice
Data Use
Data Analytics
Data
Use
Data
An
aly
tics
INFORMATION KNOWLEDGE
Feedback
1 Access
Collect
2
Organize
Filter
Analyze
3
Combine with
understanding &
expertise
4
Apply
5Assess
effectiveness
Response &
Action
OUTCOMESDATA
Figure 3: Combined Logic Model of Data Analytics for Decision Making in Schools. Adapted from Schutt &
O’Neil (2013) and Marsh (2012).
Drawing on our results, in Figure 3 we adapt the logic model of
data science from Schutt and O’Neil (2013) in combination with
the data use theory of action to propose a combined logic model
of how educational data science can support decision making in
schools. The logic model starts on the upper left of Figure 3 with
the school stakeholders of students, teachers, principals, schools,
and districts. Then proceeding to the right, schools collect raw
data, and process and clean that data (Figure 3, top). As noted in
the literature on data use in schools, teachers and principals are
encouraged to use descriptive data summaries (Figure 3, top
right) that feed back to the stakeholders (Farrell, 2014;
Schildkamp & Poortman, 2015; Schildkamp et al., 2016) and
inform the data use theory of action (Figure 3, bottom left). As
noted by the grey arrow at the top of Figure 3, descriptive data
summaries are intended to inform all five steps of the data use
theory of action from Figure 1. Thus, the top section of Figure 3
illustrates a non-trivial amount of work (Selwyn et al., in press)
that takes specific training in schools related to collecting raw
data, processing it, cleaning it, and then creating descriptive data
summaries (Bowers, 2017; Bowers et al., 2019; Bruno & Fox,
1973).
However, a currently unaddressed issue in much of the existing
literature is the role of data analytics. Yet, the use of data
analytics to help visualize and inform decision making in
organizations, such as the use of a visual data analytics HCA
heatmap used in this study, has been extensively discussed in the
data science literature (Donoho, 2015; Gandomi & Haider, 2015;
Schutt & O'Neil, 2013). Indeed, this work corresponds with the
longstanding work in the domain of Exploratory Data Analysis
(EDA) (Tukey, 1962, 1977) in which EDA practitioners work to
“address the broad question of "what is going on here?" [with]
an emphasis on graphic representations of data… [in which] the
goal of EDA is to discover patterns in data.” (p.132) (Behrens,
1997). Through data science practices, data analytics provides a
means to leverage the potential of current data systems in
schools through additional useful analyses while also translating
the findings into useful data products for teachers and
administrators (Agasisti & Bowers, 2017; Bowers, 2017, 2021;
Bowers et al., 2019; Dimitriadis, Martínez-Maldonado, & Wiley,
2021; Fischer et al., 2020; Krumm et al., 2018; Siemens, 2013),
which can then inform each step of the data use theory of action.
In Figure 3, we denote the dotted line between the domains of
Data Use and Data Analytics to draw the distinction in the data
science process from descriptive data summaries, such as those
described earlier in Selwyn et al. (2021), to data analytics which
includes statistical models, machine learning, visualizations,
reporting findings, and building data products (Figure 3, bottom
right). This information then flows back into informing both the
stakeholders directly and the data use theory of action (Figure 3,
12
Bowers & Krumm (2021)
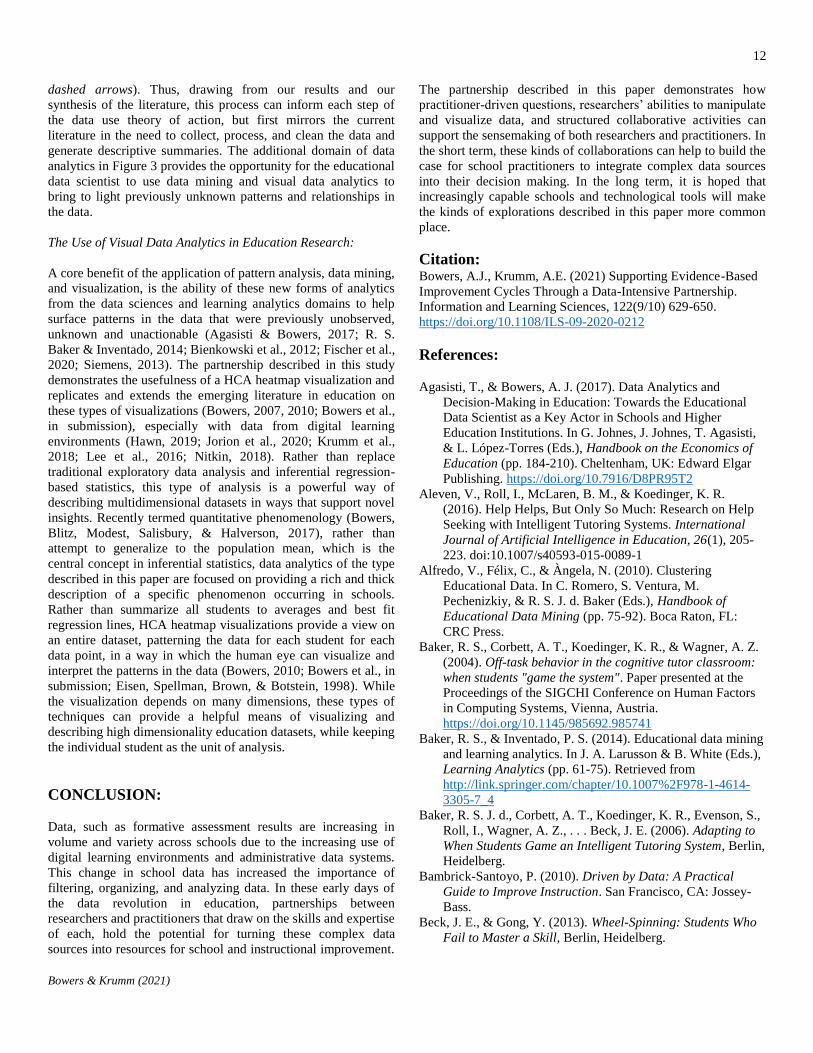
dashed arrows). Thus, drawing from our results and our
synthesis of the literature, this process can inform each step of
the data use theory of action, but first mirrors the current
literature in the need to collect, process, and clean the data and
generate descriptive summaries. The additional domain of data
analytics in Figure 3 provides the opportunity for the educational
data scientist to use data mining and visual data analytics to
bring to light previously unknown patterns and relationships in
the data.
The Use of Visual Data Analytics in Education Research:
A core benefit of the application of pattern analysis, data mining,
and visualization, is the ability of these new forms of analytics
from the data sciences and learning analytics domains to help
surface patterns in the data that were previously unobserved,
unknown and unactionable (Agasisti & Bowers, 2017; R. S.
Baker & Inventado, 2014; Bienkowski et al., 2012; Fischer et al.,
2020; Siemens, 2013). The partnership described in this study
demonstrates the usefulness of a HCA heatmap visualization and
replicates and extends the emerging literature in education on
these types of visualizations (Bowers, 2007, 2010; Bowers et al.,
in submission), especially with data from digital learning
environments (Hawn, 2019; Jorion et al., 2020; Krumm et al.,
2018; Lee et al., 2016; Nitkin, 2018). Rather than replace
traditional exploratory data analysis and inferential regression-
based statistics, this type of analysis is a powerful way of
describing multidimensional datasets in ways that support novel
insights. Recently termed quantitative phenomenology (Bowers,
Blitz, Modest, Salisbury, & Halverson, 2017), rather than
attempt to generalize to the population mean, which is the
central concept in inferential statistics, data analytics of the type
described in this paper are focused on providing a rich and thick
description of a specific phenomenon occurring in schools.
Rather than summarize all students to averages and best fit
regression lines, HCA heatmap visualizations provide a view on
an entire dataset, patterning the data for each student for each
data point, in a way in which the human eye can visualize and
interpret the patterns in the data (Bowers, 2010; Bowers et al., in
submission; Eisen, Spellman, Brown, & Botstein, 1998). While
the visualization depends on many dimensions, these types of
techniques can provide a helpful means of visualizing and
describing high dimensionality education datasets, while keeping
the individual student as the unit of analysis.
CONCLUSION:
Data, such as formative assessment results are increasing in
volume and variety across schools due to the increasing use of
digital learning environments and administrative data systems.
This change in school data has increased the importance of
filtering, organizing, and analyzing data. In these early days of
the data revolution in education, partnerships between
researchers and practitioners that draw on the skills and expertise
of each, hold the potential for turning these complex data
sources into resources for school and instructional improvement.
The partnership described in this paper demonstrates how
practitioner-driven questions, researchers’ abilities to manipulate
and visualize data, and structured collaborative activities can
support the sensemaking of both researchers and practitioners. In
the short term, these kinds of collaborations can help to build the
case for school practitioners to integrate complex data sources
into their decision making. In the long term, it is hoped that
increasingly capable schools and technological tools will make
the kinds of explorations described in this paper more common
place.
Citation: Bowers, A.J., Krumm, A.E. (2021) Supporting Evidence-Based
Improvement Cycles Through a Data-Intensive Partnership.
Information and Learning Sciences, 122(9/10) 629-650.
https://doi.org/10.1108/ILS-09-2020-0212
References:
Agasisti, T., & Bowers, A. J. (2017). Data Analytics and
Decision-Making in Education: Towards the Educational
Data Scientist as a Key Actor in Schools and Higher
Education Institutions. In G. Johnes, J. Johnes, T. Agasisti,
& L. López-Torres (Eds.), Handbook on the Economics of
Education (pp. 184-210). Cheltenham, UK: Edward Elgar
Publishing. https://doi.org/10.7916/D8PR95T2
Aleven, V., Roll, I., McLaren, B. M., & Koedinger, K. R.
(2016). Help Helps, But Only So Much: Research on Help
Seeking with Intelligent Tutoring Systems. International
Journal of Artificial Intelligence in Education, 26(1), 205-
223. doi:10.1007/s40593-015-0089-1
Alfredo, V., Félix, C., & Àngela, N. (2010). Clustering
Educational Data. In C. Romero, S. Ventura, M.
Pechenizkiy, & R. S. J. d. Baker (Eds.), Handbook of
Educational Data Mining (pp. 75-92). Boca Raton, FL:
CRC Press.
Baker, R. S., Corbett, A. T., Koedinger, K. R., & Wagner, A. Z.
(2004). Off-task behavior in the cognitive tutor classroom:
when students "game the system". Paper presented at the
Proceedings of the SIGCHI Conference on Human Factors
in Computing Systems, Vienna, Austria.
https://doi.org/10.1145/985692.985741
Baker, R. S., & Inventado, P. S. (2014). Educational data mining
and learning analytics. In J. A. Larusson & B. White (Eds.),
Learning Analytics (pp. 61-75). Retrieved from
http://link.springer.com/chapter/10.1007%2F978-1-4614-
3305-7_4
Baker, R. S. J. d., Corbett, A. T., Koedinger, K. R., Evenson, S.,
Roll, I., Wagner, A. Z., . . . Beck, J. E. (2006). Adapting to
When Students Game an Intelligent Tutoring System, Berlin,
Heidelberg.
Bambrick-Santoyo, P. (2010). Driven by Data: A Practical
Guide to Improve Instruction. San Francisco, CA: Jossey-
Bass.
Beck, J. E., & Gong, Y. (2013). Wheel-Spinning: Students Who
Fail to Master a Skill, Berlin, Heidelberg.

13
Bowers & Krumm (2021)
Behrens, J. T. (1997). Principles and procedures of exploratory
data analysis. Psychological Methods, 2(2), 131-160.
doi:10.1037/1082-989X.2.2.131
Bernhardt, V. (2013). Data analysis for continuous school
improvement (3 ed.). New York: Routledge.
Bienkowski, M., Feng, M., & Means, B. (2012). Enhancing
Teaching and Learning Through Educational Data Mining
and Learning Analytics: An Issue Brief. Retrieved from
Washington, DC:
http://www.ed.gov/edblogs/technology/files/2012/03/edm-
la-brief.pdf
Boudett, K. P., City, E. A., & Murnane, R. J. (2013). Data Wise:
Revised and Expanded Edition: A Step-by-Step Guide to
Using Assessment Results to Improve Teaching and
Learning. Revised and Expanded Edition. Cambridge, MA:
Harvard Education Press.
Bowers, A. J. (2007). Grades and data driven decision making:
Issues of variance and student patterns. (Ph.D.). Michigan
State University, East Lansing.
Bowers, A. J. (2009). Reconsidering grades as data for decision
making: More than just academic knowledge. Journal of
Educational Administration, 47(5), 609-629.
doi:10.1108/09578230910981080
Bowers, A. J. (2010). Analyzing the longitudinal K-12 grading
histories of entire cohorts of students: Grades, data driven
decision making, dropping out and hierarchical cluster
analysis. Practical Assessment Research and Evaluation,
15(7), 1-18. Retrieved from
http://pareonline.net/pdf/v15n7.pdf
Bowers, A. J. (2017). Quantitative Research Methods Training
in Education Leadership and Administration Preparation
Programs as Disciplined Inquiry for Building School
Improvement Capacity. Journal of Research on Leadership
Education, 12(1), 72 - 96. doi:10.1177/1942775116659462
Bowers, A.J. (2021) Early Warning Systems and Indicators of
Dropping Out of Upper Secondary School: The Emerging
Role of Digital Technologies. OECD Digital Education
Outlook 2021: Pushing the Frontiers with Artificial
Intelligence, Blockchain and Robots, Chapter 9, p.173-194.
OECD Publishing, Paris. https://doi.org/10.1787/589b283f-
en
Bowers, A. J., Bang, A., Pan, Y., & Graves, K. E. (2019).
Education Leadership Data Analytics (ELDA): A White
Paper Report on the 2018 ELDA Summit.
https://doi.org/10.7916/d8-31a0-pt97
Bowers, A. J., Blitz, M., Modest, M., Salisbury, J., & Halverson,
R. (2017). Is There a Typology of Teacher and Leader
Responders to CALL, and Do They Cluster in Different
Types of Schools? A Two-Level Latent Class Analysis of
CALL Survey Data. Teachers College Record, 119, 1-66.
Retrieved from
http://www.tcrecord.org/Content.asp?ContentId=21677
Bowers, A. J., Shoho, A. R., & Barnett, B. G. (2014).
Considering the Use of Data by School Leaders for Decision
Making. In A. J. Bowers, A. R. Shoho, & B. G. Barnett
(Eds.), Using Data in Schools to Inform Leadership and
Decision Making (pp. 1-16). Charlotte, NC: Information
Age Publishing. http://dx.doi.org/10.7916/D8862F32
Bowers, A. J., Zhao, Y., & Ho, E. (in submission). Towards
Hierarchical Cluster Analysis Heatmaps as Visual Data
Analysis of Entire Student Cohort Longitudinal
Trajectories.
Bruno, J. E., & Fox, J. N. (1973). Quantitative Analysis in
Educational Administrator Preparation Programs.
Columbus, Ohio: The ERIC Clearinghouse on Educational
Management, University Council for Educational
Administration.
Bryk, A. S., Gomez, L. M., & Grunow, A. (2010). Getting Ideas
Into Action: Building Networked Improvement Communities
in Education. Retrieved from Stanford, CA:
http://www.carnegiefoundation.org/elibrary/getting-ideas-
action-building-networked-improvement-communities-in-
education
Bryk, A. S., & Schneider, B. (2002). Trust in Schools: A Core
Resource for Improvement. New York: Russell Sage
Foundation.
Cho, V., & Wayman, J. C. (2015). Districts’ Efforts for Data
Use and Computer Data Systems: The Role of Sensemaking
in System Use and Implementation. Teachers College
Record, 116(2), 1-45. Retrieved from
http://www.tcrecord.org/content.asp?contentid=17349
Clow, D. (2014). Data wranglers: human interpreters to help
close the feedback loop. Paper presented at the Proceedings
of the Fourth International Conference on Learning
Analytics And Knowledge, Indianapolis, Indiana, USA.
https://doi.org/10.1145/2567574.2567603
Cobb, P., Confrey, J., diSessa, A., Lehrer, R., & Schauble, L.
(2003). Design Experiments in Educational Research.
Educational Researcher, 32(1), 9-13.
doi:10.3102/0013189x032001009
Cobb, P., & Jackson, K. (2012). Analyzing Educational Policies:
A Learning Design Perspective. Journal of the Learning
Sciences, 21(4), 487-521.
doi:10.1080/10508406.2011.630849
Coburn, C. E., & Penuel, W. R. (2016). Research–Practice
Partnerships in Education: Outcomes, Dynamics and Open
Questions. Educational Researcher, 45(1), 48-54.
doi:doi:10.3102/0013189X16631750
Coburn, C. E., Penuel, W. R., & Geil, K. E. (2013). Research-
Practice Partnerships: A Strategy for Leveraging Research
for Educational Improvement in School Districts. Retrieved
from New York, NY:
http://w.informalscience.org/images/research/Research-
Practice-Partnerships-at-the-District-Level.pdf
Coburn, C. E., & Turner, E. O. (2011). Research on Data Use: A
Framework and Analysis. Measurement: Interdisciplinary
Research and Perspectives, 9(4), 173-206.
doi:10.1080/15366367.2011.626729
Coburn, C. E., & Turner, E. O. (2012). The Practice of Data
Use: An Introduction. American Journal of Education,
118(2), 99-111. doi:10.1086/663272
Cohen-Vogel, L., Tichnor-Wagner, A., Allen, D., Harrison, C.,
Kainz, K., Socol, A. R., & Wang, Q. (2015). Implementing

14
Bowers & Krumm (2021)
Educational Innovations at Scale. Educational Policy, 29(1),
257-277. doi:doi:10.1177/0895904814560886
Cosner, S. (2014). Strengthening Collaborative Practices in
Schools: The Need to Cultivate Development Perspectives
and Diagnostic Approaches. In A. J. Bowers, A. R. Shoho,
& B. G. Barnett (Eds.), Using Data in Schools to Inform
Leadership and Decision Making (pp. 67-95). Charlotte,
NC: Information Age Publishing.
Datnow, A., Choi, B., Park, V., & St. John, E. (2018). Teacher
Talk About Student Ability and Achievement in the Era of
Data-Driven Decision Making. Teachers College Record,
120(4).
http://www.tcrecord.org/Content.asp?ContentId=22039
Dede, C. (2004). If Design-Based Research is the Answer, What
is the Question? A Commentary on Collins, Joseph, and
Bielaczyc; diSessa and Cobb; and Fishman, Marx,
Blumenthal, Krajcik, and Soloway in the JLS Special Issue
on Design-Based Research. Journal of the Learning
Sciences, 13(1), 105-114. doi:10.1207/s15327809jls1301_5
DiCerbo, K. E. (2014). Game-Based Assessment of Persistence.
Journal of Educational Technology & Society, 17(1), 17-28.
http://www.jstor.org/stable/jeductechsoci.17.1.17
DiCerbo, K. E., & Kobrin, J. (2016). Communicating assessment
results based on learning progressions. Paper presented at
the American Education Research Association, Washington,
DC.
Dimitriadis, Y., Martínez-Maldonado, R., & Wiley, K. (2021).
Human-Centered Design Principles for Actionable Learning
Analytics. Research on E-Learning and ICT in Education:
Technological, Pedagogical and Instructional Perspectives,
277-296.
http://martinezmaldonado.net/files/Chapter_31_Human-
centeredPrinciples.pdf
Donoho, D. (2015). 50 years of Data Science. Paper presented at
the Princeton NJ, Tukey Centennial Workshop.
Eisen, M. B., Spellman, P. T., Brown, P. O., & Botstein, D.
(1998). Cluster analysis and display of genome-wide
expression patterns. Proceedings of the National Academy
of Sciences, 95, 14863-14868.
http://rana.lbl.gov/papers/Eisen_PNAS_1998.pdf
Farley-Ripple, E. N., & Buttram, J. L. (2015). The Development
of Capacity for Data Use: The Role of Teacher Networks in
an Elementary School. Teachers College Record, 117(4), 1-
34. http://www.tcrecord.org/Content.asp?ContentId=17852
Farley-Ripple, E. N., Jennings, A., & Jennings, A. B. (2021).
Tools of the trade: a look at educators’ use of assessment
systems. School Effectiveness and School Improvement,
32(1), 96-117. doi:10.1080/09243453.2020.1777171
Farrell, C. C. (2014). Designing School Systems to Encourage
Data Use and Instructional Improvement: A Comparison of
School Districts and Charter Management Organizations.
Educational Administration Quarterly, 51(3), 438-471.
doi:10.1177/0013161x14539806
Fischer, C., Pardos, Z. A., Baker, R. S., Williams, J. J., Smyth,
P., Yu, R., . . . Warschauer, M. (2020). Mining Big Data in
Education: Affordances and Challenges. Review of Research
in Education, 44(1), 130-160.
doi:10.3102/0091732x20903304
Gandomi, A., & Haider, M. (2015). Beyond the hype: Big data
concepts, methods, and analytics. International Journal of
Information Management, 35(2), 137-
144.http://dx.doi.org/10.1016/j.ijinfomgt.2014.10.007
Garner, B., Thorne, J. K., & Horn, I. S. (2017). Teachers
interpreting data for instructional decisions: where does
equity come in? Journal of Educational Administration,
55(4), 407-426. doi:10.1108/JEA-09-2016-0106
Goodwin, C. (1994). Professional Vision. American
Anthropologist, 96(3), 606-633.
https://ils.unc.edu/courses/2020_fall/inls720_01W/WebPage
s/Readings/MOD08-Goodwin%201994.pdf
Graves, K. E., & Bowers, A. J. (2018). Toward a Typology of
Technology-Using Teachers in the “New Digital Divide”: A
Latent Class Analysis (LCA) of the NCES Fast Response
Survey System Teachers’ Use of Educational Technology in
U.S. Public Schools, 2009 (FRSS 95). Teachers College
Record, 120(8), 1-42.
http://www.tcrecord.org/library/content.asp?contentid=2227
7
Gu, Z., Eils, R., & Schlesner, M. (2016). Complex heatmaps
reveal patterns and correlations in multidimensional
genomic data. Bioinformatics, 32(18), 2847-2849.
doi:10.1093/bioinformatics/btw313
Halverson, R. (2010). School formative feedback systems.
Peabody Journal of Education, 85(2), 130-146. doi:
10.1080/0161956100368527
Hao, J., Smith, L., Mislevy, R., von Davier, A., & Bauer, M.
(2016). Taming Log Files From Game/Simulation-Based
Assessments: Data Models and Data Analysis Tools. ETS
Research Report Series, 2016(1), 1-17.
doi:https://doi.org/10.1002/ets2.12096
Harris Little, M., Cohen-Vogel, L., Sadler, J., & Merrill, B.
(2019). Data-driven decision making in early education:
Evidence from North Carolina’s pre-k program. Education
Policy Analysis Archives, 27(18), 1-23.
doi:10.14507/epaa.27.4198
Hawn, A. (2019). Data-wary, Value-driven: Teacher Attitudes,
Efficacy, and Online Access for Data-Based Decision
Making. (PhD). Columbia University,
Huguet, A., Marsh, J. A., & Farrell, C. (2014). Building
Teachers’ Data-use Capacity: Insights from Strong and
Developing Coaches. Education Policy Analysis Archives,
22(52), 1-30. http://epaa.asu.edu/ojs/article/view/1600/1278
Ifenthaler, D. (2021). Learning Analytics for School and System
Management. In S. Vincent-Lancrin & R. Baker (Eds.),
OECD Digital Education Outlook 2021: Pushing the
Frontiers with Artificial Intelligence, Blockchain and
Robots (pp. 161-172). Paris, France: Organisation for
Economic Co-Operation and Development (OECD)
Publishing.
Ikemoto, G. S., & Marsh, J. A. (2007). Cutting through the
"data-driven" mantra: Different conceptions of data-driven
decision making. In P. A. Moss (Ed.), Evidence and
decision making: The 106th yearbook of the National

15
Bowers & Krumm (2021)
Society for the Study of Education, Part 1 (pp. 105-131).
Malden, Mass: Blackwell Publishing.
Jimerson, J. B., Garry, V., Poortman, C. L., & Schildkamp, K.
(in press). Implementation of a collaborative data use model
in a United States context. Studies in Educational
Evaluation, 69, 100866. doi:10.1016/j.stueduc.2020.100866
Johnson, L., Levine, A., Smith, R., & Stone, S. (2010). The 2010
Horizon Report. Retrieved from Austin, TX:
https://files.eric.ed.gov/fulltext/ED510220.pdf
Jorion, N., Roberts, J., Bowers, A. J., Tissenbaum, M., Lyons,
L., Kuma, V., & Berland, M. (2020). Uncovering Patterns in
Constructionist Collaborative Learning Activities via
Cluster Analysis of Museum Exhibit Log Files. Frontline
Learning Research, 8(6), 77-87. doi:10.14786/flr.v8i6.597
Keim, D. A., Mansmann, F., Schneidewind, J., & Ziegler, H.
(2006, 5-7 July 2006). Challenges in Visual Data Analysis.
Paper presented at the Tenth International Conference on
Information Visualisation (IV'06).
Koedinger, K. R., D'Mello, S., McLaughlin, E. A., Pardos, Z. A.,
& Rosé, C. P. (2015). Data mining and education. Wiley
Interdisciplinary Reviews: Cognitive Science, 6(4), 333-353.
doi:10.1002/wcs.1350
Krumm, A. E., Beattie, R., Takahashi, S., D'Angelo, C., Feng,
M., & Cheng, B. (2016). Practical Measurement and
Productive Persistence: Strategies for Using Digital
Learning System Data to Drive Improvement. Journal of
Learning Analytics, 3(2), 116-138.
doi:10.18608/jla.2016.32.6
Krumm, A. E., & Bowers, A. J. (in press). Data-intensive
improvement: The intersection of data science and
improvement science. In D. J. Peurach, J. L. Russell, L.
Cohen-Vogel, & W. R. Penuel (Eds.), Handbook on
Improvement Focused Educational Research. Lanham, MD:
Rowman & Littlefield.
Krumm, A. E., Means, B., & Bienkowski, M. (2018). Learning
Analytics Goes to School: A Collaborative Approach to
Improving Education. New York: Routledge.
Lai, M. K., & Schildkamp, K. (2013). Data-based Decision
Making: An Overview. In K. Schildkamp, M. K. Lai, & L.
Earl (Eds.), Data-based Decision Making in Education:
Challenges and Opportunities (pp. 9-21). Dordrecht:
Springer Netherlands.
Lasater, K., Albiladi, W. S., Davis, W. S., & Bengtson, E.
(2020). The Data Culture Continuum: An Examination of
School Data Cultures. Educational Administration
Quarterly, 56(4), 533-569. doi:10.1177/0013161x19873034
Lee, J., Recker, M., Bowers, A. J., & Yuan, M. (2016).
Hierarchical Cluster Analysis Heatmaps and Pattern
Analysis: An Approach for Visualizing Learning
Management System Interaction Data. Paper presented at
the International Conference of Educational Data Mining
(EDM), Raleigh, NC.
http://www.educationaldatamining.org/EDM2016/proceedin
gs/paper_34.pdf
Mandinach, E. B., Friedman, J. M., & Gummer, E. S. (2015).
How Can Schools of Education Help to Build Educators’
Capacity to Use Data? A Systemic View of the Issue.
Teachers College Record, 117(4), 1-50. Retrieved from
http://www.tcrecord.org/library/abstract.asp?contentid=178
50
Mandinach, E. B., Honey, M., & Light, D. (2006). A Theoretical
Framework for Data-Driven Decision Making Paper
presented at the American Educational Research
Association, San Francisco, CA.
http://cct.edc.org/sites/cct.edc.org/files/publications/DataFra
me_AERA06.pdf
Mandinach, E. B., Honey, M., Light, D., & Brunner, C. (2008).
A Conceptual Framework for Data-Driven Decision
Making. In E. B. Mandinach & M. Honey (Eds.), Data-
Driven School Improvement: Linking Data and Learning
(pp. 13-31). New York: Teachers College Press.
Mandinach, E. B., & Schildkamp, K. (2021). Misconceptions
about data-based decision making in education: An
exploration of the literature. Studies in Educational
Evaluation, 69. doi:10.1016/j.stueduc.2020.100842
Marsh, J. A. (2012). Interventions Promoting Educators’ Use of
Data: Research Insights and Gaps. Teachers College
Record, 114(11), 1-48.
Marsh, J. A., Bertrand, M., & Huguet, A. (2015). Using Data to
Alter Instructional Practice: The Mediating Role of Coaches
and Professional Learning Communities. Teachers College
Record, 114(4), 1-40.
http://www.tcrecord.org/Content.asp?ContentId=17849
Miles, M. B., & Huberman, A. M. (1994). Qualitative data
analysis : An expanded sourcebook. Thousand Oaks, CA:
Sage Publications.
Mukherjee, R., & Kar, P. (2017, 5-7 Jan. 2017). A Comparative
Review of Data Warehousing ETL Tools with New Trends
and Industry Insight. Paper presented at the 2017 IEEE 7th
International Advance Computing Conference (IACC).
Nitkin, D. (2018). Technology-Based Personalization:
Instructional Reform in Five Public Schools. (Ph.D.).
Columbia University, https://doi.org/10.7916/D8QZ3TC6
Penuel, W. R., Allen, A.-R., Coburn, C. E., & Farrell, C. (2015).
Conceptualizing Research–Practice Partnerships as Joint
Work at Boundaries. Journal of Education for Students
Placed at Risk, 20(1), 182-197.
http://ejournals.ebsco.com/direct.asp?ArticleID=48E095239
2B4F03DE09D
Penuel, W. R., & Gallagher, D. J. (2017). Creating Research
Practice Partnerships in Education. Cambridge, MA:
Harvard Education Press.
Penuel, W. R., Riedy, R., Barber, M. S., Peurach, D. J.,
LeBouef, W. A., & Clark, T. (2020). Principles of
Collaborative Education Research With Stakeholders:
Toward Requirements for a New Research and
Development Infrastructure. Review of Educational
Research, 90(5), 627-674. doi:10.3102/0034654320938126
Piety, P. J. (2019). Components, Infrastructures, and Capacity:
The Quest for the Impact of Actionable Data Use on P–20
Educator Practice. Review of Research in Education, 43(1),
394-421. doi:10.3102/0091732x18821116
Piety, P. J., Hickey, D. T., & Bishop, M. (2014). Educational
data sciences: Framing emergent practices for analytics of

16
Bowers & Krumm (2021)
learning, organizations, and systems. Paper presented at the
Proceedings of the Fourth International Conference on
Learning Analytics and Knowledge.
Popham, W. J. (2010). Everything school leaders need to know
about assessment. Thousand Oaks, CA: Corwin.
R Development Core Team. (2019). R: A language and
environment for statistical computing. Vienna, Austria: R
Foundation for Statistical Computing. http://www.R-
project.org
Reimann, P. (2011). Design-Based Research. In L.
Markauskaite, P. Freebody, & J. Irwin (Eds.),
Methodological Choice and Design: Scholarship, Policy
and Practice in Social and Educational Research (pp. 37-
50). Dordrecht: Springer Netherlands.
Riehl, C., Earle, H., Nagarajan, P., Schwitzman, T. E., &
Vernikoff, L. (2018). Following the path of greatest
persistence: Sensemaking, data use, and everyday practice
of teaching. In N. Barnes & H. Fives (Eds.), Cases of
Teachers' Data Use (pp. 30-43). New York: Routledge.
Schildkamp, K. (2019). Data-based decision-making for school
improvement: Research insights and gaps. Educational
Research, 61(3), 257-273.
doi:10.1080/00131881.2019.1625716
Schildkamp, K., & Ehren, M. C. M. (2013). From "intuition" to
data-based decision making in Dutch secondary schools? In
K. Schildkamp, M. K. Lai, & L. Earl (Eds.), Data-based
decision making in education: Challenges and opportunities
(pp. 49-67). Dordrecht: Springer.
Schildkamp, K., & Kuiper, W. (2010). Data-informed
curriculum reform: Which data, what purposes, and
promoting and hindering factors. Teaching and Teacher
Education, 26(3), 482-496.
doi:https://doi.org/10.1016/j.tate.2009.06.007
Schildkamp, K., & Poortman, C. (2015). Factors Influencing the
Functioning of Data Teams. Teachers College Record,
117(4), 1-42. Retrieved from
http://www.tcrecord.org/Content.asp?ContentId=17851
Schildkamp, K., Poortman, C., Luyten, H., & Ebbeler, J. (2017).
Factors promoting and hindering data-based decision
making in schools. School Effectiveness and School
Improvement, 28(2), 242-258.
doi:10.1080/09243453.2016.1256901
Schildkamp, K., Poortman, C. L., & Handelzalts, A. (2016).
Data teams for school improvement. School Effectiveness
and School Improvement, 27(2), 228-254.
doi:10.1080/09243453.2015.1056192
Schutt, R., & O'Neil, C. (2013). Doing Data Science: Straight
Talk from the Frontline. Cambridge, MA: O'Reilly.
Selwyn, N., Pangrazio, L., & Cumbo, B. (2021). Attending to
data: Exploring the use of attendance data within the
datafied school. Research in Education, 109(1), 72-89.
doi:10.1177/0034523720984200
Siemens, G. (2013). Learning Analytics: The Emergence of a
Discipline. American Behavioral Scientist, 57(10), 1380-
1400. doi:10.1177/0002764213498851
Supovitz, J., & Morrison, K. (2015). Does Collaboration
Facilitate Data Use in Schools? Journal of Studies in
Education, 5(2), 136-156. doi:10.5296/jse.v5i2.7379
Tichnor-Wagner, A., Wachen, J., Cannata, M., & Cohen-Vogel,
L. (2017). Continuous improvement in the public school
context: Understanding how educators respond to plan–do–
study–act cycles. Journal of Educational Change, 18(4),
465-494. doi:10.1007/s10833-017-9301-4
Tukey, J. W. (1962). The Future of Data Analysis. The Annals of
Mathematical Statistics, 33(1), 1-67. Retrieved from
http://www.jstor.org/stable/2237638
Tukey, J. W. (1977). Exploratory data analysis (Vol. 2):
Reading, Mass.
Vassiliadis, P. (2009). A survey of extract--transform--load
technology. International Journal of Data Warehousing and
Mining, 5(3), 1-27. Retrieved from
https://link.gale.com/apps/doc/A203177969/AONE?u=new3
0429&sid=AONE&xid=5768faf9
Wachen, J., Harrison, C., & Cohen-Vogel, L. (2018). Data Use
as Instructional Reform: Exploring Educators’ Reports of
Classroom Practice. Leadership and Policy in Schools,
17(2), 296-325. doi:10.1080/15700763.2016.1278244
Walonoski, J. A., & Heffernan, N. T. (2006). Prevention of Off-
Task Gaming Behavior in Intelligent Tutoring Systems,
Berlin, Heidelberg.
Warnes, G. R., Bolker, B., Bonebakker, L., Gentleman, R.,
Huber, W., Liaw, A., . . . Venables, B. (2020). gplots:
Various R Programming Tools for Plotting Data.
https://CRAN.R-project.org/package=gplots
Wayman, J. C., Shaw, S., & Cho, V. (2017). Longitudinal
Effects of Teacher Use of a Computer Data System on
Student Achievement. AERA Open, 3(1).
doi:doi:10.1177/2332858416685534
Wayman, J. C., & Stringfield, S. (2006). Data use for school
improvement: School practices and research perspectives.
American Journal of Education, 112(4), 463-468. Retrieved
from
http://www.journals.uchicago.edu/AJE/journal/contents/v11
2n4.html
Wilkerson, S. B., Klute, M., Peery, B., & Liu, J. (2021). How
Nebraska teachers use and perceive summative, interim,
and formative data (REL 2021–054). Retrieved from
Washington, DC:
https://ies.ed.gov/ncee/edlabs/projects/project.asp?projectID
=5683
Wilkinson, L., & Friendly, M. (2009). The History of the Cluster
Heat Map. The American Statistician, 63(2), 179-184.
doi:10.1198/tas.2009.0033
Yin, R. K. (2017). Case study research and applications:
Designs and methods (6th ed.). Thousand Oaks: Sage.