Embed Size (px)
Citation preview

Post-Primary
Supporting the development of mathematical proficiency in Post-primary school.
Post-Primary: Junior Cycle
Mathematics
• conceptual understanding—comprehension of mathematical concepts,
operations, and relations
• procedural fluency—skill in carrying out procedures flexibly, accurately,
efficiently, and appropriately
• Istrategic competence—ability to formulate, represent, and solve mathematical
problems in both familiar and unfamiliar contexts
• adaptive reasoning—capacity for logical thought, reflection, explanation,
justification and communication
• productive disposition—habitual inclination to see mathematics as sensible,
useful, and worthwhile, coupled with a belief in diligence, perseverance and
one’s own efficacy.
Mathematics
Post-primary mathematics aims to empower students to develop mathematical proficiency; a
multidimensional trait characterised by five interconnected and interwoven characteristics.
Transitioning from primary school
Many of the learning outcomes on the JC Mathematics Specification relate to a number of key
concepts in mathematics that learners need to develop in order to progress in mathematics.
Their development begins in early childhood and continues through primary school yet a significant
number of learners present in secondary school with fragmented or incomplete conceptual
understanding. The focus in the transitional period should be on providing learners with tasks that
allow them to consolidate their prior learning and to further develop these key concepts.
Many learners will continue to experience difficulty with these concepts beyond the transitional
period and teachers can use the developmental nature of the concepts to guide them as they select
appropriate tasks for these learners, manage their expectations and the scaffolding they provide for
them.
Subitising - page 6Often referred to as Trusting the Count a student can subitise when they have developed flexible
mental objects for the numbers 0-10 and can recognise collections of these numbers without
counting. Most students enter First Year with this concept well –developed, a minority will need
help to develop this if they are to progress.
Place-value - page 7The ten for one trade structure of our number system is quite complex. Being able to label the
tens place and the ones place, or even being able to count by tens, does not, necessarily signal an
understanding that 1 ten is simultaneously 10 ones. Becoming mindful of this relationship between
tens and ones, or staying mindful of it, is neither simple nor trivial. Using physical models and
discussion in the context of computation may help students to come to deeper understandings of
the one-for ten and the ten-for one trades that can be made at each pair of neighbouring places.
• Investigating student thinking: [Analysis of student work] pages 8-10
• Supporting the growth to abstract reasoning about number [Task] pages 11-15
Post-Primary: Junior Cycle
Mathematics - Transition from primary school
Multiplicative thinking - Page 16Multiplicative thinking is a foundational concept and the key to understanding rational number and
developing efficient mental and written computation strategies in later years. The transition from
additive to multiplicative thinking is not straightforward and since access to multiplicative thinking
represents a real and persistent barrier to many learners’ mathematical progress in post primary
school the transitional period ought to focus on empowering students to think multiplicatively.
• Supporting the shift from a ‘groups of’ way of thinking about multiplication to an array-based
representation pages 17-19
• Case Study - Multiplicative thinking rational numbers pages 20-24
Partitioning - page 25A deep understanding of how fractions are made, named and renamed. The connection between
fractions and the sharing or partitative idea of division, and to multiplicative thinking more
generally.
• Case study - Partitioning pages 26-29
Proportional reasoning - page 30Proportional reasoning has been referred to as the capstone of the primary mathematics and the
cornerstone of algebra and beyond.
• Investigating student thinking: [Case study] pages31-32
• Making sense of absolute and relative comparison [Task] pages 33-35
• Reasoning multiplicatively about comparison [Task] pages 36-38
• Making sense of proportion in real life [Task] pages 39-40
Post-Primary: Junior Cycle
Mathematics - Transition from primary school
Generalising - page 41Students begin to develop this concept when the recognise and number properties and patterns.
They firstly begin to describe these in words and finally use the complexities of algebraic text.
• Coherence and continuity (Case study) pages 42-52
• Focus on equivalance (Case Study) pages 53-63
Learning outcomesSee how the learning outcomes on the JC mathematics specification relate to these key concepts.
Post-Primary: Junior Cycle
Mathematics - Transition from primary school

Key Concepts in Mathematics – Subitising
If these concepts are not fully developed, students will find it very difficult to engage meaningfully with core aspects of the Number, Algebra and Functions strands in later years.
Subitising
Often referred to as trusting the count, subitising is the ability to instantaneously recognise the number of objects in a small group without needing to count them.
How does the concept develop?
By about 2yrs of age children can recognise 1, 2 or 3 objects without being able to count with meaning.
By about 4 yrs of age mental powers have developed and children can recognise groups of 4 objects without being able to count.
It is thought that the maximum number for subitising even for most adults is 5.
So, for groups of numbers beyond 5 other mental strategies are utilised.
Part–Part–Whole Relationships Rapid Mental Arithmetic i.e. understanding that a numberis made up of smaller parts
Together with
So, it may be possible to recognise more than 5 objects if they are arranged in a particular way.
What can I do to help?
Encourage Mental strategies Discourage Simply counting XHow?
Introduce an element of speed into tasks.
Encourage students to reflect and share their strategies.
Why? Verbalising brings the strategy to a conscious level and students learn about their own thinking.
Other students are given the opportunity to pick up a new strategy.
The teacher is given an opportunity to assess the type of thinking so that they can adjust the
teaching accordingly.
This skill is called subitising and appears to be based on the mind's ability to
form stable mental images of patterns and associate them with a number.
Key Concepts in Mathematics – Place Value
If these concepts are not fully developed, students will find it difficult to engage meaningfully with core aspects of the Number, Algebra and Functions strands in later years.
Place Value provides a system of new units based on the idea that ‘10 of these is 1 of those’
which can be used to work with and think about larger whole numbers in efficient and flexible
ways.
How does the concept develop?
By about First Class children can count by ones to 100 and beyond, read and write numbers to
1000, orally skip-count by twos, fives and tens, and identify place-value parts (e.g., they can say
that there are 3 hundreds 4 tens and 5 ones in 345). Being able to re-name numbers in this way
does NOT mean that children understand place value; many children who can identify the
hundreds, tens and ones, in a number still think about or imagine these numbers additively as
being bunches of ones. That is they imagine 345 as 300 ones and 40 ones and 5 ones which is
345 ones. This additive mental image ignores the multiplicative nature of the base ten system
which involves counts of different sized groups that are powers of 10.
Children need to move from being able to identify place-value parts to being able to rename
numbers in terms of their place-value parts and work in place-value parts.
When children are given large collections to count they begin to develop an understanding that
the numbers 2 to 10 can be used as countable units and this ability to efficiently count large
collections is a sound basis for place value. In addition children also need a well-developed
concept of part–part–whole relationships for numbers from 0–10 as well some sense of numbers
beyond 10, e.g. 15 is 10 and 5 more. See the section on Subitising for more information.
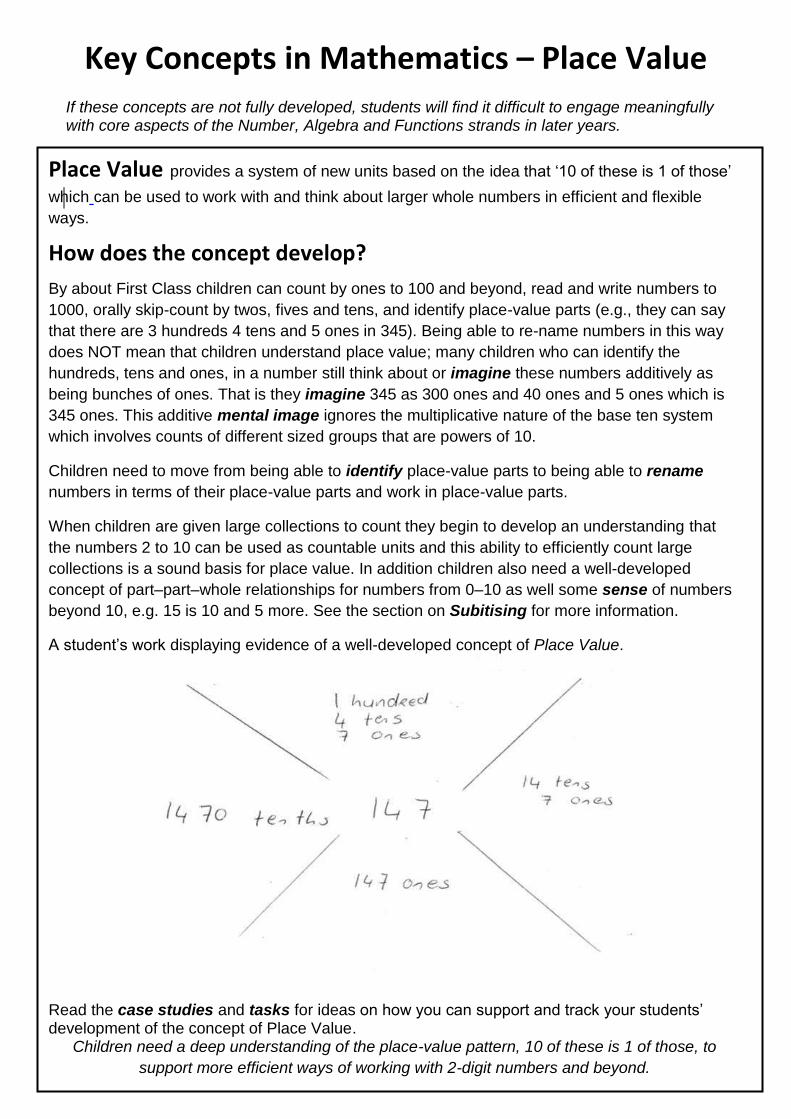
A student’s work displaying evidence of a well-developed concept of Place Value.
Read the case studies and tasks for ideas on how you can support and track your students’ development of the concept of Place Value.
Children need a deep understanding of the place-value pattern, 10 of these is 1 of those, to
support more efficient ways of working with 2-digit numbers and beyond.
Assessing Place value Understanding
It is an enormous leap from operating with units of one to multi-digit
computational procedures that use units of tens, hundreds, thousands and so
forth, as well as units of one. To work with units of different values it is
necessary to first sort out the complicated ways that each is related to the
other.
The ten for one trade structure of our number system is quite complex. Being
able to label the tens place and the ones place, or even being able to count by
tens, does not, necessarily signal an understanding that 1 ten is simultaneously
10 ones. Becoming mindful of this relationship between tens and ones, or
staying mindful of it, is neither simple nor trivial.
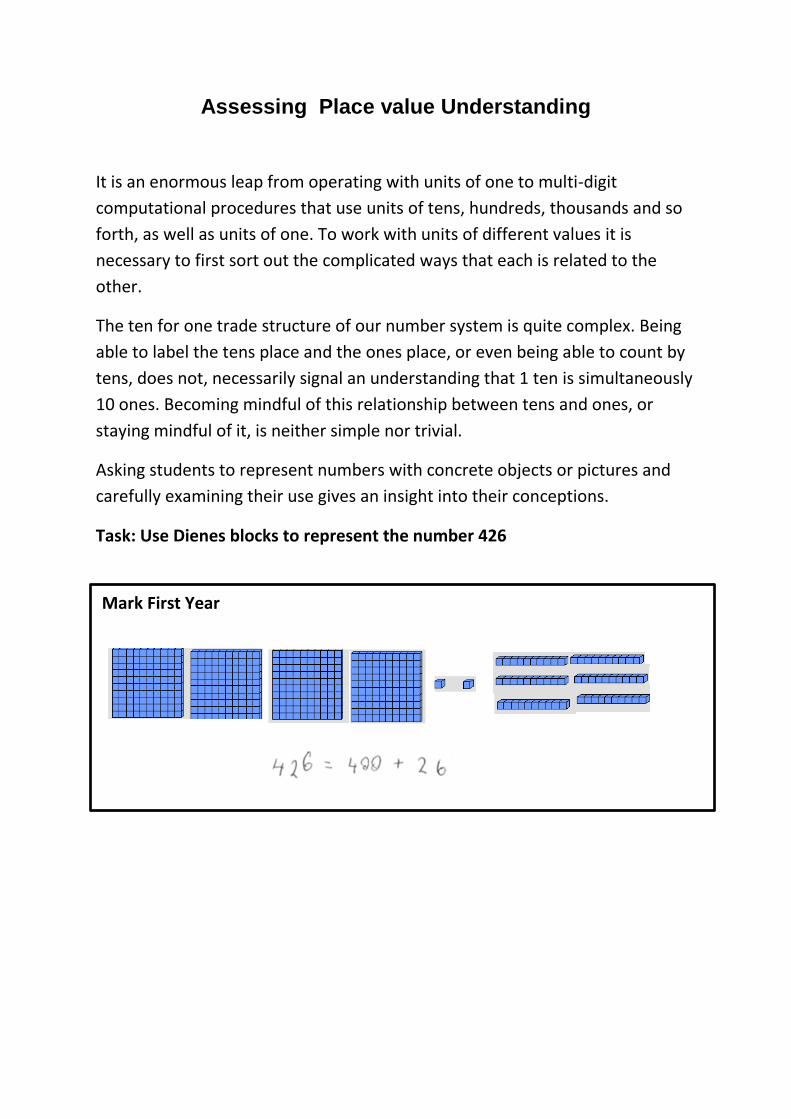
Asking students to represent numbers with concrete objects or pictures and
carefully examining their use gives an insight into their conceptions.
Task: Use Dienes blocks to represent the number 426
Mark First Year
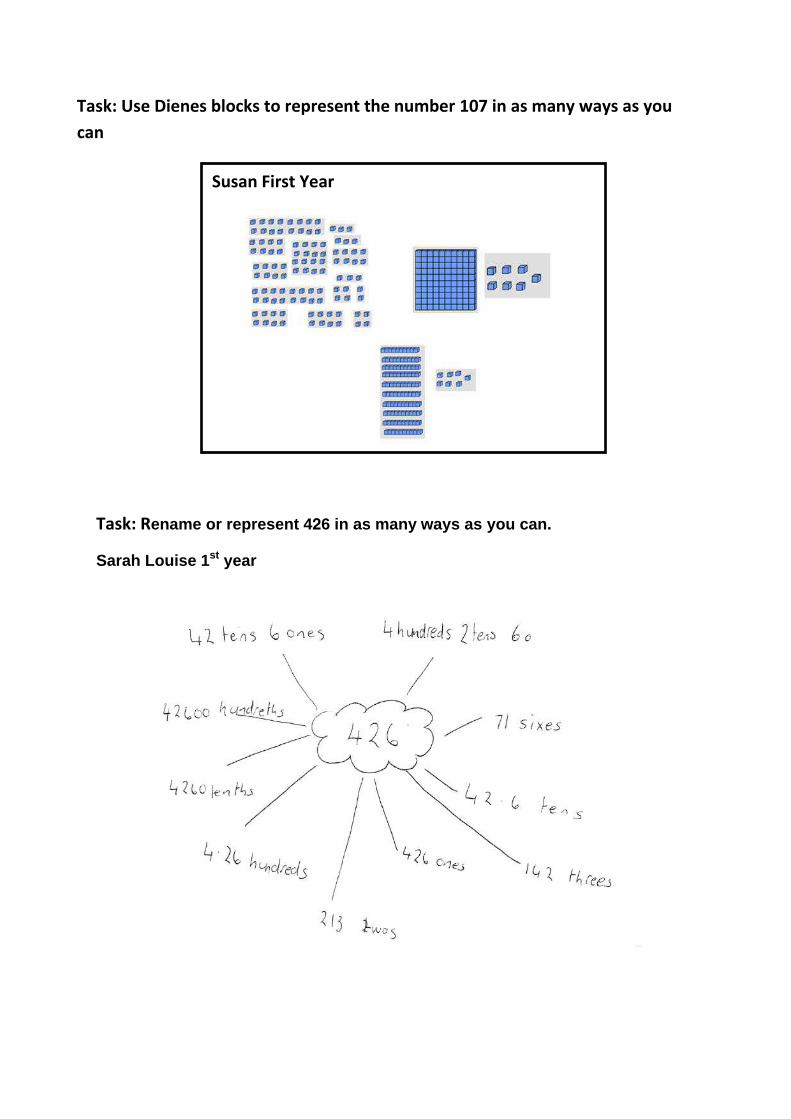
Task: Use Dienes blocks to represent the number 107 in as many ways as you can
Task: Rename or represent 426 in as many ways as you can.
Sarah Louise 1st year
Susan First Year
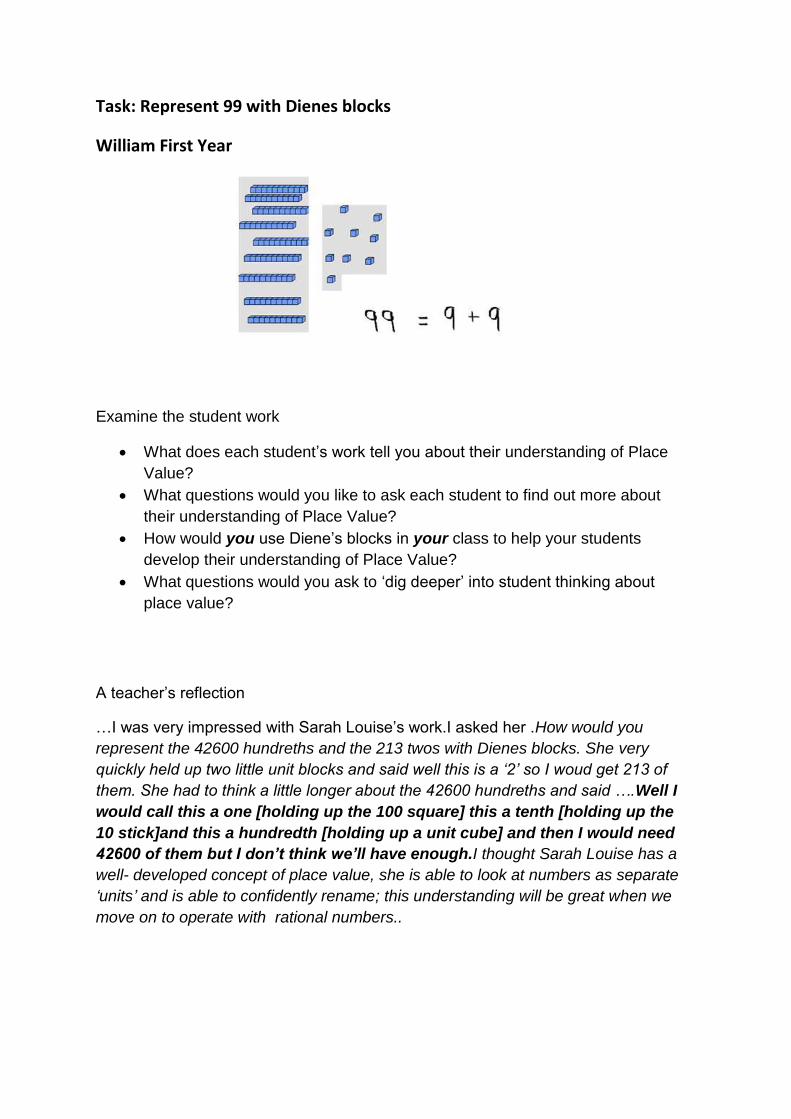
Task: Represent 99 with Dienes blocks
William First Year
Examine the student work
What does each student’s work tell you about their understanding of PlaceValue?
What questions would you like to ask each student to find out more abouttheir understanding of Place Value?
How would you use Diene’s blocks in your class to help your studentsdevelop their understanding of Place Value?
What questions would you ask to ‘dig deeper’ into student thinking about
place value?
A teacher’s reflection
…I was very impressed with Sarah Louise’s work.I asked her .How would you
represent the 42600 hundreths and the 213 twos with Dienes blocks. She very
quickly held up two little unit blocks and said well this is a ‘2’ so I woud get 213 of
them. She had to think a little longer about the 42600 hundreths and said ….Well I
would call this a one [holding up the 100 square] this a tenth [holding up the
10 stick]and this a hundredth [holding up a unit cube] and then I would need
42600 of them but I don’t think we’ll have enough.I thought Sarah Louise has a
well- developed concept of place value, she is able to look at numbers as separate
‘units’ and is able to confidently rename; this understanding will be great when we
move on to operate with rational numbers..

As students become adept at breaking apart and recombining numbers, they
often invent multi-digit addition and subtraction procedures. These can be the
starting places for deeper understanding of the tens structure itself and how it
behaves in computation. Consider the first piece of work below, the two
students drew out a pile of 38 cubes counting in ones each time. Then they
drew another pile of 25 cubes starting again at one. Next they counted both
sets together, starting at one until all the cubes were counted. This was in
contrast to other students in the class who worked more abstractly with
number and made use of groups of ten, generating solutions such as the one
shown. Like many students they chose to work with the larger numbers first;in
this case tens.
While the second style solution certainly demonstrates some ability to
decompose and recombine numbers using groups of tens and ones, we can’t
really tell from this example whether any of these students understand
30 +20 =50 to be equivalent to 3 tens + 2 tens = 5 tens, and therefore to be
both similar to, and different from, 3 ones + 2 ones = 5 ones. Certainly the
students solving this problem by drawing out cubes and counting them one by
one are not looking at numbers in this way. As they grow beyond the need to
represent all of the amounts and actions in problems, they no longer rely
entirely upon counting to determine the results of joining or separating sets,
beginning instead to reason numerically about the quantities involved.
What students do with the objects they use for modelling
mathematics situations reflects their understanding of the
structure of the situation. In the word problems here, for
example, the structure of addition is understood from
physically joining quantities.
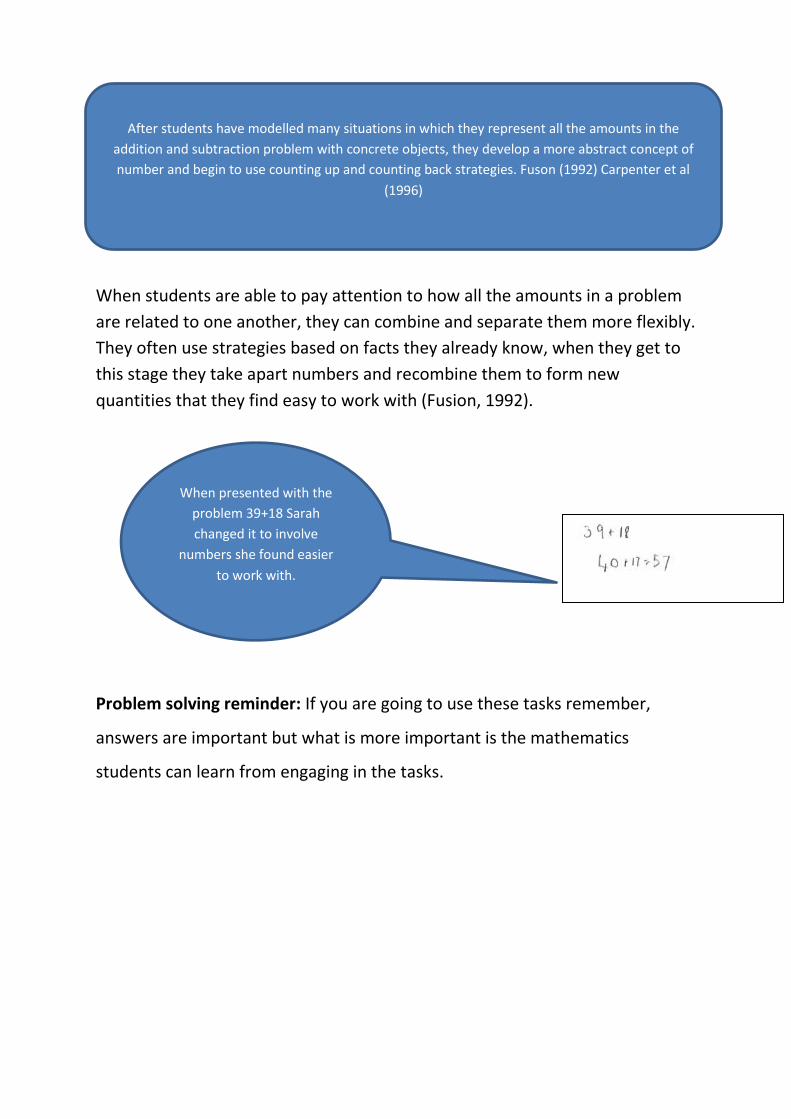
When students are able to pay attention to how all the amounts in a problem
are related to one another, they can combine and separate them more flexibly.
They often use strategies based on facts they already know, when they get to
this stage they take apart numbers and recombine them to form new
quantities that they find easy to work with (Fusion, 1992).
Problem solving reminder: If you are going to use these tasks remember,
answers are important but what is more important is the mathematics
students can learn from engaging in the tasks.
After students have modelled many situations in which they represent all the amounts in the
addition and subtraction problem with concrete objects, they develop a more abstract concept of
number and begin to use counting up and counting back strategies. Fuson (1992) Carpenter et al
(1996)
When presented with the
problem 39+18 Sarah
changed it to involve
numbers she found easier
to work with.
The growth from modelling all quantities and actions in a combining or separating problem
to abstract reasoning with numbers is not a smooth or consistent transition for students.
Problem solving reminder: If you are going to use this task remember, answers are
important but what is more important is the mathematics students can learn from engaging
in the tasks
Thoughts for teachers
How would you use this task with your students?
o What prior experiences should your students have had in order to be able to
engage with this task?
o What misconceptions is this task likely to expose?
o Would you modify the task in any way for your students?
What mathematics do you want your students to learn from engaging in this task?
What questions might you ask as your students as they are working on the task
o Can you write a mathematical sentence to show Amy’s group’s strategy?
o What is Amy’s group saying about 38 + 29?
o Amy’s group is saying that 38 + 29 is the same as something else; what is it?
o Can you write that as a mathematical sentence?
o Use Amy’s strategy to solve this problem…
o Will Amy’s strategy work for all whole numbers? Convince me.
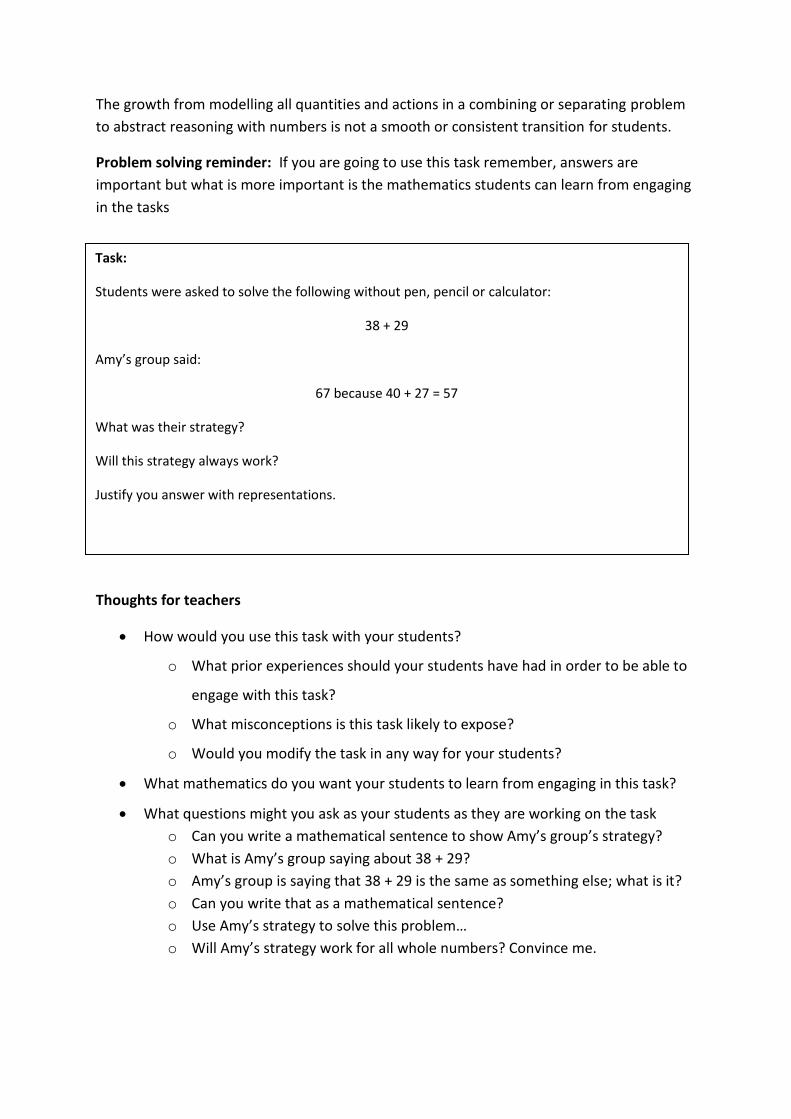
Task:
Students were asked to solve the following without pen, pencil or calculator:
38 + 29
Amy’s group said:
67 because 40 + 27 = 57
What was their strategy?
Will this strategy always work?
Justify you answer with representations.
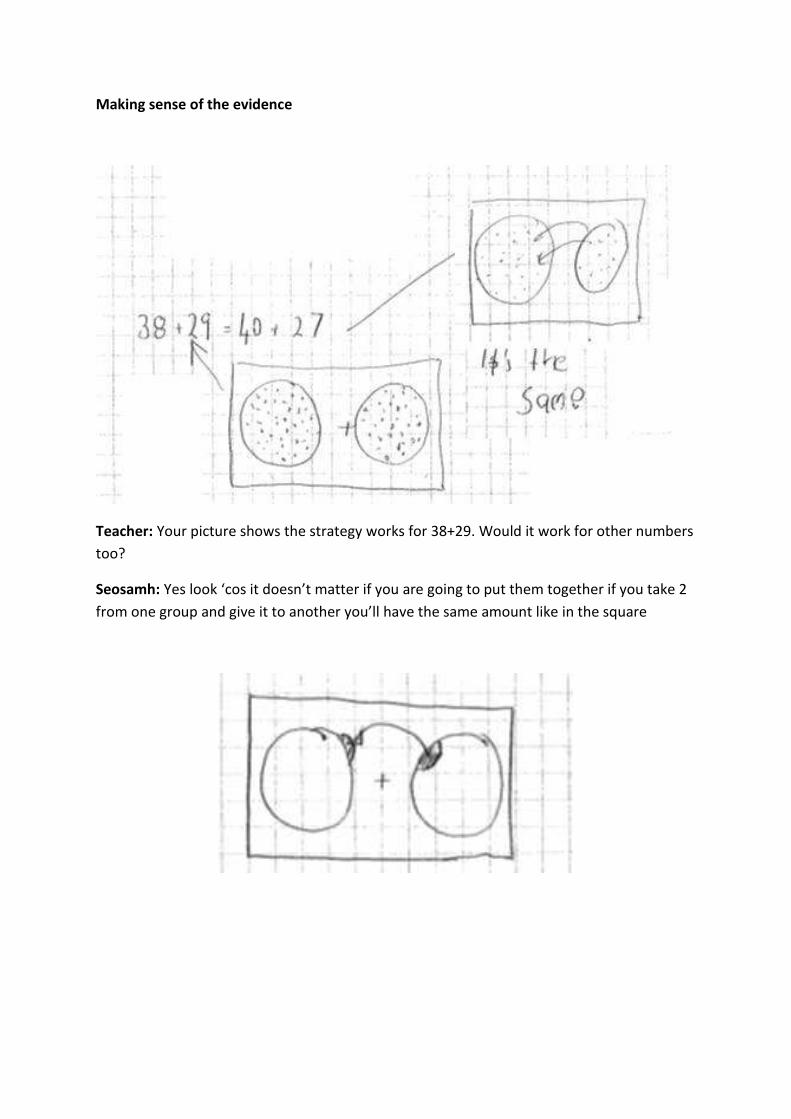
Making sense of the evidence
Teacher: Your picture shows the strategy works for 38+29. Would it work for other numbers
too?
Seosamh: Yes look ‘cos it doesn’t matter if you are going to put them together if you take 2
from one group and give it to another you’ll have the same amount like in the square

Teacher: Would the strategy work for other numbers like say 35+29?
Extending the learning
Would the strategy work for subtraction? Why? Why not?
Justify your decision
Think: What mathematics do you want your students to learn from extending the task in
this way?
What prior
knowledge is this
student bringing to
the task?
Are your students
ready to generalise
solution strategies in
this way? How would
you scaffold your
students to generalise
their observations?
Key Concepts in Mathematics –
Multiplicative Thinking
If these concepts are not fully developed students’ will find it difficult to engage meaningfully
with core aspects of the Number, Algebra and Functions strands in later years.
Multiplicative Thinking A capacity to work flexibly with the concepts, strategies and representations of multiplication and
division as they occur in a wide range of contexts.
Students who are thinking multiplicatively will be able to work flexibly and efficiently with large whole numbers, decimals, common fractions, ratio, and percentages
recognise and solve problems involving multiplication or division including direct and indirect proportion,
communicate their solutions effectively in words, diagrams, symbolic expressions, and written algorithms
How does the concept develop? There are several ideas that support the development of
multiplicative thinking. The exploration of these ideas is very important; their development may take many years and according to some researchers, may not be fully understood by students until they are well into their teen years.
1. The groups of idea. This idea represents an additive model of multiplication and develops when
children begin to count large numbers of objects. The one-to-one count becomes tedious and
children begin to think about more efficient strategies, they skip count by twos, fives or tens. Some
children can find this move from a one-to-one count to a one-to-many count very difficult because
they lose sight of what they are actually doing; counting a count. The difficulty is eased if children are
given the opportunity to…..
2. Move beyond the groups of idea to a partitioning or sharing idea and focus their attention on the
number in each of a known number of shares. Asking children to systematically share collections
helps develop this idea. There are documents available outlining tasks that empower children to think
about counting by exploring how many ways a number of objects can be shared equally. One of the
advantages of the sharing idea is that it leads to the realisation that a collection may be partitioned
in more than one way, e.g. 24 is 2 twelves, 3 eights, 4 sixes, 6 fours, and 12 twos, each of which
can be represented more efficiently by an array or a region.
3. The real strength of the array or region representation is that it provides a basis for understanding
fraction diagrams, and leads to the area idea which is needed to accommodate larger whole
numbers and rational numbers. The area idea is very important and more neutrally represents all
aspects of the multiplicative situation, that is, the number of groups, the equal number in each group,
and the product. It also demonstrates commutatively of multiplication as well as how multiplication
distributes over addition. Read the tasks and case studies for ideas on how you can support your
students with the area idea of multiplication.
4. The area idea generalises to the factor-factor-product idea which is needed to support fraction
representation as well as multiple factor situations such as 24 = 2 x 2 x 2 x 3, exponentiation as in
4 x 4 x 4, and algebraic factorisation as in (2x + 3)( ? ) = 2x2 + 5x + 3
5. The for each idea also known as the Cartesian Product arises in the context of Data in primary
school and Strand 1 in post-primary school. It also applies in rate or proportion problems and is
evident in the structure of the place-value system, where for example, children need to think about
the fact that for each ten, there are 10 ones, for each hundred there are10 tens, and for each one
there are 10 tenths and so on. There are documents available outlining tasks that promote the
development of the for each idea.
Supporting the shift from a ‘groups of’ way of thinking about
multiplication to an array-based representation.
A group of First Year students were given the following task. The mathematical
purpose of the task was to see how students were thinking about multiplication. There are several ideas that support the development of multiplicative thinking, and
the ability to think multiplicatively is very important if students are to engage
meaningfully with Number in subsequent years. Consequently the development of
multiplicative thinking is a major goal of the bridging period.
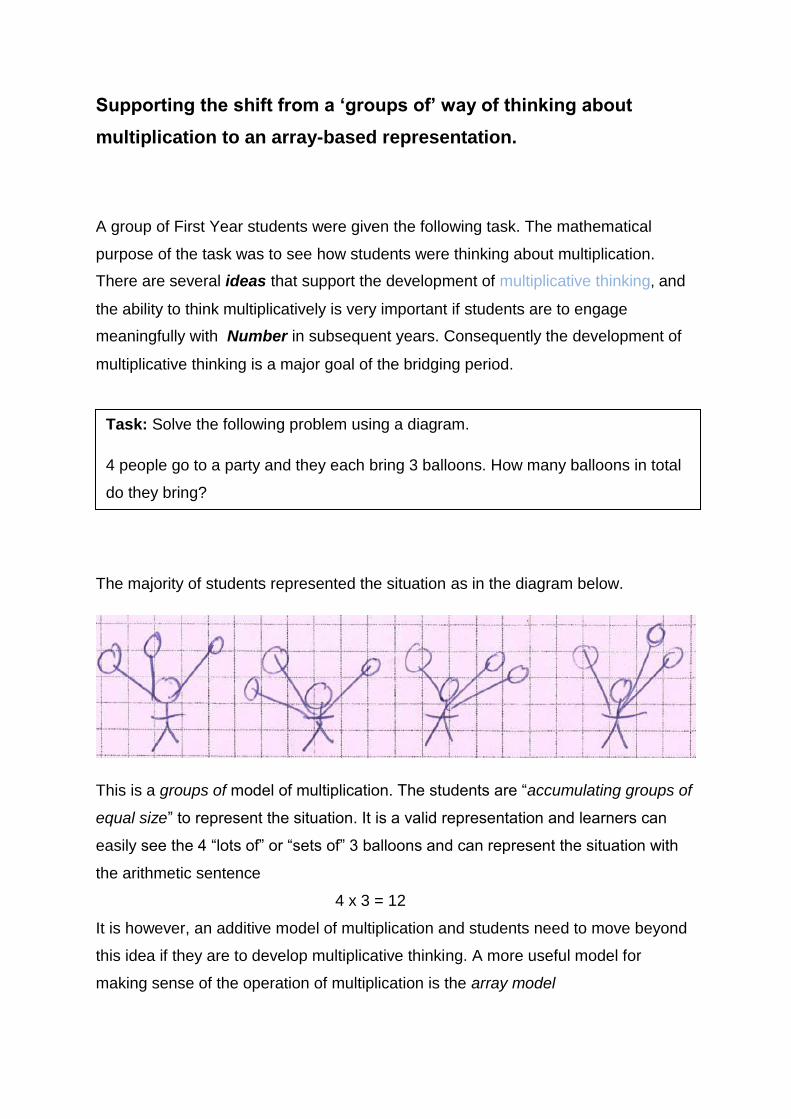
The majority of students represented the situation as in the diagram below.
This is a groups of model of multiplication. The students are “accumulating groups of
equal size” to represent the situation. It is a valid representation and learners can
easily see the 4 “lots of” or “sets of” 3 balloons and can represent the situation with
the arithmetic sentence
4 x 3 = 12
It is however, an additive model of multiplication and students need to move beyond
this idea if they are to develop multiplicative thinking. A more useful model for
making sense of the operation of multiplication is the array model
Task: Solve the following problem using a diagram.
4 people go to a party and they each bring 3 balloons. How many balloons in total
do they bring?
Why is it important that students make this shift?
Working with array representations enables students to
simultaneously co-ordinate the number of groups, the number in each group
and the total
recognise commutativity
relate the two ideas for division partition (or sharing) and quotition (or how
many groups in), to multiplication
It also provides a basis for moving from a count of equal groups (eg, 1 three, 2
threes, 3 threes, 4 threes,…) to a constant number of groups (eg, 4 ones, 4 twos, 4
threes, 4 fours, 4 fives …) which supports more efficient mental strategies (eg, 6
groups of anything is double 3 groups or 5 groups and 1 more group).
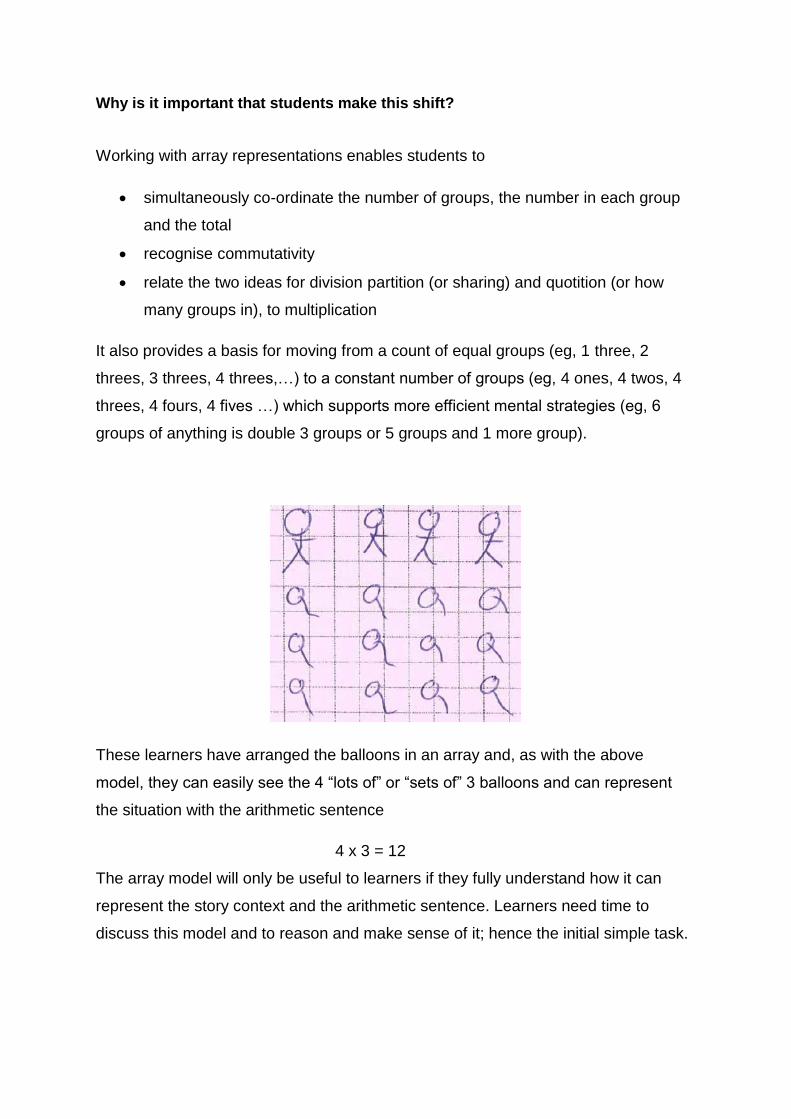
These learners have arranged the balloons in an array and, as with the above
model, they can easily see the 4 “lots of” or “sets of” 3 balloons and can represent
the situation with the arithmetic sentence
4 x 3 = 12
The array model will only be useful to learners if they fully understand how it can
represent the story context and the arithmetic sentence. Learners need time to
discuss this model and to reason and make sense of it; hence the initial simple task.
Discuss each group’s answer to the task and encourage learners to see how, of all
the representations given, the array model is the most useful.
Useful questions to ask
What does the “x” symbol represent in the story context? In the array?
What does the “4” represent in the story context?
What does the “3” represent in the story context?
Once learners have established the array model as a useful way to represent
multiplication you can set further tasks that will allow them to use the model and
reason and make sense of the operation of multiplication.
Case study
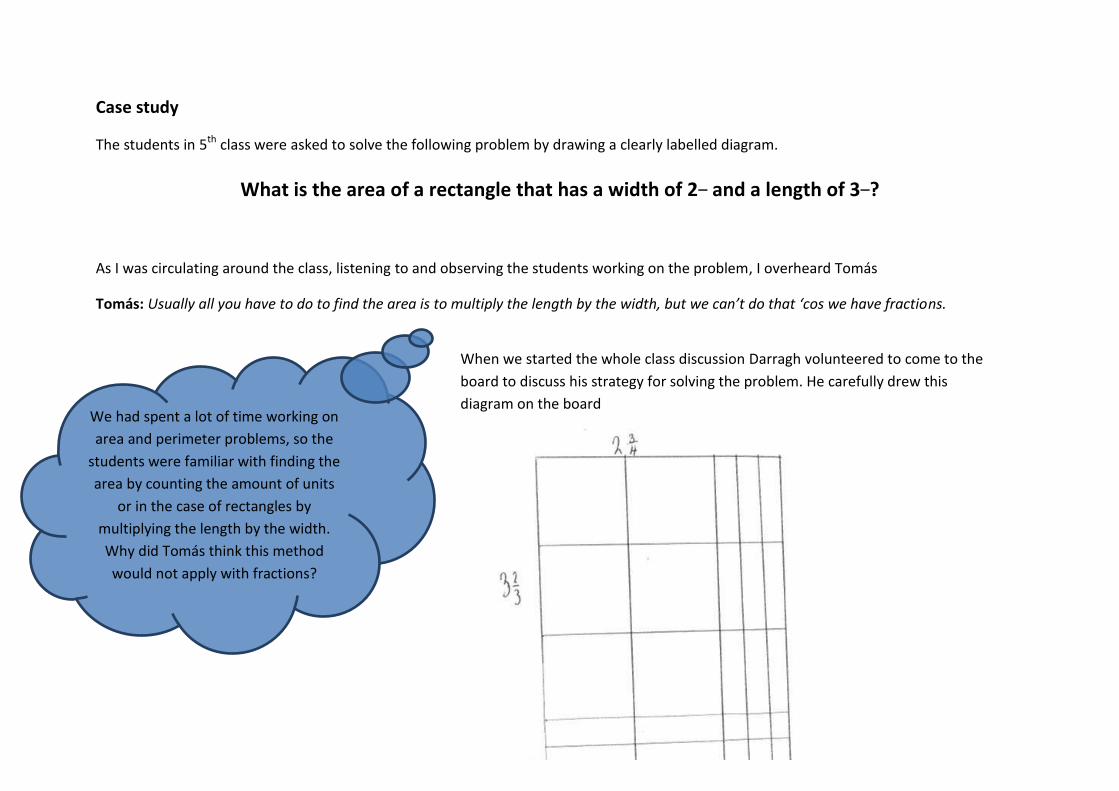
The students in 5th class were asked to solve the following problem by drawing a clearly labelled diagram.
What is the area of a rectangle that has a width of 2 and a length of 3 ?
As I was circulating around the class, listening to and observing the students working on the problem, I overheard Tomás
Tomás: Usually all you have to do to find the area is to multiply the length by the width, but we can’t do that ‘cos we have fractions.
We had spent a lot of time working on
area and perimeter problems, so the
students were familiar with finding the
area by counting the amount of units
or in the case of rectangles by
multiplying the length by the width.
Why did Tomás think this method
would not apply with fractions?
When we started the whole class discussion Darragh volunteered to come to the
board to discuss his strategy for solving the problem. He carefully drew this
diagram on the board
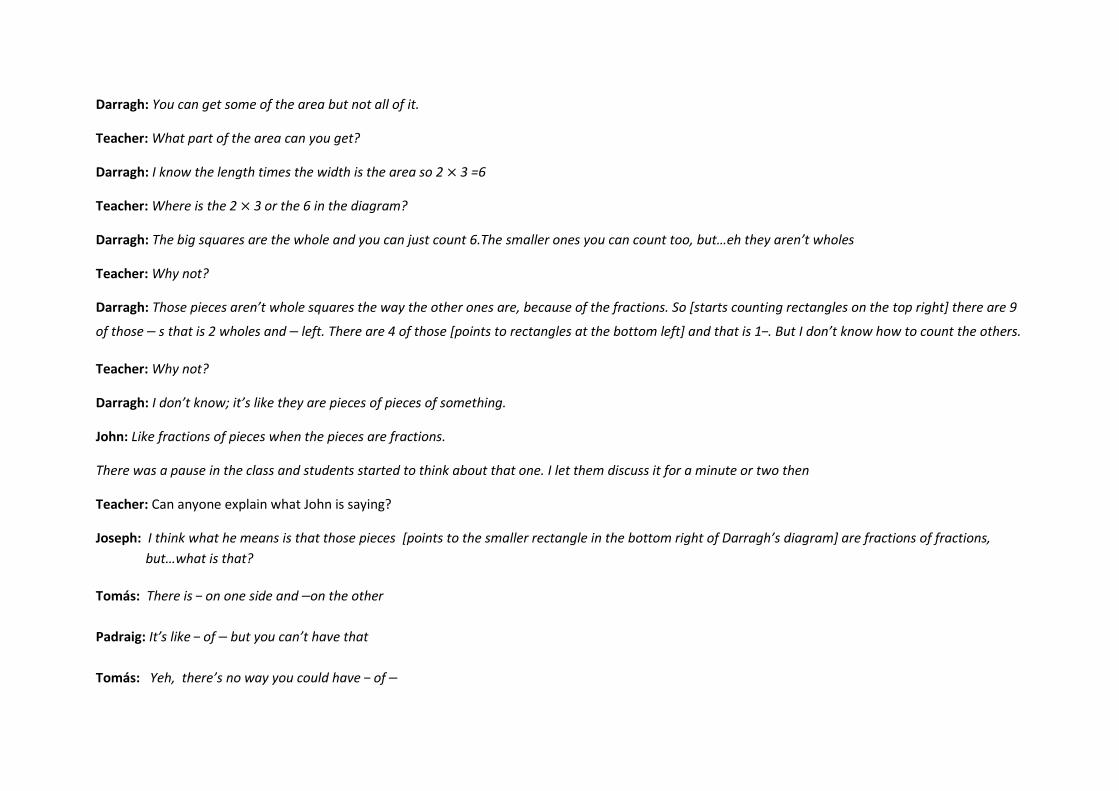
Darragh: You can get some of the area but not all of it.
Teacher: What part of the area can you get?
Darragh: I know the length times the width is the area so 2 3 =6
Teacher: Where is the 2 3 or the 6 in the diagram?
Darragh: The big squares are the whole and you can just count 6.The smaller ones you can count too, but…eh they aren’t wholes
Teacher: Why not?
Darragh: Those pieces aren’t whole squares the way the other ones are, because of the fractions. So [starts counting rectangles on the top right] there are 9
of those s that is 2 wholes and left. There are 4 of those [points to rectangles at the bottom left] and that is 1 . But I don’t know how to count the others.
Teacher: Why not?
Darragh: I don’t know; it’s like they are pieces of pieces of something.
John: Like fractions of pieces when the pieces are fractions.
There was a pause in the class and students started to think about that one. I let them discuss it for a minute or two then
Teacher: Can anyone explain what John is saying?
Joseph: I think what he means is that those pieces [points to the smaller rectangle in the bottom right of Darragh’s diagram] are fractions of fractions,
but…what is that?
Tomás: There is on one side and on the other
Padraig: It’s like of but you can’t have that
Tomás: Yeh, there’s no way you could have of
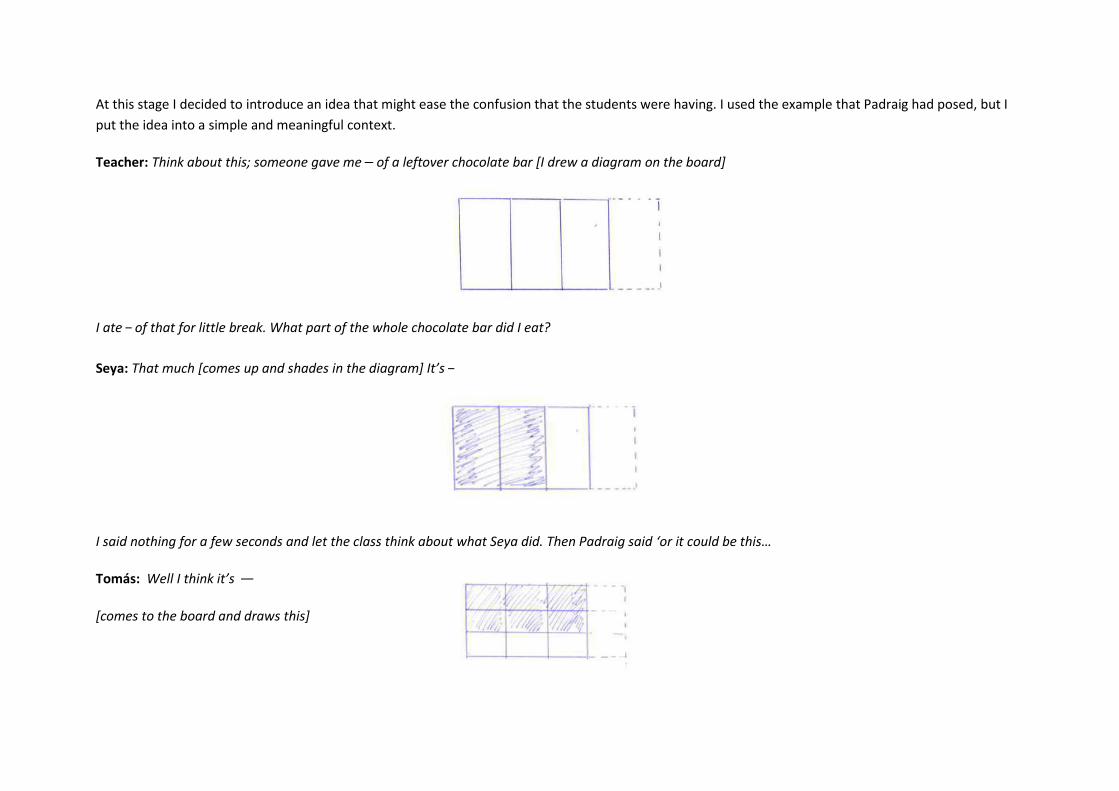
At this stage I decided to introduce an idea that might ease the confusion that the students were having. I used the example that Padraig had posed, but I
put the idea into a simple and meaningful context.
Teacher: Think about this; someone gave me of a leftover chocolate bar [I drew a diagram on the board]
I ate of that for little break. What part of the whole chocolate bar did I eat?
Seya: That much [comes up and shades in the diagram] It’s
I said nothing for a few seconds and let the class think about what Seya did. Then Padraig said ‘or it could be this…
Tomás: Well I think it’s
[comes to the board and draws this]
We spent some time deciding which diagram was “right”. There were interesting discussions which I allowed to continue until the idea that both diagrams
were equivalent was more comfortable for them. When we returned to the original problem it was decided unanimously that you could indeed find the
area of the entire region by naming all the little bits and counting them.
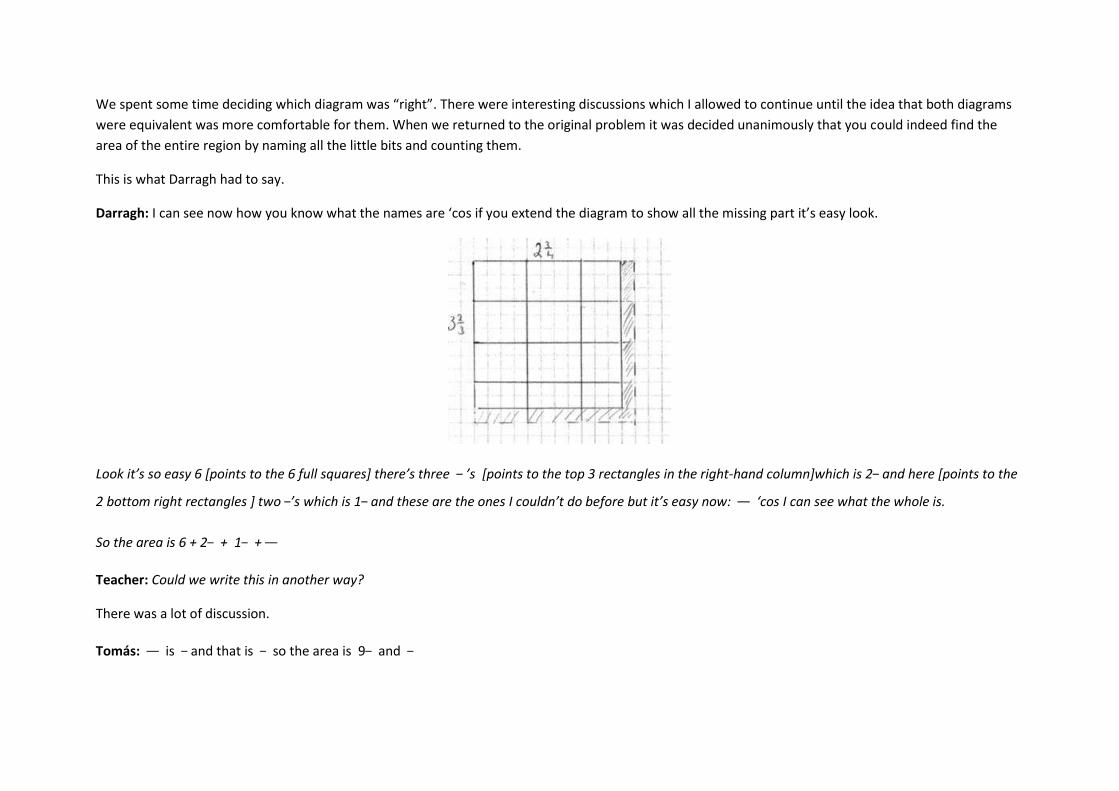
This is what Darragh had to say.
Darragh: I can see now how you know what the names are ‘cos if you extend the diagram to show all the missing part it’s easy look.
Look it’s so easy 6 [points to the 6 full squares] there’s three ’s [points to the top 3 rectangles in the right-hand column]which is 2 and here [points to the
2 bottom right rectangles ] two ’s which is 1 and these are the ones I couldn’t do before but it’s easy now: ‘cos I can see what the whole is.
So the area is 6 + 2 + 1 +
Teacher: Could we write this in another way?
There was a lot of discussion.
Tomás: is and that is so the area is 9 and
Teacher: Can everyone see Tomás’s answer in the diagram?
At this stage there was a lot of discussion as the students tried to show the 9 and in the diagram. Then Seya said:
Seya: When you look at the diagram it’s easier just to say , just one number. Llook it’s easier [points to the diagram]
John: Yeh, the diagram gives you Seya’s and the sums give you Tomás’s.
Thoughts for teachers:
What prior knowledge should your students bring to the task?
Are your students ready for this task?
How would you use this task with your students?
What mathematics do you want your students to learn from engaging in this task?
What do you think your students might find difficult about this task?
What questions might you ask as your students as they are working on the task

Key Concepts in Mathematics – Partitioning
If these concepts are not fully developed, students will find it difficult to engage meaningfully with core aspects of the Number, Algebra and Functions strands in later years.
Partitioning: A deep understanding of how fractions are made, named and renamed.
It provides the connection between fractions and the sharing or partititive idea of division, and to
multiplicative thinking more generally.
How does the concept develop? Even before they come to school many young children
show an awareness of fraction names such as half and quarter. During the first years of schooling,
most will be able to halve a piece of paper, identify three-quarters of an orange and talk about parts
of recognised wholes (e.g., bars of chocolate, pizzas, cakes, etc). Beware! Teachers and parents
often think, then, that children understand the relationships inherent in fraction representations. For
many children, however, they are simply using these terms to describe and number well-known
objects. They may not be aware of or even paying any attention to the key ideas involved in a more
general understanding of fractions. That is, that
equal parts are involved
the number of parts names the parts
as the number of parts of a given whole is increased, the size of each part (or share) gets
smaller.
Partitioning builds on ‘region’ and ‘area’ models of multiplication and is a necessary link in building
fraction knowledge and confidence. The area model leads to the ‘by’ or ‘for each’ idea and, more
generally, the factor-factor-product idea of multiplication and division, which regards multiplication
and division as inverse operations. This is the idea needed to support all further work with rational
numbers and in algebra.
Partitioning, therefore, is more than just the experience of physically dividing continuous and discrete
wholes into equal parts; it also involves generalising that experience so that students can create their
own fraction diagrams and representations on a number line and can understand the key ideas
mentioned above.
A well-developed capacity to partition regions and lines into any number of equal parts supports
fraction renaming and justifies the use of multiplication in this process. The concept of partitioning is
best developed when students make their own fraction diagrams rather than interpreting those
produced by others. Halving, thirding and fifthing are partitioning strategies that students can
engage with that facilitate the development of understanding.
Encourage students to reflect and share their strategies, because
verbalising brings the strategy to a conscious level and the student learns about their own
thinking
other students are given the opportunity to pick up a new strategy
the teacher is given an opportunity to assess the type of thinking taking place and so can
adjust the teaching accordingly.
Read the case studies and tasks for ideas on how you can support and track your students’ development of the concept of partitioning.
Read an interview with a teacher and find out how she helped her students develop the
concept of partitioning by engaging them in a rich task that required them to use
representation to help reason and justify their ideas.
What mathematics did you want your students to learn from engaging with this task?
Well ultimately I want my students to be able to operate efficiently on rational numbers and
to understand the algorithms we commonly use, in order to do this they need a well-
developed concept of partitioning. This task gives me an opportunity to assess this
conceptual understanding in order to progress the learning whilst at the same time helping
students make connections with their previous mathematical experiences. I’m hoping for a
few ah ha moments. All the students have dealt with fractions in Primary school but I’m not
sure about their conceptual understanding, judging from their errors I suspect it’s quite
poor
The syllabus learning outcomes the students will be working on are
investigate models to help think about the operations of addition, subtraction,multiplication and division of rational numbers
consolidate the idea that equality is a relationship in which two mathematicalexpressions hold the same value
engage with the idea of mathematical proof
use the equivalence of fractions, decimals and percentages to compare proportions
explore patterns and formulate conjectures
explain findings
justify conclusions
communicate mathematics verbally and in written form
apply their knowledge and skills to solve problems in familiar and unfamiliar contexts
Task
Using only the coloured card provided make 3 . Write 3 in as many
ways as you can and justify your naming using your poster.

How did you manage the task in your class? I divided the class into groups of 4 and gave
each group a task. The tasks were similar in so much as each group was required to make a
rational number greater than 1 from a piece of A4 coloured card and then rename the
rational number in as many ways as they could. The tasks differed in difficulty as each group
was given a different rational number to represent.
What did you find interesting about the students’ approach to the task? I was surprised at
how difficult the students found the task. They really grappled with the concept of ‘the unit’
I heard comments such as But we only have one piece of card how can we show 2 with
only I piece of card?.
Many students’ work displayed evidence of the fact that they did not understand the
concept of equal sizes and students’ work lacked precision.
How did you help the students’ get over their initial difficulties so that they could access
the task?
Some groups were really not in a position to engage with this task and I simplified it for
these students by changing the focus fraction to one less than 1.
The following is an extract of a discussion with the group of students who were concerned
that they needed more sheets of card
Me: Well how many pieces do you need then Josh?
Josh: ehm well 10 ..
Me: Why 10?
Josh: Because then 3 of them would be
Me: But you are to make a poster of 2 So what about the 2
Josh: Then just 2 more
Me: So what would your poster look like then?
Josh: ehm 5 sheets
Me: [To the group] Would you agree with Josh?
When there was no real commitment to an answer from the group I engaged the whole
class. I asked Josh to explain his thinking to the class.
Erica: I don’t think that is right …..cos that means 3 Sheets are and then 2 sheets are 2 wholes
Me: So what do you think the 5 sheets would be?
Erica: ehm
Sorcha: That’s
There was much discussion about the fact that 5 sheets of paper would be and eventually
Josh said
Josh: Ye so 5 is a half and 10 is a whole so I would need 20 sheets to make 2 so I need 23 sheets to make 2
Me: So what would your poster look like?
Josh: 23 sheets of card
I drew 23 squares on the board each representing a piece of card and said to the whole class
Is it clear that this is a ‘picture’ of 2
The majority of students looked confused and said no. Josh was prepared to defend his
work, I was pleased about this.
Josh: It is if you know that 10 sheets is 1 whole..you could do a key.
Me: That is true but could we make 2 in a way that everyone could see it was 2 without the need for a
key?
I left the groups working on this for a while it was interesting to see the struggles , they just could not see how
to deal with the 2, they could make and a breakthrough came when Erica spoke.
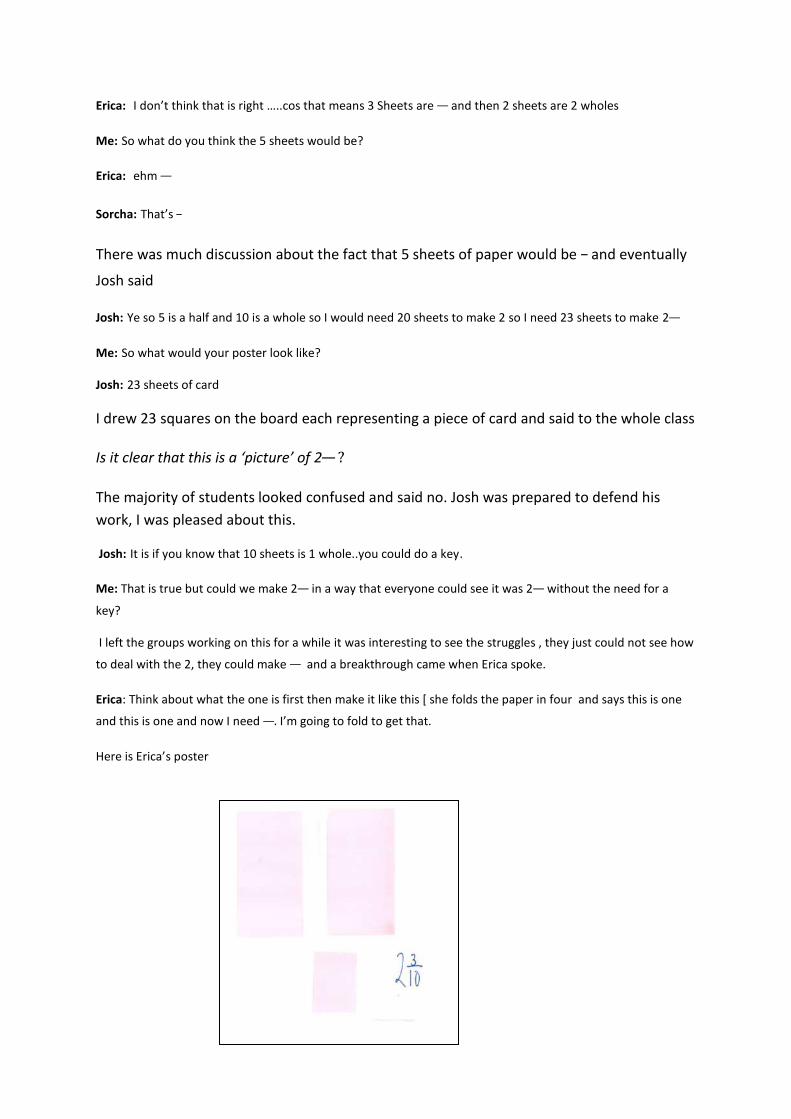
Erica: Think about what the one is first then make it like this [ she folds the paper in four and says this is one
and this is one and now I need I’m going to fold to get that.
Here is Erica’s poster
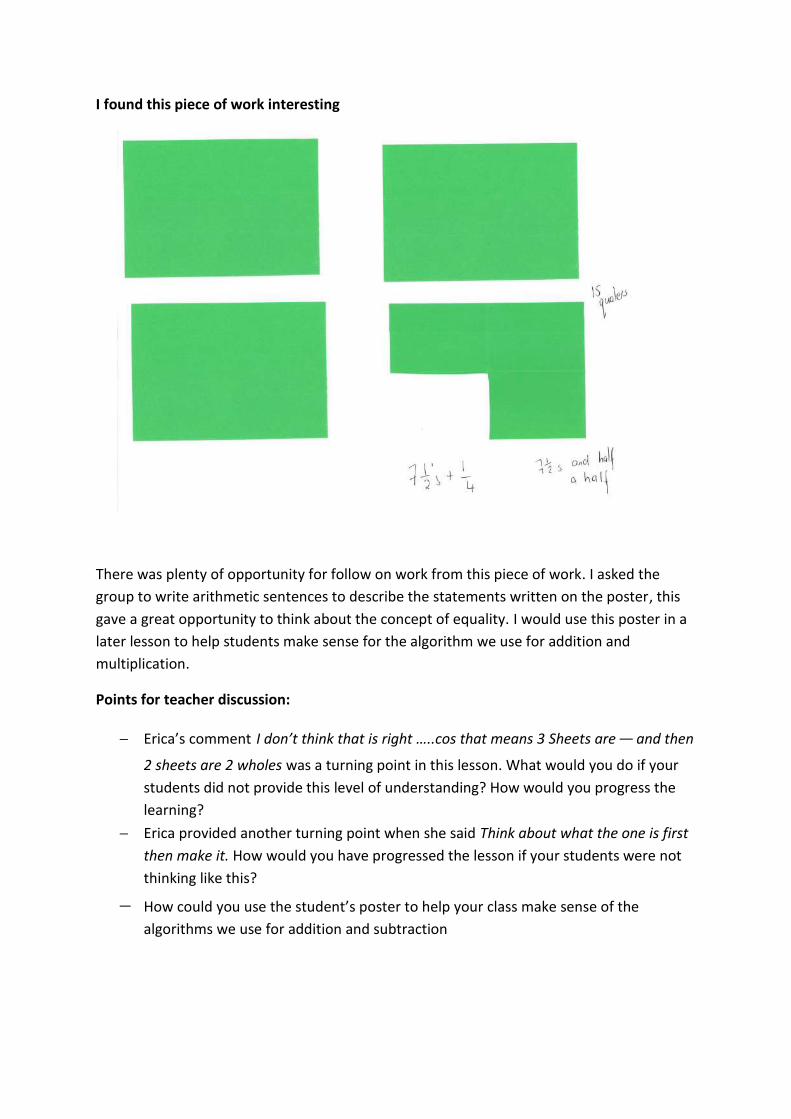
I found this piece of work interesting
There was plenty of opportunity for follow on work from this piece of work. I asked the
group to write arithmetic sentences to describe the statements written on the poster, this
gave a great opportunity to think about the concept of equality. I would use this poster in a
later lesson to help students make sense for the algorithm we use for addition and
multiplication.
Points for teacher discussion:
Erica’s comment I don’t think that is right …..cos that means 3 Sheets are and then
2 sheets are 2 wholes was a turning point in this lesson. What would you do if your
students did not provide this level of understanding? How would you progress the
learning?
Erica provided another turning point when she said Think about what the one is first
then make it. How would you have progressed the lesson if your students were not
thinking like this?
How could you use the student’s poster to help your class make sense of the
algorithms we use for addition and subtraction
Key Concepts in Mathematics –
Proportional Reasoning If these concepts are not fully developed, students will find it very difficult to engage meaningfully with core aspects of the Number, Algebra and Functions strands in later years.
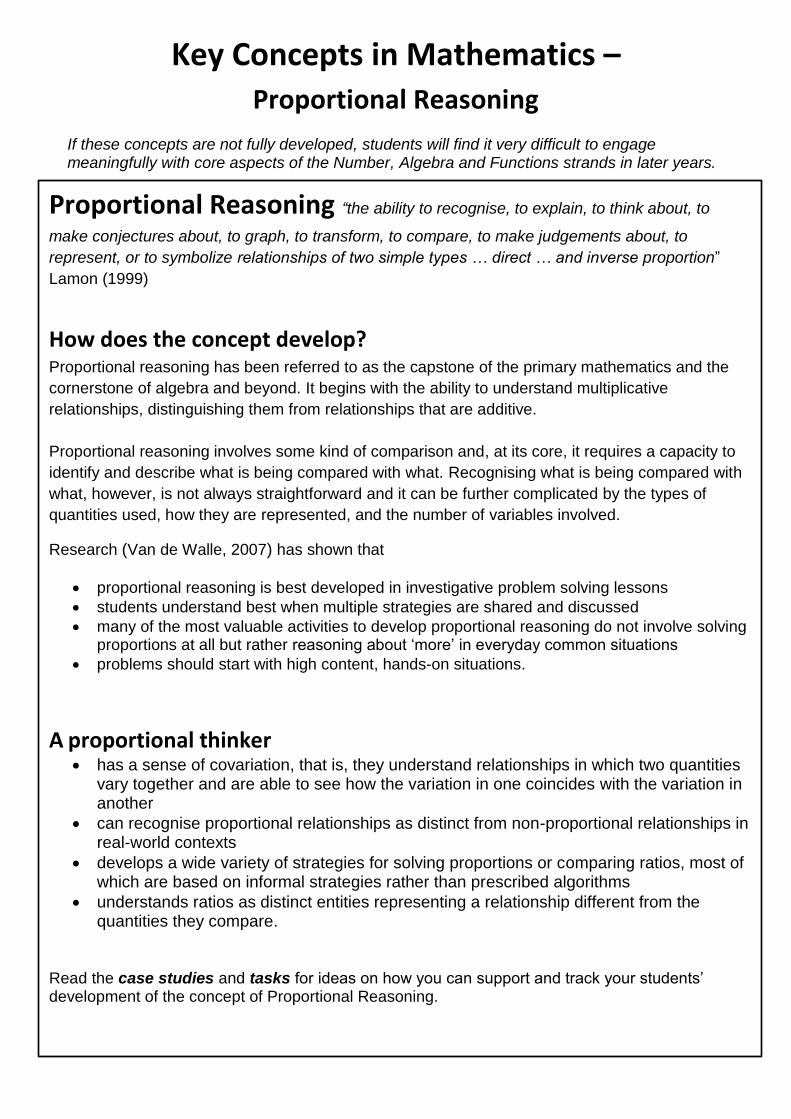
Proportional Reasoning “the ability to recognise, to explain, to think about, to
make conjectures about, to graph, to transform, to compare, to make judgements about, to
represent, or to symbolize relationships of two simple types … direct … and inverse proportion”
Lamon (1999)
How does the concept develop? Proportional reasoning has been referred to as the capstone of the primary mathematics and the
cornerstone of algebra and beyond. It begins with the ability to understand multiplicative
relationships, distinguishing them from relationships that are additive.
Proportional reasoning involves some kind of comparison and, at its core, it requires a capacity to
identify and describe what is being compared with what. Recognising what is being compared with
what, however, is not always straightforward and it can be further complicated by the types of
quantities used, how they are represented, and the number of variables involved.
Research (Van de Walle, 2007) has shown that
proportional reasoning is best developed in investigative problem solving lessons
students understand best when multiple strategies are shared and discussed
many of the most valuable activities to develop proportional reasoning do not involve solvingproportions at all but rather reasoning about ‘more’ in everyday common situations
problems should start with high content, hands-on situations.
A proportional thinker has a sense of covariation, that is, they understand relationships in which two quantities
vary together and are able to see how the variation in one coincides with the variation inanother
can recognise proportional relationships as distinct from non-proportional relationships inreal-world contexts
develops a wide variety of strategies for solving proportions or comparing ratios, most ofwhich are based on informal strategies rather than prescribed algorithms
understands ratios as distinct entities representing a relationship different from thequantities they compare.
Read the case studies and tasks for ideas on how you can support and track your students’ development of the concept of Proportional Reasoning.
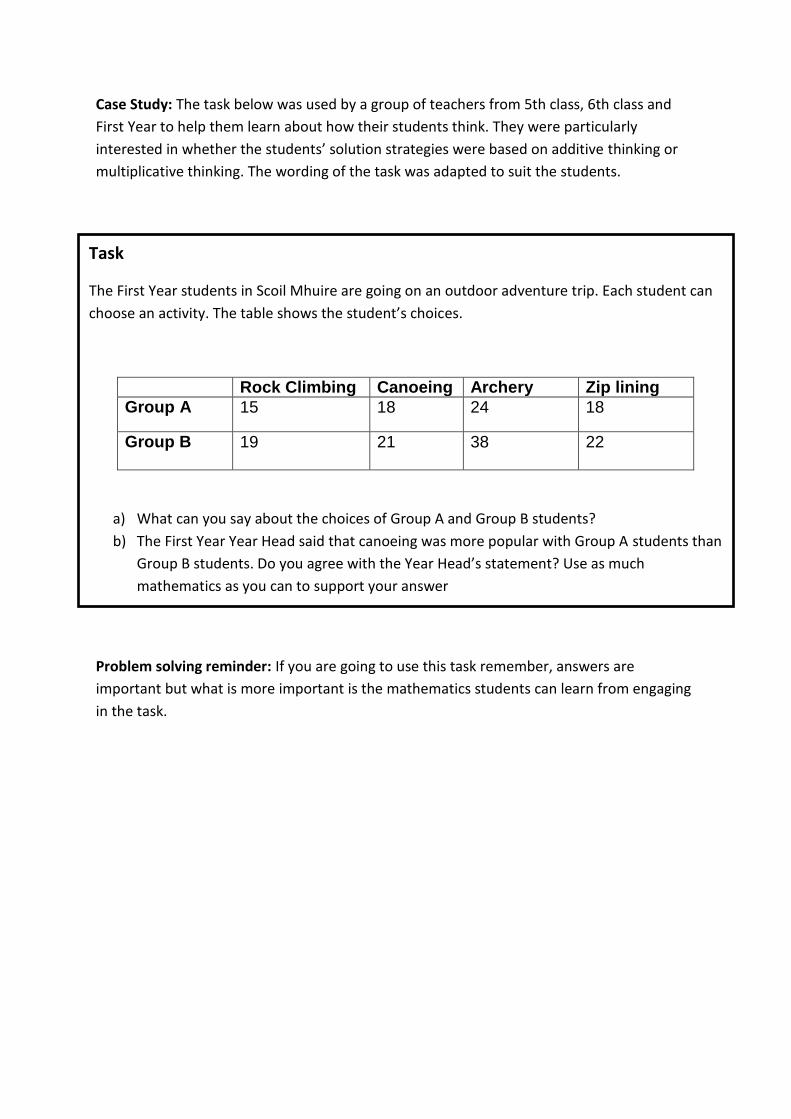
Case Study: The task below was used by a group of teachers from 5th class, 6th class and
First Year to help them learn about how their students think. They were particularly
interested in whether the students’ solution strategies were based on additive thinking or
multiplicative thinking. The wording of the task was adapted to suit the students.
Problem solving reminder: If you are going to use this task remember, answers are
important but what is more important is the mathematics students can learn from engaging
in the task.
Task
The First Year students in Scoil Mhuire are going on an outdoor adventure trip. Each student can
choose an activity. The table shows the student’s choices.
Rock Climbing Canoeing Archery Zip lining
Group A 15 18 24 18
Group B 19 21 38 22
a) What can you say about the choices of Group A and Group B students?
b) The First Year Year Head said that canoeing was more popular with Group A students than
Group B students. Do you agree with the Year Head’s statement? Use as much
mathematics as you can to support your answer
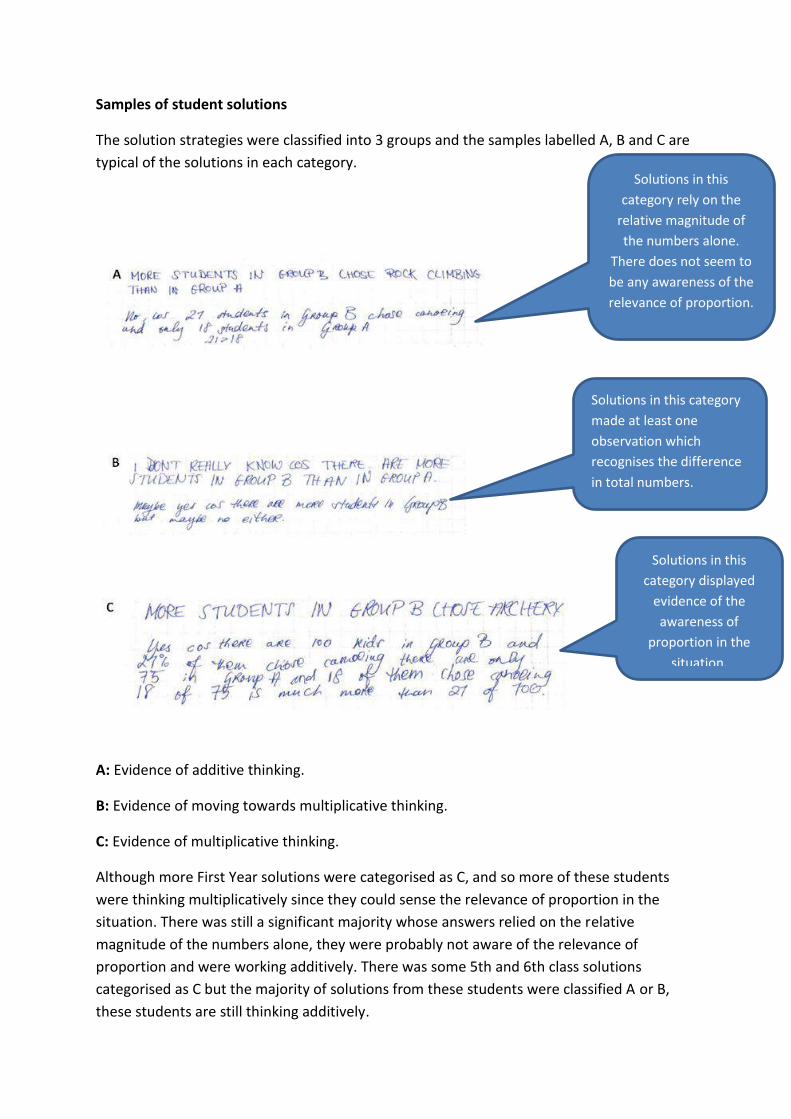
Samples of student solutions
The solution strategies were classified into 3 groups and the samples labelled A, B and C are
typical of the solutions in each category.
A: Evidence of additive thinking.
B: Evidence of moving towards multiplicative thinking.
C: Evidence of multiplicative thinking.
Although more First Year solutions were categorised as C, and so more of these students
were thinking multiplicatively since they could sense the relevance of proportion in the
situation. There was still a significant majority whose answers relied on the relative
magnitude of the numbers alone, they were probably not aware of the relevance of
proportion and were working additively. There was some 5th and 6th class solutions
categorised as C but the majority of solutions from these students were classified A or B,
these students are still thinking additively.
Solutions in this
category rely on the
relative magnitude of
the numbers alone.
There does not seem to
be any awareness of the
relevance of proportion.
Solutions in this category
made at least one
observation which
recognises the difference
in total numbers.
Solutions in this
category displayed
evidence of the
awareness of
proportion in the
situation.
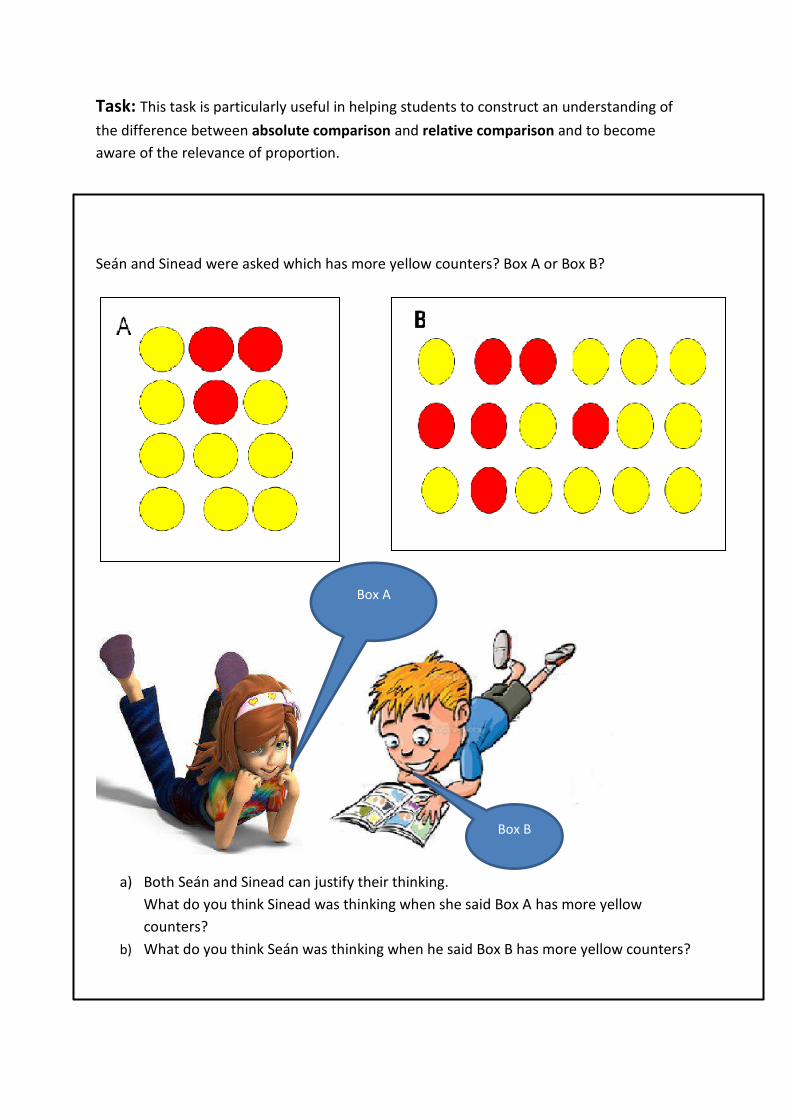
Task: This task is particularly useful in helping students to construct an understanding of
the difference between absolute comparison and relative comparison and to become
aware of the relevance of proportion.
Seán and Sinead were asked which has more yellow counters? Box A or Box B?
a) Both Seán and Sinead can justify their thinking.
What do you think Sinead was thinking when she said Box A has more yellow
counters?
b) What do you think Seán was thinking when he said Box B has more yellow counters?
Box A
Box B
Thoughts for teachers:
How might a multiplicative (relative) thinker respond to this task?
How might they justify their reasoning?
How might an additive thinker explain what Sinead was thinking?
How might they justify their reasoning?
How can you help an additive thinker explain what Sineád was thinking?
Here are some ideas to help additive thinkers begin to think multiplicatively
Q. What proportion of the box is taken up with yellow counters?
Encourage answers like
Box A has 9 yellows out of 12 counters whilst Box B has 12 yellows out of 18 counters
Which is bigger?
Encourage learners to draw diagrams to compare these.
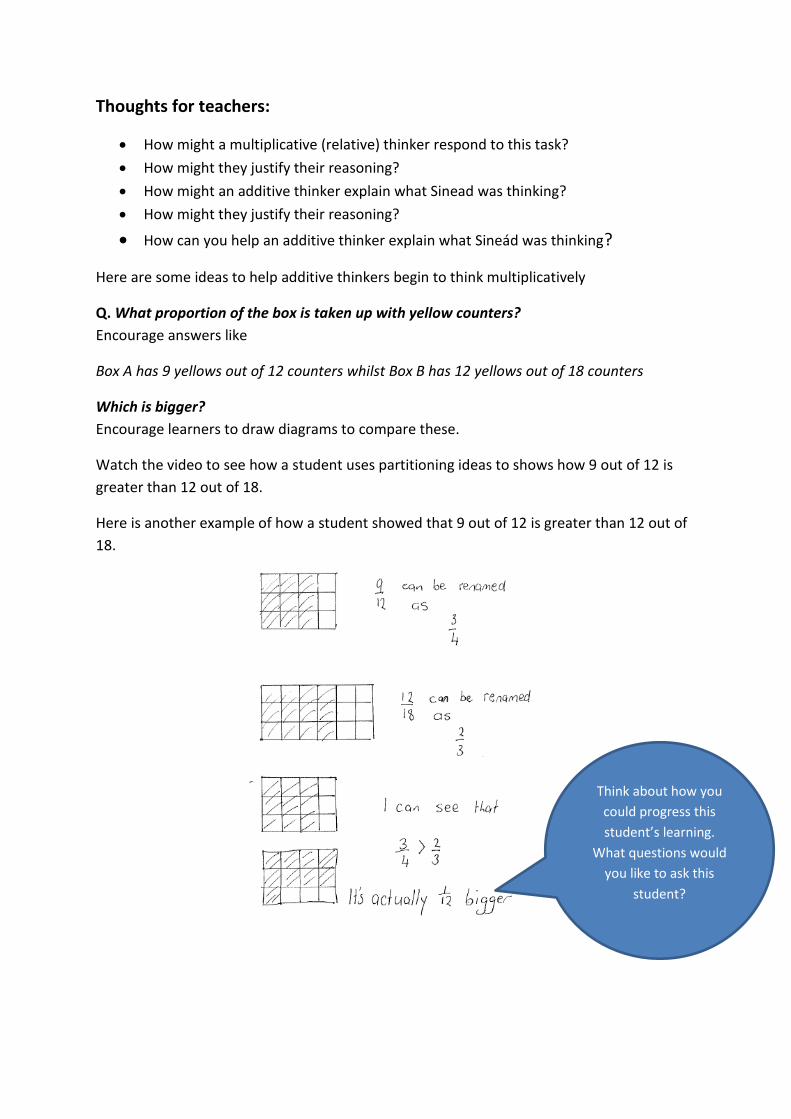
Watch the video to see how a student uses partitioning ideas to shows how 9 out of 12 is
greater than 12 out of 18.
Here is another example of how a student showed that 9 out of 12 is greater than 12 out of
18.
Think about how you
could progress this
student’s learning.
What questions would
you like to ask this
student?
Think about the prior knowledge each of these student has brought to this task. Both
students have developed the concept of partitioning. A well -developed capacity to partition
regions and lines into any number of equal parts supports fraction renaming and justifies
the use of multiplication in this process. It is clear from the student work that they can easily
rename fractions.
When the student was asked how do you know from this diagram that nine twelfths can be
renamed as three quarters? The response was; Look see the twelfths are the squares and
there is 9 of them and the columns are the quarters see there are 3 of them so they are the
same is the same as .
Revisit Partitioning for tasks that you can do with your students to help develop the concept
of partitioning.
Problem solving reminder: If you are going to use this task remember, answers are
important but what is more important is the mathematics students can learn from engaging
with the task.
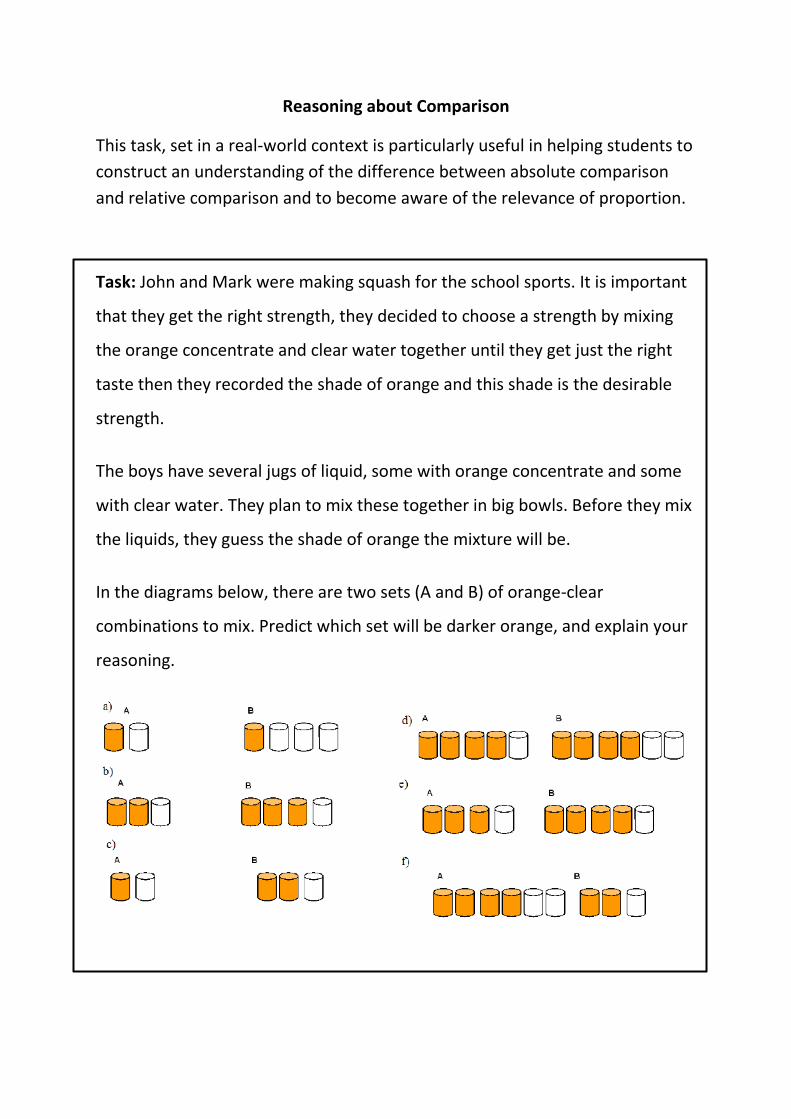
Reasoning about Comparison
This task, set in a real-world context is particularly useful in helping students to
construct an understanding of the difference between absolute comparison
and relative comparison and to become aware of the relevance of proportion.
Task: John and Mark were making squash for the school sports. It is important
that they get the right strength, they decided to choose a strength by mixing
the orange concentrate and clear water together until they get just the right
taste then they recorded the shade of orange and this shade is the desirable
strength.
The boys have several jugs of liquid, some with orange concentrate and some
with clear water. They plan to mix these together in big bowls. Before they mix
the liquids, they guess the shade of orange the mixture will be.
In the diagrams below, there are two sets (A and B) of orange-clear
combinations to mix. Predict which set will be darker orange, and explain your
reasoning.
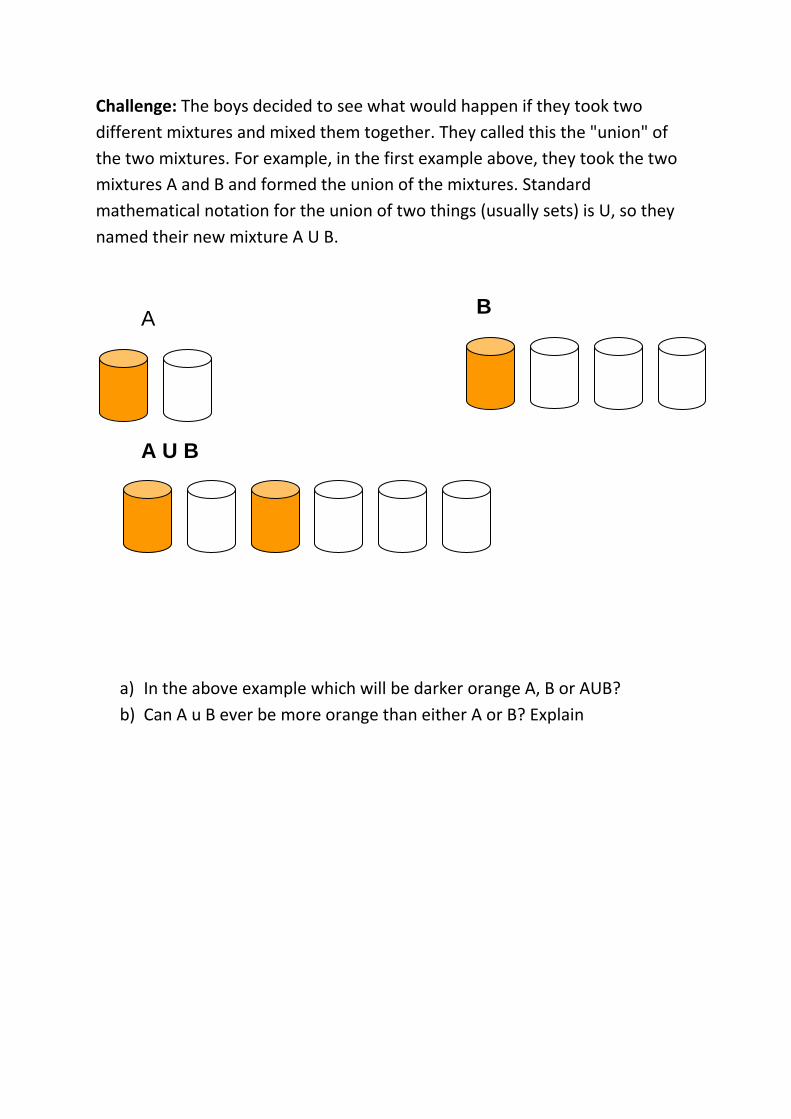
Challenge: The boys decided to see what would happen if they took two
different mixtures and mixed them together. They called this the "union" of
the two mixtures. For example, in the first example above, they took the two
mixtures A and B and formed the union of the mixtures. Standard
mathematical notation for the union of two things (usually sets) is U, so they
named their new mixture A U B.
a) In the above example which will be darker orange A, B or AUB?
b) Can A u B ever be more orange than either A or B? Explain
B A
A U B
Thoughts for teachers
How would you use these tasks with your students?
What mathematics do you want your students to learn from engaging
with these tasks?
What prior knowledge should your students bring to the task?
What do you think your students might find difficult about this task?
What questions might you ask as your students as they are working on
the task
o How might an additive thinker answer which is darker orange?
o How might they justify their reasoning?
o How might a multiplicative (relative) thinker respond to this task?
o How might they justify their reasoning? How could you extend
those who reason multiplicatively about more?
o How could you help those who reason additively begin to think
multiplicatively about comparison?
Problem solving reminder: If you are going to use these tasks remember,
answers are important but what is more important is the mathematics
students can learn from engaging with the tasks.
Task:
The activity below is designed to promote discussion around the concept of
“more” and to provide an opportunity for learners to reason multiplicatively
(relative comparison) about comparison.
Thoughts for teachers:
What mathematics do you want your students to learn from engaging
with this task?
When would you decide to use this task with your students?
What prior knowledge should your students bring to the task?
What do you think your students might find difficult about this task?
What questions might you ask as your students as they are working on
the task
o How might an additive thinker answer which is the coke table?
o How might they justify their reasoning?
o How might a multiplicative (relative) thinker respond to this task?
o How might they justify their reasoning?
What are the features of this task that make it good for enagaging
students in discussion around the idea of ‘more’
How would you manage this task in a mixed ability setting?
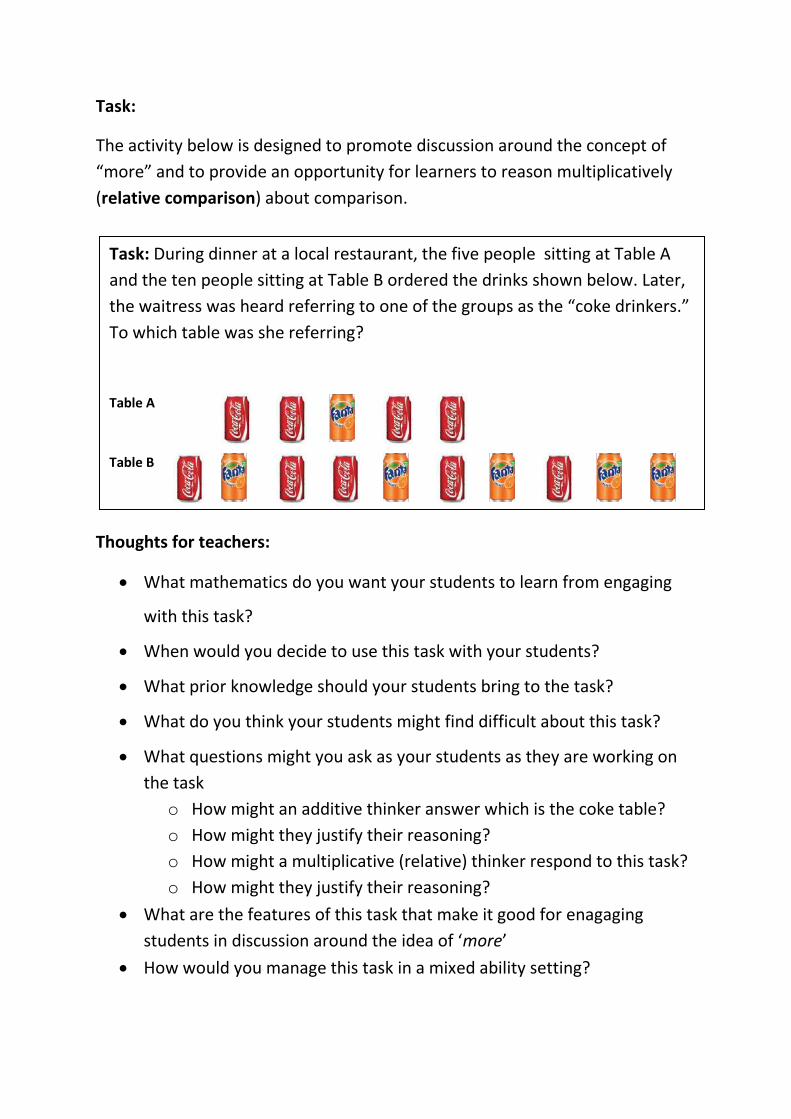
Task: During dinner at a local restaurant, the five people sitting at Table A
and the ten people sitting at Table B ordered the drinks shown below. Later,
the waitress was heard referring to one of the groups as the “coke drinkers.”
To which table was she referring?
Table A
Table B

o How could you extend those who reason multiplicatively about
‘more’?
o How could you help those who reason additively begin to think
multiplicatively about comparison?
Problem solving reminder: If you are going to use this task remember,
answers are important but what is more important is the mathematics
students can learn from engaging with the tasks.
Key Concepts in Mathematics - Generalising
If these concepts are not fully developed students’ will find it difficult to engage meaningfully with core aspects of the Number, Algebra and Functions strands in later years
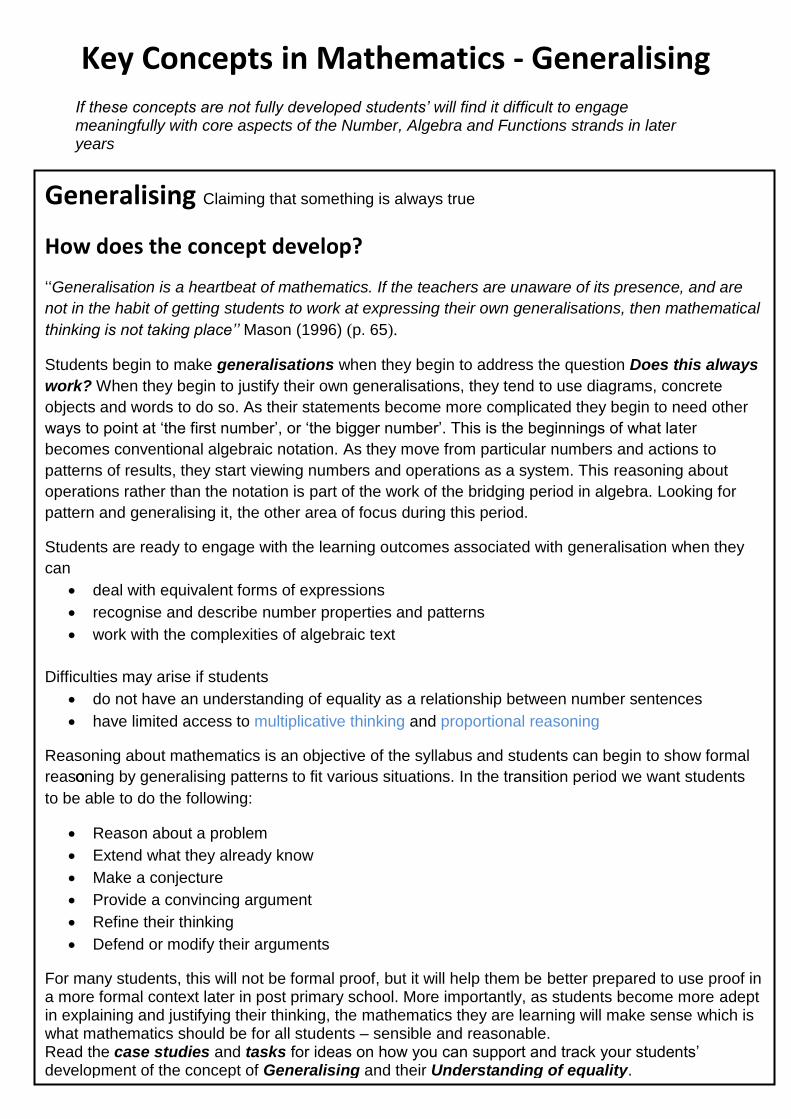
Generalising Claiming that something is always true
How does the concept develop?
‘‘Generalisation is a heartbeat of mathematics. If the teachers are unaware of its presence, and are
not in the habit of getting students to work at expressing their own generalisations, then mathematical
thinking is not taking place’’ Mason (1996) (p. 65).
Students begin to make generalisations when they begin to address the question Does this always
work? When they begin to justify their own generalisations, they tend to use diagrams, concrete
objects and words to do so. As their statements become more complicated they begin to need other
ways to point at ‘the first number’, or ‘the bigger number’. This is the beginnings of what later
becomes conventional algebraic notation. As they move from particular numbers and actions to
patterns of results, they start viewing numbers and operations as a system. This reasoning about
operations rather than the notation is part of the work of the bridging period in algebra. Looking for
pattern and generalising it, the other area of focus during this period.
Students are ready to engage with the learning outcomes associated with generalisation when they
can
deal with equivalent forms of expressions
recognise and describe number properties and patterns
work with the complexities of algebraic text
Difficulties may arise if students
do not have an understanding of equality as a relationship between number sentences
have limited access to multiplicative thinking and proportional reasoning
Reasoning about mathematics is an objective of the syllabus and students can begin to show formal
reaso oning by generalising patterns to fit various situations. In the transition period we want students
to be a ble to do the following:
Reason about a problem
Extend what they already know
Make a conjecture
Provide a convincing argument
Refine their thinking
Defend or modify their arguments
For many students, this will not be formal proof, but it will help them be better prepared to use proof in a more formal context later in post primary school. More importantly, as students become more adept in explaining and justifying their thinking, the mathematics they are learning will make sense which is what mathematics should be for all students – sensible and reasonable. Read the case studies and tasks for ideas on how you can support and track your students’ development of the concept of Generalising and their Understanding of equality.

Coherence and Continuity
The study of pattern and relationships can support students develop multiplicative thinking
and at the same time lead them smoothly into content traditionally taught at Senior Cycle such
as functions, sequences and series and calculus.
Case Study:
Teacher: I have a real mixed ability class. So I modified one of the Tasks that promote
multiplicative thinking and gave different versions to different groups. Here are the tasks I used.
Task A:
Scoil Phadraig Naofa is planning a school party. They have lots of small square tables. Each
table seats 4 people like this:
a) Make a line with 2 tables like this
How many people will able to sit at it? How many people will be able to sit at a similar line of
4 tables?
b) Make a line of tables that would seat 8 people. How many tables are needed?
Can you find another way to describe your results so far? Show this in the space below
c) Without making a line of tables how many tables would seat 14 people? Check youranswer by making a line of tables.
d) The school can borrow 99 tables. How many people could they seat using 99 tablesplaced end-to-end? Show your working and explain your answer in as much detail aspossible.
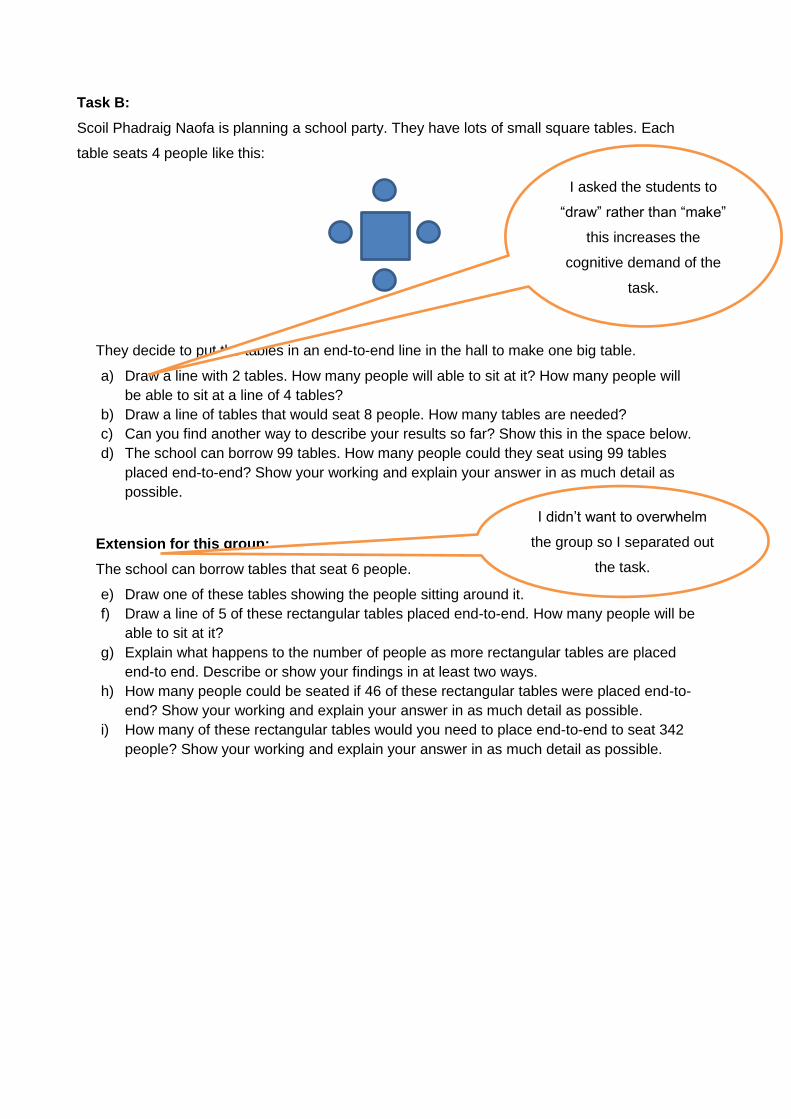
Task B:
Scoil Phadraig Naofa is planning a school party. They have lots of small square tables. Each
table seats 4 people like this:
They decide to put the tables in an end-to-end line in the hall to make one big table.
a) Draw a line with 2 tables. How many people will able to sit at it? How many people willbe able to sit at a line of 4 tables?
b) Draw a line of tables that would seat 8 people. How many tables are needed?c) Can you find another way to describe your results so far? Show this in the space below.d) The school can borrow 99 tables. How many people could they seat using 99 tables
placed end-to-end? Show your working and explain your answer in as much detail aspossible.
Extension for this group:
The school can borrow tables that seat 6 people.
e) Draw one of these tables showing the people sitting around it.f) Draw a line of 5 of these rectangular tables placed end-to-end. How many people will be
able to sit at it?g) Explain what happens to the number of people as more rectangular tables are placed
end-to end. Describe or show your findings in at least two ways.h) How many people could be seated if 46 of these rectangular tables were placed end-to-
end? Show your working and explain your answer in as much detail as possible.i) How many of these rectangular tables would you need to place end-to-end to seat 342
people? Show your working and explain your answer in as much detail as possible.
I asked the students to
“draw” rather than “make”
this increases the
cognitive demand of the
task.
I didn’t want to overwhelm
the group so I separated out
the task.
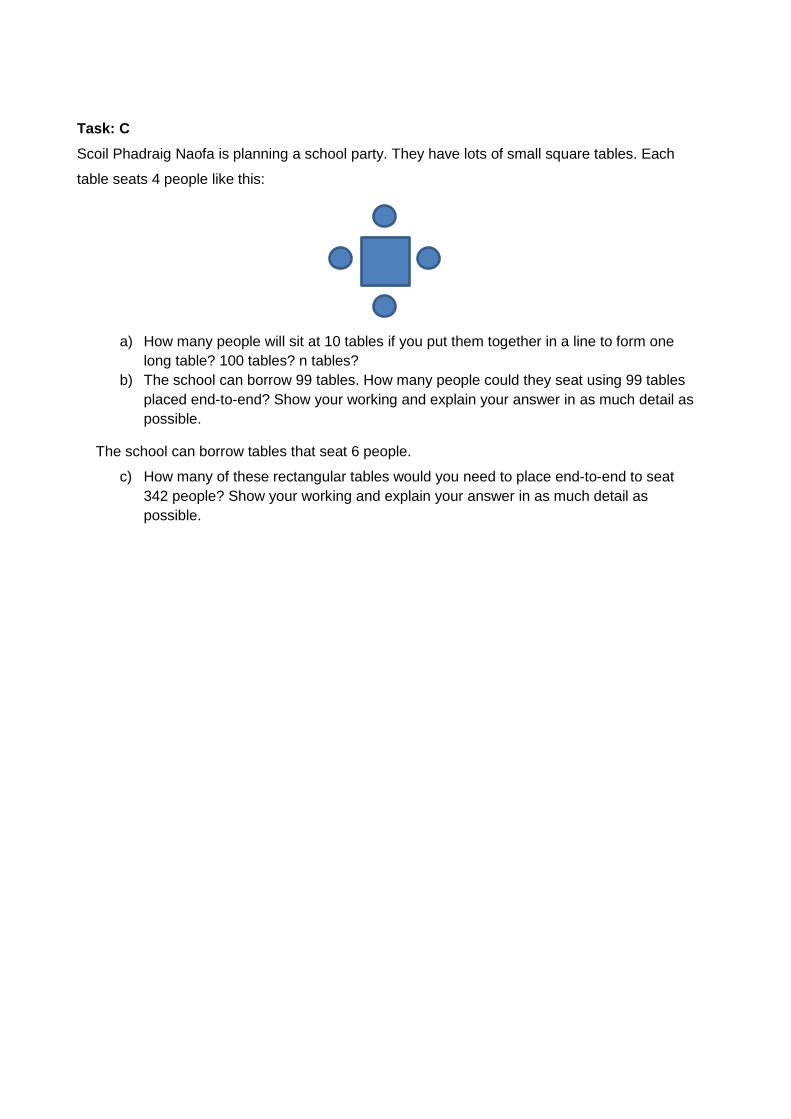
Task: C
Scoil Phadraig Naofa is planning a school party. They have lots of small square tables. Each
table seats 4 people like this:
a) How many people will sit at 10 tables if you put them together in a line to form onelong table? 100 tables? n tables?
b) The school can borrow 99 tables. How many people could they seat using 99 tablesplaced end-to-end? Show your working and explain your answer in as much detail aspossible.
The school can borrow tables that seat 6 people.
c) How many of these rectangular tables would you need to place end-to-end to seat342 people? Show your working and explain your answer in as much detail aspossible.
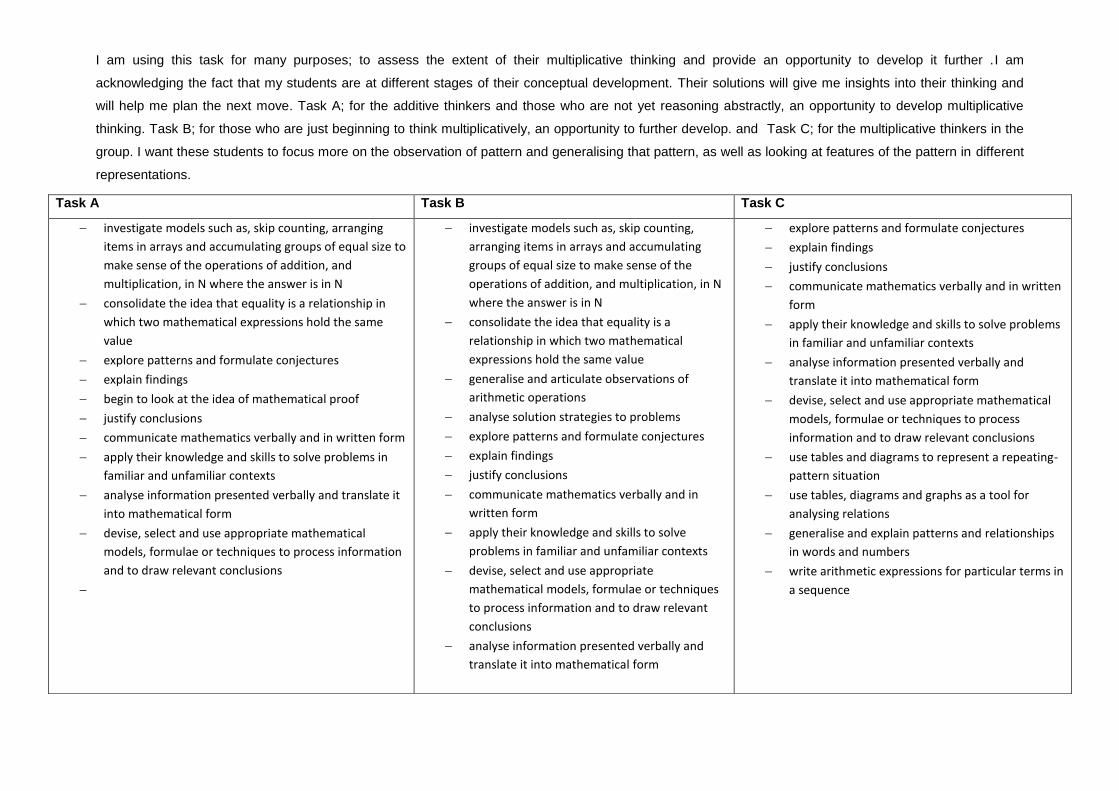
I am using this task for many purposes; to assess the extent of their multiplicative thinking and provide an opportunity to develop it further .I am
acknowledging the fact that my students are at different stages of their conceptual development. Their solutions will give me insights into their thinking and
will help me plan the next move. Task A; for the additive thinkers and those who are not yet reasoning abstractly, an opportunity to develop multiplicative
thinking. Task B; for those who are just beginning to think multiplicatively, an opportunity to further develop. and Task C; for the multiplicative thinkers in the
group. I want these students to focus more on the observation of pattern and generalising that pattern, as well as looking at features of the pattern in different
representations.
Task A Task B Task C
investigate models such as, skip counting, arranging
items in arrays and accumulating groups of equal size to
make sense of the operations of addition, and
multiplication, in N where the answer is in N
consolidate the idea that equality is a relationship in
which two mathematical expressions hold the same
value
explore patterns and formulate conjectures
explain findings
begin to look at the idea of mathematical proof
justify conclusions
communicate mathematics verbally and in written form
apply their knowledge and skills to solve problems in
familiar and unfamiliar contexts
analyse information presented verbally and translate it
into mathematical form
devise, select and use appropriate mathematical
models, formulae or techniques to process information
and to draw relevant conclusions
investigate models such as, skip counting,
arranging items in arrays and accumulating
groups of equal size to make sense of the
operations of addition, and multiplication, in N
where the answer is in N
consolidate the idea that equality is a
relationship in which two mathematical
expressions hold the same value
generalise and articulate observations of
arithmetic operations
analyse solution strategies to problems
explore patterns and formulate conjectures
explain findings
justify conclusions
communicate mathematics verbally and in
written form
apply their knowledge and skills to solve
problems in familiar and unfamiliar contexts
devise, select and use appropriate
mathematical models, formulae or techniques
to process information and to draw relevant
conclusions
analyse information presented verbally and
translate it into mathematical form
explore patterns and formulate conjectures
explain findings
justify conclusions
communicate mathematics verbally and in written
form
apply their knowledge and skills to solve problems
in familiar and unfamiliar contexts
analyse information presented verbally and
translate it into mathematical form
devise, select and use appropriate mathematical
models, formulae or techniques to process
information and to draw relevant conclusions
use tables and diagrams to represent a repeating-
pattern situation
use tables, diagrams and graphs as a tool for
analysing relations
generalise and explain patterns and relationships
in words and numbers
write arithmetic expressions for particular terms in
a sequence

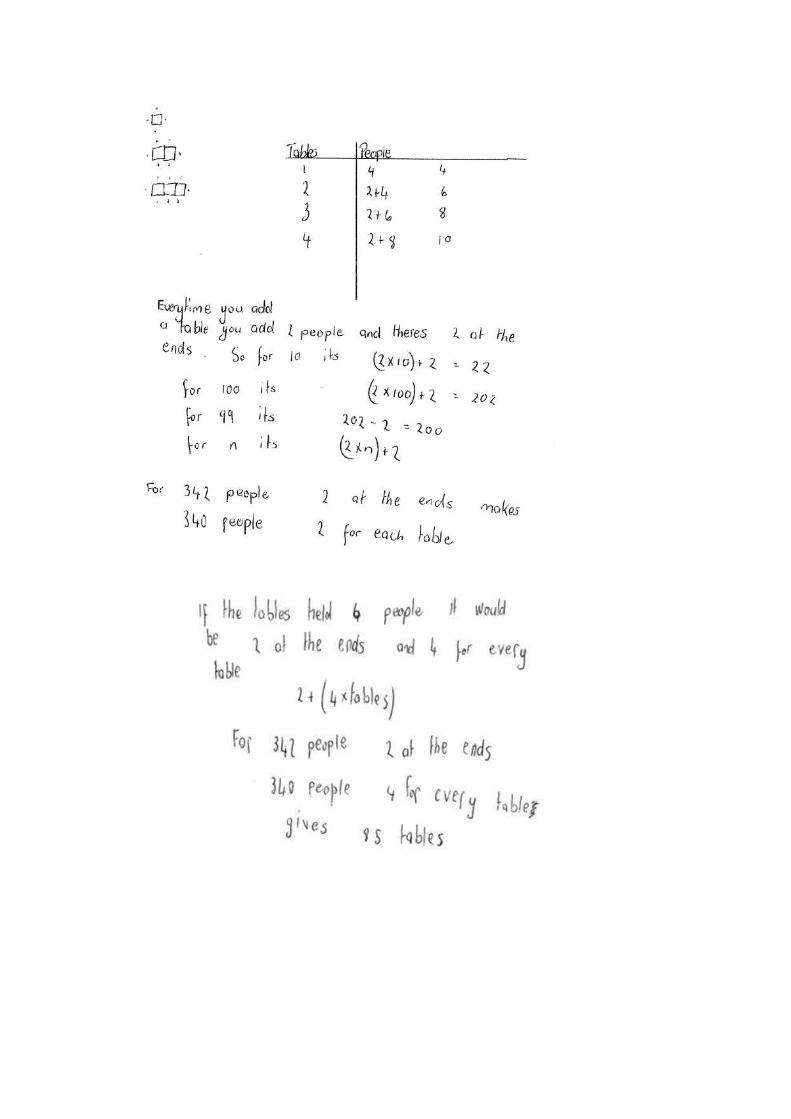
Student Work
Task B
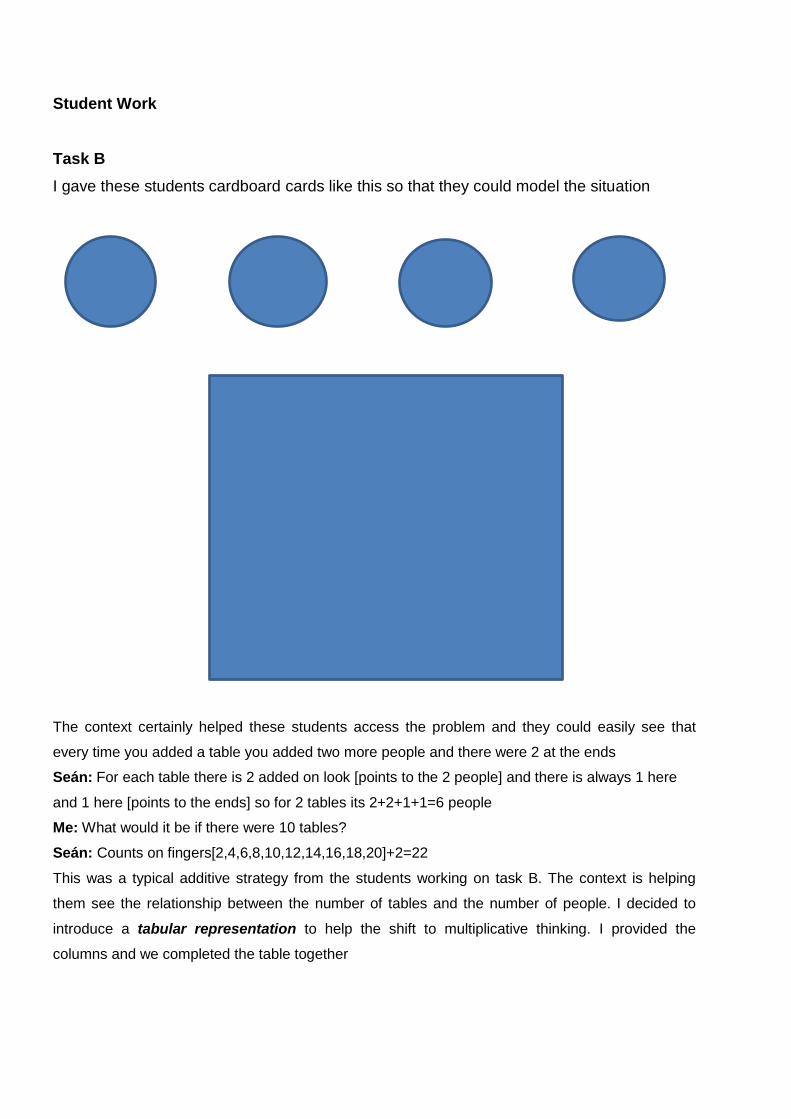
I gave these students cardboard cards like this so that they could model the situation
The context certainly helped these students access the problem and they could easily see that
every time you added a table you added two more people and there were 2 at the ends
Seán: For each table there is 2 added on look [points to the 2 people] and there is always 1 here
and 1 here [points to the ends] so for 2 tables its 2+2+1+1=6 people
Me: What would it be if there were 10 tables?
Seán: Counts on fingers[2,4,6,8,10,12,14,16,18,20]+2=22
This was a typical additive strategy from the students working on task B. The context is helping
them see the relationship between the number of tables and the number of people. I decided to
introduce a tabular representation to help the shift to multiplicative thinking. I provided the
columns and we completed the table together
Student Work
Task B
I gave these students cardboard cards like this so that they could model the situation
The context certainly helped these students access the problem and they could easily see that
every time you added a table you added two more people and there were 2 at the ends
Seán: For each table there is 2 added on look [points to the 2 people] and there is always 1 here
and 1 here [points to the ends] so for 2 tables its 2+2+1+1=6 people
Me: What would it be if there were 10 tables?
Seán: Counts on fingers[2,4,6,8,10,12,14,16,18,20]+2=22
This was a typical additive strategy from the students working on task B. The context is helping
them see the relationship between the number of tables and the number of people. I decided to
introduce a tabular representation to help the shift to multiplicative thinking. I provided the
columns and we completed the table together
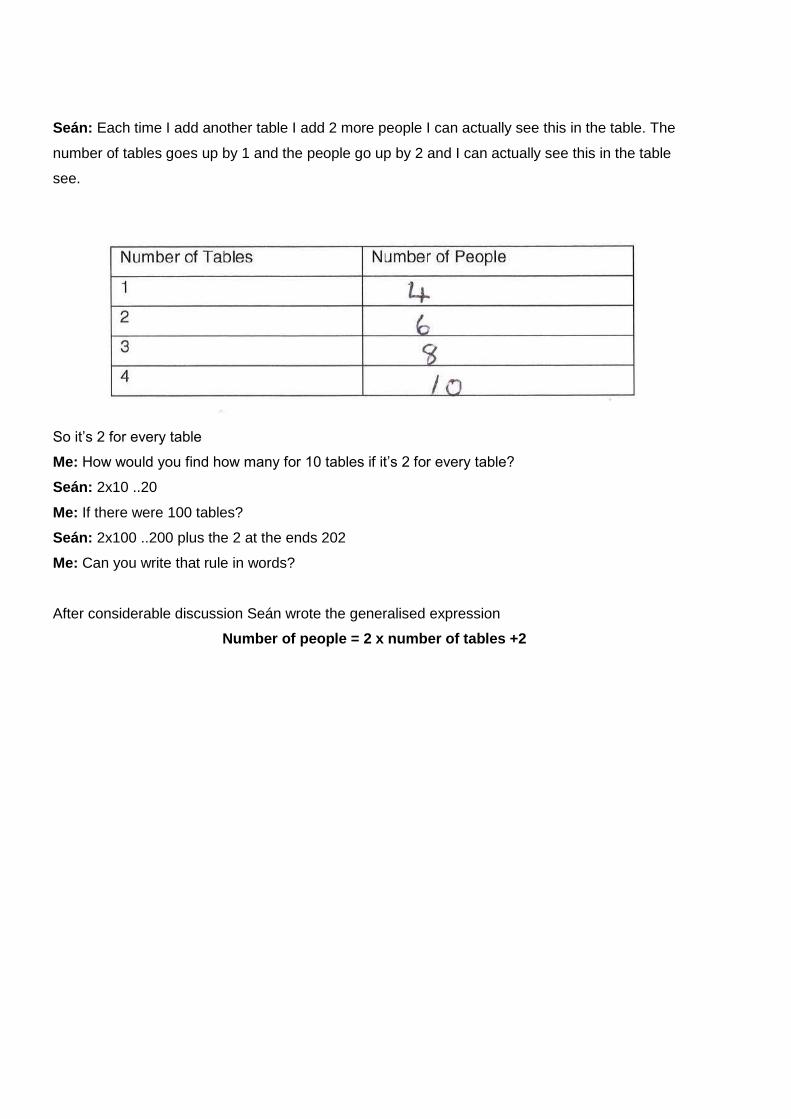
Seán: Each time I add another table I add 2 more people I can actually see this in the table. The
number of tables goes up by 1 and the people go up by 2 and I can actually see this in the table
see.
So it’s 2 for every table
Me: How would you find how many for 10 tables if it’s 2 for every table?
Seán: 2x10 ..20
Me: If there were 100 tables?
Seán: 2x100 ..200 plus the 2 at the ends 202
Me: Can you write that rule in words?
After considerable discussion Seán wrote the generalised expression
Number of people = 2 x number of tables +2
Student work
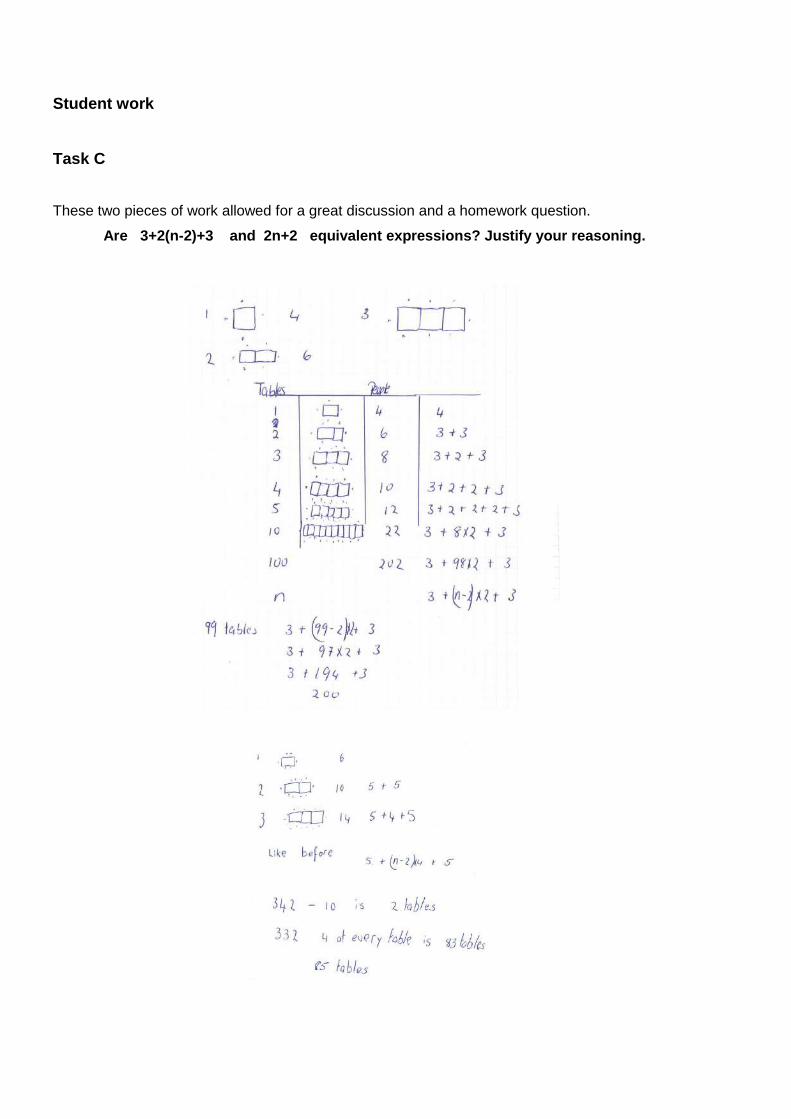
Task C
These two pieces of work allowed for a great discussion and a homework question.
Are 3+2(n-2)+3 and 2n+2 equivalent expressions? Justify your reasoning.

Note to Teachers:
How would you use these tasks with your students? Examine how the teacher adjusted the task to suit the needs of the class? How would you adjust such a task? What mathematics would you want your students to learn from engaging with these tasks? Examine how the students generalised the relationship between the number of tables and
the number of people at each table. Did the context help? Are there any questions youwould like to ask these students? If these were your students what task would you givethem next to progress their learning?
Examining homework:
What does each piece of work tell you about the students’ understanding of
the concept of equality ? the commutative property? the operations of addition and multiplication?
Sample A:
Sample B:
Sample C :

Problem solving reminder: If you are going to use these tasks remember, answers are important
but what is more important is the mathematics students can learn from engaging with the tasks.

Generalising with a focus on equivalence
Case Study: I want my students to become flexible in recognising equivalent forms of linear
equations and expressions. I am hoping that this flexibility will emerge as they gain
experience with multiple ways of representing a contextualised problem. I liked this problem
because I think it ticks all the boxes and gives my students an opportunity to develop all the
‘bits’ of mathematical proficiency it also provides a context in which they can use variables to
represent a situation and hopefully gain fluency in using various representations.
Task:
The residents of a town wanted a new swimming pool. They campaigned with the
local town councillors and eventually reached a deal. The council agreed to build a
pool with an area of 36m2 but the towns -people had to agree to buy the tiling to make
a border around the outside. Money is quite tight in the community so it is important
that the tiling bill is as low as possible. What dimensions should the new pool be in
order to ensure that the cost of tiling the outside is as low as possible?
I used the ideas from Deborah Ball’s video and I first asked the students some questions to
make sure they fully understood the problem.
“If the pool has to have an area of 36 m2 then what could be the possible dimensions
of that pool?’
Sophie raised her hand and said 6m x 6m. I said “any other ideas? “
Josh said 9m X 4m. I was happy that the class were getting the idea and I said. ”Keep in
mind we have to have an area of 36m2 any other dimensions?”
I wrote the suggestions on the board and intermittently commented Are these the only
possible dimensions? Is that it? Did we use every possibility? Is every combination
up there? I purposely asked about dimensions that couldn’t be used. I said could we have
a pool 5m x 6m? Why not?
Once I was happy that all combinations were on the board I said “So supposing each tile is
1m x 1m then how many tiles do you think it will take to go around a 9m x 4m pool? “ have a
guess
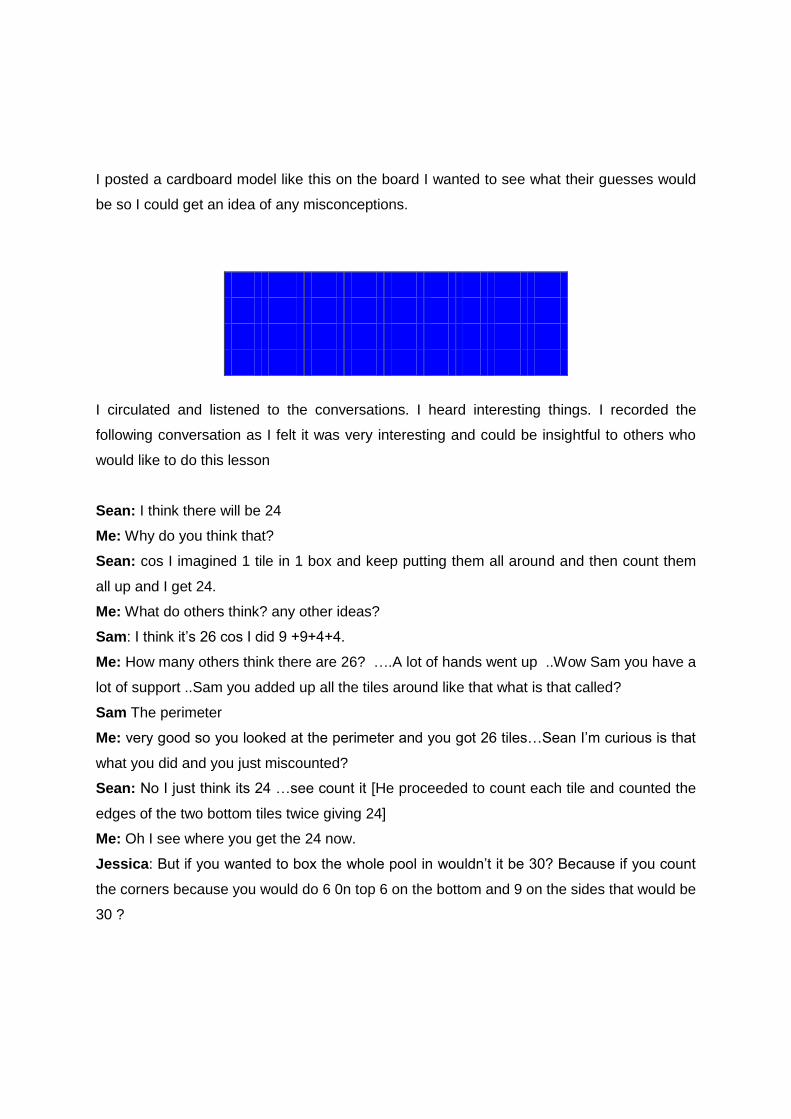
I posted a cardboard model like this on the board I wanted to see what their guesses would
be so I could get an idea of any misconceptions.
I circulated and listened to the conversations. I heard interesting things. I recorded the
following conversation as I felt it was very interesting and could be insightful to others who
would like to do this lesson
Sean: I think there will be 24
Me: Why do you think that?
Sean: cos I imagined 1 tile in 1 box and keep putting them all around and then count them
all up and I get 24.
Me: What do others think? any other ideas?
Sam: I think it’s 26 cos I did 9 +9+4+4.
Me: How many others think there are 26? ….A lot of hands went up ..Wow Sam you have a
lot of support ..Sam you added up all the tiles around like that what is that called?
Sam The perimeter
Me: very good so you looked at the perimeter and you got 26 tiles…Sean I’m curious is that
what you did and you just miscounted?
Sean: No I just think its 24 …see count it [He proceeded to count each tile and counted the
edges of the two bottom tiles twice giving 24]
Me: Oh I see where you get the 24 now.
Jessica: But if you wanted to box the whole pool in wouldn’t it be 30? Because if you count
the corners because you would do 6 0n top 6 on the bottom and 9 on the sides that would be
30 ?

Sam: what do you mean box it in?
I called Jessica to the board and she demonstrated what she meant.
Me: So how many tiles does it take to make a complete border around this pool?
Jessica: 30 tiles
Sam: Oh I see there are 4 corners so it’s 4 extra
Sean: Ye I get it now
Me: So what I want you to do is to look at all the possibilities that we have for a 36m2 pool.
.... lets make a table for what we just saw
Dimensions of pool No of tiles
9x4 30
So get into your groups build your own pools of different dimensions and tile the pools. Then
look for a pattern to see how the dimensions of the pool relates to the number of tiles
needed.
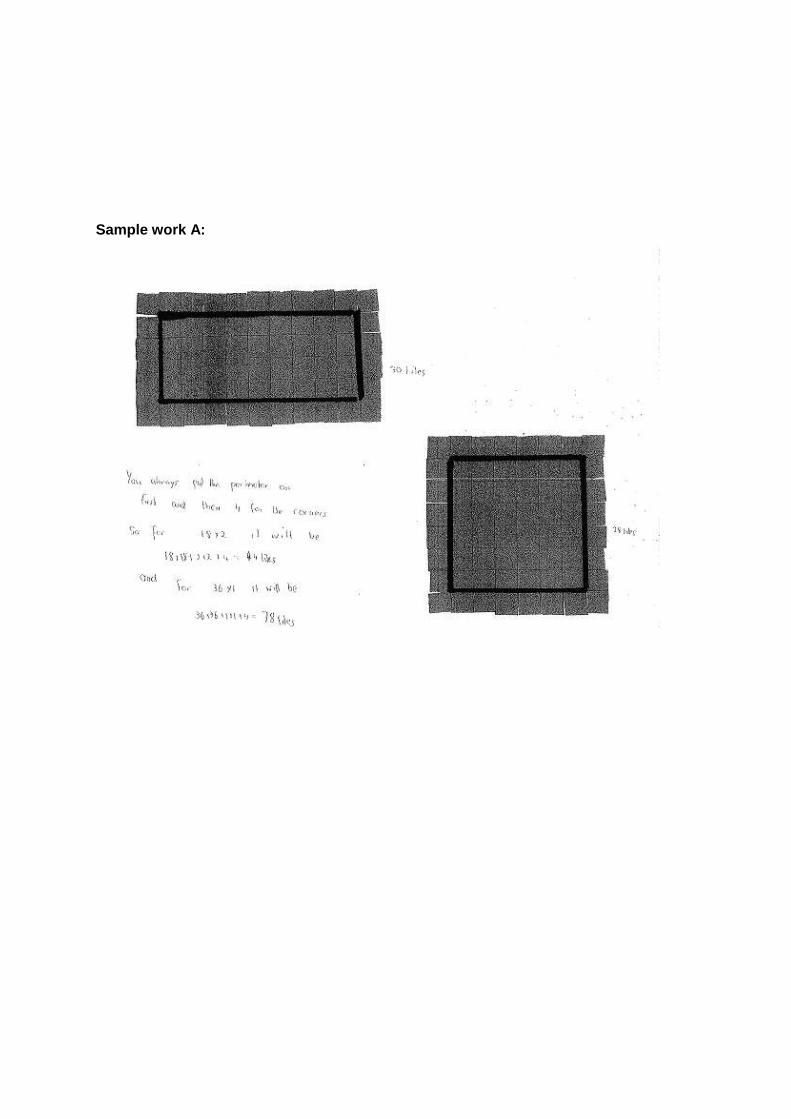
Sample work A:
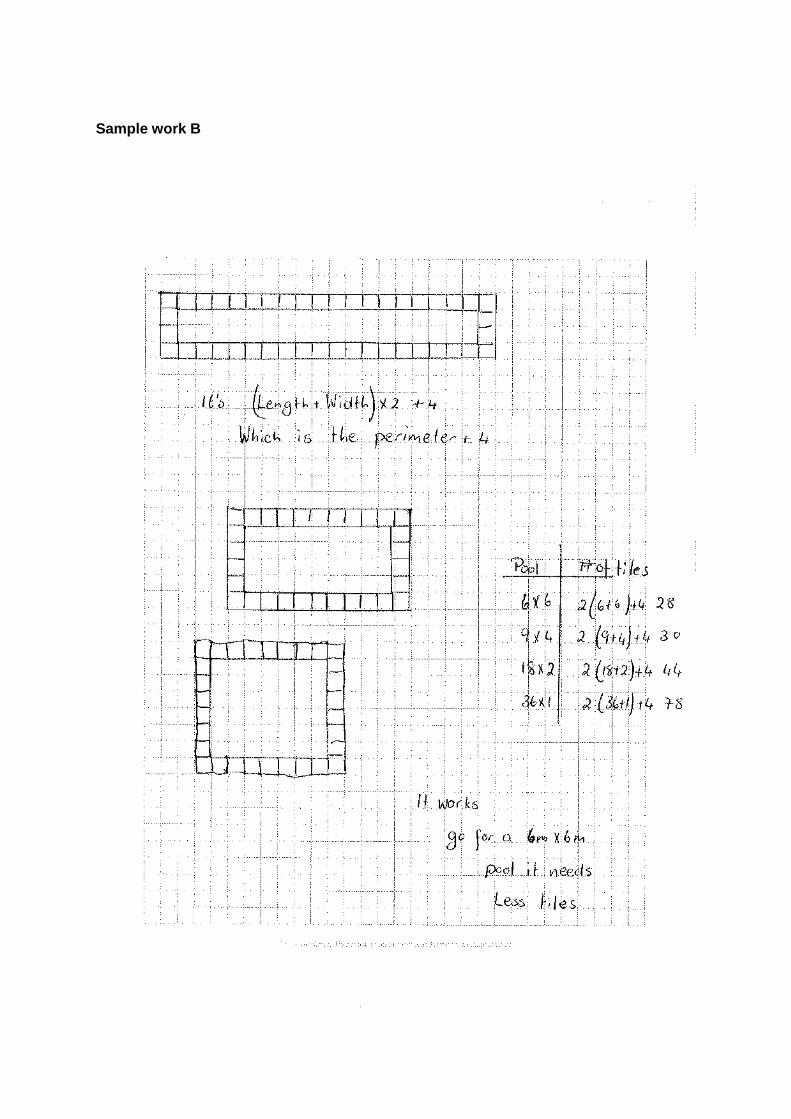
Sample work B
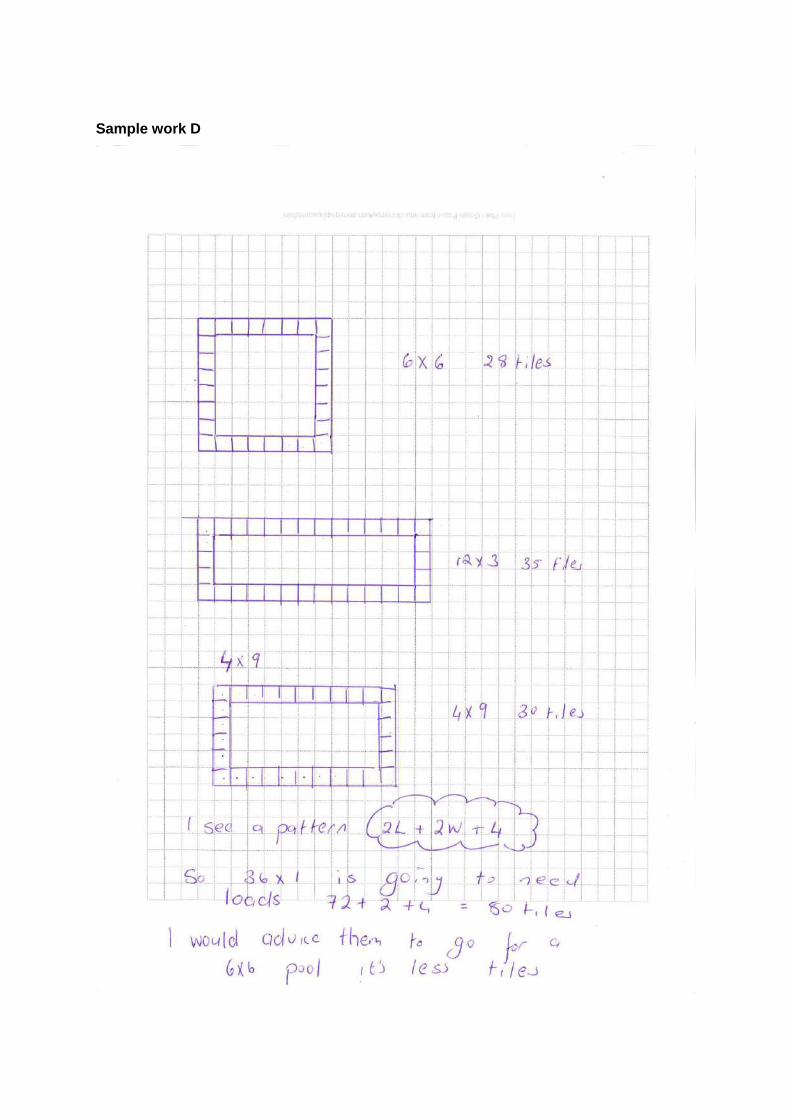
Sample work D

The work above gave me an opportunity to look at the two expressions and ask learners to
decide whether or not they are equivalent. I also took the opportunity to discuss the
difference between an equation and an expression. I asked both groups to write equations to
describe their observation rather than expressions.
Everyone was in agreement that since the towns-people were on a tight budget they should
go with the 6m x 6m pool as it would be cheaper to tile the border. To encourage flexible
thinking I said if I wanted to do lengths in the pool which one would be best? A
discussion ensued about how for lengths you would want a larger length and that a 36m x
1m pool would give you the largest length but it would not be very practical.
I would like to discuss the relationship between area and perimeter a bit more but I thought I
would save it for another day I wanted to extend this work for now. I decided to pose another
problem that is closely related to the original one but yet different so it allows the learners to
stretch their thinking and apply what they learned from the first problem to this new problem.

Task: I returned to the pool designer who produced a number of different designs which he
numbered 1,2 ,3 as shown.
With design 1 you get a 1m x 2m pool and with design 2 you can get a 2m x 3m pool
Think about what a design 4 pool would look like draw this out and think about the number of
tiles needed for a border.
See can you see a pattern and determine the number of tiles needed for a design 11 pool.
Then finally come up with an algebraic expression that relates number of tiles needed to the
design number. Below are samples of student work
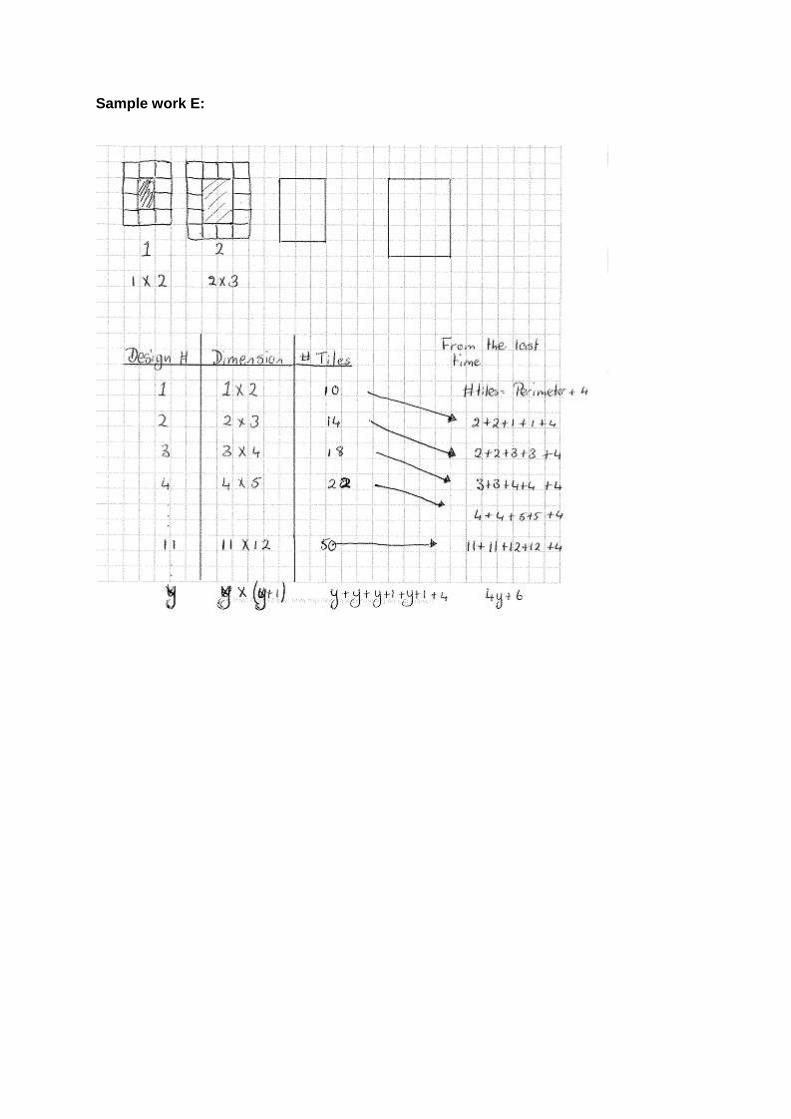
Sample work E:
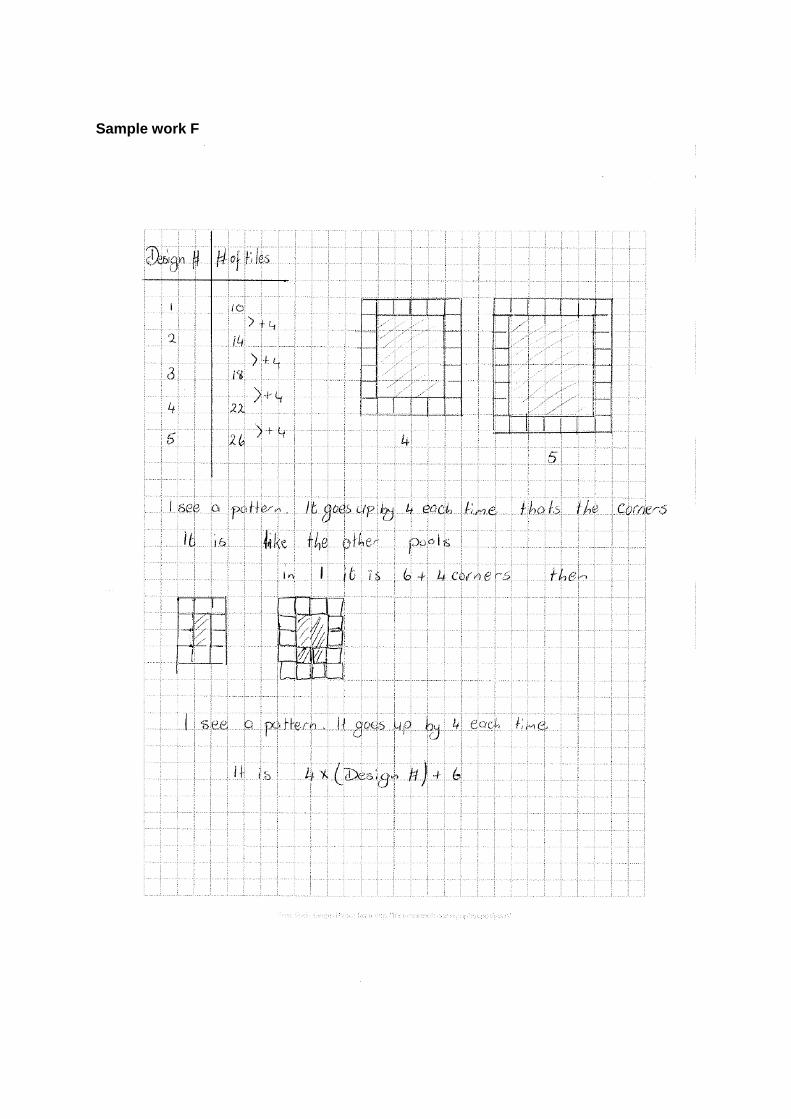
Sample work F
Tasks for teachers:
Think about your students
What mathematics would you hope they learn from engaging with the task?
Which mathematical processes are evidenced in the student work?
o Problem solving
o Mastery of mathematical procedures
o Reasoning and proof
o Communication
o Making Connections
o Representing
Examine the teacher’s role in scaffolding this task to what extent did they help the
students attend to the mathematical processes?
How would you decide if your students are ready for such a task?
How would you support students who struggle with this task?
Problem solving reminder: If you are going to use this task remember, answers are
important but what is more important is the mathematics students can learn from engaging
with the task.
Teachers
Communities of practiceResources to use with colleagues, a library of ideas that you can use in your own school community
• Investigating the commutative property - pages 65-68
• Reflecting on learning blank template - pages 69-70
• Developing questioning - pages 71-76
Synthesis and problem solvingLearn how a group of teachers assessed synthesis and problem solving skills.
• A Framework for Assessing synthesis and Problem Solving Skills - pages 77-78
• Case Study-Using the Framework for Assessing synthesis and Problem Solving Skills - pages 79-84
Reasoning TasksA library of tasks that encourage your students to reason and make sense of mathematics.
• Understanding Equality - pages 85-90
Post-Primary: Junior Cycle
Mathematics - Transition from primary school
Community of Practice:
Session Title: Examining student work
Charmaine, Leona, Anna, Hugh and Ciaran were investigating the commutative property for
subtraction. The extract below is from their discussion of the following task.
Task: If you switch around the numbers in a subtraction problem will you get the same answer?
With your colleagues think about these students’ ideas
What prior understanding have the learners brought to this task?
What problem solving strategies were they using?
What conjecture did they form?
How did they represent it that will show it is always true?
What mathematics are the students learning from engaging in this task?
Now think about the learners in your school
Are your learners ready for such a task?
Are they as familiar with using representation to show their ides as these students seem to
be?
Think about the teacher
How did the teacher progress the learning?
Together think about how you would manage this task in your classrooms
What students would you do it with?
How would you introduce it?
What difficulties do you think your students might have with the task?
Are your students familiar with making and testing conjectures?
What do your students understand about mathematical proof?
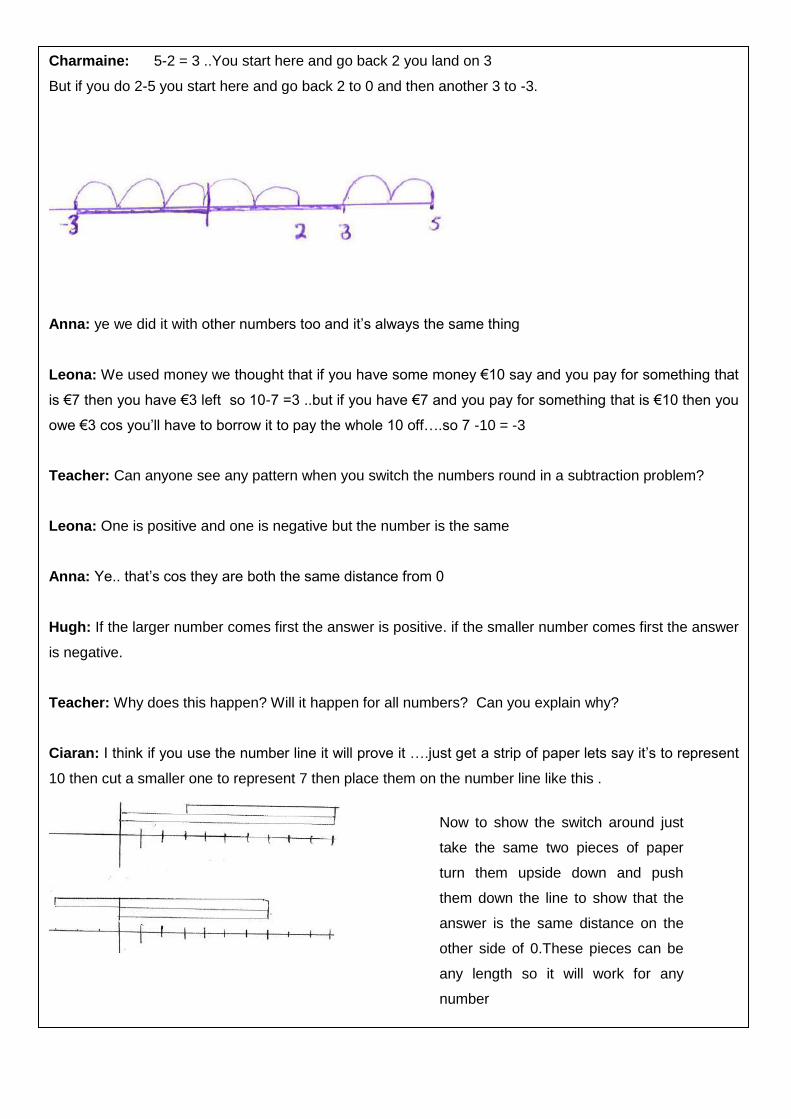
Charmaine: 5-2 = 3 ..You start here and go back 2 you land on 3
But if you do 2-5 you start here and go back 2 to 0 and then another 3 to -3.
Anna: ye we did it with other numbers too and it’s always the same thing
Leona: We used money we thought that if you have some money €10 say and you pay for something that
is €7 then you have €3 left so 10-7 =3 ..but if you have €7 and you pay for something that is €10 then you
owe €3 cos you’ll have to borrow it to pay the whole 10 off….so 7 -10 = -3
Teacher: Can anyone see any pattern when you switch the numbers round in a subtraction problem?
Leona: One is positive and one is negative but the number is the same
Anna: Ye.. that’s cos they are both the same distance from 0
Hugh: If the larger number comes first the answer is positive. if the smaller number comes first the answer
is negative.
Teacher: Why does this happen? Will it happen for all numbers? Can you explain why?
Ciaran: I think if you use the number line it will prove it ….just get a strip of paper lets say it’s to represent
10 then cut a smaller one to represent 7 then place them on the number line like this .
Now to show the switch around just
take the same two pieces of paper
turn them upside down and push
them down the line to show that the
answer is the same distance on the
other side of 0.These pieces can be
any length so it will work for any
number
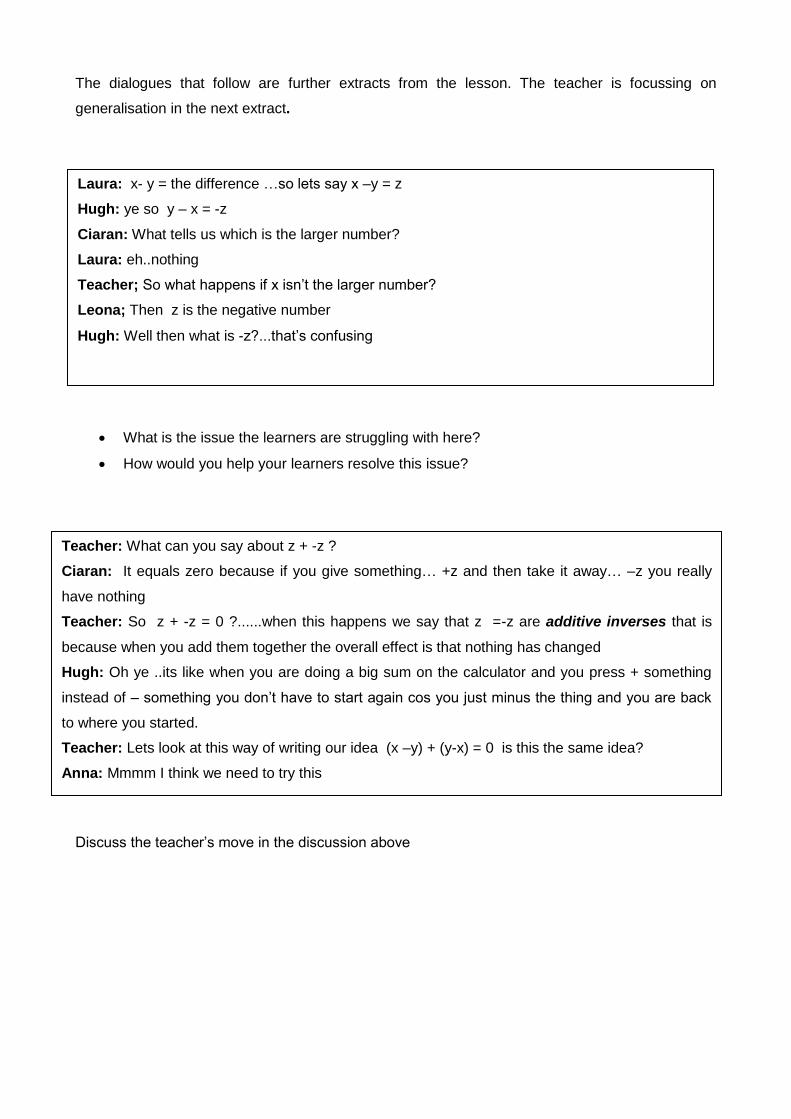
The dialogues that follow are further extracts from the lesson. The teacher is focussing on
generalisation in the next extract.
What is the issue the learners are struggling with here?
How would you help your learners resolve this issue?
Discuss the teacher’s move in the discussion above
Laura: x- y = the difference …so lets say x –y = z
Hugh: ye so y – x = -z
Ciaran: What tells us which is the larger number?
Laura: eh..nothing
Teacher; So what happens if x isn’t the larger number?
Leona; Then z is the negative number
Hugh: Well then what is -z?...that’s confusing
Teacher: What can you say about z + -z ?
Ciaran: It equals zero because if you give something… +z and then take it away… –z you really
have nothing
Teacher: So z + -z = 0 ?......when this happens we say that z =-z are additive inverses that is
because when you add them together the overall effect is that nothing has changed
Hugh: Oh ye ..its like when you are doing a big sum on the calculator and you press + something
instead of – something you don’t have to start again cos you just minus the thing and you are back
to where you started.
Teacher: Lets look at this way of writing our idea (x –y) + (y-x) = 0 is this the same idea?
Anna: Mmmm I think we need to try this
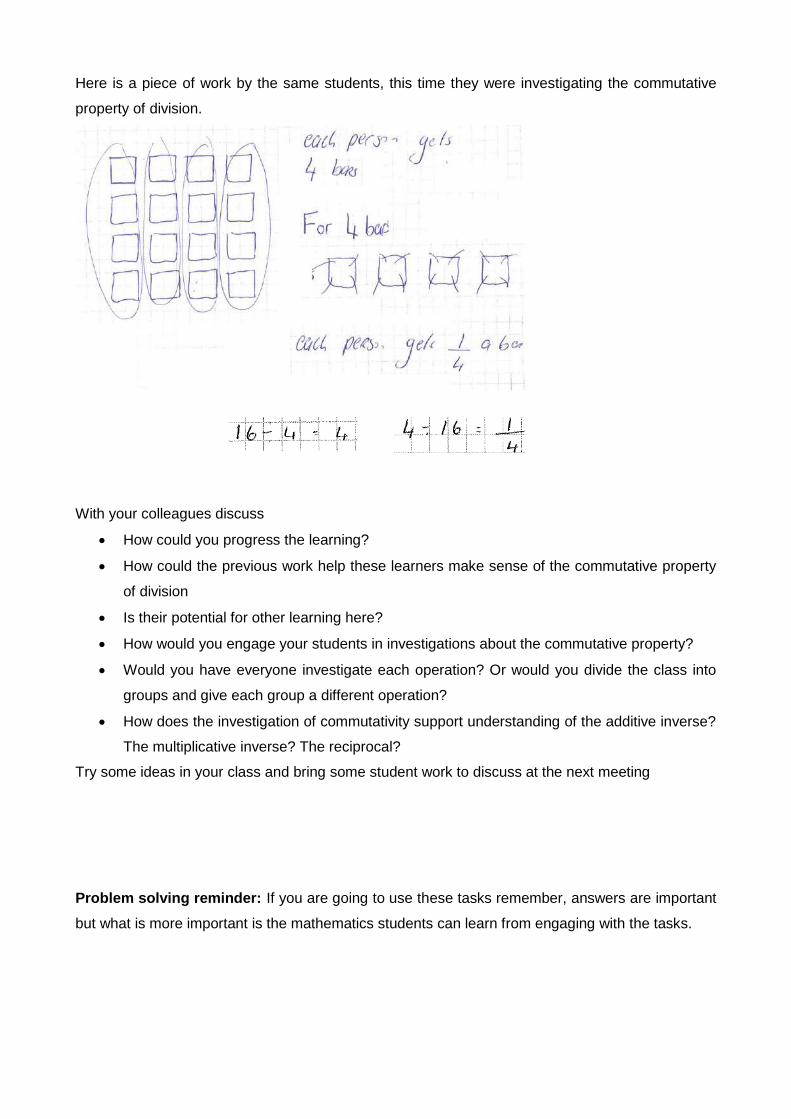
Here is a piece of work by the same students, this time they were investigating the commutative
property of division.
With your colleagues discuss
How could you progress the learning?
How could the previous work help these learners make sense of the commutative property
of division
Is their potential for other learning here?
How would you engage your students in investigations about the commutative property?
Would you have everyone investigate each operation? Or would you divide the class into
groups and give each group a different operation?
How does the investigation of commutativity support understanding of the additive inverse?
The multiplicative inverse? The reciprocal?
Try some ideas in your class and bring some student work to discuss at the next meeting
Problem solving reminder: If you are going to use these tasks remember, answers are important
but what is more important is the mathematics students can learn from engaging with the tasks.
Community of Practice:
Session Title: Reflecting on learning
Describe the Task
What mathematics did you want your students to learn from engaging with the task?
How did you manage the task in your class?
Outline a typical interpretation of the task?
Outline an interesting interpretation of the task
How did you progress the learning?
Community of Practice:
Session Title: Developing questioning
These materials have been designed to help you and your colleagues reflect
on:
• the reasons for questioning;
• some ways of making questioning more effective;
• different types of ‘thinking questions’ that may be asked in
mathematics.
Why ask questions? In their book Questions and prompts for mathematical
thinking, 1998, Association of Teachers of Mathematics John Mason and Anne
Watson suggest that teachers should ask questions
• To interest, challenge or engage.
• To assess prior knowledge and understanding.
• To mobilise existing understanding to create new understanding.
• To focus thinking on key concepts.
• To extend and deepen learners’ thinking.
• To promote learners’ thinking about the way they learn.
Can you think of other reasons you might ask questions in your class?
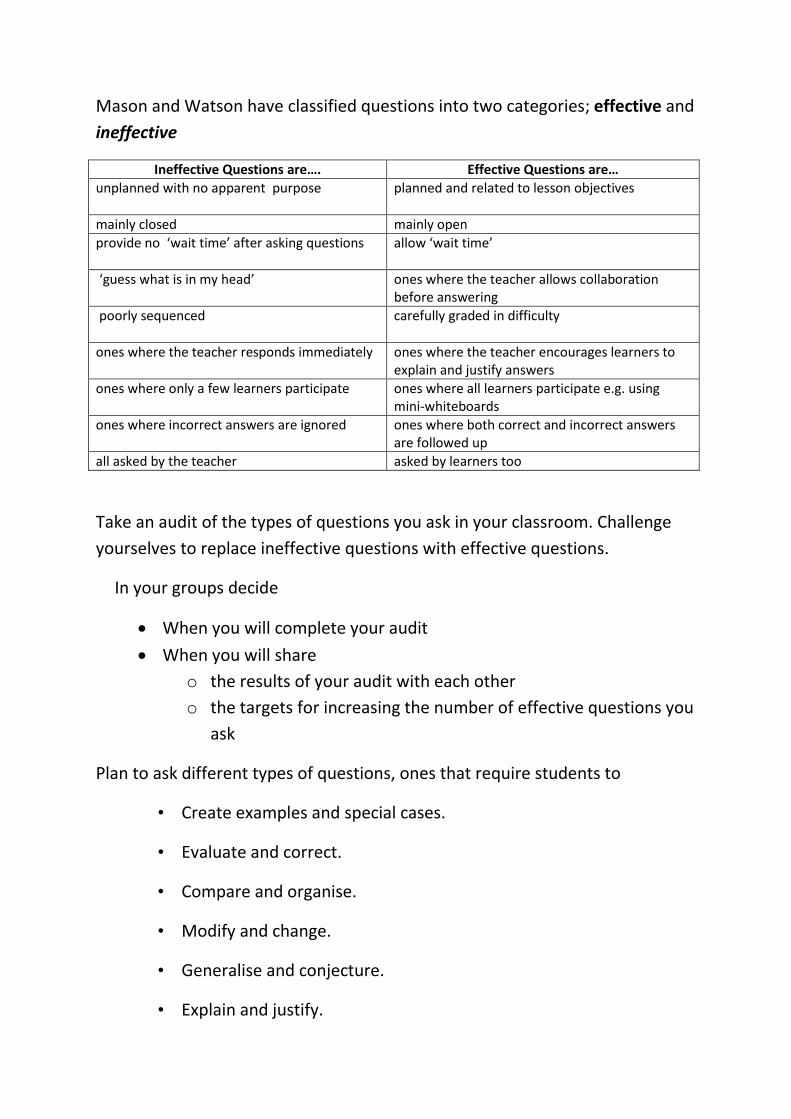
Mason and Watson have classified questions into two categories; effective and
ineffective
Ineffective Questions are…. Effective Questions are…
unplanned with no apparent purpose planned and related to lesson objectives
mainly closed mainly open
provide no ‘wait time’ after asking questions allow ‘wait time’
‘guess what is in my head’ ones where the teacher allows collaboration before answering
poorly sequenced carefully graded in difficulty
ones where the teacher responds immediately ones where the teacher encourages learners to explain and justify answers
ones where only a few learners participate ones where all learners participate e.g. using mini-whiteboards
ones where incorrect answers are ignored ones where both correct and incorrect answers are followed up
all asked by the teacher asked by learners too
Take an audit of the types of questions you ask in your classroom. Challenge
yourselves to replace ineffective questions with effective questions.
In your groups decide
When you will complete your audit
When you will share
o the results of your audit with each other
o the targets for increasing the number of effective questions you
ask
Plan to ask different types of questions, ones that require students to
• Create examples and special cases.
• Evaluate and correct.
• Compare and organise.
• Modify and change.
• Generalise and conjecture.
• Explain and justify.
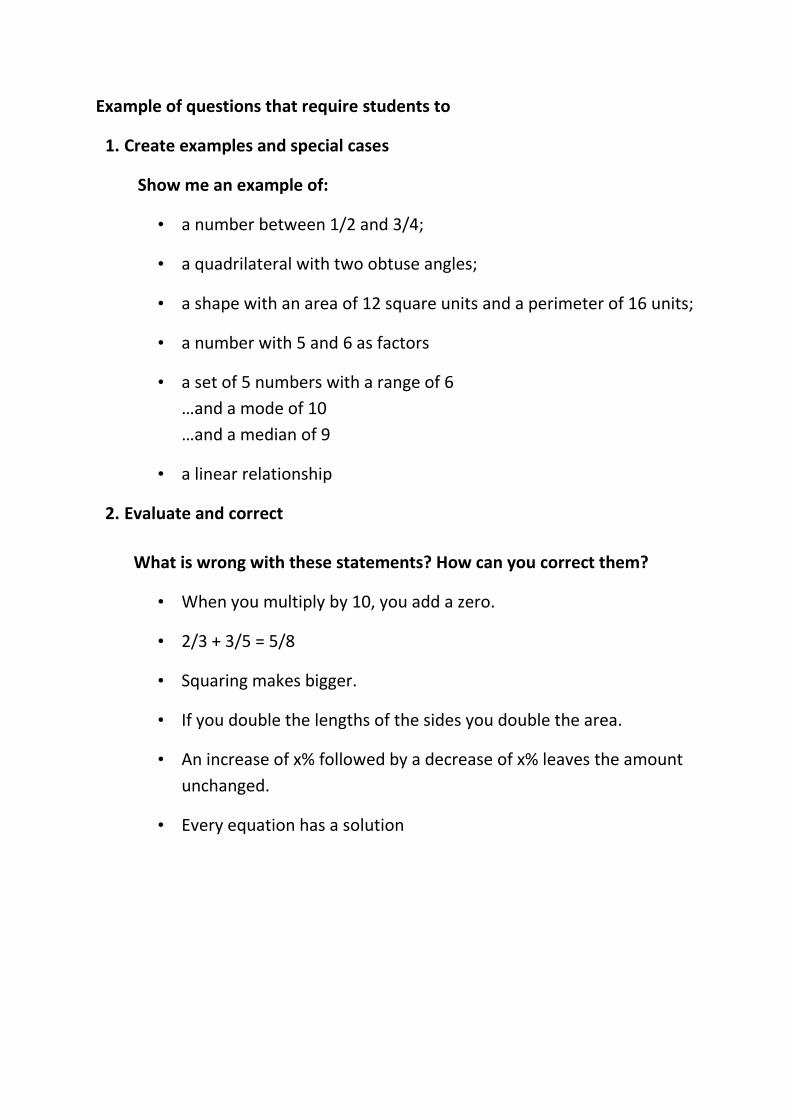
Example of questions that require students to
1. Create examples and special cases
Show me an example of:
• a number between 1/2 and 3/4;
• a quadrilateral with two obtuse angles;
• a shape with an area of 12 square units and a perimeter of 16 units;
• a number with 5 and 6 as factors
• a set of 5 numbers with a range of 6
…and a mode of 10
…and a median of 9
• a linear relationship
2. Evaluate and correct
What is wrong with these statements? How can you correct them?
• When you multiply by 10, you add a zero.
• 2/3 + 3/5 = 5/8
• Squaring makes bigger.
• If you double the lengths of the sides you double the area.
• An increase of x% followed by a decrease of x% leaves the amount
unchanged.
• Every equation has a solution
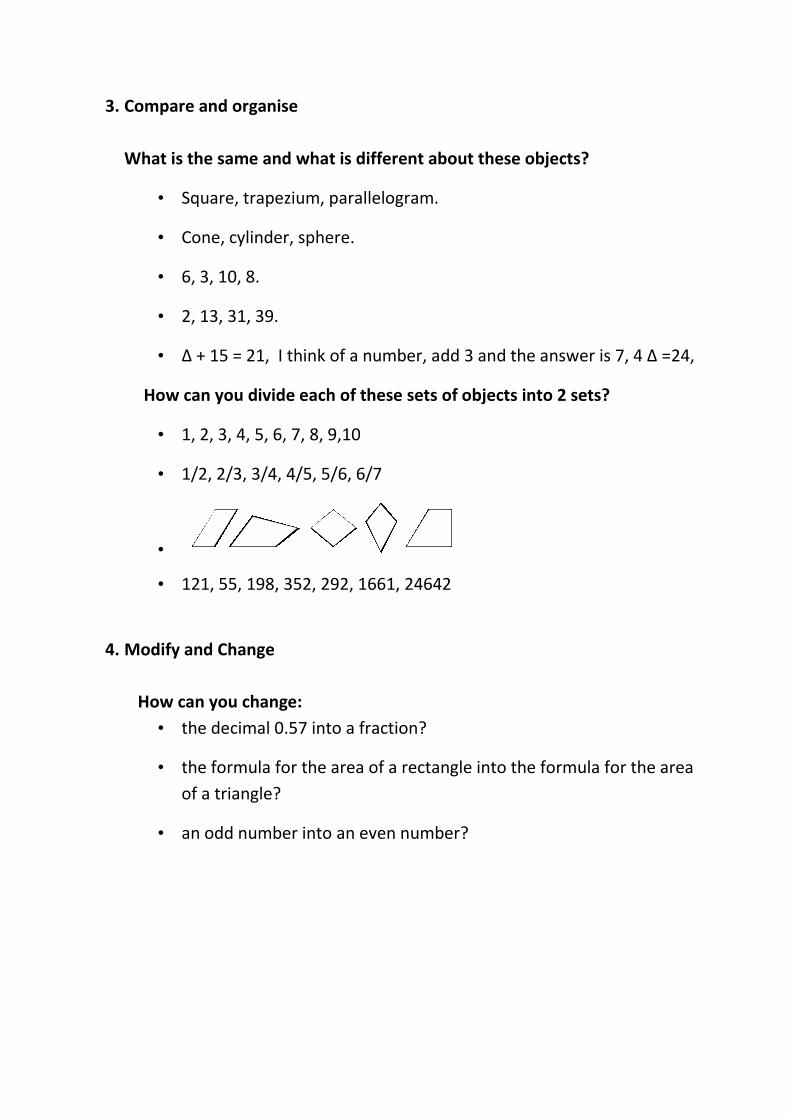
3. Compare and organise
What is the same and what is different about these objects?
• Square, trapezium, parallelogram.
• Cone, cylinder, sphere.
• 6, 3, 10, 8.
• 2, 13, 31, 39.
• ∆ + 15 = 21, I think of a number, add 3 and the answer is 7, 4 ∆ =24,
How can you divide each of these sets of objects into 2 sets?
• 1, 2, 3, 4, 5, 6, 7, 8, 9,10
• 1/2, 2/3, 3/4, 4/5, 5/6, 6/7
•
• 121, 55, 198, 352, 292, 1661, 24642
4. Modify and Change
How can you change:
• the decimal 0.57 into a fraction?
• the formula for the area of a rectangle into the formula for the area
of a triangle?
• an odd number into an even number?
a
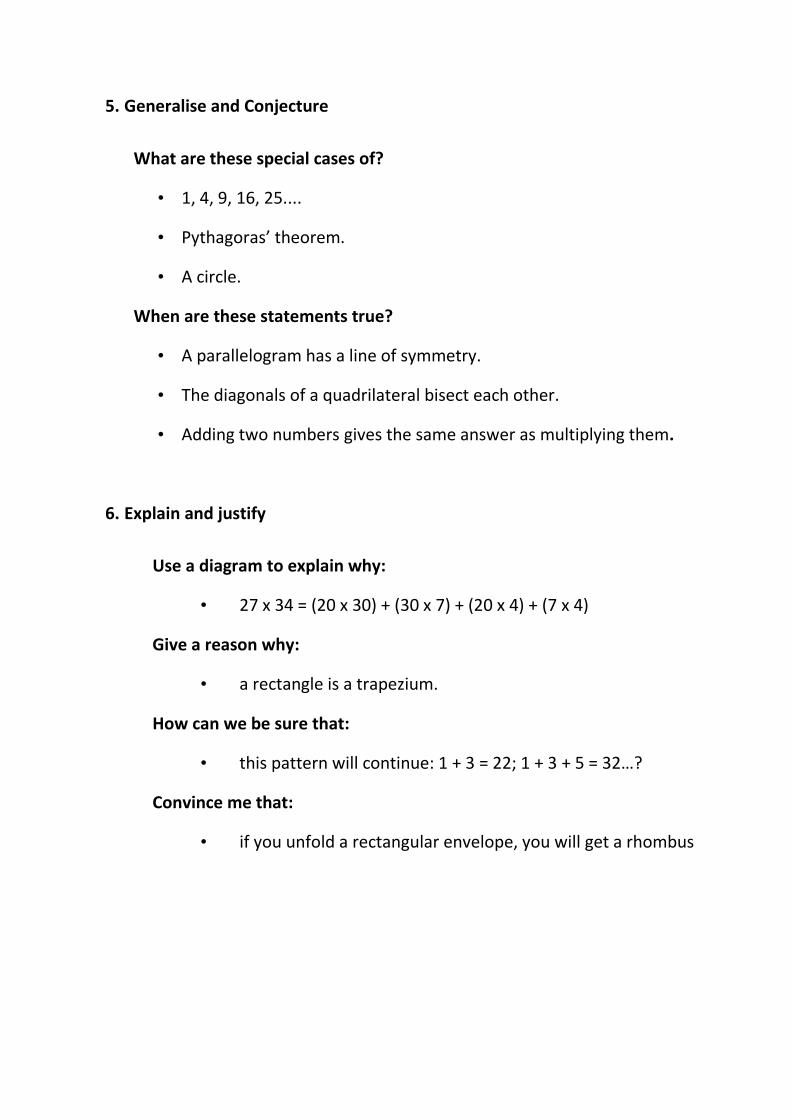
5. Generalise and Conjecture
What are these special cases of?
• 1, 4, 9, 16, 25....
• Pythagoras’ theorem.
• A circle.
When are these statements true?
• A parallelogram has a line of symmetry.
• The diagonals of a quadrilateral bisect each other.
• Adding two numbers gives the same answer as multiplying them.
6. Explain and justify
Use a diagram to explain why:
• 27 x 34 = (20 x 30) + (30 x 7) + (20 x 4) + (7 x 4)
Give a reason why:
• a rectangle is a trapezium.
How can we be sure that:
• this pattern will continue: 1 + 3 = 22; 1 + 3 + 5 = 32…?
Convince me that:
• if you unfold a rectangular envelope, you will get a rhombus
In your groups make up your own questions that require students to
• Create examples and special cases.
• Evaluate and correct.
• Compare and organise.
• Modify and change.
• Generalise and conjecture.
• Explain and justify.
Try out some of the questioning strategies suggested in a lesson with your
class
Come to the next session prepared to share your experiences
Bring examples of the questions you asked and the students’
responses to those questions
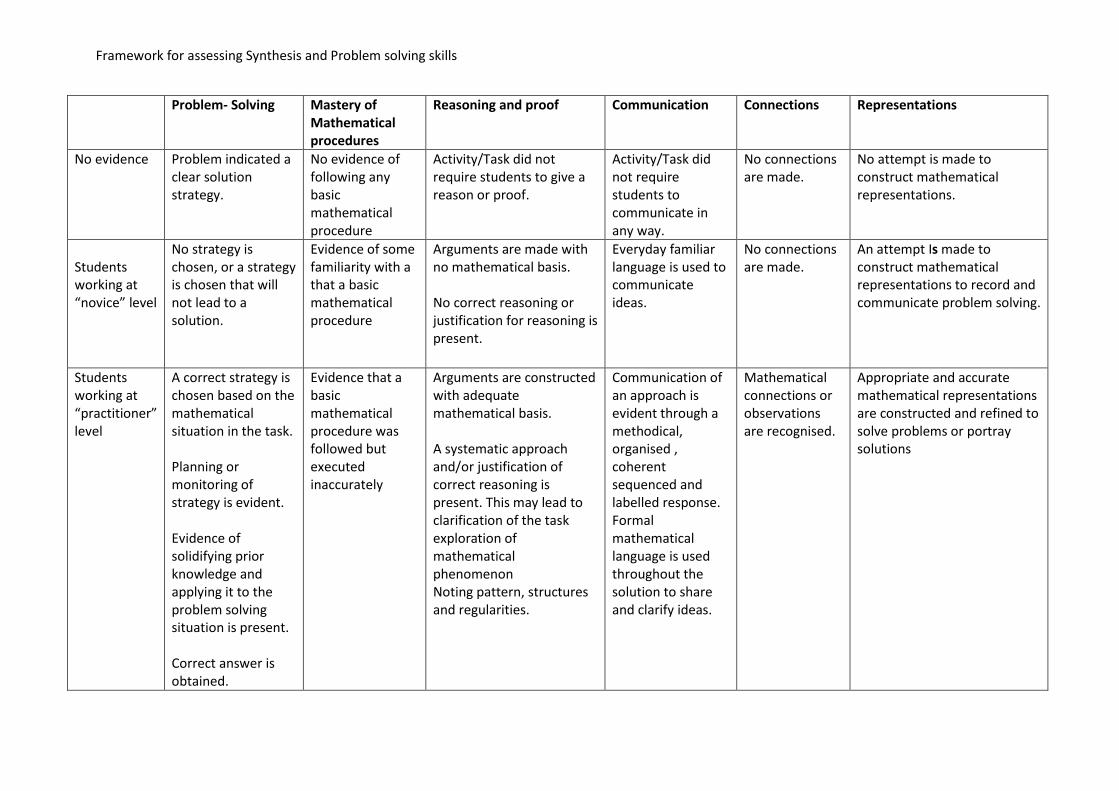
Framework for assessing Synthesis and Problem solving skills
Problem- Solving Mastery of Mathematical procedures
Reasoning and proof Communication Connections Representations
No evidence Problem indicated a clear solution strategy.
No evidence of following any basic mathematical procedure
Activity/Task did not require students to give a reason or proof.
Activity/Task did not require students to communicate in any way.
No connections are made.
No attempt is made to construct mathematical representations.
Students working at “novice” level
No strategy is chosen, or a strategy is chosen that will not lead to a solution.
Evidence of some familiarity with a that a basic mathematical procedure
Arguments are made with no mathematical basis.
No correct reasoning or justification for reasoning is present.
Everyday familiar language is used to communicate ideas.
No connections are made.
An attempt Is made to construct mathematical representations to record and communicate problem solving.
Students working at “practitioner” level
A correct strategy is chosen based on the mathematical situation in the task.
Planning or monitoring of strategy is evident.
Evidence of solidifying prior knowledge and applying it to the problem solving situation is present.
Correct answer is obtained.
Evidence that a basic mathematical procedure was followed but executed inaccurately
Arguments are constructed with adequate mathematical basis.
A systematic approach and/or justification of correct reasoning is present. This may lead to clarification of the task exploration of mathematical phenomenon Noting pattern, structures and regularities.
Communication of an approach is evident through a methodical, organised , coherent sequenced and labelled response. Formal mathematical language is used throughout the solution to share and clarify ideas.
Mathematical connections or observations are recognised.
Appropriate and accurate mathematical representations are constructed and refined to solve problems or portray solutions
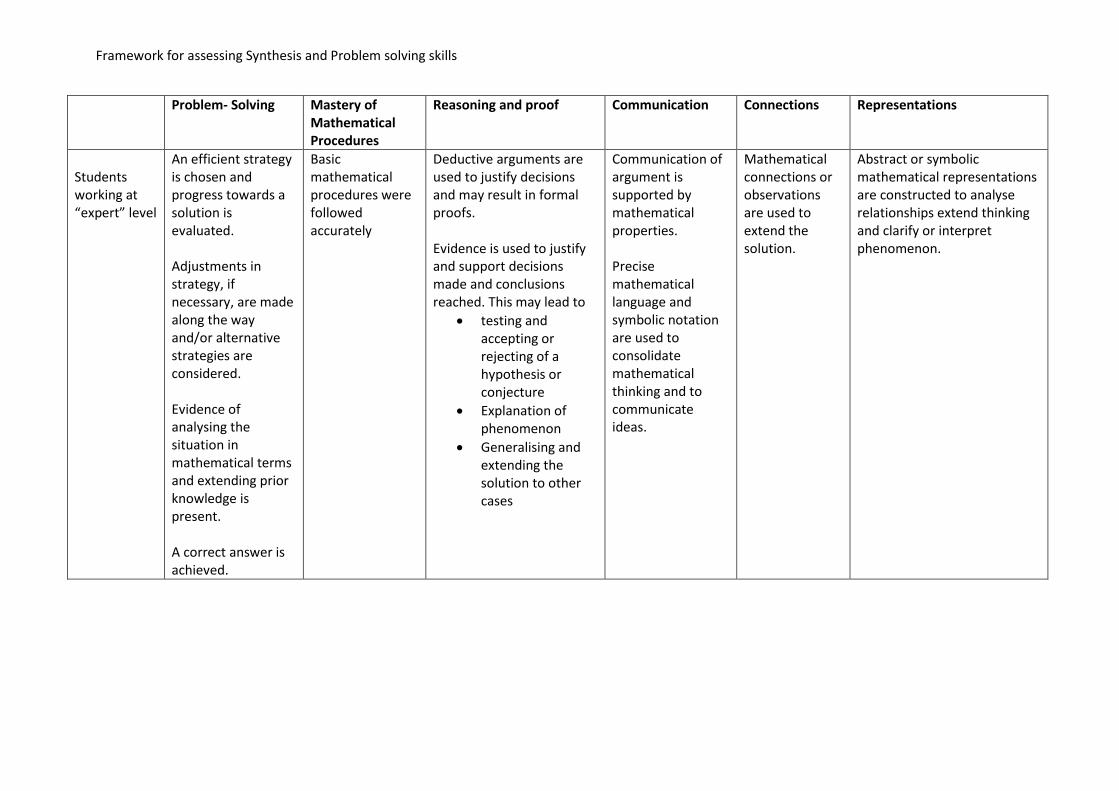
Framework for assessing Synthesis and Problem solving skills
Problem- Solving Mastery of Mathematical Procedures
Reasoning and proof Communication Connections Representations
Students working at “expert” level
An efficient strategy is chosen and progress towards a solution is evaluated.
Adjustments in strategy, if necessary, are made along the way and/or alternative strategies are considered.
Evidence of analysing the situation in mathematical terms and extending prior knowledge is present.
A correct answer is achieved.
Basic mathematical procedures were followed accurately
Deductive arguments are used to justify decisions and may result in formal proofs.
Evidence is used to justify and support decisions made and conclusions reached. This may lead to
testing andaccepting orrejecting of ahypothesis orconjecture
Explanation ofphenomenon
Generalising andextending thesolution to othercases
Communication of argument is supported by mathematical properties.
Precise mathematical language and symbolic notation are used to consolidate mathematical thinking and to communicate ideas.
Mathematical connections or observations are used to extend the solution.
Abstract or symbolic mathematical representations are constructed to analyse relationships extend thinking and clarify or interpret phenomenon.
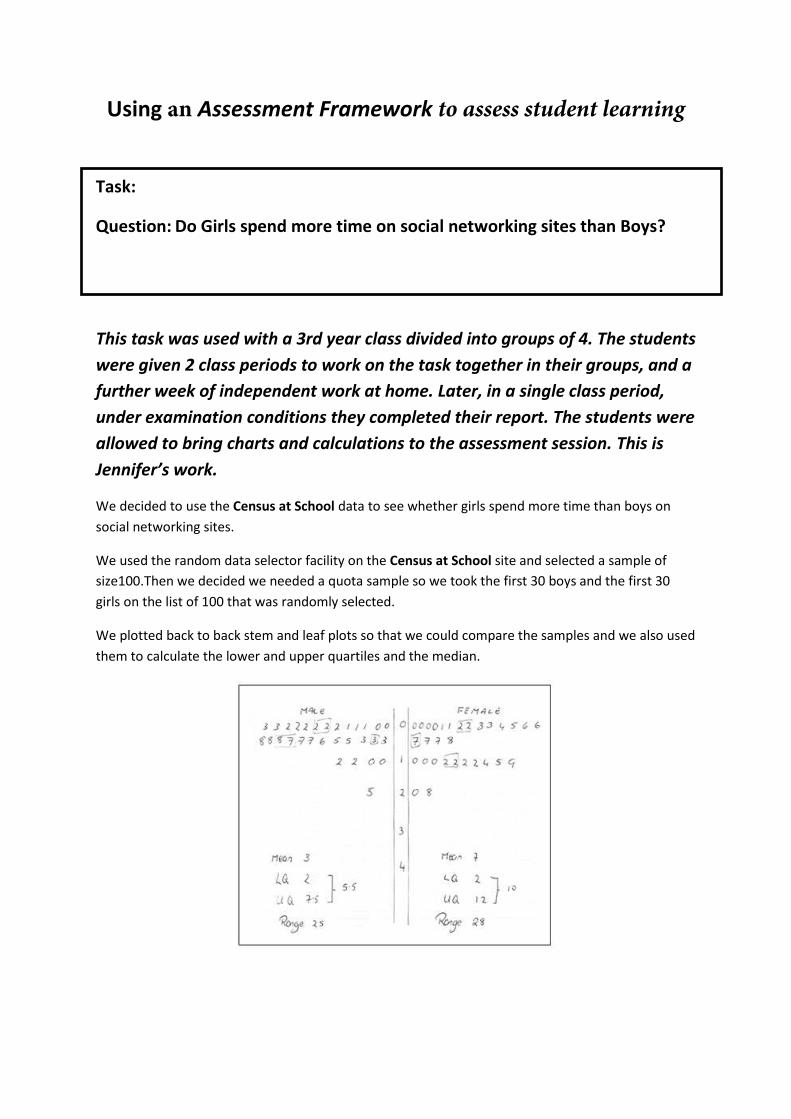
Using an Assessment Framework to assess student learning
Task:
Question: Do Girls spend more time on social networking sites than Boys?
This task was used with a 3rd year class divided into groups of 4. The students
were given 2 class periods to work on the task together in their groups, and a
further week of independent work at home. Later, in a single class period,
under examination conditions they completed their report. The students were
allowed to bring charts and calculations to the assessment session. This is
Jennifer’s work.
We decided to use the Census at School data to see whether girls spend more time than boys on
social networking sites.
We used the random data selector facility on the Census at School site and selected a sample of
size100.Then we decided we needed a quota sample so we took the first 30 boys and the first 30
girls on the list of 100 that was randomly selected.
We plotted back to back stem and leaf plots so that we could compare the samples and we also used
them to calculate the lower and upper quartiles and the median.
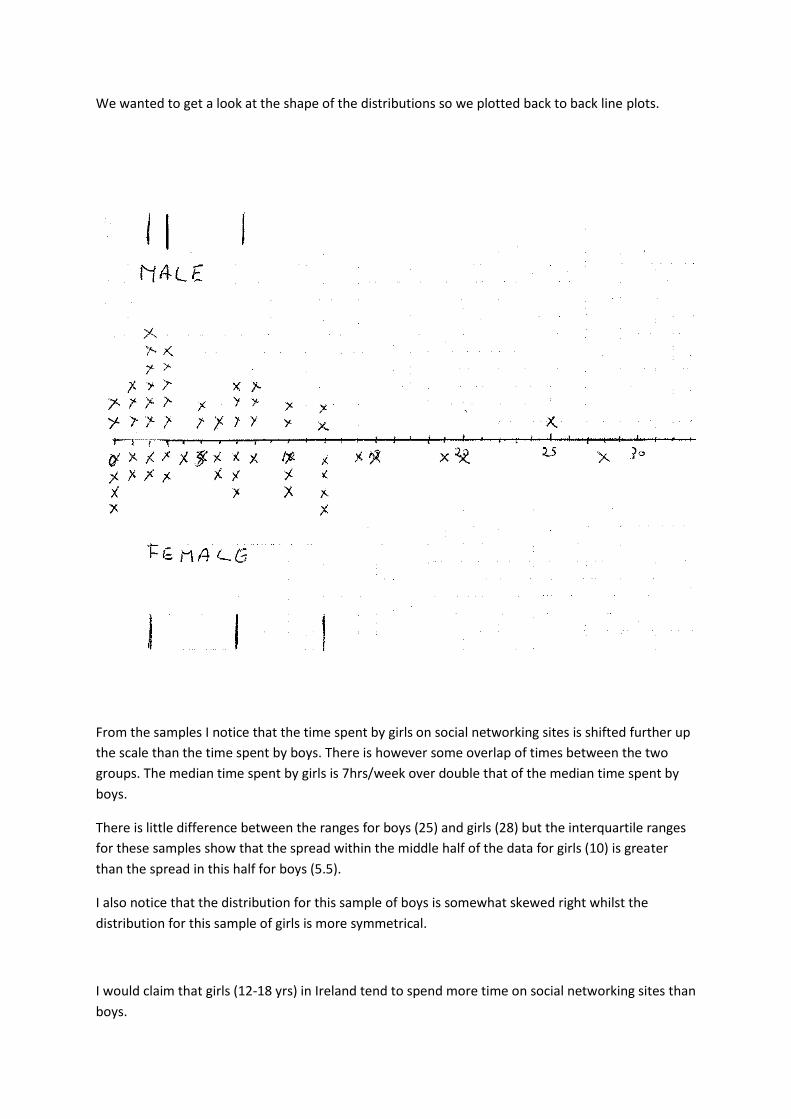
We wanted to get a look at the shape of the distributions so we plotted back to back line plots.
From the samples I notice that the time spent by girls on social networking sites is shifted further up
the scale than the time spent by boys. There is however some overlap of times between the two
groups. The median time spent by girls is 7hrs/week over double that of the median time spent by
boys.
There is little difference between the ranges for boys (25) and girls (28) but the interquartile ranges
for these samples show that the spread within the middle half of the data for girls (10) is greater
than the spread in this half for boys (5.5).
I also notice that the distribution for this sample of boys is somewhat skewed right whilst the
distribution for this sample of girls is more symmetrical.
I would claim that girls (12-18 yrs) in Ireland tend to spend more time on social networking sites than
boys.
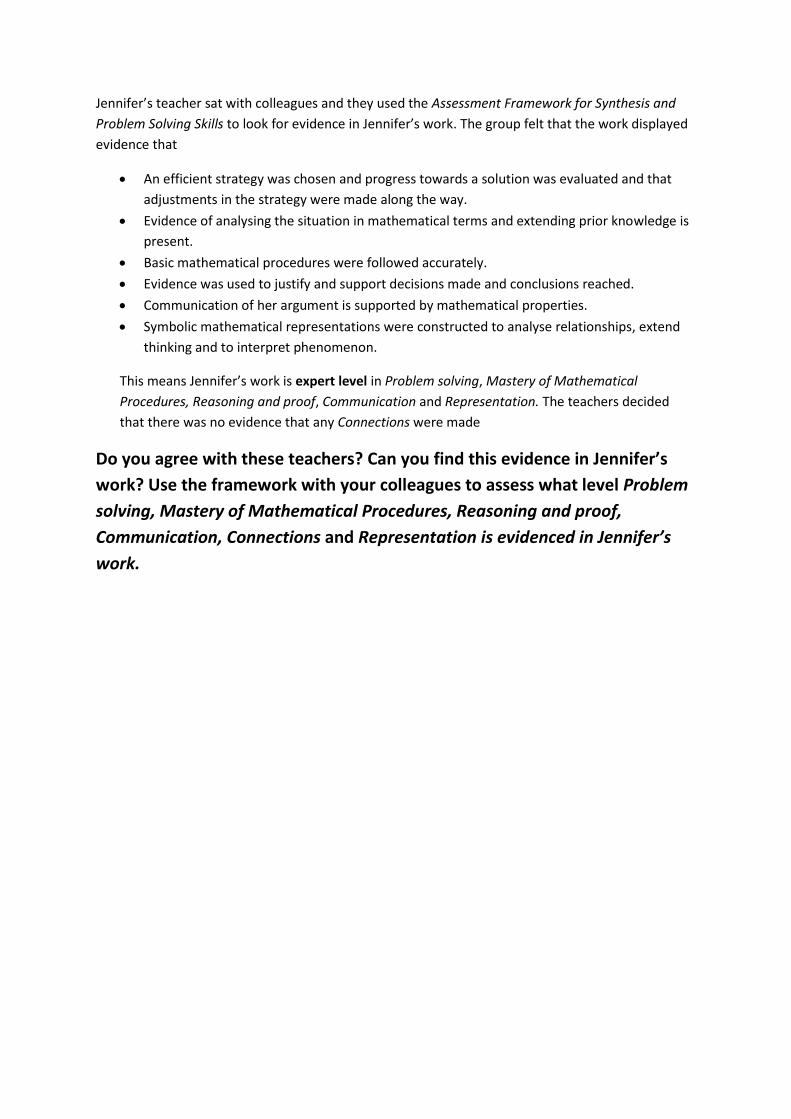
Jennifer’s teacher sat with colleagues and they used the Assessment Framework for Synthesis and
Problem Solving Skills to look for evidence in Jennifer’s work. The group felt that the work displayed
evidence that
An efficient strategy was chosen and progress towards a solution was evaluated and that
adjustments in the strategy were made along the way.
Evidence of analysing the situation in mathematical terms and extending prior knowledge is
present.
Basic mathematical procedures were followed accurately.
Evidence was used to justify and support decisions made and conclusions reached.
Communication of her argument is supported by mathematical properties.
Symbolic mathematical representations were constructed to analyse relationships, extend
thinking and to interpret phenomenon.
This means Jennifer’s work is expert level in Problem solving, Mastery of Mathematical
Procedures, Reasoning and proof, Communication and Representation. The teachers decided
that there was no evidence that any Connections were made
Do you agree with these teachers? Can you find this evidence in Jennifer’s
work? Use the framework with your colleagues to assess what level Problem
solving, Mastery of Mathematical Procedures, Reasoning and proof,
Communication, Connections and Representation is evidenced in Jennifer’s
work.
Jennifer’s teacher was asked to reflect on how useful she found the
collaborative exercise. Here is her reflection
….I found this exercise really useful, in fact it made me think a lot about how I present a task to
the kids. If I structure the task too much I don’t give them an opportunity to display evidence of
problem solving and if I don’t ask them to give a reason for their answer then they won’t see the
need to give one and there will be no evidence of reasoning and proof in the work, same really
with communications. I think Jennifer’s work is great and I will have to think about how I could
have structured the task that would have given her more of an opportunity to display evidence
of making mathematical connections. I think I’m going to give the framework to the kids so that
they can be aware of what I am looking for in their work. I think strand 1 lends itself to tasks that
kids will naturally use representations and I am really going to have to work with the kids to help
them see how useful representation is in mathematics, concepts can have lots of different
representations and I am going to ask more questions that help the kids see this; things like
….solve this problem using a diagram…support your answer with a diagram…represent such and
such in different ways…look at the representation can you see such and such..
I was quite impressed with how Jennifer represented the quartiles and the median in her work
and I am going to have a discussion with the class about this and ask them to evaluate the
usefulness of each representation the pictorial one and the numerical one.
When I use the text book I’m going to use the questions in different ways
A big ah ha moment for me has been that now I see algebra as just one representation of an
idea. I’d love my kids to see this too…
The 5 process skills are just as important as the maths learning outcomes in fact they help the
kids understand the maths

Problem- Solving Mastery of Mathematical procedures
Reasoning and proof Communication Connections Representations
No evidence Problem indicated a clear solution strategy.
No evidence of following any basic mathematical procedure
Activity/Task did not require students to give a reason or proof.
Activity/Task did not require students to communicate in any way.
No connections are made.
No attempt is made to construct mathematical representations.
Students working at novice level
No strategy is chosen, or a strategy is chosen that will not lead to a solution.
Evidence of some familiarity with a basic mathematical procedure
Arguments are made with no mathematical basis.
No correct reasoning or justification for reasoning is present.
Everyday familiar language is used to communicate ideas.
No connections are made.
An attempt Is made to construct mathematical representations to record and communicate problem solving.
Students working at practitioner level
A correct strategy is chosen based on the mathematical situation in the task.
Planning or monitoring of strategy is evident.
Evidence of solidifying prior knowledge and applying it to the problem solving situation is present.
Correct answer is obtained
Evidence that a basic mathematical procedure was followed but executed inaccurately
Arguments are constructed with adequate mathematical basis.
A systematic approach and/or justification of correct reasoning is present. This may lead to clarification of the task exploration of mathematical phenomenon Noting pattern, structures and regularities
Communication of an approach is evident through a methodical, organised, coherent sequenced and labelled response. Formal mathematical language is used throughout the solution to share and clarify ideas.
Mathematical connections or observations are recognised.
Appropriate and accurate mathematical representations are constructed and refined to solve problems or portray solutions
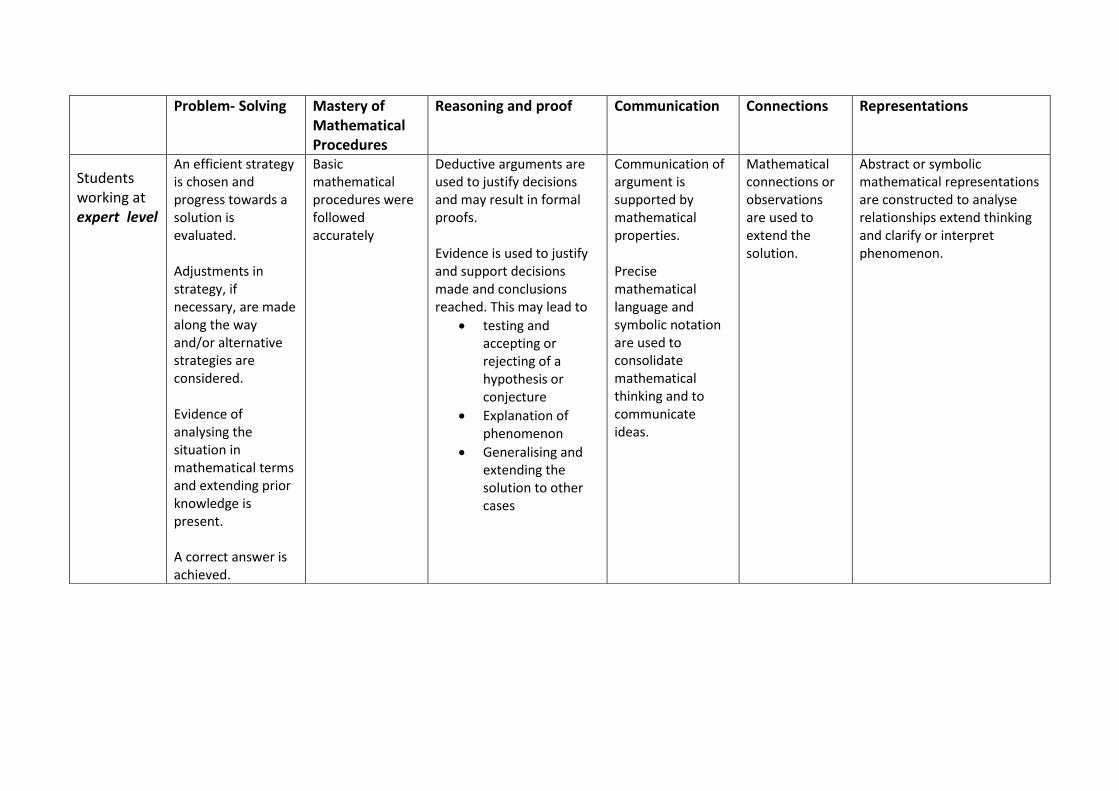
Problem- Solving Mastery of Mathematical Procedures
Reasoning and proof Communication Connections Representations
Students working at expert level
An efficient strategy is chosen and progress towards a solution is evaluated.
Adjustments in strategy, if necessary, are made along the way and/or alternative strategies are considered.
Evidence of analysing the situation in mathematical terms and extending prior knowledge is present.
A correct answer is achieved.
Basic mathematical procedures were followed accurately
Deductive arguments are used to justify decisions and may result in formal proofs.
Evidence is used to justify and support decisions made and conclusions reached. This may lead to
testing andaccepting orrejecting of ahypothesis orconjecture
Explanation ofphenomenon
Generalising andextending thesolution to othercases
Communication of argument is supported by mathematical properties.
Precise mathematical language and symbolic notation are used to consolidate mathematical thinking and to communicate ideas.
Mathematical connections or observations are used to extend the solution.
Abstract or symbolic mathematical representations are constructed to analyse relationships extend thinking and clarify or interpret phenomenon.

Understanding Equality
At all levels students should be able to
consolidate the idea that equality is a relationship expressing the idea that two mathematical
expressions hold the same value
Learning equality as a relationship between number sentences is a crucial aspect of learning
mathematics. A lack of such understanding is one of the major stumbling blocks in moving from
arithmetic towards algebra. This document describes seven different types of tasks that offer
teachers ideas of how they can understand and develop their student’s understanding of equality
and at the same time teach algebra informally.
These tasks are ideal for mixed ability classes as they can be differentiated to suit the learner’s
needs. As you read through the tasks think
What mathematics can my students learn from engaging with these tasks?
How could I use these with my class?
How could I adapt these tasks to suit my class?
When will I use these tasks with my class?
What prior learning will I expect them to have had?
Problem solving reminder: If you are going to use these tasks remember, answers are important
but what is more important is the mathematics students can learn from engaging with the task.
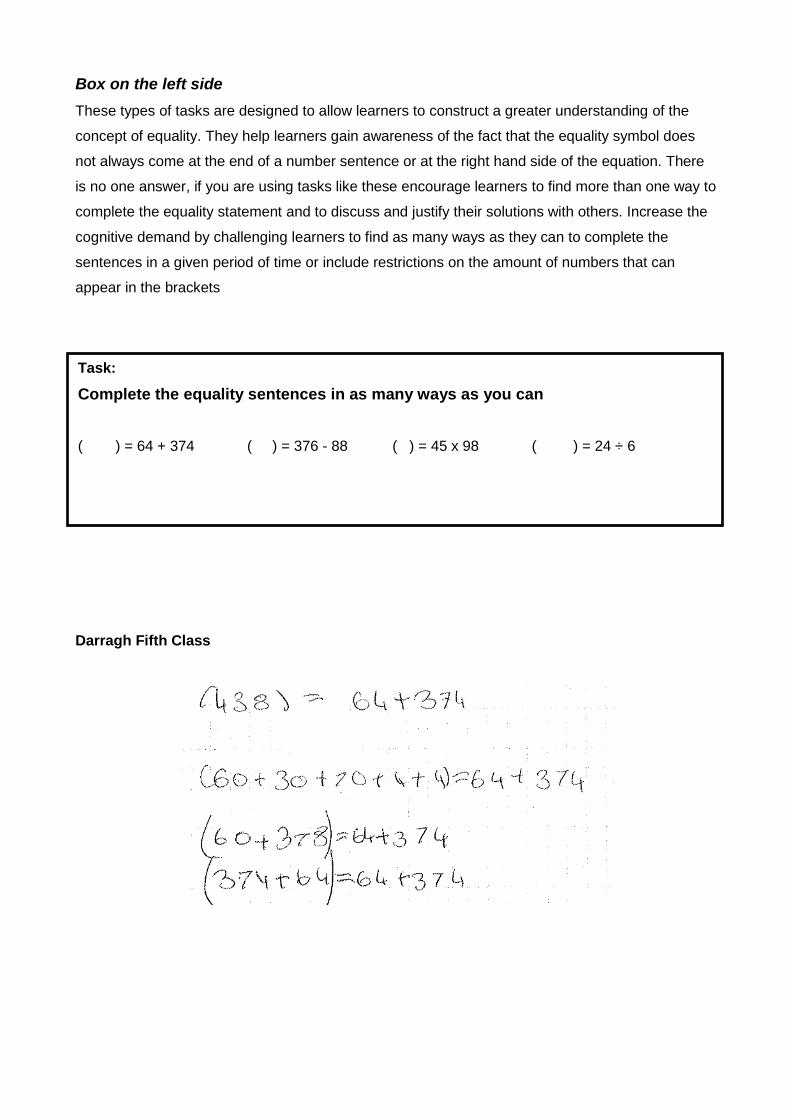
Box on the left side
These types of tasks are designed to allow learners to construct a greater understanding of the
concept of equality. They help learners gain awareness of the fact that the equality symbol does
not always come at the end of a number sentence or at the right hand side of the equation. There
is no one answer, if you are using tasks like these encourage learners to find more than one way to
complete the equality statement and to discuss and justify their solutions with others. Increase the
cognitive demand by challenging learners to find as many ways as they can to complete the
sentences in a given period of time or include restrictions on the amount of numbers that can
appear in the brackets
Darragh Fifth Class
Task:
Complete the equality sentences in as many ways as you can
( ) = 64 + 374 ( ) = 376 - 88 ( ) = 45 x 98 ( ) = 24 ÷ 6
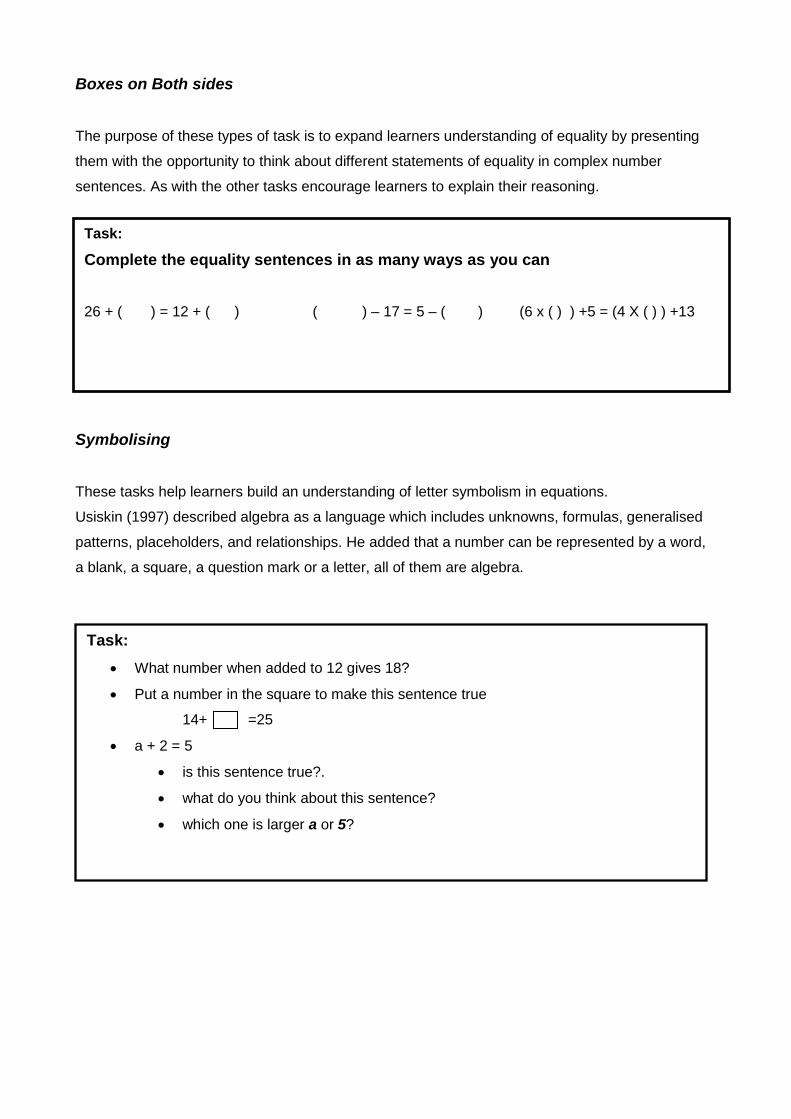
Boxes on Both sides
The purpose of these types of task is to expand learners understanding of equality by presenting
them with the opportunity to think about different statements of equality in complex number
sentences. As with the other tasks encourage learners to explain their reasoning.
Symbolising
These tasks help learners build an understanding of letter symbolism in equations.
Usiskin (1997) described algebra as a language which includes unknowns, formulas, generalised
patterns, placeholders, and relationships. He added that a number can be represented by a word,
a blank, a square, a question mark or a letter, all of them are algebra.
Task:
Complete the equality sentences in as many ways as you can
26 + ( ) = 12 + ( ) ( ) – 17 = 5 – ( ) (6 x ( ) ) +5 = (4 X ( ) ) +13
Task:
What number when added to 12 gives 18?
Put a number in the square to make this sentence true
14+ =25
a + 2 = 5
is this sentence true?.
what do you think about this sentence?
which one is larger a or 5?
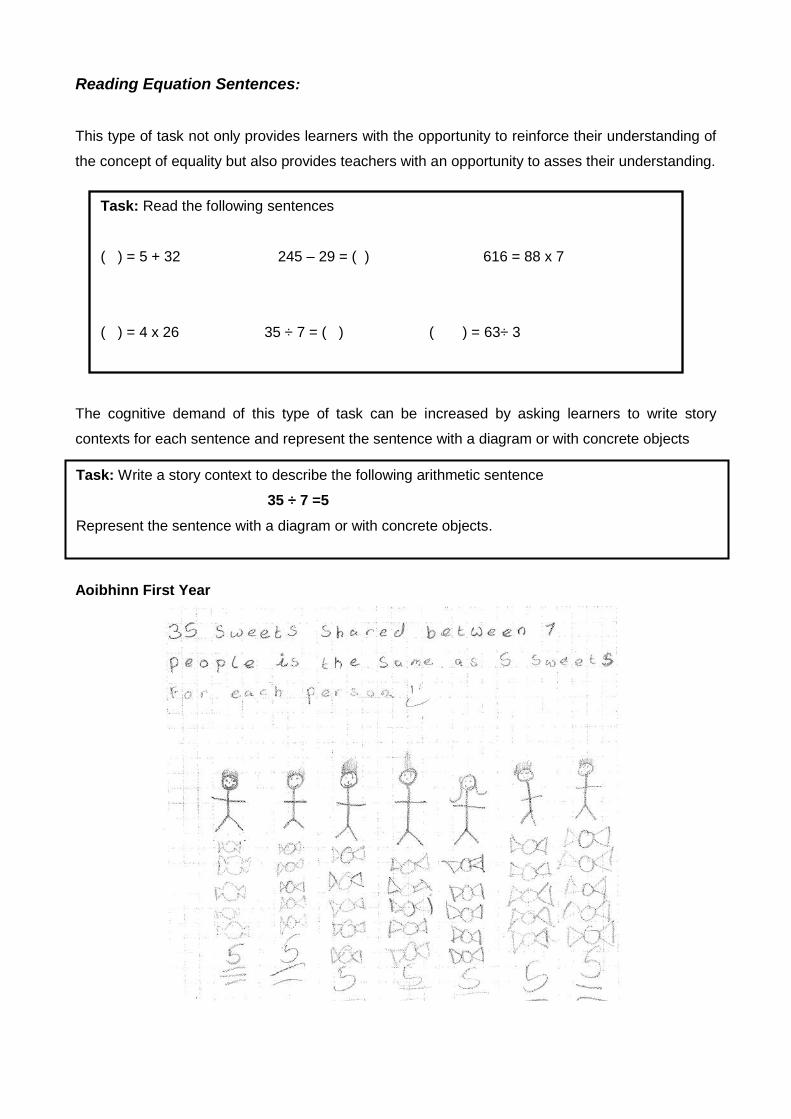
Reading Equation Sentences:
This type of task not only provides learners with the opportunity to reinforce their understanding of
the concept of equality but also provides teachers with an opportunity to asses their understanding.
The cognitive demand of this type of task can be increased by asking learners to write story
contexts for each sentence and represent the sentence with a diagram or with concrete objects
Aoibhinn First Year
Task: Read the following sentences
( ) = 5 + 32 245 – 29 = ( ) 616 = 88 x 7
( ) = 4 x 26 35 ÷ 7 = ( ) ( ) = 63÷ 3
8=8
Task: Write a story context to describe the following arithmetic sentence
35 ÷ 7 =5
Represent the sentence with a diagram or with concrete objects.
.
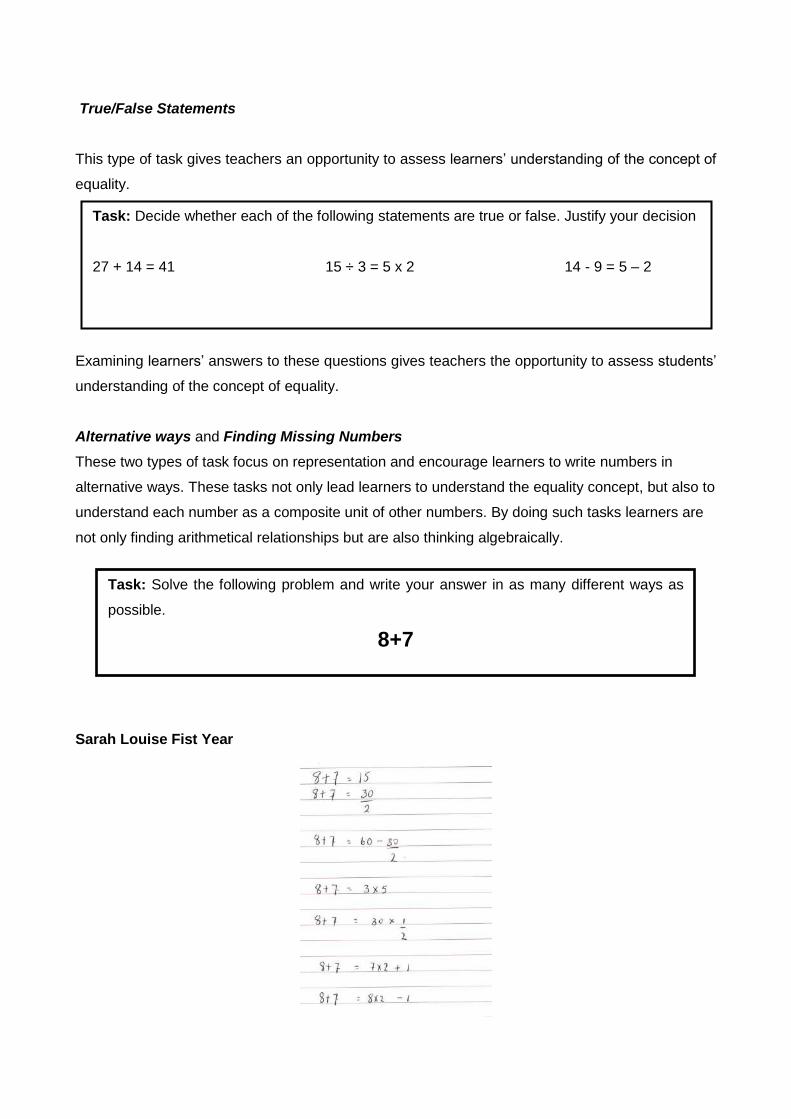
True/False Statements
This type of task gives teachers an opportunity to assess learners’ understanding of the concept of
equality.
Examining learners’ answers to these questions gives teachers the opportunity to assess students’
understanding of the concept of equality.
Alternative ways and Finding Missing Numbers
These two types of task focus on representation and encourage learners to write numbers in
alternative ways. These tasks not only lead learners to understand the equality concept, but also to
understand each number as a composite unit of other numbers. By doing such tasks learners are
not only finding arithmetical relationships but are also thinking algebraically.
Sarah Louise Fist Year
Task: Decide whether each of the following statements are true or false. Justify your decision
27 + 14 = 41 15 ÷ 3 = 5 x 2 14 - 9 = 5 – 2
Task: Solve the following problem and write your answer in as many different ways as
possible.
8+7
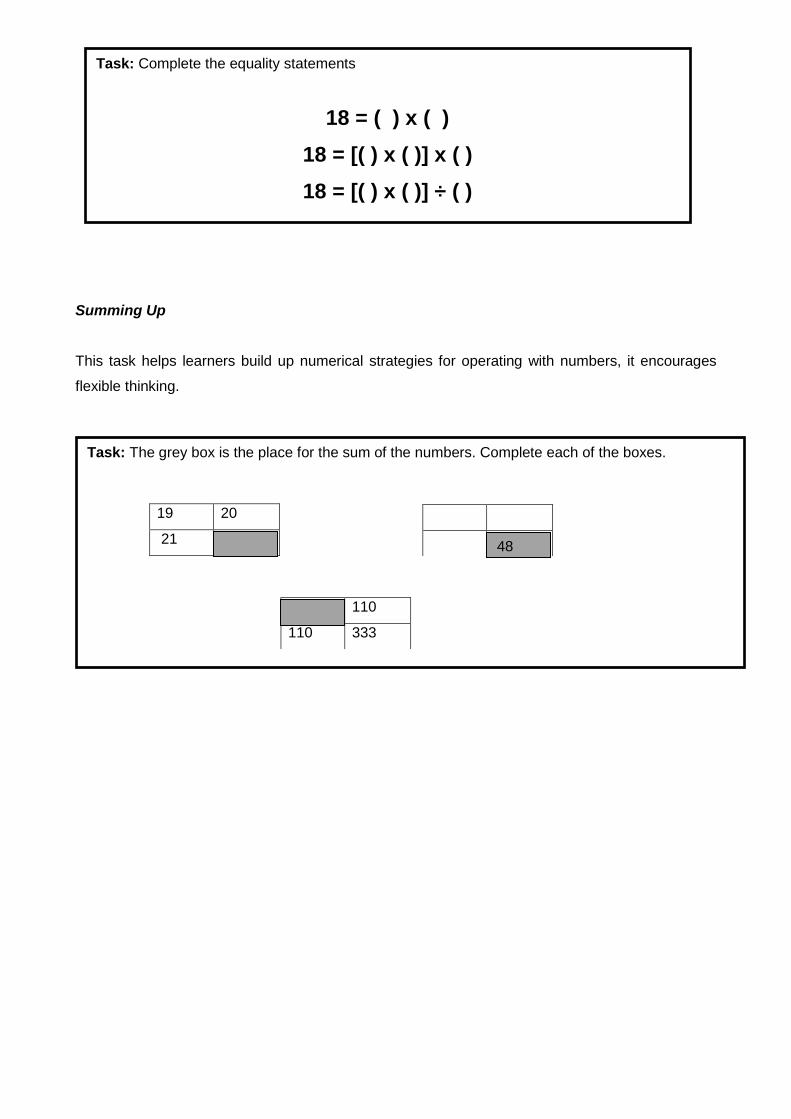
Summing Up
This task helps learners build up numerical strategies for operating with numbers, it encourages
flexible thinking.
19 20
21
110
110 333
Task: Complete the equality statements
18 = ( ) x ( )
18 = [( ) x ( )] x ( )
18 = [( ) x ( )] ÷ ( )
Task: The grey box is the place for the sum of the numbers. Complete each of the boxes.
48
Think deeper about the learning outcome by reading these documents.
Functions• A guide to Post-Primary Functions - pages 92-95
Read the Big Ideas about Functions, how they develop across the levels and connect across the
strands
Inferential Statistics• A guide to Post-Primary Inferential Statistics - pages 96-99
Read the Big Ideas about Inferential Statistics and how they develop across the levels
Algebra• Algebra, the Big Ideas - page 100
See an overview of how the concept of algebra develops from early childhood
Geometry• Geometry for Post-primary schools
Read the Big Ideas about synthetic geometry on page 27 of the JC Mathematics specificiation
available here
Post-Primary: Junior Cycle
Mathematics - Information
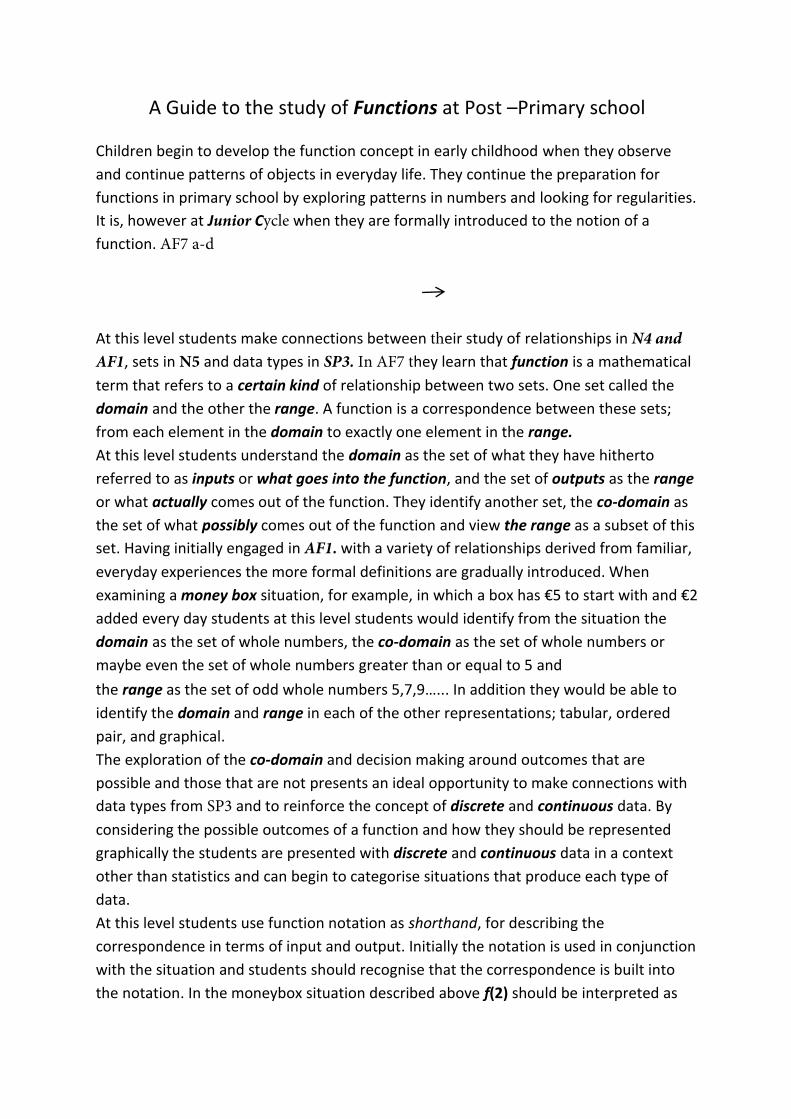
A Guide to the study of Functions at Post –Primary school
Children begin to develop the function concept in early childhood when they observe
and continue patterns of objects in everyday life. They continue the preparation for
functions in primary school by exploring patterns in numbers and looking for regularities.
It is, however at Junior Cycle when they are formally introduced to the notion of a
function. AF7 a-d
At this level students make connections between their study of relationships in N4 and AF1, sets in N5 and data types in SP3. In AF7 they learn that function is a mathematical term that refers to a certain kind of relationship between two sets. One set called the
domain and the other the range. A function is a correspondence between these sets;
from each element in the domain to exactly one element in the range.
At this level students understand the domain as the set of what they have hitherto
referred to as inputs or what goes into the function, and the set of outputs as the range
or what actually comes out of the function. They identify another set, the co-domain as
the set of what possibly comes out of the function and view the range as a subset of this
set. Having initially engaged in AF1. with a variety of relationships derived from familiar, everyday experiences the more formal definitions are gradually introduced. When
examining a money box situation, for example, in which a box has €5 to start with and €2
added every day students at this level students would identify from the situation the
domain as the set of whole numbers, the co-domain as the set of whole numbers or
maybe even the set of whole numbers greater than or equal to 5 and
the range as the set of odd whole numbers 5,7,9…... In addition they would be able to
identify the domain and range in each of the other representations; tabular, ordered
pair, and graphical.
The exploration of the co-domain and decision making around outcomes that are
possible and those that are not presents an ideal opportunity to make connections with
data types from SP3 and to reinforce the concept of discrete and continuous data. By
considering the possible outcomes of a function and how they should be represented
graphically the students are presented with discrete and continuous data in a context
other than statistics and can begin to categorise situations that produce each type of
data.
At this level students use function notation as shorthand, for describing the
correspondence in terms of input and output. Initially the notation is used in conjunction
with the situation and students should recognise that the correspondence is built into
the notation. In the moneybox situation described above f(2) should be interpreted as
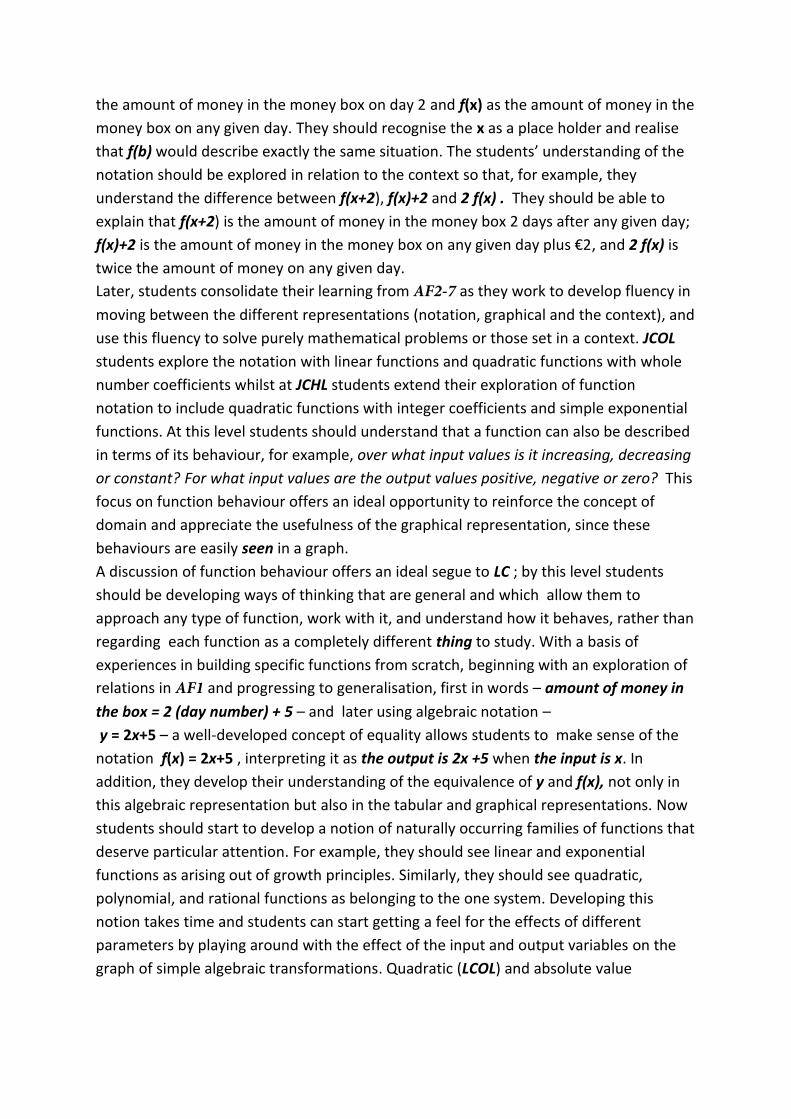
the amount of money in the money box on day 2 and f(x) as the amount of money in the
money box on any given day. They should recognise the x as a place holder and realise
that f(b) would describe exactly the same situation. The students’ understanding of the
notation should be explored in relation to the context so that, for example, they
understand the difference between f(x+2), f(x)+2 and 2 f(x) . They should be able to
explain that f(x+2) is the amount of money in the money box 2 days after any given day;
f(x)+2 is the amount of money in the money box on any given day plus €2, and 2 f(x) is
twice the amount of money on any given day.
Later, students consolidate their learning from AF2-7 as they work to develop fluency in
moving between the different representations (notation, graphical and the context), and
use this fluency to solve purely mathematical problems or those set in a context. JCOL
students explore the notation with linear functions and quadratic functions with whole
number coefficients whilst at JCHL students extend their exploration of function
notation to include quadratic functions with integer coefficients and simple exponential
functions. At this level students should understand that a function can also be described
in terms of its behaviour, for example, over what input values is it increasing, decreasing
or constant? For what input values are the output values positive, negative or zero? This
focus on function behaviour offers an ideal opportunity to reinforce the concept of
domain and appreciate the usefulness of the graphical representation, since these
behaviours are easily seen in a graph.
A discussion of function behaviour offers an ideal segue to LC ; by this level students
should be developing ways of thinking that are general and which allow them to
approach any type of function, work with it, and understand how it behaves, rather than
regarding each function as a completely different thing to study. With a basis of
experiences in building specific functions from scratch, beginning with an exploration of
relations in AF1 and progressing to generalisation, first in words – amount of money in
the box = 2 (day number) + 5 – and later using algebraic notation –
y = 2x+5 – a well-developed concept of equality allows students to make sense of the
notation f(x) = 2x+5 , interpreting it as the output is 2x +5 when the input is x. In
addition, they develop their understanding of the equivalence of y and f(x), not only in
this algebraic representation but also in the tabular and graphical representations. Now
students should start to develop a notion of naturally occurring families of functions that
deserve particular attention. For example, they should see linear and exponential
functions as arising out of growth principles. Similarly, they should see quadratic,
polynomial, and rational functions as belonging to the one system. Developing this
notion takes time and students can start getting a feel for the effects of different
parameters by playing around with the effect of the input and output variables on the
graph of simple algebraic transformations. Quadratic (LCOL) and absolute value

functions (LCHL) are good contexts for getting a sense of the effects of many of these
transformations.
Proficient mathematicians will make use of structure to help solve problems and at all
levels students should be encouraged to look for and make use of structure.
Consequently, students should develop the practice of writing expressions for functions
in ways that reveal the key features of the function. At LCHL, exploring quadratic
functions provides an ideal opportunity for developing this ability, since the three
principal representations for a quadratic expression – expanded, factored, and
completed square – each give insight into different aspects of the function.
At LCHL, students extend the idea of the co-domain introduced at JCOL when they begin to categorise functions as surjective, injective or bijective. Exploring the effects of limiting the domain and co-domain on the function ‘status’ reinforces the difference between them and also helps students to make sense of the categorisation.
At LC by examining contexts where change occurs at discrete intervals (such as
payments of interest on a bank balance) or where the input variable is a whole number
section 3.1 they come to recognise that a sequence is a function whose domain is a
subset of the set of integers. For example, when considering the sequence 5, 8, 11,14 by
choosing an index that indicates which term they are talking about and which serves as
the input value to the function, a student could make a table showing the
correspondence and describe the sequence using function notation
f(x) = 3x +2, x1 with the domain included in the description. Students are faced once
again with the concept of discrete and continuous data when they attempt to represent
a sequence graphically.
LCHL students begin engaging with the concept of the inverse of a function by first
getting to grips with the idea of going backwards from output to input. They can get this
sense of determining the input when the output is known by using a table or a graph of
the function under examination. To reinforce this idea, correspondences between
equations giving specific values of the functions, table entries, and points on the graph
can be noted. Eventually students need to generalise the process for finding the input
given a particular output and are required to generalise the process for bijective
functions only. A well-developed concept of notation and equality is required if students
are to make sense of the generalisation.
To help students develop the concept that “inverse” is a relationship between two
functions rather than a new type of function the classroom focus should be on “inverses
of functions”. Questions such as, “What is the inverse of this function?” and “Does this
function have an inverse?” are useful in keeping the focus on the relationship idea.
Connections can be made with the notion of function composition by examining the
relationship between the composition of f-1 with f. This relationship, the identity
function, which assigns each function to itself allows students to deepen their
understanding of inverses in general since it behaves with respect to composition of
functions the way the multiplicative identity, 1, behaves with multiplication of real
numbers. Now students can verify by composition (in both directions) that given
functions are inverses of each other. They can also refine their informal “going
backwards” idea, as they consider inverses of functions given by graphs or tables. They
get a sense that “going backwards” interchanges the input and output and therefore the
stereotypical roles of the letters x and y and can reason why the graph of y=f-1(x) will be
the reflection across the line y=x of the graph y=f(x).
Section 3.2 provides LCHL students with further opportunity to reinforce the concept
that “inverse” is a relationship between two functions, here students are required to
not only understand logarithms as functions but also as inverses of exponential
functions. Students can think of the logarithms as unknown exponents in expressions
with base 10 and use the properties of exponents when explaining logarithmic identities
and the laws of logarithms.
LC section 5.2 introduces students to the concept of a limit, a powerful tool for them as
they start bringing together their ability to use graphs to reason about rates of change
(JC sections4.1-4.5) and start thinking about the slope of a tangent line to a curve.
Students can develop their understanding of differentiation and why the rules work by
examining differentiation of linear and quadratic functions from fist principles although
students at LCHL only will be examined in this process.
At LCHL students build on their ability to approximate area in section 3.4 by investigating
the area under a function. Starting by finding the area between a given linear function
and the x-axis and progressing to finding the upper boundary function themselves they
come to in section 5.2 to recognise integration as the reverse process of differentiation.
By examining the problem of finding the average value of a function over a given interval
they progress to a deeper understanding of the process of integration. The ability to
determine areas of plane regions bounded by polynomial and exponential curves eases
the transition from computing discrete probabilities to continuous ones section 1.3. By
understanding the Normal distribution as a probability density function students can
understand why it is used to find probabilities for continuous random variables.
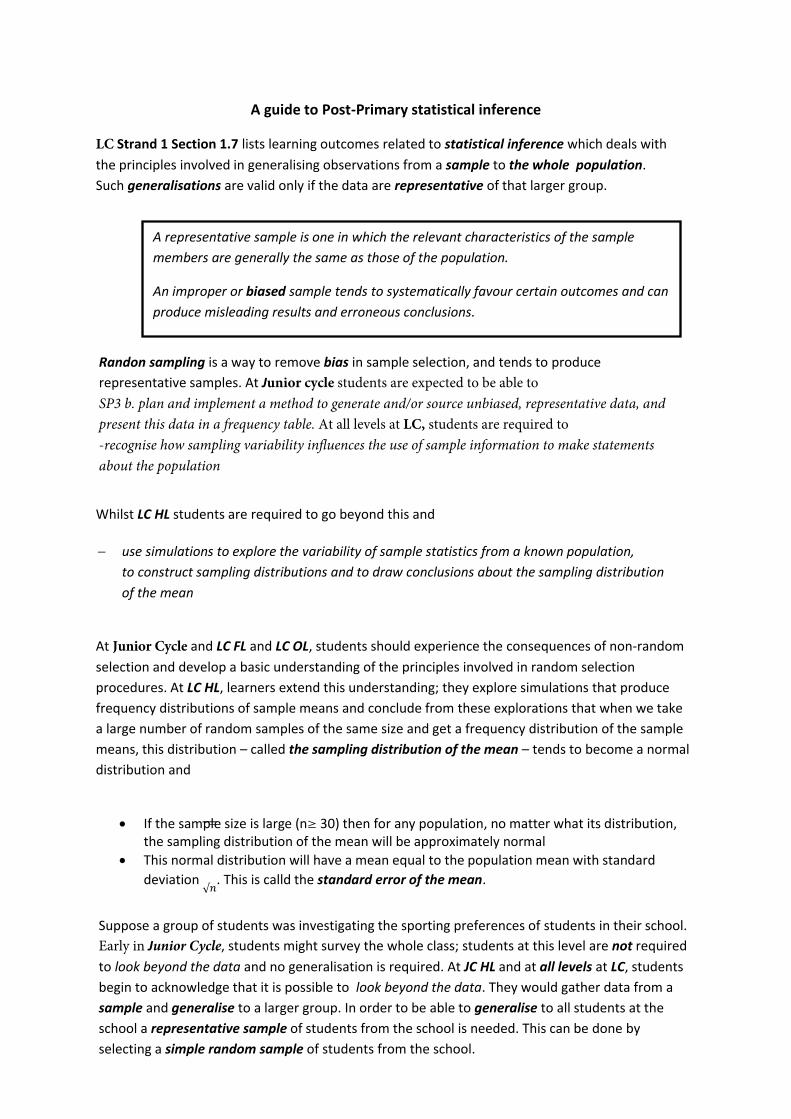
A guide to Post-Primary statistical inference
LC Strand 1 Section 1.7 lists learning outcomes related to statistical inference which deals with
the principles involved in generalising observations from a sample to the whole population.
Such generalisations are valid only if the data are representative of that larger group.
Randon sampling is a way to remove bias in sample selection, and tends to produce
representative samples. At Junior cycle students are expected to be able to SP3 b. plan and implement a method to generate and/or source unbiased, representative data, and present this data in a frequency table. At all levels at LC, students are required to -recognise how sampling variability influences the use of sample information to make statements about the population
Whilst LC HL students are required to go beyond this and
use simulations to explore the variability of sample statistics from a known population,
to construct sampling distributions and to draw conclusions about the sampling distribution
of the mean
At Junior Cycle and LC FL and LC OL, students should experience the consequences of non-random selection and develop a basic understanding of the principles involved in random selection
procedures. At LC HL, learners extend this understanding; they explore simulations that produce
frequency distributions of sample means and conclude from these explorations that when we take
a large number of random samples of the same size and get a frequency distribution of the sample
means, this distribution – called the sampling distribution of the mean – tends to become a normal
distribution and
If the sample size is large (n 30) then for any population, no matter what its distribution,the sampling distribution of the mean will be approximately normal
This normal distribution will have a mean equal to the population mean with standard
deviation √
. This is calld the standard error of the mean.
Suppose a group of students was investigating the sporting preferences of students in their school.
Early in Junior Cycle, students might survey the whole class; students at this level are not required
to look beyond the data and no generalisation is required. At JC HL and at all levels at LC, students
begin to acknowledge that it is possible to look beyond the data. They would gather data from a
sample and generalise to a larger group. In order to be able to generalise to all students at the
school a representative sample of students from the school is needed. This can be done by
selecting a simple random sample of students from the school.
A representative sample is one in which the relevant characteristics of the sample
members are generally the same as those of the population.
An improper or biased sample tends to systematically favour certain outcomes and can
produce misleading results and erroneous conclusions.
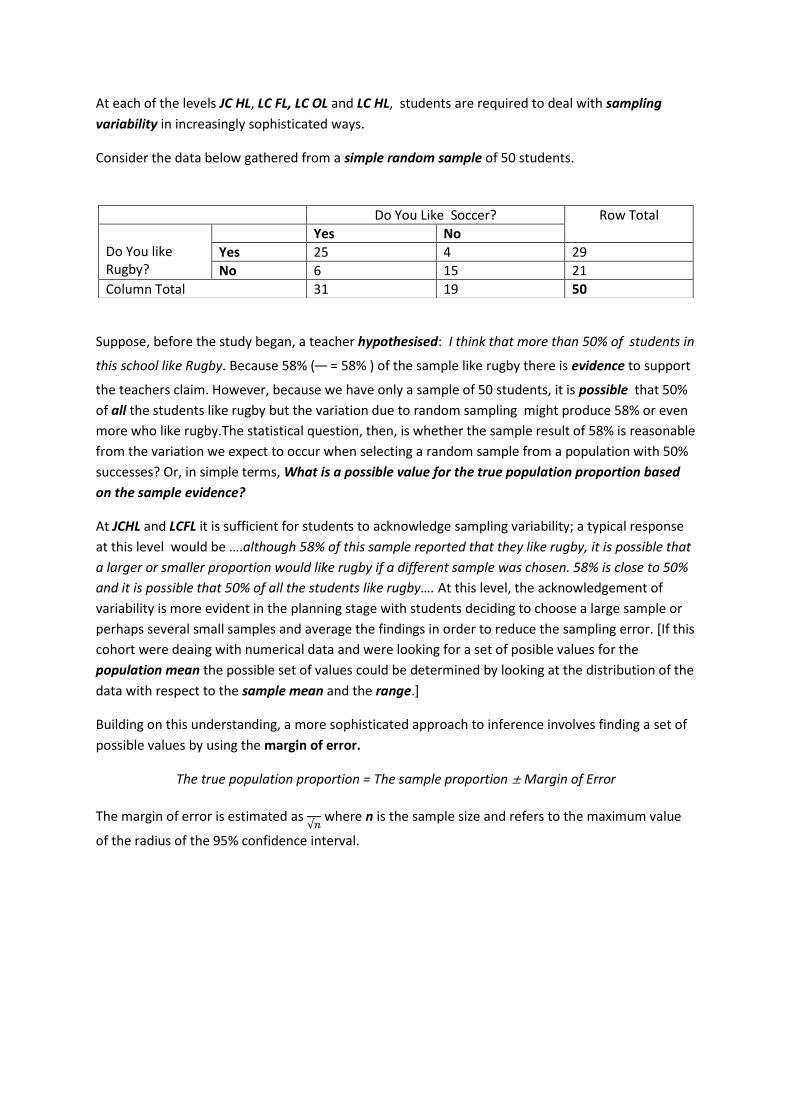
At each of the levels JC HL, LC FL, LC OL and LC HL, students are required to deal with sampling
variability in increasingly sophisticated ways.
Consider the data below gathered from a simple random sample of 50 students.
Suppose, before the study began, a teacher hypothesised: I think that more than 50% of students in
this school like Rugby. Because 58% ( = 58% ) of the sample like rugby there is evidence to support
the teachers claim. However, because we have only a sample of 50 students, it is possible that 50%
of all the students like rugby but the variation due to random sampling might produce 58% or even
more who like rugby.The statistical question, then, is whether the sample result of 58% is reasonable
from the variation we expect to occur when selecting a random sample from a population with 50%
successes? Or, in simple terms, What is a possible value for the true population proportion based
on the sample evidence?
At JCHL and LCFL it is sufficient for students to acknowledge sampling variability; a typical response
at this level would be ….although 58% of this sample reported that they like rugby, it is possible that
a larger or smaller proportion would like rugby if a different sample was chosen. 58% is close to 50%
and it is possible that 50% of all the students like rugby…. At this level, the acknowledgement of
variability is more evident in the planning stage with students deciding to choose a large sample or
perhaps several small samples and average the findings in order to reduce the sampling error. [If this
cohort were deaing with numerical data and were looking for a set of posible values for the
population mean the possible set of values could be determined by looking at the distribution of the
data with respect to the sample mean and the range.]
Building on this understanding, a more sophisticated approach to inference involves finding a set of
possible values by using the margin of error.
The true population proportion = The sample proportion Margin of Error
The margin of error is estimated as √
where n is the sample size and refers to the maximum value
of the radius of the 95% confidence interval.
Do You Like Soccer? Row Total
Do You like Rugby?
Yes No
Yes 25 4 29
No 6 15 21
Column Total 31 19 50
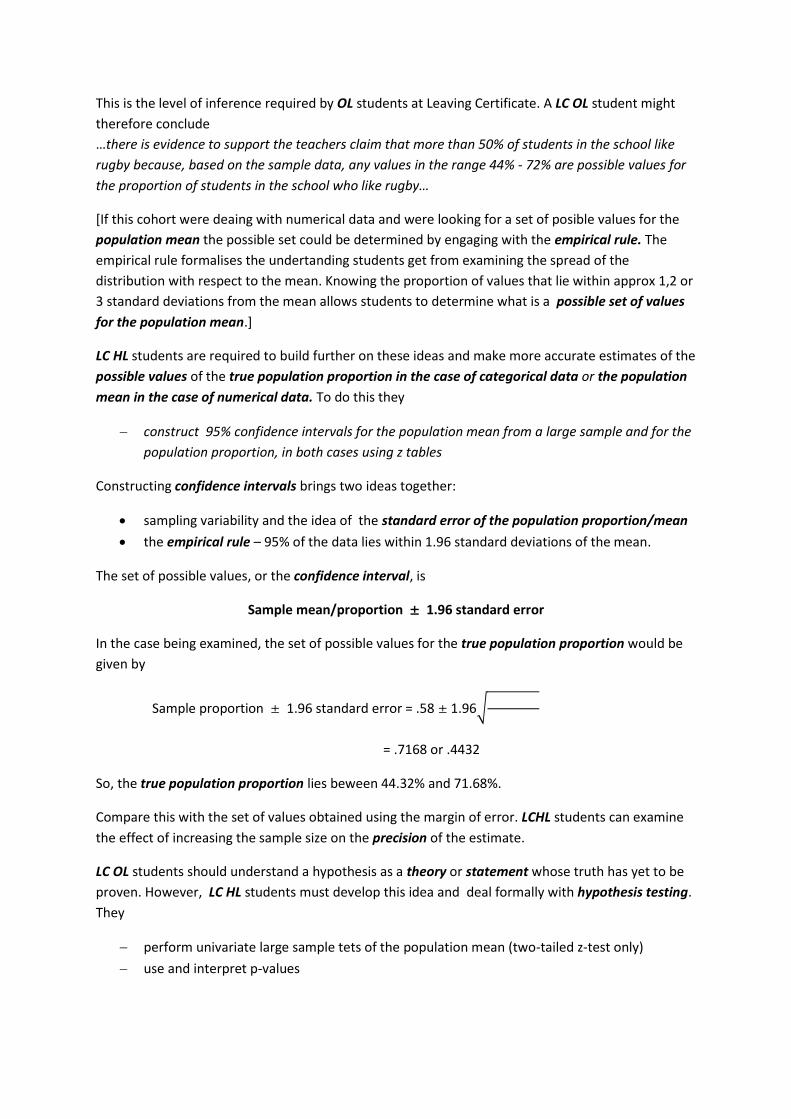
This is the level of inference required by OL students at Leaving Certificate. A LC OL student might
therefore conclude
…there is evidence to support the teachers claim that more than 50% of students in the school like
rugby because, based on the sample data, any values in the range 44% - 72% are possible values for
the proportion of students in the school who like rugby…
[If this cohort were deaing with numerical data and were looking for a set of posible values for the
population mean the possible set could be determined by engaging with the empirical rule. The
empirical rule formalises the undertanding students get from examining the spread of the
distribution with respect to the mean. Knowing the proportion of values that lie within approx 1,2 or
3 standard deviations from the mean allows students to determine what is a possible set of values
for the population mean.]
LC HL students are required to build further on these ideas and make more accurate estimates of the
possible values of the true population proportion in the case of categorical data or the population
mean in the case of numerical data. To do this they
construct 95% confidence intervals for the population mean from a large sample and for the
population proportion, in both cases using z tables
Constructing confidence intervals brings two ideas together:
sampling variability and the idea of the standard error of the population proportion/mean
the empirical rule – 95% of the data lies within 1.96 standard deviations of the mean.
The set of possible values, or the confidence interval, is
Sample mean/proportion 1.96 standard error
In the case being examined, the set of possible values for the true population proportion would be
given by
Sample proportion 1.96 standard error = .58 1.96√
= .7168 or .4432
So, the true population proportion lies beween 44.32% and 71.68%.
Compare this with the set of values obtained using the margin of error. LCHL students can examine
the effect of increasing the sample size on the precision of the estimate.
LC OL students should understand a hypothesis as a theory or statement whose truth has yet to be
proven. However, LC HL students must develop this idea and deal formally with hypothesis testing.
They
perform univariate large sample tets of the population mean (two-tailed z-test only)
use and interpret p-values
The p-value represents the chance of observing the result obtained in the sample, or a value more
extreme, when the hypothesised value is in fact correct. A small p-value would support the teacher’s
claim because this would have indicated that, if the population proportion was 0.50 (50%), it would
be very unlikely that an observation of 0.58 (58%) would be observed.
A large sample hypothesis test of the population mean has 4 components:
1. A test statistic: This is a standard normal z score that is the difference between the value we have
observed for the sample and the hypothesised value for the poulation divided by the standard
error of the mean.
2. A decision rule: Reject the hypothesised value if z > 1.96 or z < -1.96
3. A rejection zone: z > 1.96 or z <-1.96
4. Critical values: z = 1.96 , z = -1.96 since we are using the 5% level of significance.

Conceptual progression to Algebra
Early Childhood Primary Transition Period Junior Cycle
Represent and solve problems involving addition and subtraction
Represent and solve problems involving multiplication and division N.1,U2,U3,U4,U7,U10
Understand the place value system N1,U4
Apply and extend previous understandings of multiplication and division to divide fractions by fractions N1,N2,U6,U7,U8
Apply and extend previous understandings of operations with fractions to add , subtract , multiply and divide rational numbers
Work with radical and integer exponents N1,
Know number names and the count sequence
Understand properties of operations and the relationship between multiplication and division N.1U1,U4
Multiply and divide within 100 N.1
Generalise place value understanding for multidigit whole numbers
Perform operations with multi-digit whole numbers and decimals to hundredths, N1,U4
Apply and extend previous understandings to the system of rational numbers N2,U4,U6,U7,U8
Understand the connections between proportional relationships, lines and linear equationsAF1,U4,UU7
Count to tell the number of objects
Understand and apply properties of operations and the relationship between addition and subtraction
Add and subtract within20
Use place value understanding and properties of operations to perform multi-digit arithmetic N.1U4
Use equivalent fractions as a strategy to add and subtract fractions N2,U4
Understand ratio concepts and use ratio reasoning to solve problemsN3,U4,U6U7,U8
Analyse proportional relationships and use them to solve real-world and mathematical problems N2,N3,AF1,U4,U7,U11
Use properties of operations to generate equivalent expressions N1,N2,AF3
Compare numbers Solve problems involving the four operations , and identify and explain patterns in arithmetic N.1,U4
Extend understanding of fraction equivalence and ordering N2,U4,U7
Apply and extend previous understandings of multiplication and division to multiply and divide fractions N1,N2,U4
Apply and extend previous understandings of arithmetic to algebraic expressions Section3.1, 4.3, N1,N2,U11,AF1,AF2
Analyse and solve linear equations and pairs of simultaneous linear equations AF1-7 U4U11
Understand addition as putting together and adding to and understand subtraction as taking apart and taking from
Work with addition and subtraction equations. Extend the counting sequence
Use place value understanding and properties of operations to add and subtract measure and estimate lengths in standard units
Develop an understanding of fractions as numbers N.2
Solve problems involving measurement and estimation of intervals of time, liquid volumes and masses of objects N.3
understand concepts of area and relate area to multiplication and addition N.1, GT.2
Build fractions from unit fractions by applying and extending previous understandings of operations N2,U4
Understand decimal notation for fractions, and compare decimal fractions N2,U4
Geometric measurement: understand concepts of volume and relate volume to multiplication and addition N1,GT1,GT2,,U1,U4,U7
Reason about and solve one variable equations and inequalities AF3
Define evaluate and compare functions AF1,AF7,U4
Work with numbers 11-19 to gain foundations for place value
Understand place value
Use place value understanding and properties of operations to add and subtract measure lengths indirectly and by iterating length units
Relate addition and subtraction to length
Graph points on the co-ordinate plane to solve real world and mathematical problems GT5,U6,U7,U8
Represent and analyse quantitative relationships between dependent and independent variables AF1,AF2U4,U71
Solve real world and mathematical problems using numerical and algebraic expressions and equations Sections 4.2,4.3, AF1-3, U4
Use functions to model relationships between quantitiesAF7

Student Resource Booklets
StatisticsStudent resource book - pages 102-146
Geometry and TrigonometryStudent resource book - pages 147- 180
Post-Primary: Junior Cycle
Mathematics - Independent Learning
Mathematics Resources for Students
Junior Cycle
Statistics and Probability
© NCCA 2009

- Mathematics Resources for Students
InTROduCTIOn
This material is designed to supplement the work you do in class and is intended to be kept in an A4 folder. Activities are included to help you gain an understanding of the mathematical concepts and these are followed by questions that assess your understanding of those concepts. While there are spaces provided in some activities/questions for you to complete your work, you will also need to use your copybook/A4 pad or graph paper. Remember to organise your folder so that it will be useful to you when you revise for tests and examinations. As you add pages to your folder, you might consider dating or coding them in a way that associates them with the different topics or syllabus sections. Organising your work in this way will help you become personally effective. Being personally effective is one of the five key skills identified by the NCCA as central to learning (www.ncca.ie/keyskills). These key skills are important for all students to achieve their full potential, both during their time in school and into the future.
As you work through the material in this booklet and with your teacher in class, you will be given opportunities to develop the other key skills. You will frequently work in pairs or groups, which involves organising your time effectively and communicating your ideas to the group or class. You will justify your solutions to problems and develop your critical and creative skills as you solve those problems. As you complete the activities you will be required to process and interpret information presented in a variety of ways. You will be expected to apply the knowledge gained to draw conclusions and make decisions based on your analysis. The sequence in which the sections/topics are presented here is not significant. You may be studying these in a different order, or dipping in and out of various sections over the course of your study and/or revision.
The questions included in this booklet provide you with plenty of opportunities to develop communication skills and to promote mathematical discourse. When your teachers mark your work they will gain insights into your learning and will be able to advise you on what you need to do next.
The material in the booklet is suitable for Junior Cycle It builds on the concepts learned in primary school and continues the investigative and experimental approach to learning about data, data handling, and probability (chance). Through completing the activities and questions contained in this booklet, you will develop a set of tools that will help you become a more effective learner and these tools can be used across the curriculum. Solving problems of this nature should also improve your confidence in doing mathematics, thus helping you to develop a positive attitude towards mathematics and to appreciate its role in your life.
The JC Mathematics specifciation can be accessed on www.curriculumonline.ie
1
Junior Cycle Mathematics STATISTICS AND PROBABILITY
InTROduCTIOnThe activities described below and the questions that follow give you the opportunity to reinforce your understanding of the basic concepts of probability. The activities are designed to build on previous experiences where you estimated the likelihood of an event occurring. Some of the activities will be done in class under the direction of your teacher; others can be done at home.
Activity 1.1A probability describes mathematically how likely it is that something will happen. We can talk about the probability it will rain tomorrow or the probability that Ireland will win the World Cup.
Consider the probability of the following events • It will snow on St Patrick’s day
• It will rain tomorrow
• Munster will win the Heineken Cup
• It is your teacher’s birthday tomorrow
• You will obtain a 7 when rolling a die
• You will eat something later today
• It will get dark later today
Words you may decide to use: certain, impossible, likely, very likely
PRObAbIlITy 1
ConCeptS of pRobability
lEARnIng OuTCOME SP1,SP2As a result of completing the activities in this section you will be able to• decide whether an everyday event is likely or unlikely to happen
• recognise that probability is a measure on a scale of 0 - 1 of how likely an event isto occur.
• connect with set theory; discuss experiments, outcomes, sample spaces
• use the language of probability to discuss events, including those with equally likelyoutcomes

2
Mathematics Resources for Students
Student Activity
Certain not to happen Area of uncertainty Certain to happen
Phrases used to describe uncertainty
1.
2.
3.
4.
5.
Use the table provided or mark your work page out in a similar way and place each of the events in the approriate section.Note the phrases you used to describe uncertainty.
1.
2.
3.
1.
2.
3.
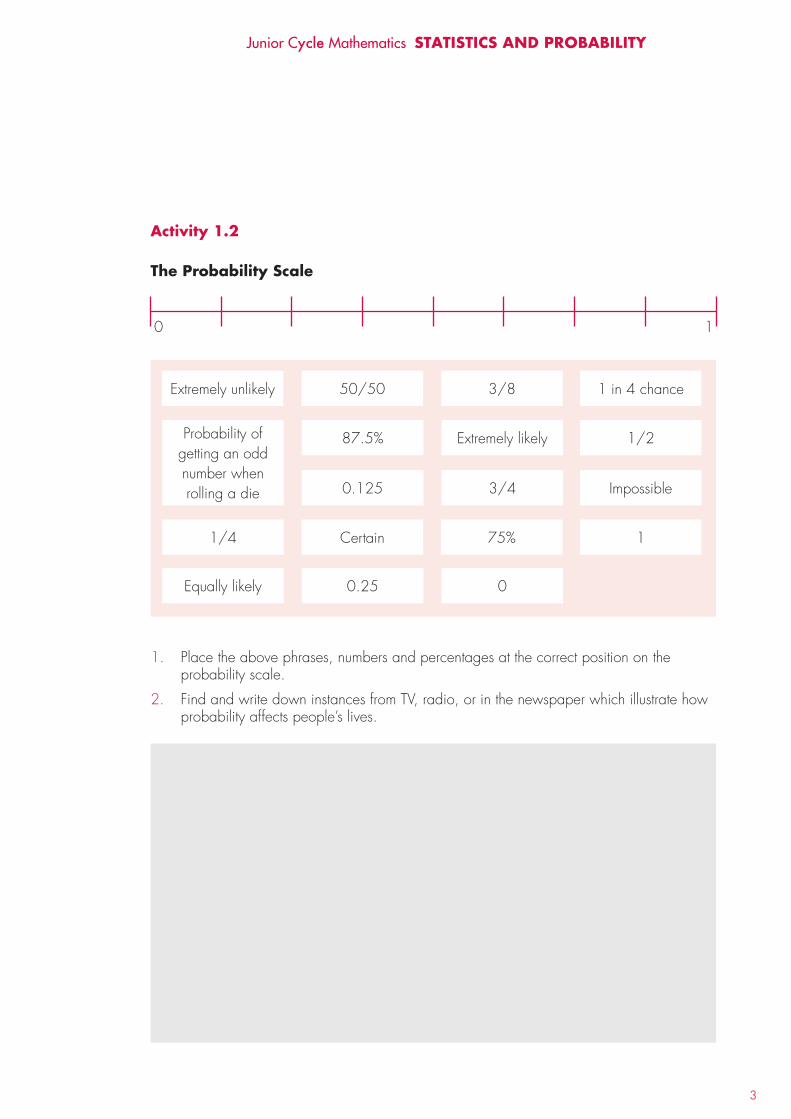
3
Junior Cycle Mathematics STATISTICS AND PROBABILITY
Activity 1.2
The Probability Scale
1. Place the above phrases, numbers and percentages at the correct position on theprobability scale.
2. Find and write down instances from TV, radio, or in the newspaper which illustrate howprobability affects people’s lives.
10
Extremely unlikely 50/50 1 in 4 chance3/8
87.5%
1/4
1/2
3/4
75% 1
Impossible
Equally likely 0.25
0.125
0
Certain
Extremely likelyProbability of getting an odd number when rolling a die
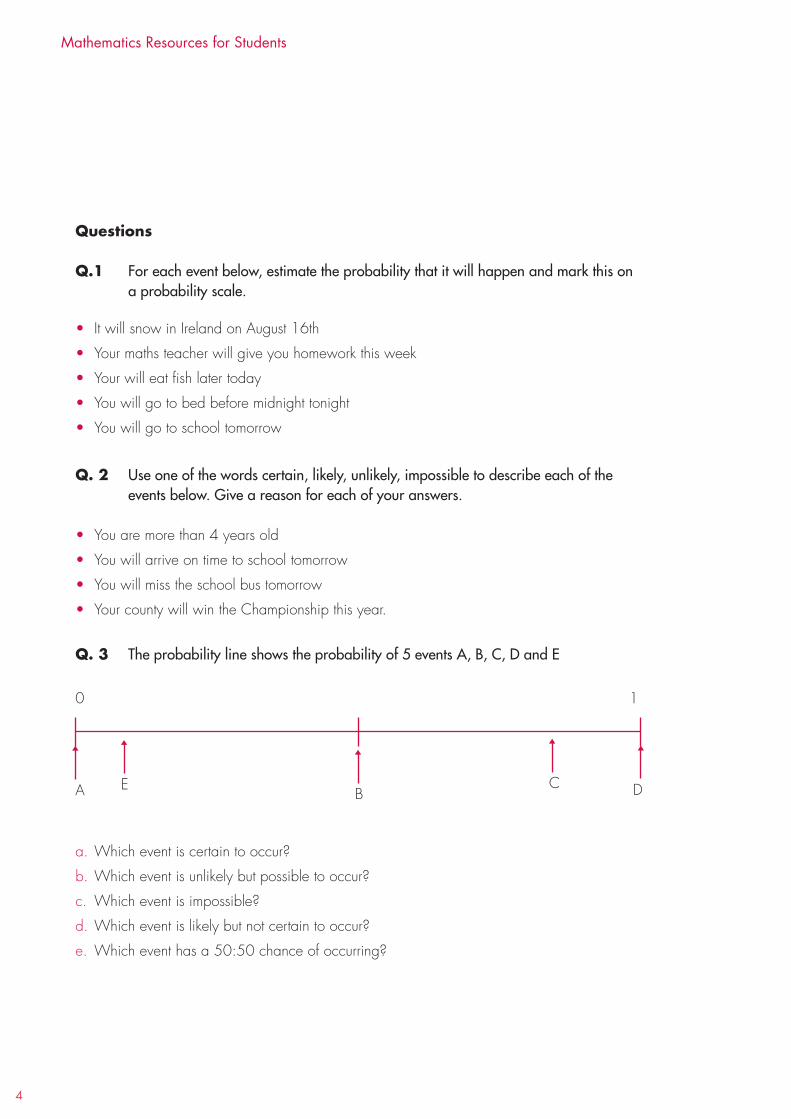
4
Mathematics Resources for Students
Questions
Q.1 For each event below, estimate the probability that it will happen and mark this ona probability scale.
• It will snow in Ireland on August 16th
• Your maths teacher will give you homework this week
• Your will eat fish later today
• You will go to bed before midnight tonight
• You will go to school tomorrow
Q. 2 Use one of the words certain, likely, unlikely, impossible to describe each of theevents below. Give a reason for each of your answers.
• You are more than 4 years old
• You will arrive on time to school tomorrow
• You will miss the school bus tomorrow
• Your county will win the Championship this year.
Q. 3 The probability line shows the probability of 5 events A, B, C, D and E
a. Which event is certain to occur?
b. Which event is unlikely but possible to occur?
c. Which event is impossible?
d. Which event is likely but not certain to occur?
e. Which event has a 50:50 chance of occurring?
10
A EB
C D
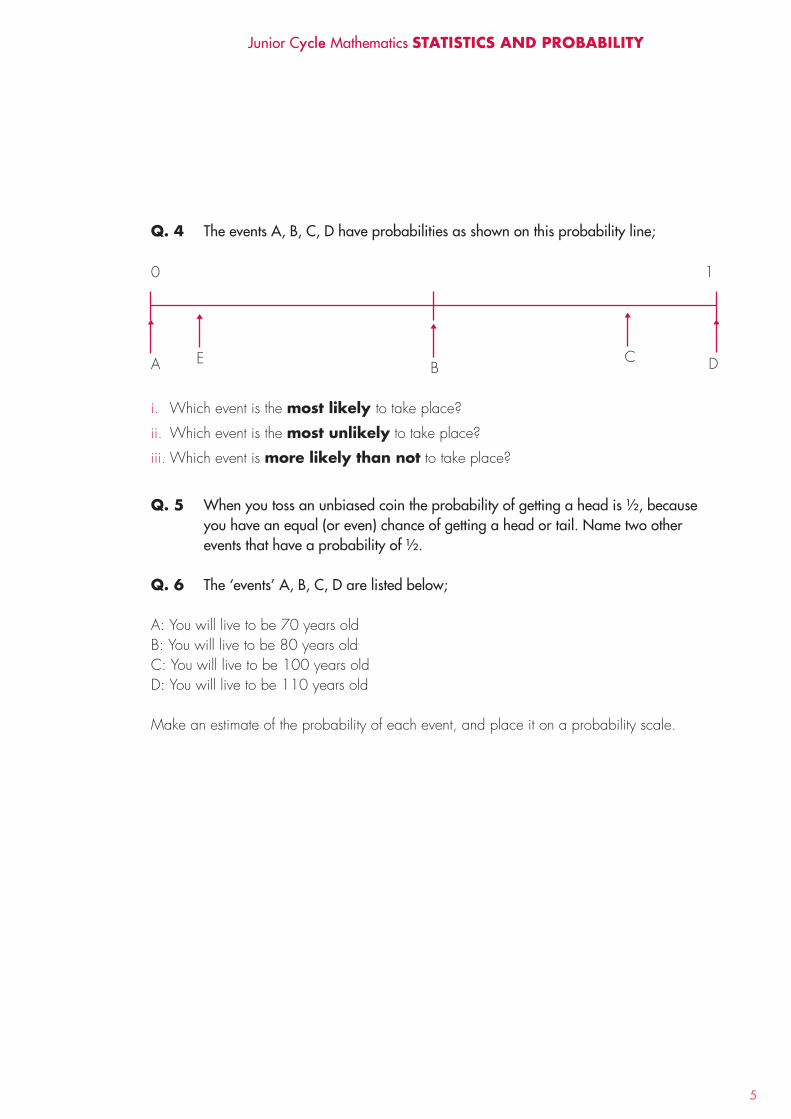
5
Junior Cycle Mathematics STATISTICS AND PROBABILITY
Q. 4 The events A, B, C, D have probabilities as shown on this probability line;
i. Which event is the most likely to take place?
ii. Which event is the most unlikely to take place?
iii. Which event is more likely than not to take place?
Q. 5 When you toss an unbiased coin the probability of getting a head is ½, becauseyou have an equal (or even) chance of getting a head or tail. Name two other events that have a probability of ½.
Q. 6 The ‘events’ A, B, C, D are listed below;
A: You will live to be 70 years oldB: You will live to be 80 years oldC: You will live to be 100 years oldD: You will live to be 110 years old
Make an estimate of the probability of each event, and place it on a probability scale.
10
A EB
C D

6
Mathematics Resources for Students
Q. 7 Sarah and Alex are exploring probability and Sarah has these cards:
Alex takes a card without looking. Sarah says
i. Explain why Sarah is wrong.
ii. Here are some words and phrases that can be associated with probability:
Choose a word or a phrase to fill in the gaps below.
It is ...................... that the number on Alex’s card will be smaller than 10.
It is ...................... that the number on Alex’s card will be an odd number.
2 3 9 5 6 7 8 9
On Alex’s card is more likely than
impossible not likely certain likely
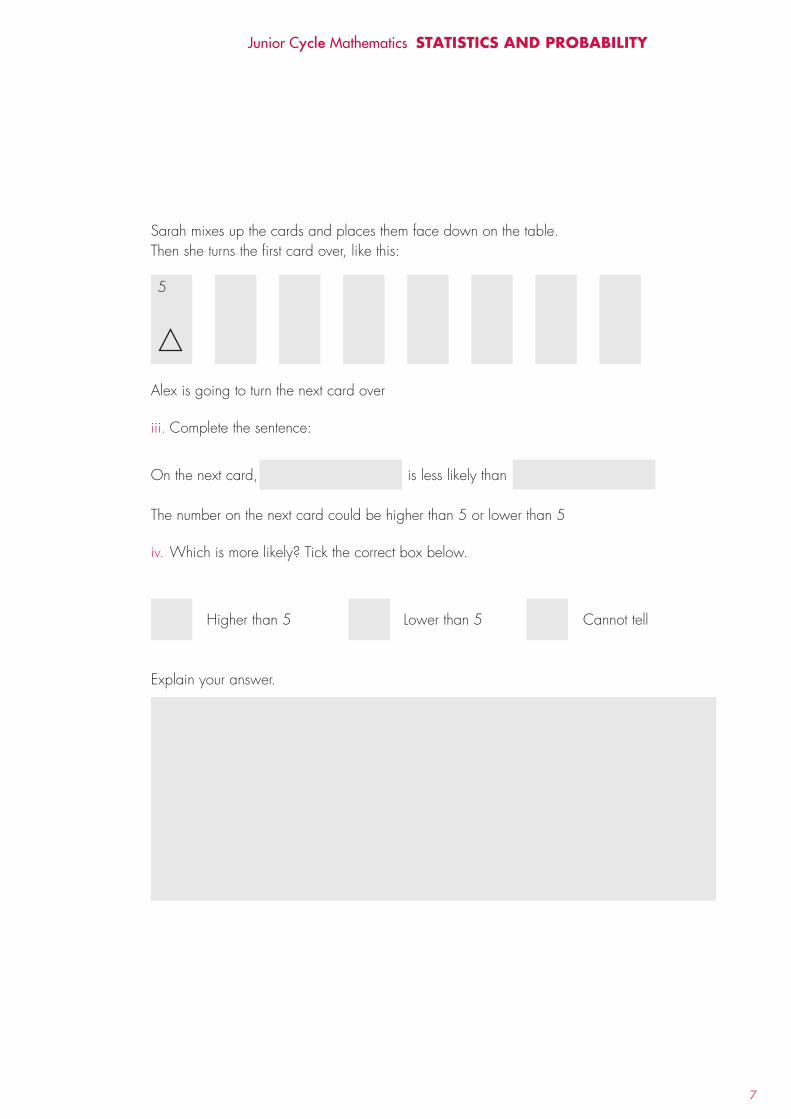
7
Junior Cycle Mathematics STATISTICS AND PROBABILITY
Sarah mixes up the cards and places them face down on the table.Then she turns the first card over, like this:
Alex is going to turn the next card over
iii. Complete the sentence:
On the next card, is less likely than
The number on the next card could be higher than 5 or lower than 5
iv. Which is more likely? Tick the correct box below.
Higher than 5 Lower than 5 Cannot tell
Explain your answer.
5
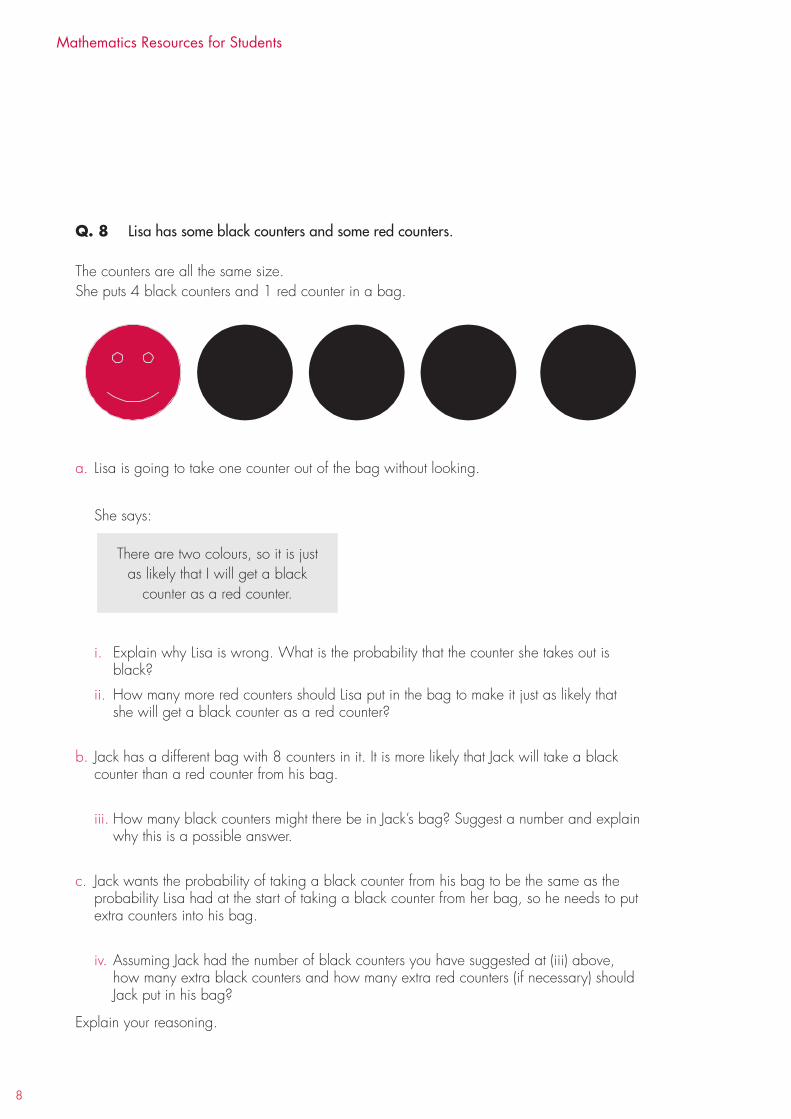
8
Mathematics Resources for Students
Q. 8 Lisa has some black counters and some red counters.
The counters are all the same size.She puts 4 black counters and 1 red counter in a bag.
a. Lisa is going to take one counter out of the bag without looking.
She says:
i. Explain why Lisa is wrong. What is the probability that the counter she takes out isblack?
ii. How many more red counters should Lisa put in the bag to make it just as likely thatshe will get a black counter as a red counter?
b. Jack has a different bag with 8 counters in it. It is more likely that Jack will take a blackcounter than a red counter from his bag.
iii. How many black counters might there be in Jack’s bag? Suggest a number and explainwhy this is a possible answer.
c. Jack wants the probability of taking a black counter from his bag to be the same as theprobability Lisa had at the start of taking a black counter from her bag, so he needs to putextra counters into his bag.
iv. Assuming Jack had the number of black counters you have suggested at (iii) above,how many extra black counters and how many extra red counters (if necessary) shouldJack put in his bag?
Explain your reasoning.
There are two colours, so it is just as likely that I will get a black
counter as a red counter.
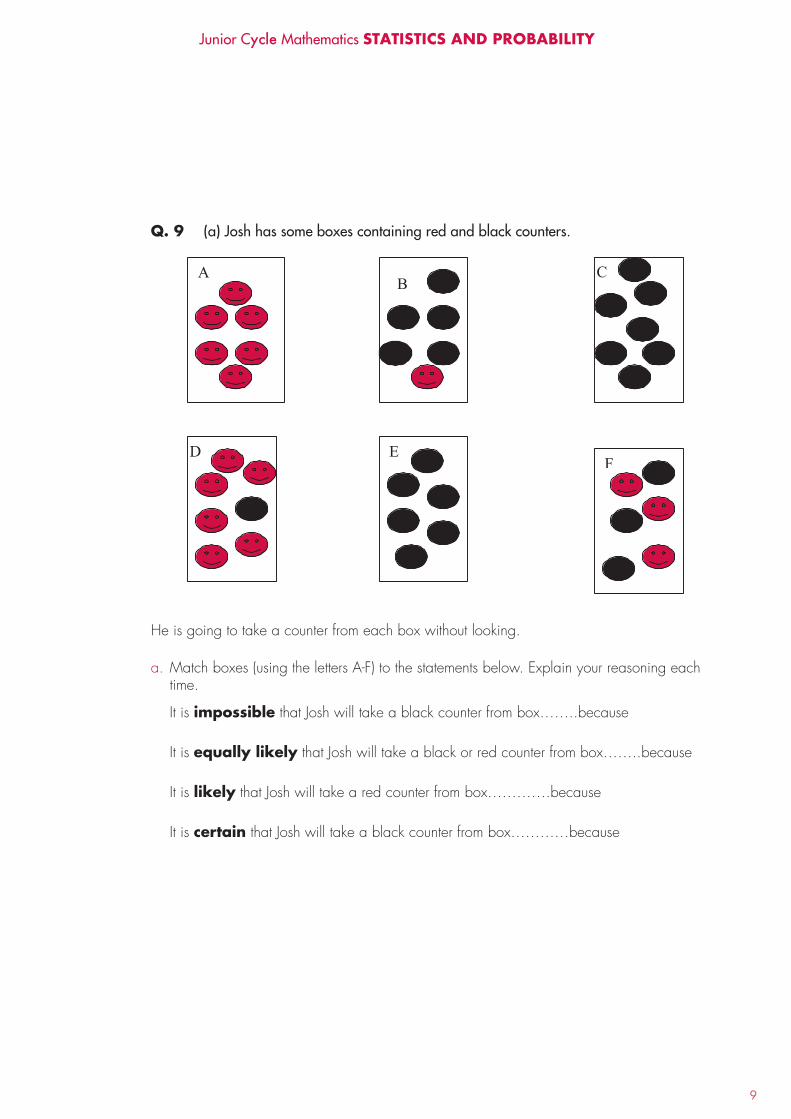
9
Junior Cycle Mathematics STATISTICS AND PROBABILITY
Q. 9 (a) Josh has some boxes containing red and black counters.
He is going to take a counter from each box without looking.
a. Match boxes (using the letters A-F) to the statements below. Explain your reasoning eachtime.
It is impossible that Josh will take a black counter from box……..because
It is equally likely that Josh will take a black or red counter from box……..because
It is likely that Josh will take a red counter from box………….because
It is certain that Josh will take a black counter from box…………because
A C B
D E F

10
Mathematics Resources for Students
Josh selects box C which has 7 black counters in it
He wants to make it more likely that he will take a red counter than a black counter out of the box.
How many red counters must he put into the box? Explain your answer.
b. In another box, there are 30 counters which are either red or black in colour.It is equally likely that Josh will take a red counter or a black counter from the box.How many red counters and how many black counters are there in the box?
c. Extension questionThere are 40 counters in a box which are either red or black in colour.There is a 75% chance that Josh will take a red counter from the box.How many black counters are in the box? Explain your answer.
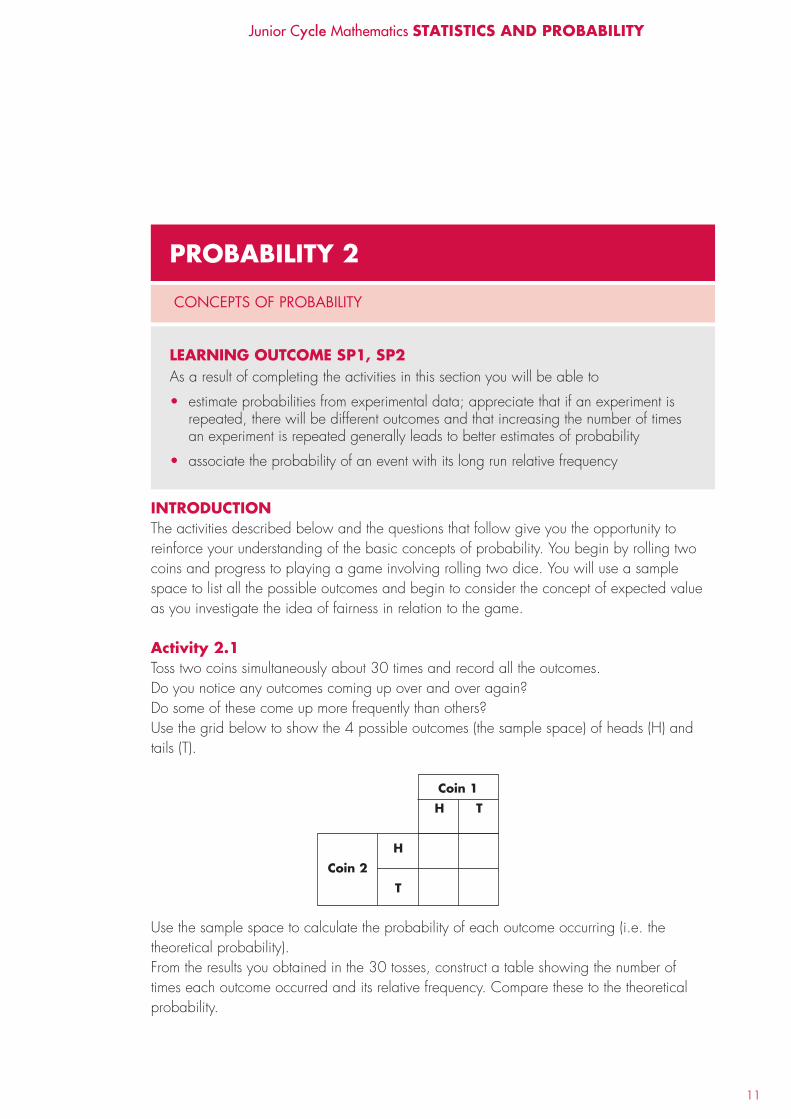
11
Junior Cycle Mathematics STATISTICS AND PROBABILITY
InTROduCTIOnThe activities described below and the questions that follow give you the opportunity to reinforce your understanding of the basic concepts of probability. You begin by rolling two coins and progress to playing a game involving rolling two dice. You will use a sample space to list all the possible outcomes and begin to consider the concept of expected value as you investigate the idea of fairness in relation to the game.
Activity 2.1Toss two coins simultaneously about 30 times and record all the outcomes.Do you notice any outcomes coming up over and over again? Do some of these come up more frequently than others?Use the grid below to show the 4 possible outcomes (the sample space) of heads (H) and tails (T).
Coin 1H T
HCoin 2
T
Use the sample space to calculate the probability of each outcome occurring (i.e. the theoretical probability).From the results you obtained in the 30 tosses, construct a table showing the number of times each outcome occurred and its relative frequency. Compare these to the theoretical probability.
PRObAbIlITy 2
ConCeptS of pRobability
lEARnIng OuTCOME SP1, SP2As a result of completing the activities in this section you will be able to
• estimate probabilities from experimental data; appreciate that if an experiment isrepeated, there will be different outcomes and that increasing the number of timesan experiment is repeated generally leads to better estimates of probability
• associate the probability of an event with its long run relative frequency
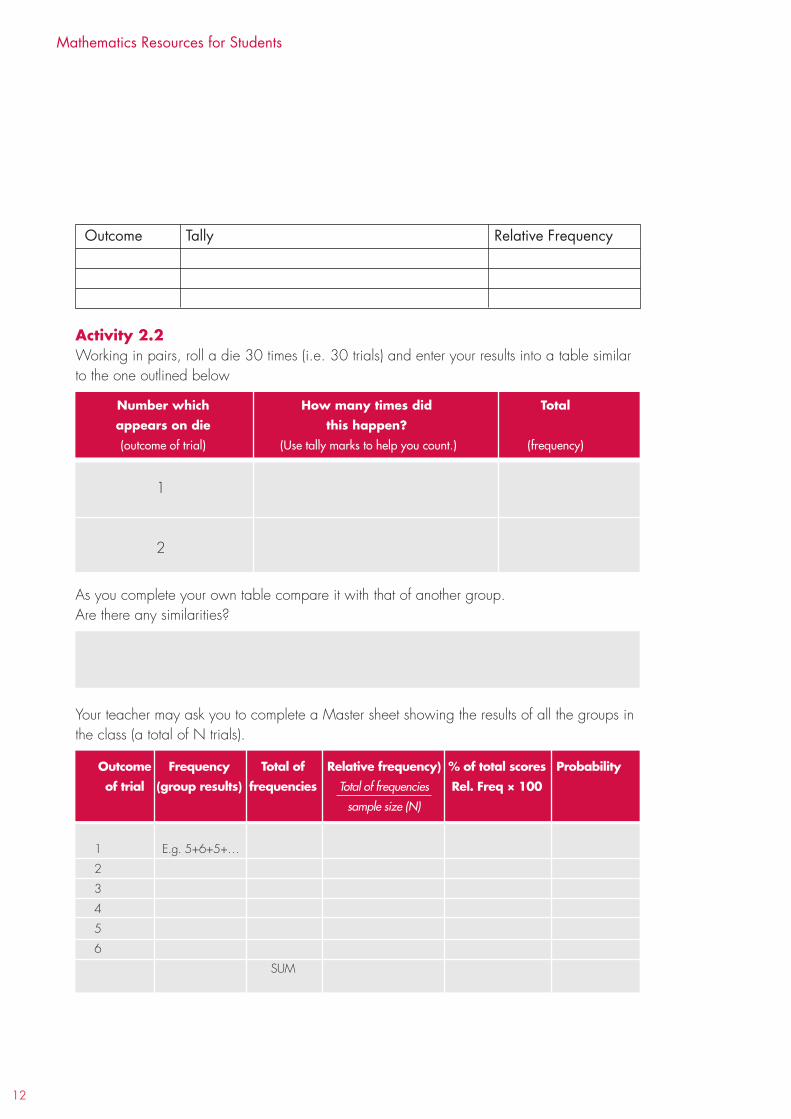
12
Mathematics Resources for Students
outcome tally Relative frequency
Activity 2.2Working in pairs, roll a die 30 times (i.e. 30 trials) and enter your results into a table similar to the one outlined below
As you complete your own table compare it with that of another group. Are there any similarities?
Your teacher may ask you to complete a Master sheet showing the results of all the groups in the class (a total of N trials).
1
2
1 E.g. 5+6+5+…
2
3
4
5
6
SUM
number which How many times did Total appears on die this happen?(outcome of trial) (Use tally marks to help you count.) (frequency)
Outcome Frequency Total of Relative frequency) % of total scores Probabilityof trial (group results) frequencies Total of frequencies Rel. Freq × 100
sample size (N)
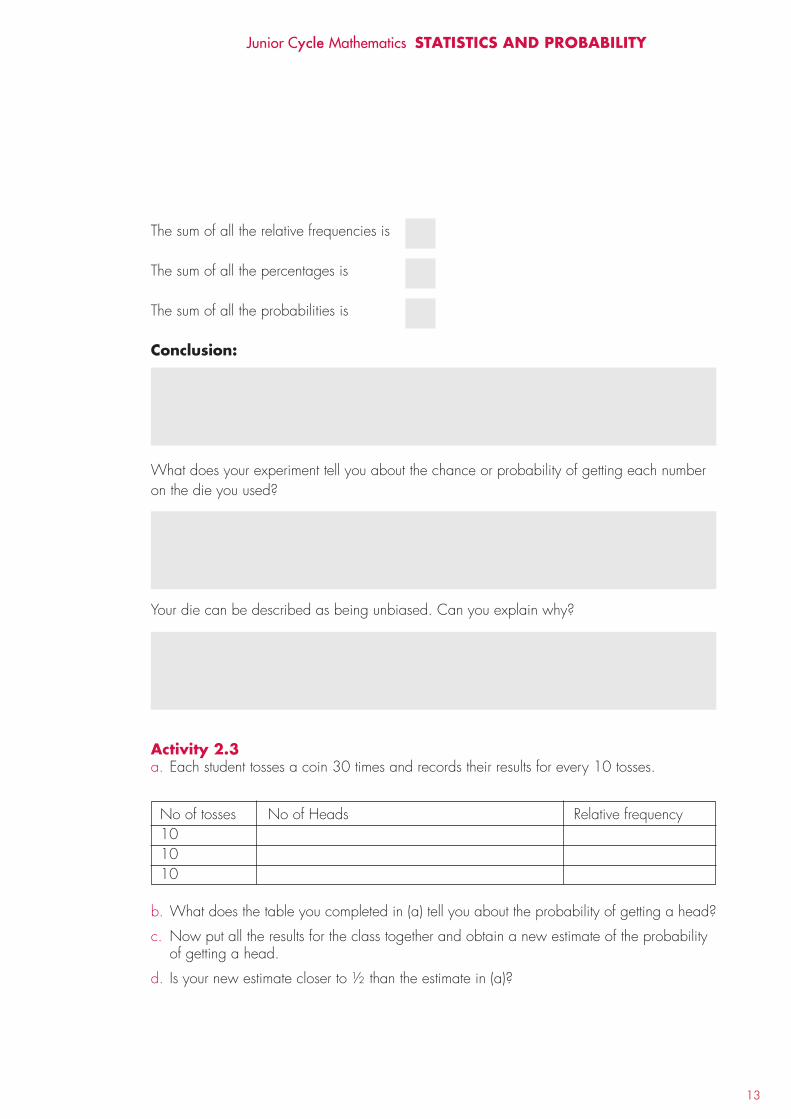
13
Junior Cycle Mathematics STATISTICS AND PROBABILITY
The sum of all the relative frequencies is
The sum of all the percentages is
The sum of all the probabilities is
Conclusion:
What does your experiment tell you about the chance or probability of getting each number on the die you used?
Your die can be described as being unbiased. Can you explain why?
Activity 2.3a. Each student tosses a coin 30 times and records their results for every 10 tosses.
No of tosses No of Heads Relative frequency10 10 10
b. What does the table you completed in (a) tell you about the probability of getting a head?
c. Now put all the results for the class together and obtain a new estimate of the probabilityof getting a head.
d. Is your new estimate closer to ½ than the estimate in (a)?

14
Mathematics Resources for Students
Activity 2.4This is a game for two players, A and B. They take turns to roll two dice and add the two numbers shown on each toss. The winner is determined as follows:A wins if the sum of the numbers on the dice (i.e. outcome) is 2, 3, 4, 10, 11 or 12.B wins if the sum of the numbers on the dice is 5, 6, 7, 8, 9.
Before you begin predict which player is most likely to win.
I think player will win because
Play the game until one player reaches the bottom of the game sheet.
gAME SHEET
A A A A A A wins wins wins b wins b wins b wins b wins b wins wins wins wins
1 2 3 4 5 6 7 8 9 10 11 12
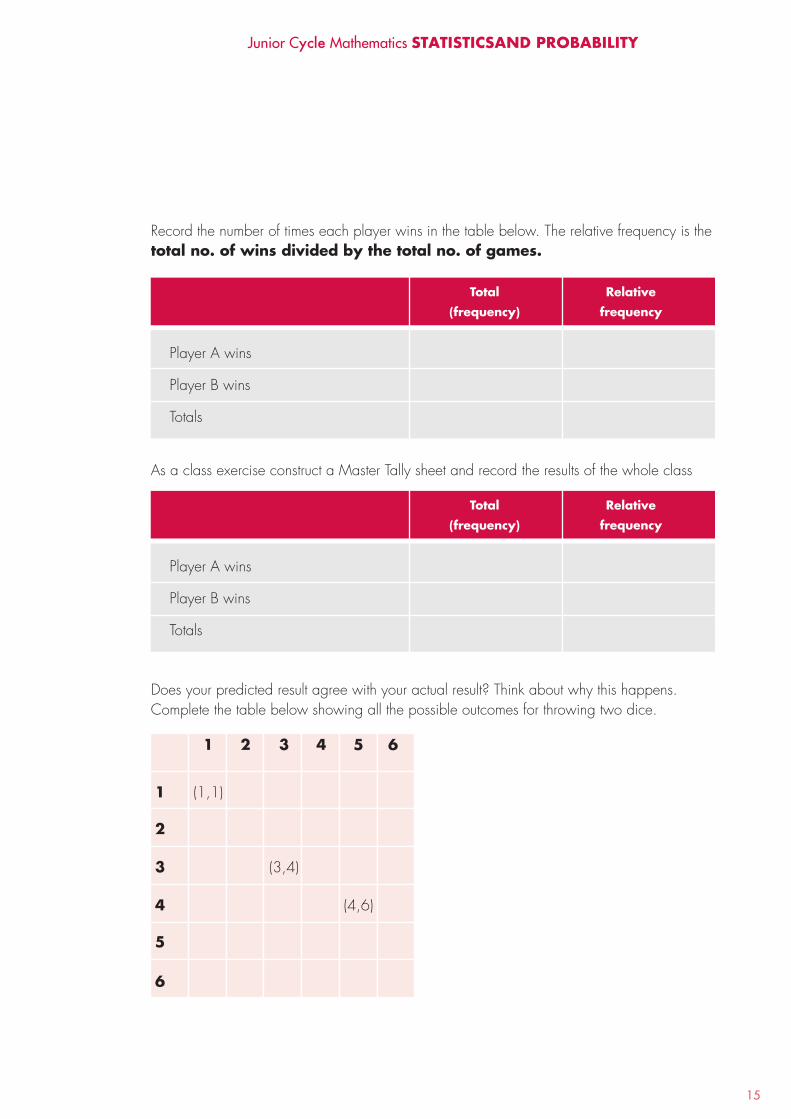
15
Junior Cycle Mathematics STATISTICSAND PROBABILITY
Record the number of times each player wins in the table below. The relative frequency is the total no. of wins divided by the total no. of games.
As a class exercise construct a Master Tally sheet and record the results of the whole class
Does your predicted result agree with your actual result? Think about why this happens. Complete the table below showing all the possible outcomes for throwing two dice.
Player A wins
Player B wins
Totals
Player A wins
Player B wins
Totals
Total Relative(frequency) frequency
Total Relative(frequency) frequency
1 2 3 4 5 6
1 (1,1)
2
3 (3,4)
4 (4,6)
5
6
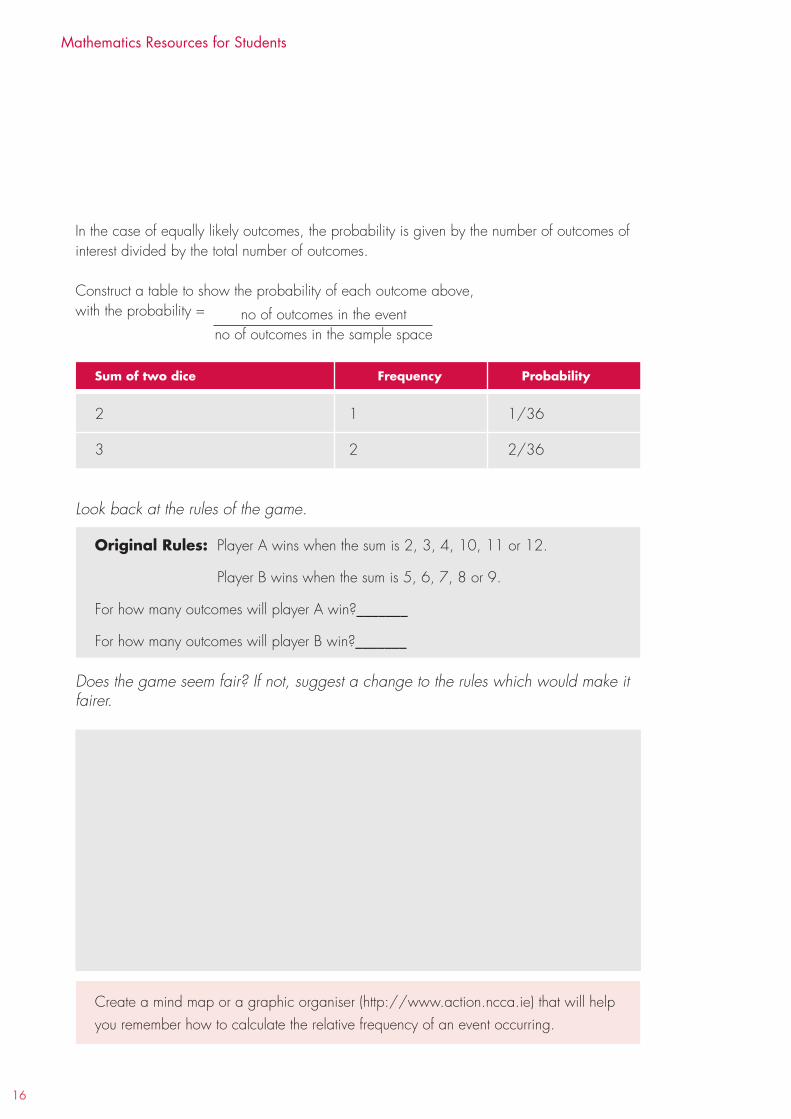
16
Mathematics Resources for Students
In the case of equally likely outcomes, the probability is given by the number of outcomes of interest divided by the total number of outcomes.
Construct a table to show the probability of each outcome above, with the probability =
Look back at the rules of the game.
Does the game seem fair? If not, suggest a change to the rules which would make it fairer.
2 1 1/36
3 2 2/36
Original Rules: Player A wins when the sum is 2, 3, 4, 10, 11 or 12.
Player B wins when the sum is 5, 6, 7, 8 or 9.
For how many outcomes will player A win?_______
For how many outcomes will player B win?_______
Create a mind map or a graphic organiser (http://www.action.ncca.ie) that will help you remember how to calculate the relative frequency of an event occurring.
Sum of two dice Frequency Probability
no of outcomes in the eventno of outcomes in the sample space
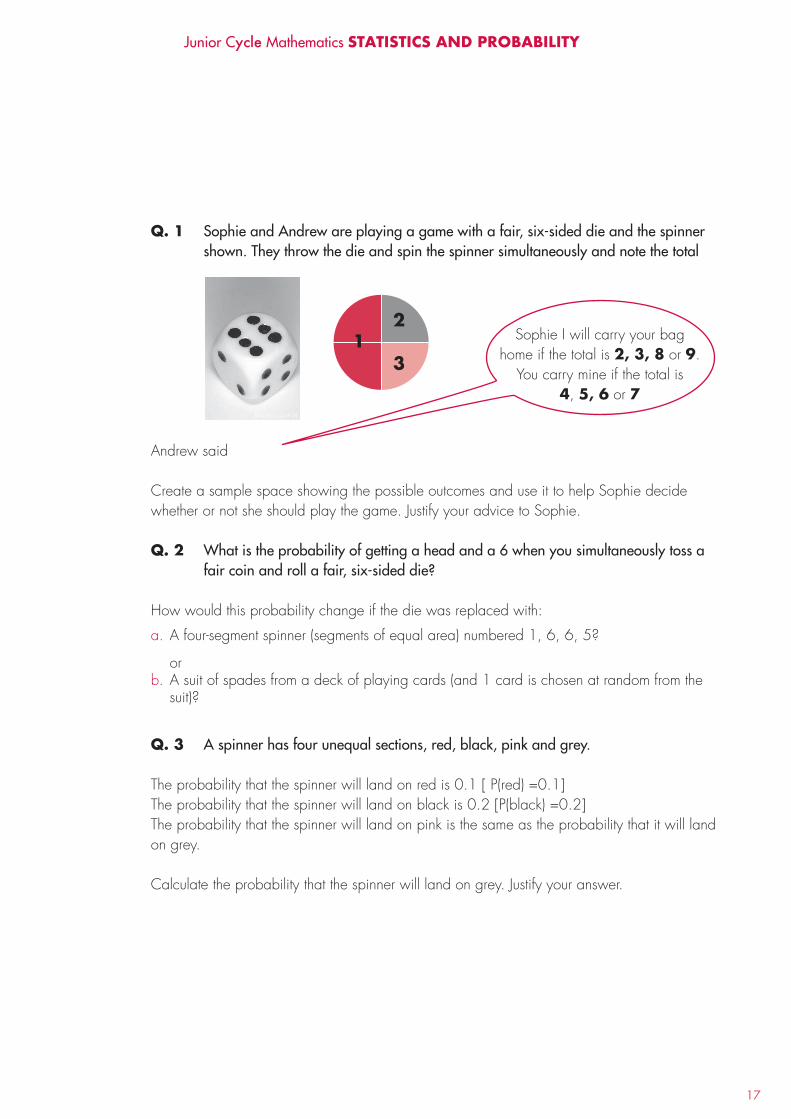
17
Junior Cycle Mathematics STATISTICS AND PROBABILITY
Q. 1 Sophie and Andrew are playing a game with a fair, six-sided die and the spinnershown. They throw the die and spin the spinner simultaneously and note the total
Andrew said
Create a sample space showing the possible outcomes and use it to help Sophie decide whether or not she should play the game. Justify your advice to Sophie.
Q. 2 What is the probability of getting a head and a 6 when you simultaneously toss afair coin and roll a fair, six-sided die?
How would this probability change if the die was replaced with:
a. A four-segment spinner (segments of equal area) numbered 1, 6, 6, 5?
orb. A suit of spades from a deck of playing cards (and 1 card is chosen at random from the
suit)?
Q. 3 A spinner has four unequal sections, red, black, pink and grey.
The probability that the spinner will land on red is 0.1 [ P(red) =0.1]The probability that the spinner will land on black is 0.2 [P(black) =0.2]The probability that the spinner will land on pink is the same as the probability that it will land on grey.
Calculate the probability that the spinner will land on grey. Justify your answer.
2
31 Sophie I will carry your bag
home if the total is 2, 3, 8 or 9. You carry mine if the total is
4, 5, 6 or 7
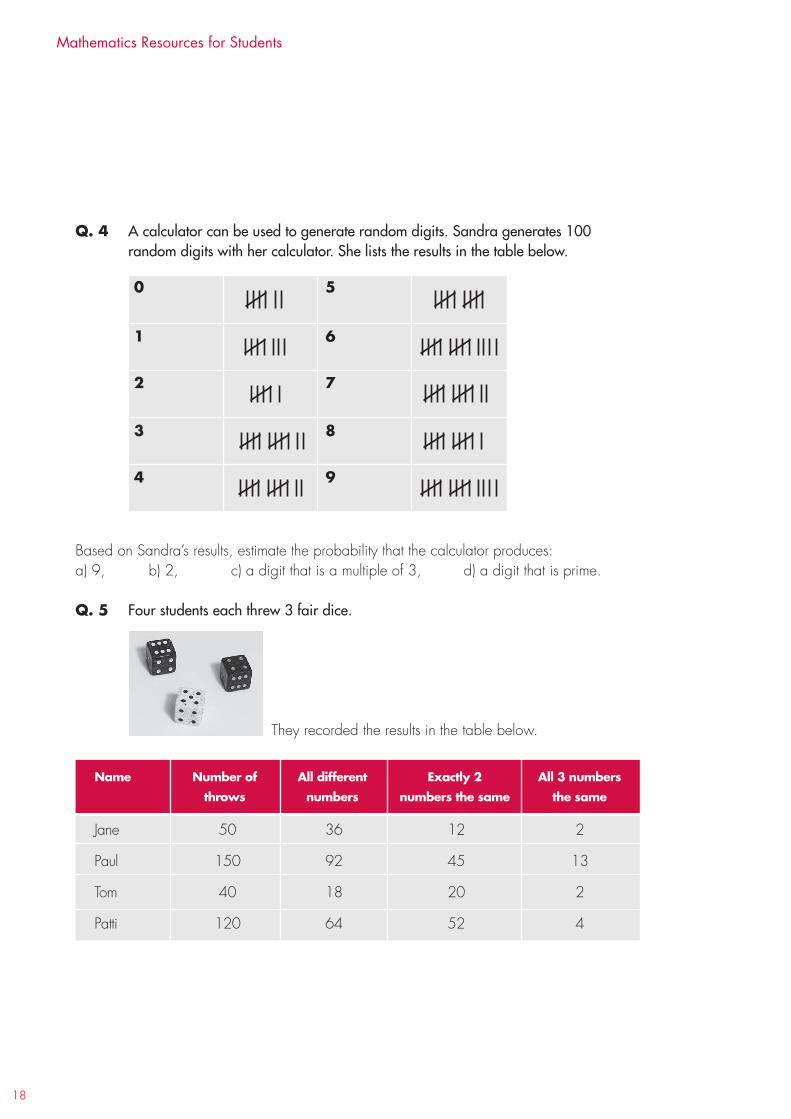
18
Mathematics Resources for Students
Q. 4 A calculator can be used to generate random digits. Sandra generates 100random digits with her calculator. She lists the results in the table below.
Based on Sandra’s results, estimate the probability that the calculator produces:a) 9, b) 2, c) a digit that is a multiple of 3, d) a digit that is prime.
Q. 5 Four students each threw 3 fair dice.
They recorded the results in the table below.
0 5
1 6
2 7
3 8
4 9
Jane 50 36 12 2
Paul 150 92 45 13
Tom 40 18 20 2
Patti 120 64 52 4
name number of All different Exactly 2 All 3 numbers throws numbers numbers the same the same

19
Junior Cycle Mathematics STATISTICS AND PROBABILITY
a. Which student’s data are most likely to give the best estimate of the probability ofgetting
Explain your answer.
b. This table shows the students’ results collected together:
Use these data to estimate the probability of throwing numbers that are all different.
c. The theoretical probability of each result is shown below:
Use these probabilities to calculate, for 360 throws, how many times you would theoretically expect to get each result. Complete the table below.
d. Give a reason why the students’ results are not the same as the theoretical results.
Think: How would this question be different if coins, spinners or playing cards were used?
All numbers the same Exactly 2 numbers the same
All 3 numbers the same
360 210 129 21
360
Probability 5/9 5/12 1/36
number of All different Exactly 2 All 3 numbers throws numbers the same the same
number of All different 2 the same All the samethrows
All different 2 the same All the same
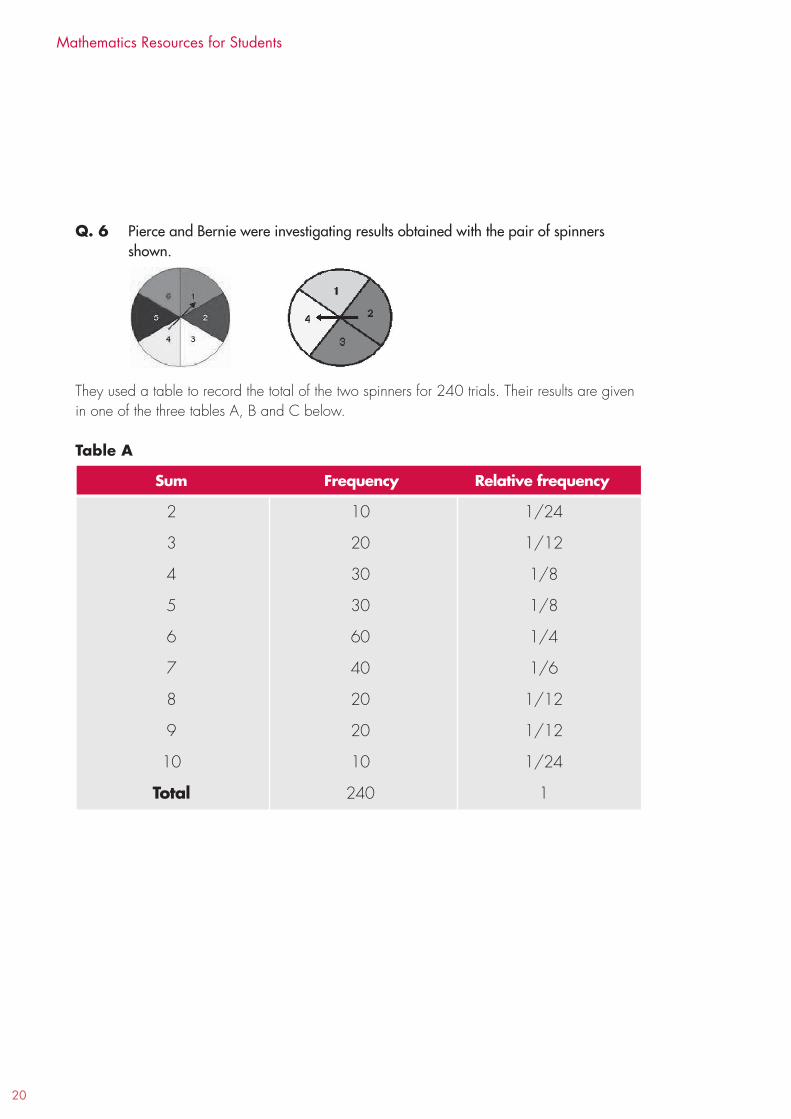
20
Mathematics Resources for Students
Q. 6 Pierce and Bernie were investigating results obtained with the pair of spinnersshown.
They used a table to record the total of the two spinners for 240 trials. Their results are given in one of the three tables A, B and C below.
Table A
2 10 1/24
3 20 1/12
4 30 1/8
5 30 1/8
6 60 1/4
7 40 1/6
8 20 1/12
9 20 1/12
10 10 1/24
Total 240 1
Sum Frequency Relative frequency
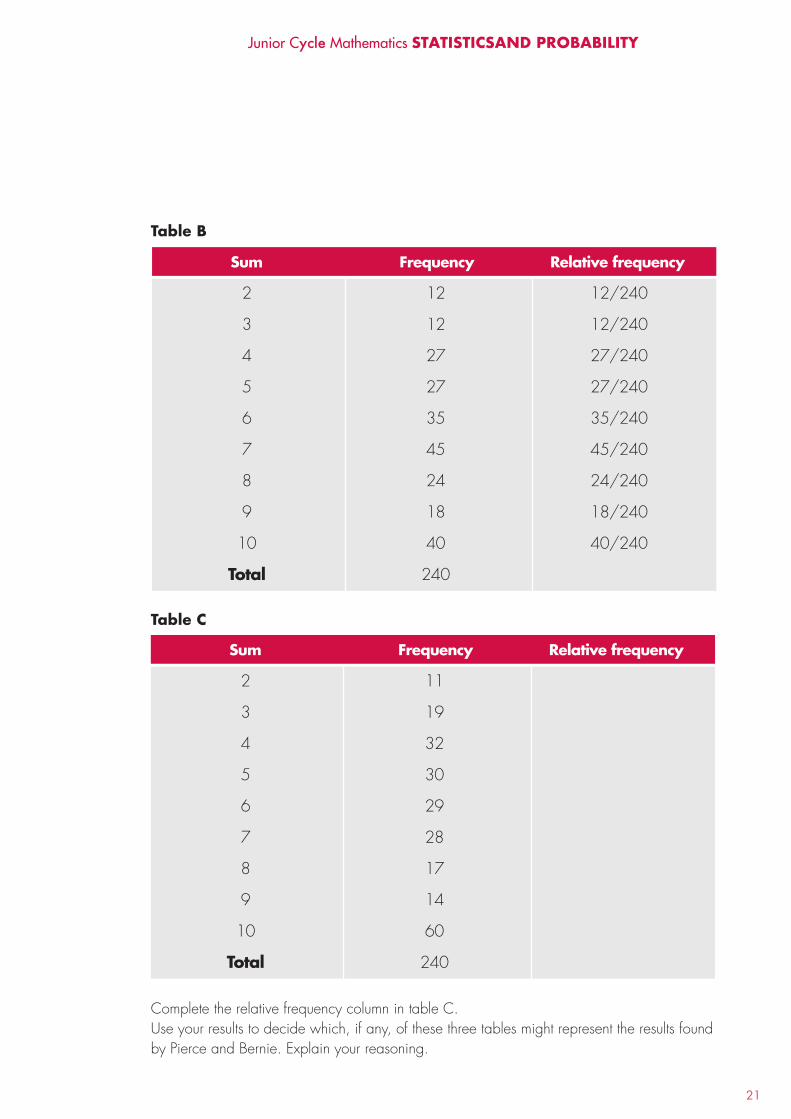
21
Junior Cycle Mathematics STATISTICSAND PROBABILITY
Table b
Table C
Complete the relative frequency column in table C.Use your results to decide which, if any, of these three tables might represent the results found by Pierce and Bernie. Explain your reasoning.
2 12 12/240
3 12 12/240
4 27 27/240
5 27 27/240
6 35 35/240
7 45 45/240
8 24 24/240
9 18 18/240
10 40 40/240
Total 240
Sum Frequency Relative frequency
2 11
3 19
4 32
5 30
6 29
7 28
8 17
9 14
10 60
Total 240
Sum Frequency Relative frequency
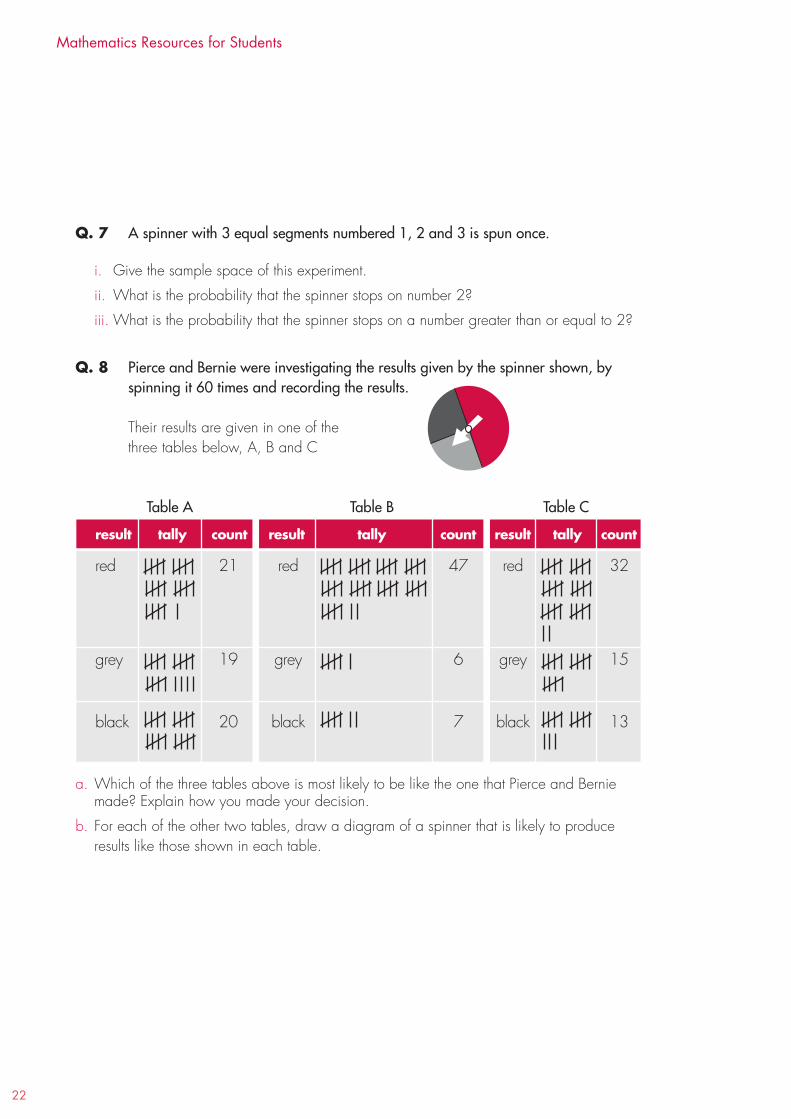
22
Mathematics Resources for Students
Q. 7 A spinner with 3 equal segments numbered 1, 2 and 3 is spun once.
i. Give the sample space of this experiment.
ii. What is the probability that the spinner stops on number 2?
iii. What is the probability that the spinner stops on a number greater than or equal to 2?
Q. 8 Pierce and Bernie were investigating the results given by the spinner shown, byspinning it 60 times and recording the results.
Their results are given in one of the three tables below, A, B and C
Table A Table B Table C
a. Which of the three tables above is most likely to be like the one that Pierce and Berniemade? Explain how you made your decision.
b. For each of the other two tables, draw a diagram of a spinner that is likely to produceresults like those shown in each table.
red 21 red 47 red 32
grey 19 grey 6 grey 15
black 20 black 7 black 13
result tally count result tally count result tally count
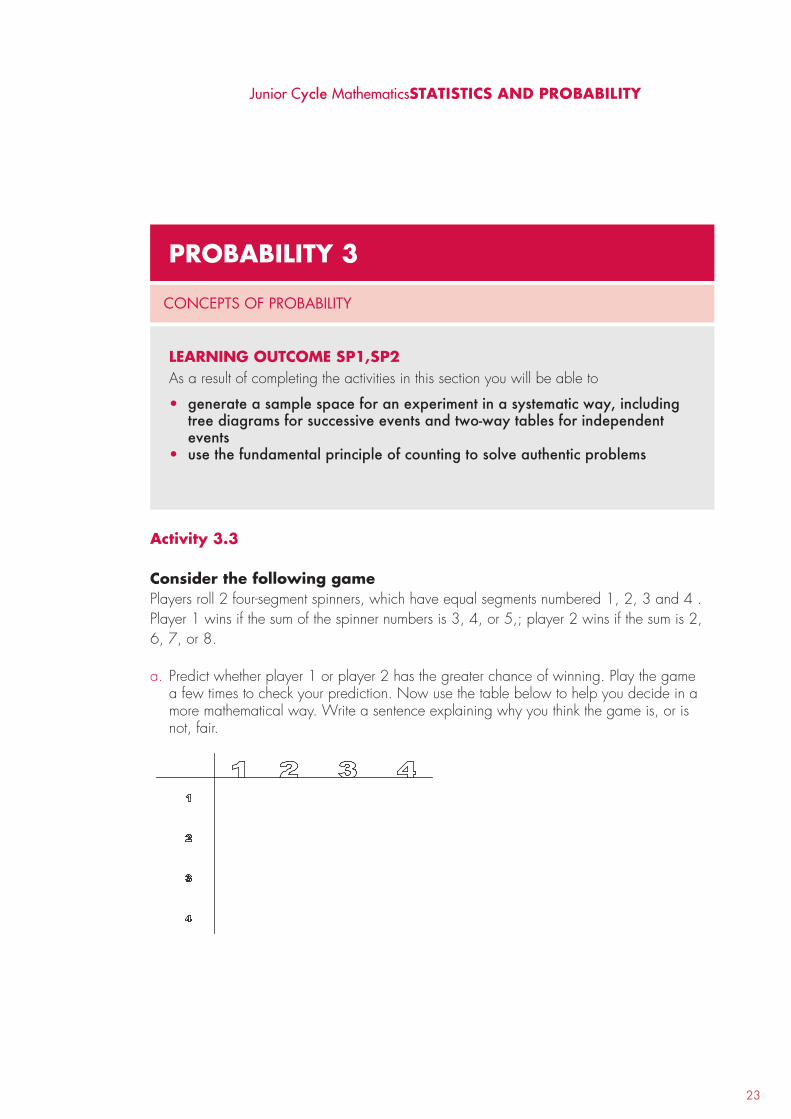
23
Junior Cycle MathematicsSTATISTICS AND PROBABILITY
Activity 3.3
Consider the following gamePlayers roll 2 four-segment spinners, which have equal segments numbered 1, 2, 3 and 4 . Player 1 wins if the sum of the spinner numbers is 3, 4, or 5,; player 2 wins if the sum is 2, 6, 7, or 8.
a. Predict whether player 1 or player 2 has the greater chance of winning. Play the gamea few times to check your prediction. Now use the table below to help you decide in amore mathematical way. Write a sentence explaining why you think the game is, or isnot, fair.
PRObAbIlITy 3
ConCeptS of pRobability
lEARnIng OuTCOME SP1,SP2As a result of completing the activities in this section you will be able to
• generate a sample space for an experiment in a systematic way, includingtree diagrams for successive events and two-way tables for independentevents
• use the fundamental principle of counting to solve authentic problems
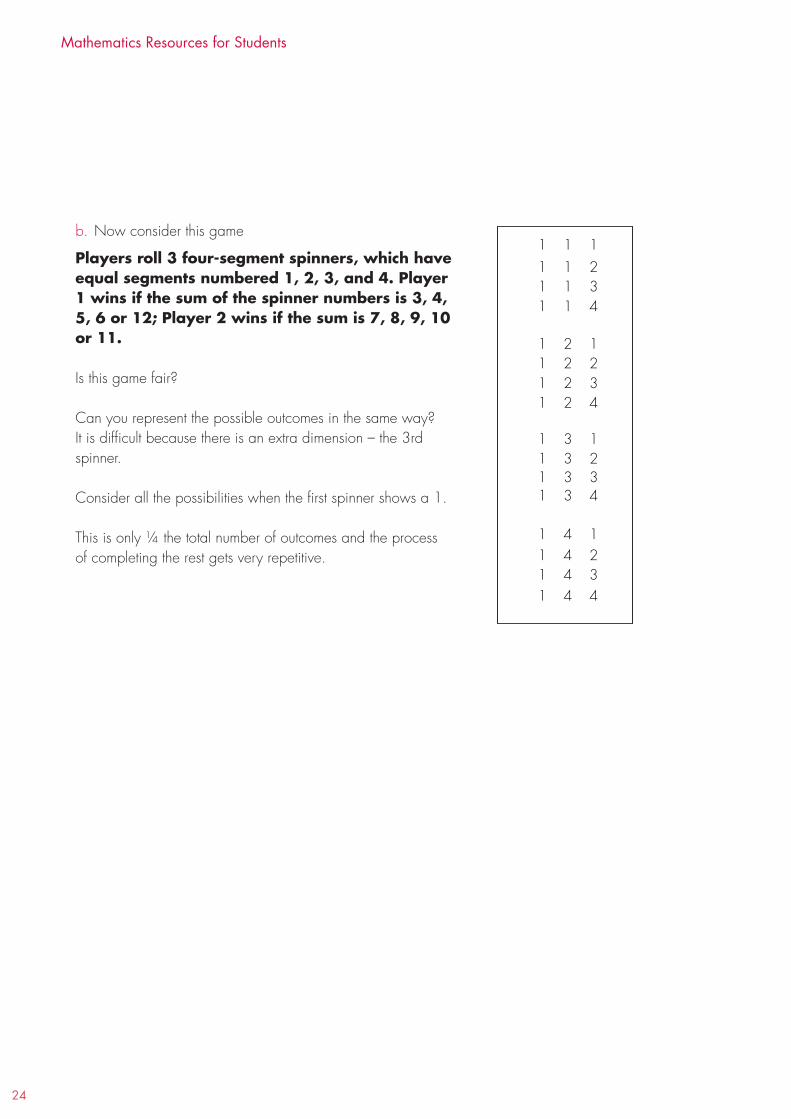
24
Mathematics Resources for Students
b. Now consider this game
Players roll 3 four-segment spinners, which have equal segments numbered 1, 2, 3, and 4. Player 1 wins if the sum of the spinner numbers is 3, 4, 5, 6 or 12; Player 2 wins if the sum is 7, 8, 9, 10 or 11.
Is this game fair?
Can you represent the possible outcomes in the same way?It is difficult because there is an extra dimension – the 3rd spinner.
Consider all the possibilities when the first spinner shows a 1.
This is only ¼ the total number of outcomes and the process of completing the rest gets very repetitive.
1 1 1 1 1 2 1 1 3 1 1 4
1 2 1 1 2 2 1 2 3 1 2 4
1 3 1 1 3 2 1 3 3 1 3 4
1 4 1 1 4 2 1 4 3 1 4 4
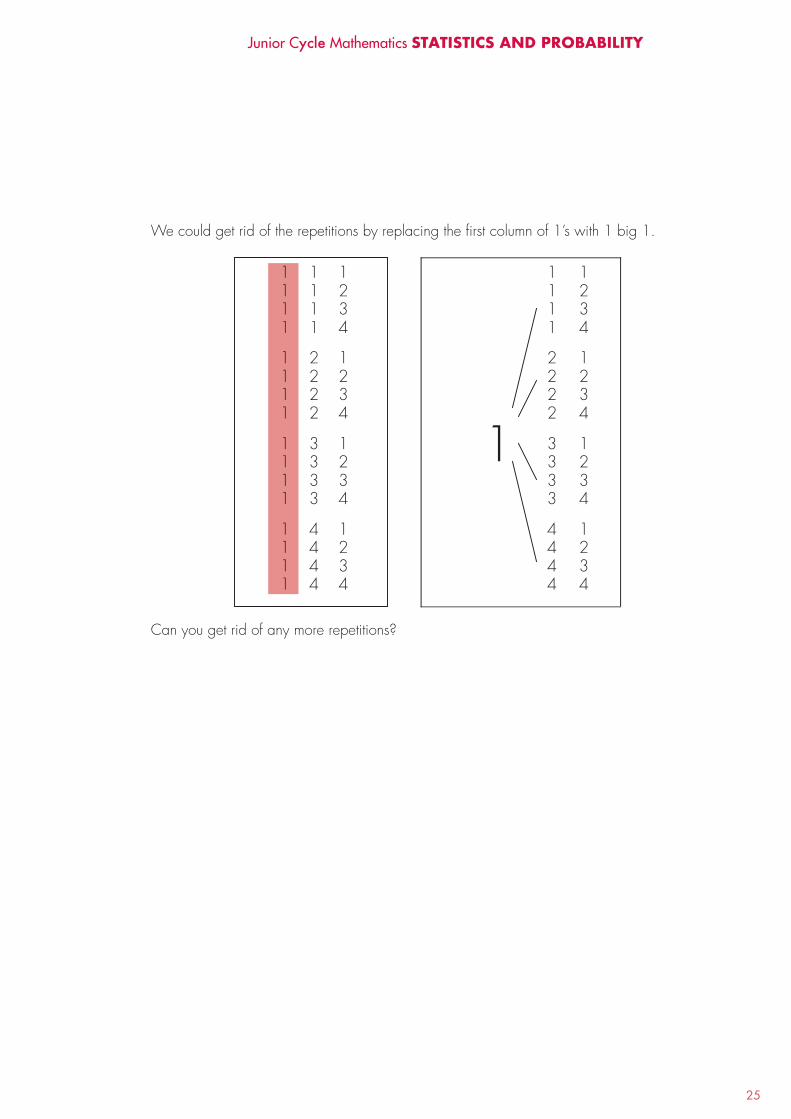
25
Junior Cycle Mathematics STATISTICS AND PROBABILITY
We could get rid of the repetitions by replacing the first column of 1’s with 1 big 1.
Can you get rid of any more repetitions?
1 1 1 1 1 2 1 1 3 1 1 4
1 2 1 1 2 2 1 2 3 1 2 4
1 3 1 1 3 2 1 3 3 1 3 4
1 4 1 1 4 2 1 4 3 1 4 4
1 1 1 2 1 3 1 4
2 1 2 2 2 3 2 4
3 1 3 2 3 3 3 4
4 1 4 2 4 3
1
4 4
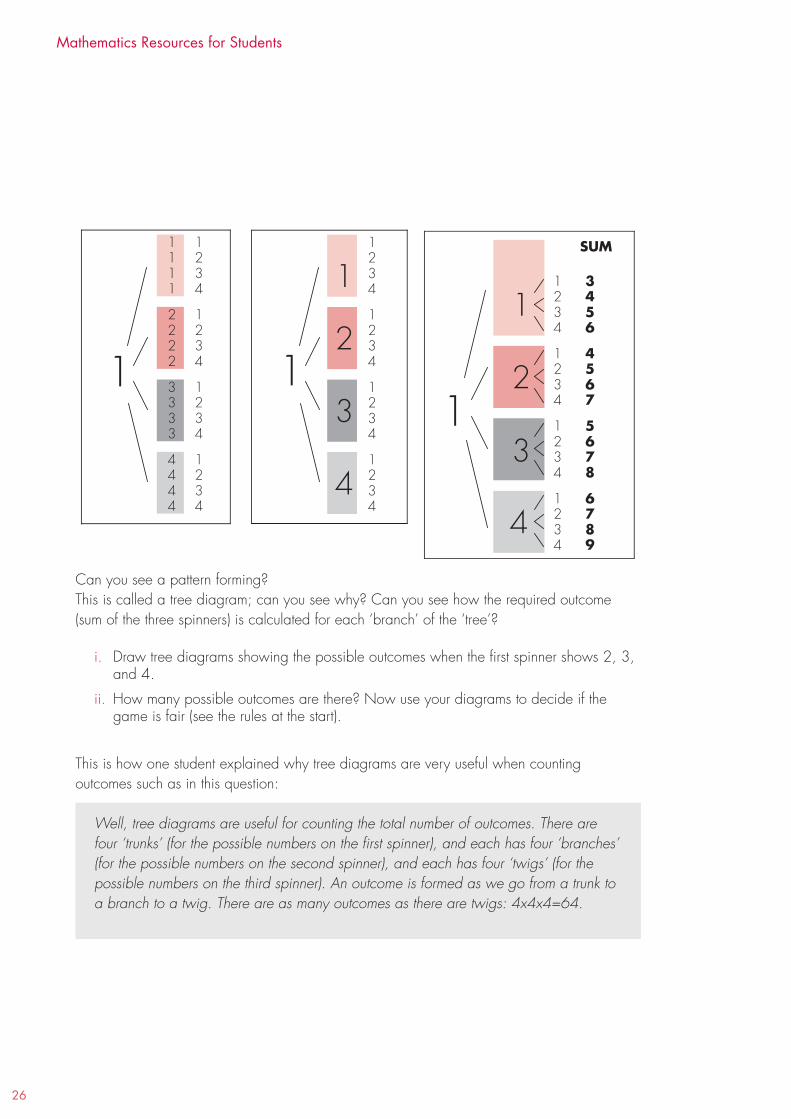
26
Mathematics Resources for Students
Can you see a pattern forming? This is called a tree diagram; can you see why? Can you see how the required outcome (sum of the three spinners) is calculated for each ‘branch’ of the ‘tree’?
i. Draw tree diagrams showing the possible outcomes when the first spinner shows 2, 3,and 4.
ii. How many possible outcomes are there? Now use your diagrams to decide if thegame is fair (see the rules at the start).
This is how one student explained why tree diagrams are very useful when counting outcomes such as in this question:
Well, tree diagrams are useful for counting the total number of outcomes. There are four ‘trunks’ (for the possible numbers on the first spinner), and each has four ‘branches’ (for the possible numbers on the second spinner), and each has four ‘twigs’ (for the possible numbers on the third spinner). An outcome is formed as we go from a trunk to a branch to a twig. There are as many outcomes as there are twigs: 4x4x4=64.
1 1 1 2 1 3 1 4
2 1 2 2 2 3 2 4
3 1 3 2 3 3 3 4
4 1 4 2 4 3
1
4 4
1 2 3 1 4
1 2 3 24
1 2 3 34
1 2 3
1
4 4
SUM
1 3 2 4 3 5 14 6
1 4 2 5 3 6 24 7
1 5 2 6 3 7 34 8
1 6 2 7 3 8
1
4 4 9
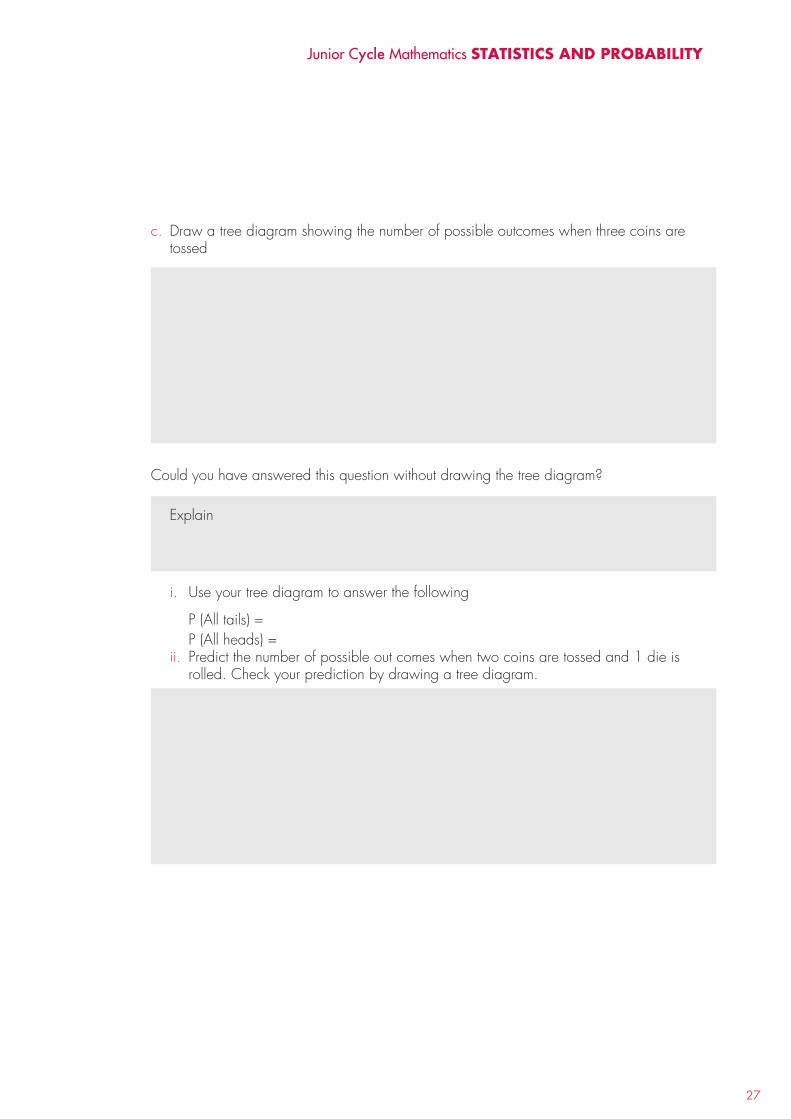
27
c. Draw a tree diagram showing the number of possible outcomes when three coins aretossed
Could you have answered this question without drawing the tree diagram?
Explain
i. Use your tree diagram to answer the following
P (All tails) =P (All heads) =
ii. Predict the number of possible out comes when two coins are tossed and 1 die isrolled. Check your prediction by drawing a tree diagram.
Junior Cycle Mathematics STATISTICS AND PROBABILITY

28
Mathematics Resources for Students
Q. 1 There are a dozen eggs in a box and 3 of them are ‘bad’. 3 eggs are chosen atrandom from the box.
a. Complete the probability tree diagram below, showing good (G) and bad (B) eggs.
b. Work out the probability that
i. all three eggs are ‘good’
ii. 1 egg is ‘bad’
iii. 2 eggs are ‘bad’
iv. all three eggs are ‘bad’
Q. 2 Jessica is taking part in a quiz. She is unsure of the answer to a question andneeds to ask her team-mates, Amy and Brian. The probability that Amy will get it right is 0.7.The probability that Brian will get it right is 0.4.
a. Complete the probability tree diagram below.
i. What is the probability that at least one of her two friends will give her the correctanswer?
ii. What is the probability that neither of them will give her the correct answer?
F irst Egg 2nd Egg 3rd Egg
Amy Brian
g
b
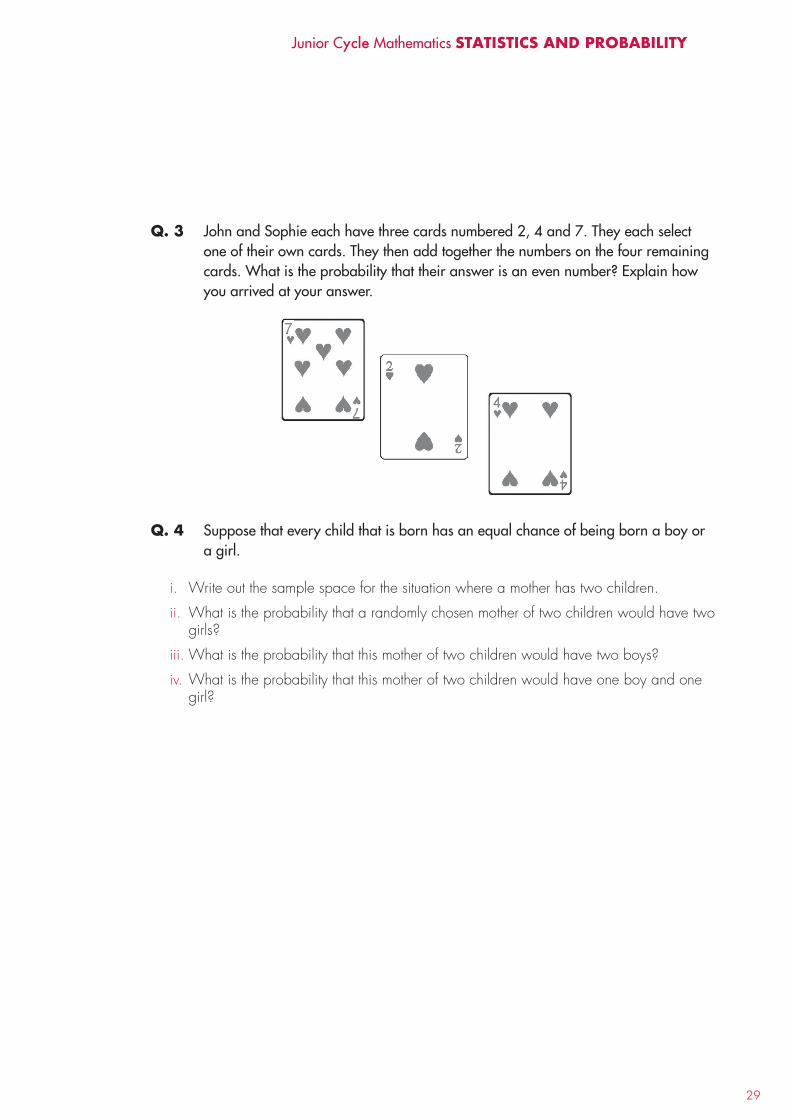
29
Q. 3 John and Sophie each have three cards numbered 2, 4 and 7. They each selectone of their own cards. They then add together the numbers on the four remaining cards. What is the probability that their answer is an even number? Explain how you arrived at your answer.
Q. 4 Suppose that every child that is born has an equal chance of being born a boy ora girl.
i. Write out the sample space for the situation where a mother has two children.
ii. What is the probability that a randomly chosen mother of two children would have twogirls?
iii. What is the probability that this mother of two children would have two boys?
iv. What is the probability that this mother of two children would have one boy and onegirl?
Junior Cycle Mathematics STATISTICS AND PROBABILITY

30
Mathematics Resources for Students
InTROduCTIOnBeing able to see a data set as a whole and so being able to use summary statistics such as averages to describe the ‘big picture’ or the overall shape of the data is an important learning intention of strand 1.
The activities described below allow you to investigate how the mean is constructed and the relationship of the mean to the data set it represents. You will also explore the different ways the median and mean represent the data - the median as a middle point in the data, and the mean as a ‘point of balance’ or the ‘fair share’ value of the data. Using two different representations of the mean gives you a chance to view the relationship between the mean and the data set through different models and so construct a firm understanding of the mathematical concept.
STATISTICS 1
RepReSenting data gRaphiCally and nuMeRiCally
lEARnIng OuTCOMES SP3As a result of completing the activities in this section you will be able to
• select, draw and interpret appropriate graphical displays of univariatedata, including pie charts, bar charts, line plots, histograms (equalintervals), ordered stem and leaf plots, and ordered back-to-back stem andleaf plots
• select, calculate and interpret appropriate summary statistics to describeaspects of univariate data. Central tendency: mean (including of agrouped frequency distribution), median, mode. Variability: range
• evaluate the effectiveness of different graphical displays in representingdata
There are links with Number where you will investigate models such as accumulating groups of equal size to make sense of the operation of multiplication.
31
Prior learning
The idea that a set of data can be viewed and described as a unit is one of the key ideas about data that develops across primary school and is built on at second level. Initially, you looked at each individual piece of data. Gradually, you began to move away from a focus on individual pieces of data to looking at larger parts of the data. You learned to make general statements about the group of things or phenomena that the data represent, such as ‘most people in our class have 1 or 2 siblings, and the range is from no siblings to 6 siblings.’ Now you are ready to move away from making general statements and begin to make summary statements that describe the whole data set.
Activity 1.1There are 5 bags of sweets, each of a different brand. All bags are the same size. The average price for a bag is €1.43
a. What could the individual prices of the 5 bags be? Think of at least two different sets ofprices.
b. If both of your sets of prices included €1.43 as a price for at least one of the bags, pricethe five bags without using €1.43 as one of the prices.
c. Did you use €1.43 as the median? If so, what is the mean for your sets of prices? If youdidn’t use €1.43 as the median, what is the median for your sets of prices? Are the meanand median the same or different?
Discuss one of your lists of five prices with your group. How did you decide on your list of prices? How do you know what the average is in each example?Note to each small group: Make sure you consider some lists that do not include a value of €1.43 as one of the prices.
d. There are seven bags of beads. Five of the bags have the following numbers of beads inthem: 5, 7, 8, 9, and 12. Now work through parts (i), (ii) and (iii) with your group.
i. Make a representation of the five bags by using small objects such as cubes, counters,marbles, etc. Make another representation of the five bags on a line plot.
ii. Now use your representation to figure out how many beads could be in the othertwo bags so that 8 is the mean number of beads for all seven bags. Try to figure thisout without adding up the beads in the five bags. Find at least two different sets ofnumbers for the two bags that will solve this problem.
iii. Revise your two representations – counters and line plot – so that they show all 7pieces of data. Can you ‘see’ the average in your representation?
e. What is the least number of beads there could be in one of the additional bags? What isthe greatest number?
Junior Cycle Mathematics STATISTICS AND PROBABILITY
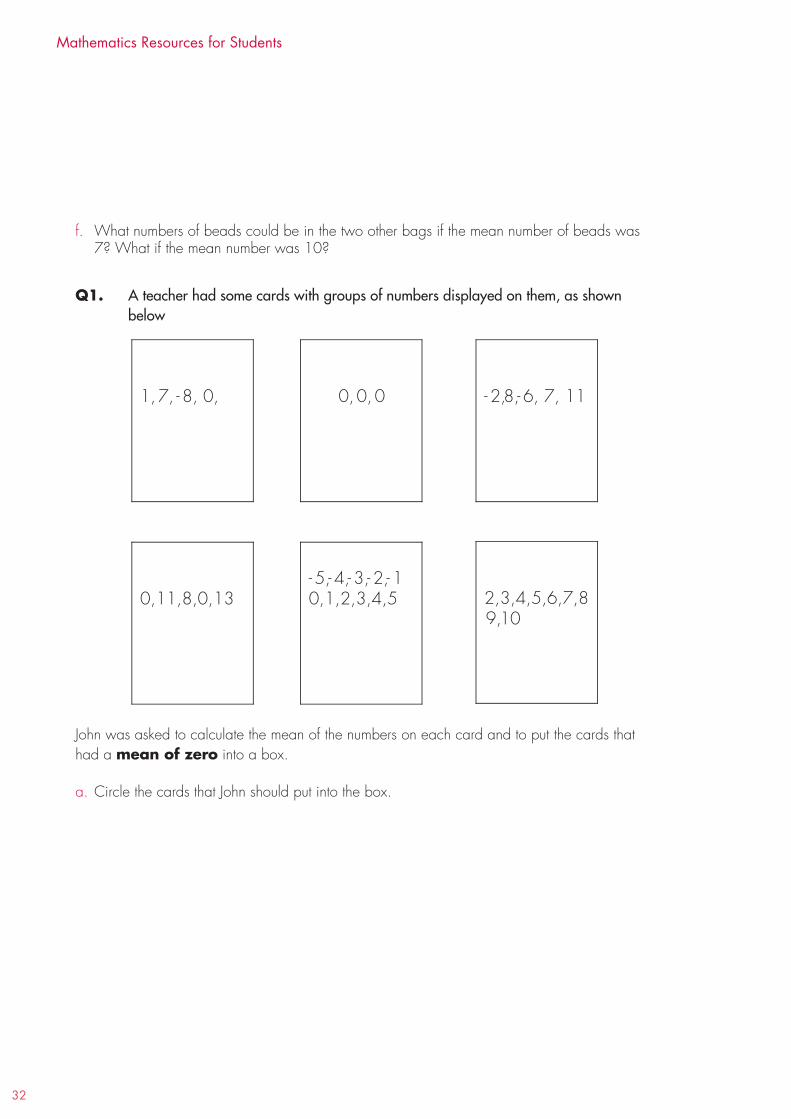
32
Mathematics Resources for Students
f. What numbers of beads could be in the two other bags if the mean number of beads was7? What if the mean number was 10?
Q1. A teacher had some cards with groups of numbers displayed on them, as shown below
John was asked to calculate the mean of the numbers on each card and to put the cards that had a mean of zero into a box.
a. Circle the cards that John should put into the box.
1, 7, - 8, 0,
- 5,- 4,- 3,- 2,- 10,1,2,3,4,5
0, 0, 0 - 2,8,- 6, 7, 11
0,11,8,0,13 2,3,4,5,6,7,89,10
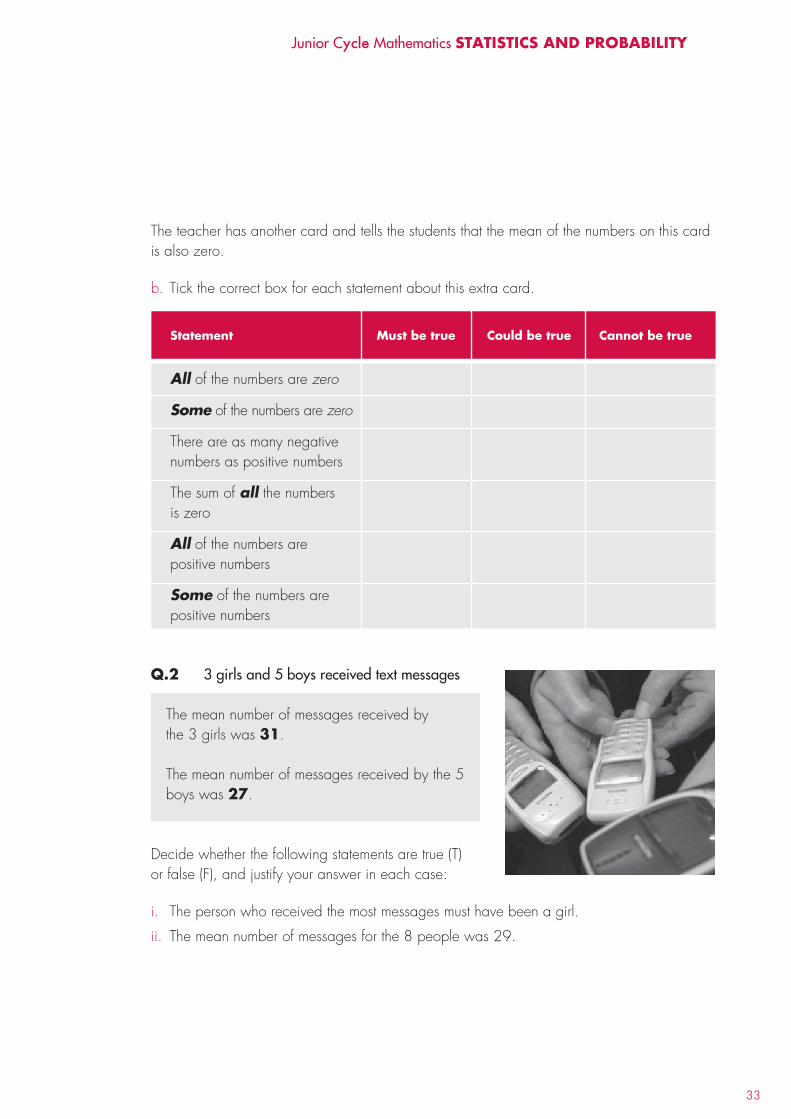
33
The teacher has another card and tells the students that the mean of the numbers on this card is also zero.
b. Tick the correct box for each statement about this extra card.
Q.2 3 girls and 5 boys received text messages
The mean number of messages received bythe 3 girls was 31.
The mean number of messages received by the 5boys was 27.
Decide whether the following statements are true (T) or false (F), and justify your answer in each case:
i. The person who received the most messages must have been a girl.
ii. The mean number of messages for the 8 people was 29.
All of the numbers are zero
Some of the numbers are zero
There are as many negative numbers as positive numbers
The sum of all the numbers is zero
All of the numbers are positive numbers
Some of the numbers are positive numbers
Statement Must be true Could be true Cannot be true
Junior Cycle Mathematics STATISTICS AND PROBABILITY
34
Mathematics Resources for Students
Q.3 Three girls and five boys were studying climate change in various countries aroundthe world. They were examining the maximum daily temperatures in these areas
The mean daily temp of the locations studied by the 3 girls was 31˚ CThe mean daily temp of the locations studied by the 5 boys was 27 ˚ C
Decide whether the following statements are True or False, and justify your answer in each case.
i. The person who encountered the max daily temperature must have been a girl.
ii. The person who encountered the min daily temperature must have been a boy.
iii. The mean max daily temperature encountered by the 8 people was 29˚ C. .
Q.4 Sophie has six cards, each of which has a positive whole number printed on it.Four of the cards each have the number 9 on it.
a. Without knowing the numbers on the other two cards, can you give the value of the
i. median
ii. mode
iii. range
Explain your reasoning.
b. You are told that the six cards have a mean of 9. Give some possible whole numbers thatcould be on the other two cards. Which of your answers would give the greatest range?Why?
If the six cards have a mean of 9 and a range of 6 how many answers can you now find for the numbers on the remaining two cards?
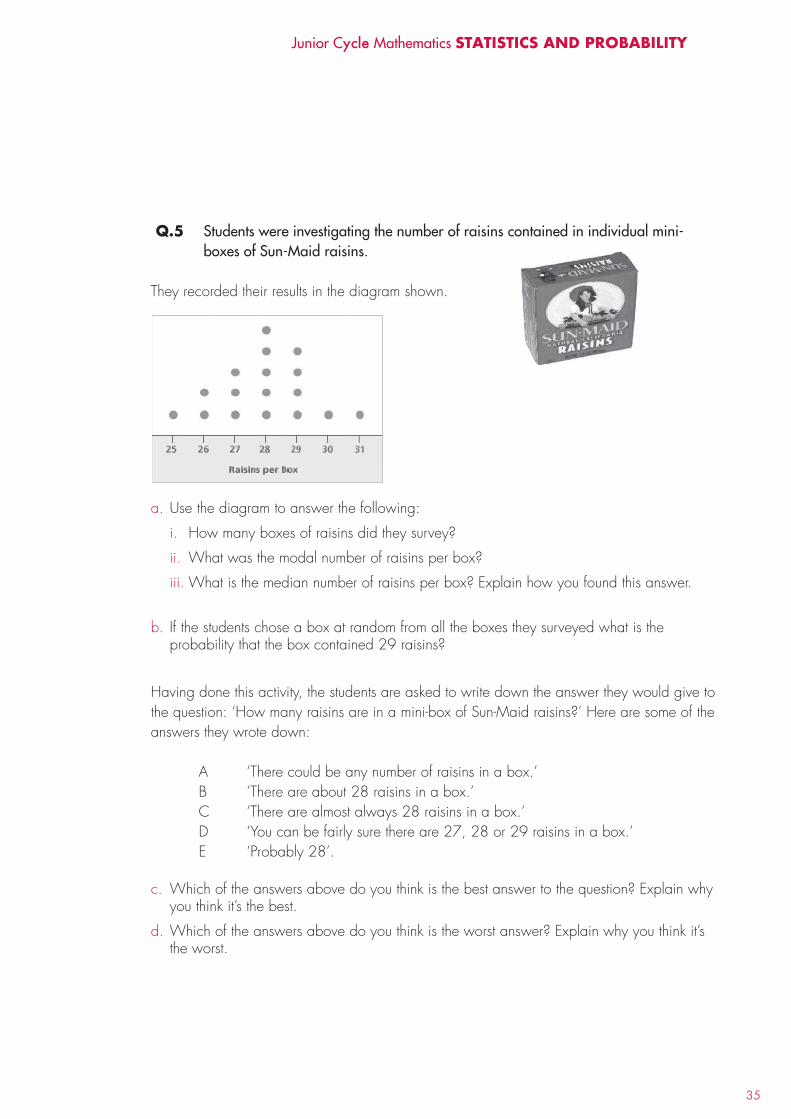
35
Q.5 Students were investigating the number of raisins contained in individual mini-boxes of Sun-Maid raisins.
They recorded their results in the diagram shown.
a. Use the diagram to answer the following:
i. How many boxes of raisins did they survey?
ii. What was the modal number of raisins per box?
iii. What is the median number of raisins per box? Explain how you found this answer.
b. If the students chose a box at random from all the boxes they surveyed what is theprobability that the box contained 29 raisins?
Having done this activity, the students are asked to write down the answer they would give to the question: ‘How many raisins are in a mini-box of Sun-Maid raisins?’ Here are some of the answers they wrote down:
A ‘There could be any number of raisins in a box.’B ‘There are about 28 raisins in a box.’C ‘There are almost always 28 raisins in a box.’D ‘You can be fairly sure there are 27, 28 or 29 raisins in a box.’E ‘Probably 28’.
c. Which of the answers above do you think is the best answer to the question? Explain whyyou think it’s the best.
d. Which of the answers above do you think is the worst answer? Explain why you think it’sthe worst.
Junior Cycle Mathematics STATISTICS AND PROBABILITY
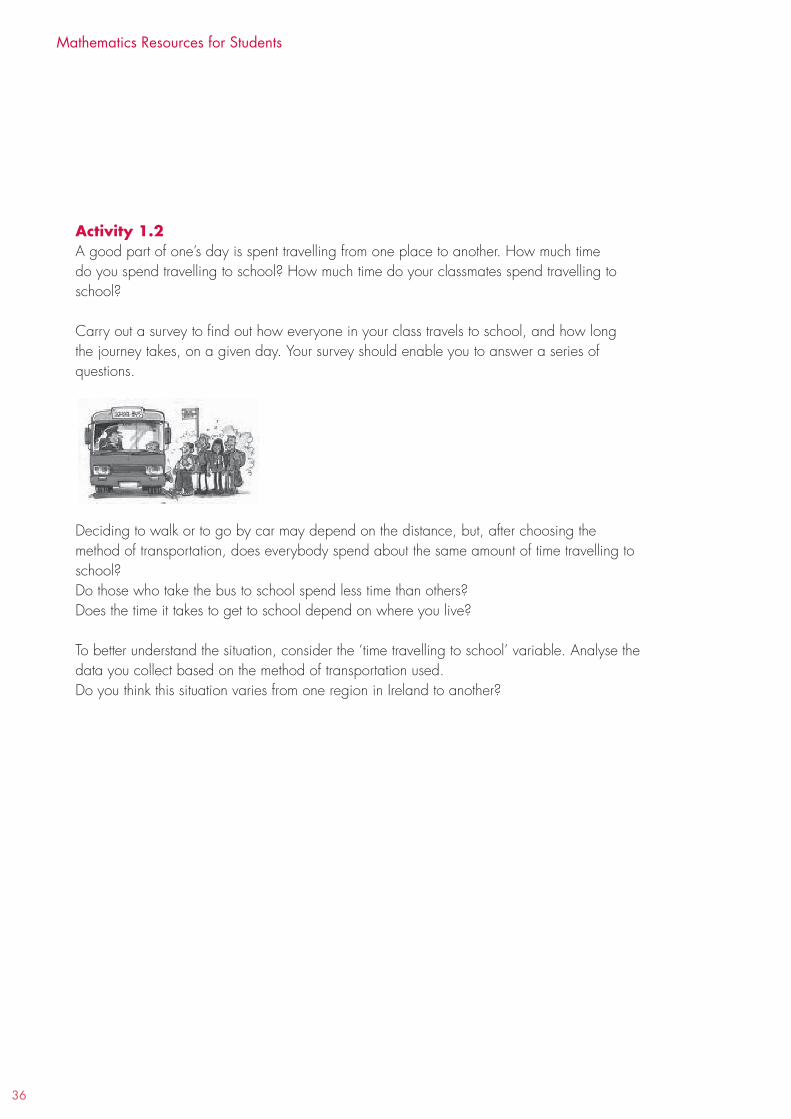
36
Mathematics Resources for Students
Activity 1.2A good part of one’s day is spent travelling from one place to another. How much time do you spend travelling to school? How much time do your classmates spend travelling to school?
Carry out a survey to find out how everyone in your class travels to school, and how long the journey takes, on a given day. Your survey should enable you to answer a series of questions.
Deciding to walk or to go by car may depend on the distance, but, after choosing the method of transportation, does everybody spend about the same amount of time travelling to school? Do those who take the bus to school spend less time than others?Does the time it takes to get to school depend on where you live?
To better understand the situation, consider the ‘time travelling to school’ variable. Analyse the data you collect based on the method of transportation used. Do you think this situation varies from one region in Ireland to another?
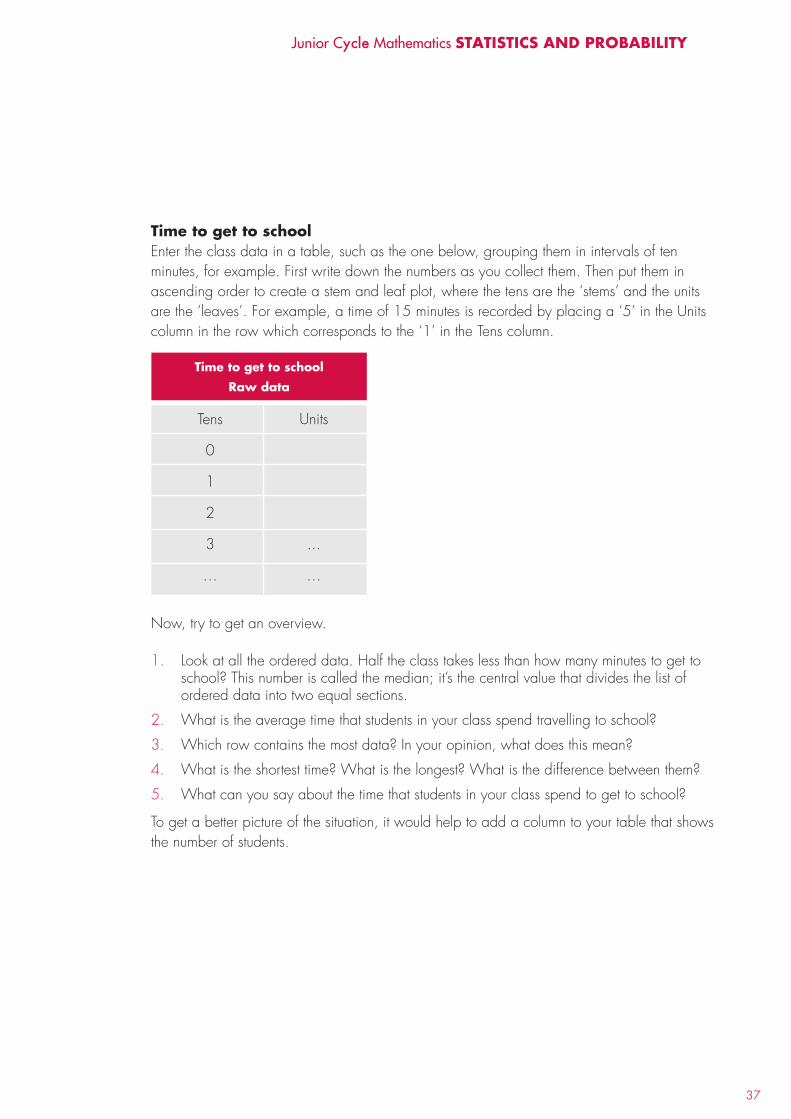
37
Time to get to schoolEnter the class data in a table, such as the one below, grouping them in intervals of ten minutes, for example. First write down the numbers as you collect them. Then put them in ascending order to create a stem and leaf plot, where the tens are the ‘stems’ and the units are the ‘leaves’. For example, a time of 15 minutes is recorded by placing a ‘5’ in the Units column in the row which corresponds to the ‘1’ in the Tens column.
Now, try to get an overview.
1. Look at all the ordered data. Half the class takes less than how many minutes to get toschool? This number is called the median; it’s the central value that divides the list ofordered data into two equal sections.
2. What is the average time that students in your class spend travelling to school?
3. Which row contains the most data? In your opinion, what does this mean?
4. What is the shortest time? What is the longest? What is the difference between them?
5. What can you say about the time that students in your class spend to get to school?
To get a better picture of the situation, it would help to add a column to your table that shows the number of students.
Tens Units
0
1
2
3 ...
… …
Time to get to schoolRaw data
Junior Cycle Mathematics STATISTICS AND PROBABILITY
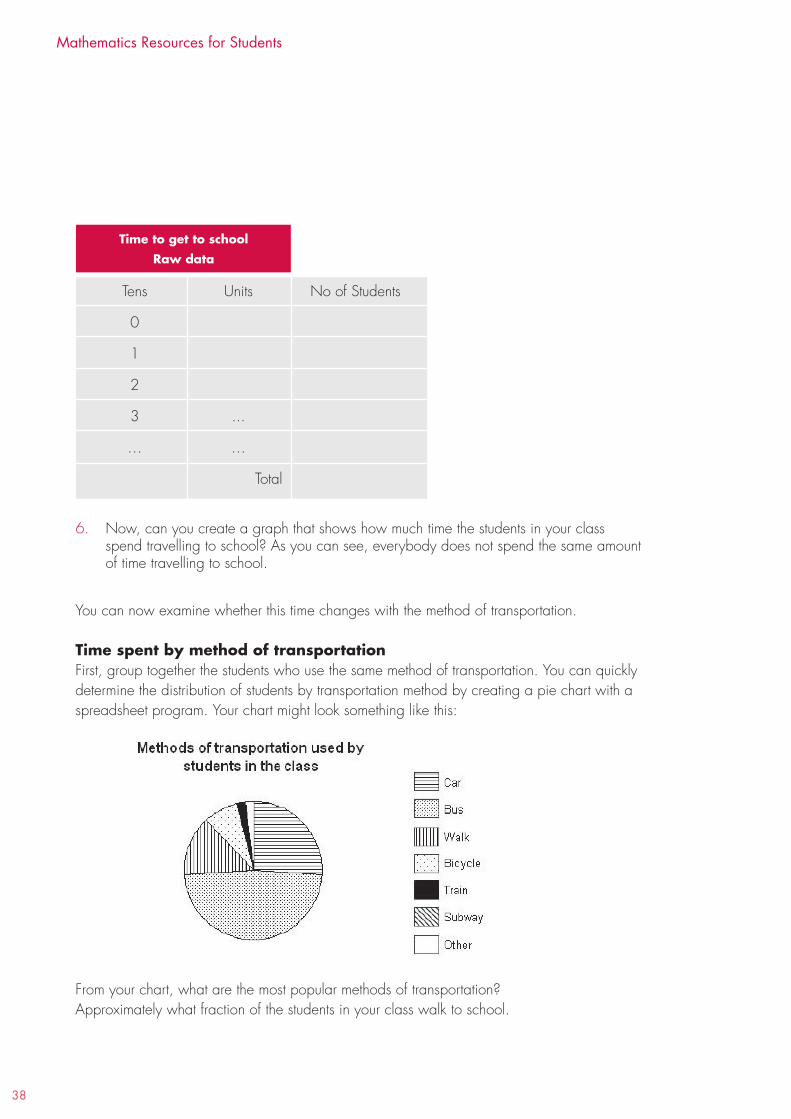
38
Mathematics Resources for Students
6. Now, can you create a graph that shows how much time the students in your classspend travelling to school? As you can see, everybody does not spend the same amountof time travelling to school.
You can now examine whether this time changes with the method of transportation.
Time spent by method of transportationFirst, group together the students who use the same method of transportation. You can quickly determine the distribution of students by transportation method by creating a pie chart with a spreadsheet program. Your chart might look something like this:
From your chart, what are the most popular methods of transportation? Approximately what fraction of the students in your class walk to school.
Tens Units No of Students
0
1
2
3 ...
… …
Total
Time to get to schoolRaw data

39
Now, for each method of transportation:a. sort the time spent getting to school, from the shortest to the longest time.
b. determine the total time spent, which lets you calculate the average.
c. find the number of minutes or less that the faster half of the students spent travelling toschool. This is the median or the value of the middle item of the ordered data.
d. add the minimum and maximum amount of time spent travelling to school.
Create a descriptive table that will look like this:
You can now examine the time by method of transportation. Do you notice any significant differences? Which method of transportation takes the longest?Which method of transportation shows the biggest difference between the shortest time (minimum) and the longest time (maximum)? What might explain this?Can you describe the overall situation for your class and present your point of view? What type of transportation do you think we should encourage? Under what conditions? Why?Finally, use the data you have obtained to create a graph that properly conveys the information about your class that you feel is important.
Comparing your class to a sample of Irish studentsDo you think the situation of your class resembles that of most Irish students? Obtain a sample of 50 students from your school. Then do the same analysis that you did for your own class. Is the time spent getting to school approximately the same for both groups? If not, how does it vary?To help you better compare the data, create two tables side-by-side for each group.
Car 5, 12, 12, 2, 32, 5 83 83/5 12 5 32
Method of Time to get to no Total Average Median Min Max Transportation school (mins) Time Time
Junior Cycle Mathematics STATISTICS AND PROBABILITY

40
Mathematics Resources for Students
‘A picture is worth a thousand words’ and can certainly make it easier to read all these numbers. Create appropriate graphs to easily compare the time spent getting to school for both groups.
You can also compare the methods of transportation used. For each group: create a pie chart to illustrate the distribution of students for the different methods of transportation used to get to school.Use a descriptive table to examine the time spent by method of transportation used.Do you arrive at the same observations for both groups? Are there any significant differences? If yes, what are they? Can you explain the differences taking into account the characteristics of your region?Create a visual representation that properly illustrates and conveys your main conclusions.
0
1
2
3 ... …
4 ... …
5 ... …
50 Total TOTAL Total
Time to get to schoolRaw data for the school Raw data for our class
Students units Tens units Students
41
The activities described below and the questions that follow give you the opportunity to construct an understanding of the concept of finding, collecting and organising data in a statistical investigation. By carrying out a complete data investigation, from formulating a question through drawing conclusions from your data, you will gain an understanding of data analysis as a tool for learning about the world.
The activities are designed to build on your previous experiences with data, and to introduce you to the ideas you will work on as you progress through statistics in Strand 1.
During these activities you will work with categorical data, noticing how these data can be organised in different ways to give different views of the data.As a result you should be able to
• gather data from a group
• classify the data
• write sentences that describe the ‘Big Picture’ of the data
• appreciate how the purpose of the research will affect how the data is gathered
• understand that the way data is represented can illuminate different aspects of the data.
STATISTICS 2
finding, ColleCting and oRganiSing data
lEARnIng OuTCOMES SP3As a result of completing the activities in this section you will be able to
• generate a statistical question
• plan and implement a method to generate and/or source unbiasedrepresentative data and present this data in a frequency table
• classify data
• select draw and interpret appropriate graphical displays of univariatedata including pie charts, bar charts, line plots , histograms (equalintervals) ordered stem and leaf plots and back to back ordered stemand leaf plots
Junior Cycle Mathematics STATISTICS AND PROBABILITY

42
Mathematics Resources for Students
Activity 2.1: A data Investigation
With what well-known person would you like to meet?
1. You will be working in groups on a data investigation. The first step is for each studentto decide on his/her own how they would answer the survey question. Each student willneed to write their answer a number of times on separate pieces of paper so that theycan give their individual answers to each group, including their own.
2. Each group collects answers from everyone; make sure your group has a full class set ofdata that you can discuss.
3. Before you look at the data spend a few minutes discussing what might be interestingabout them.
4. As a group sort the class data into three piles according to what they have in common.This is called classifying your data.
5. Choose one of your ideas for sorting and arrange your cards on a large piece of paperto show that classification
6. Write a sentence or two on your display that tells what you notice about the data
7. Post your display on the wall. If you finish before other groups, discuss issues about datathat arose while you did this activity.
8. Can you represent this data in a chart?
Key Words: Category, data
As you work through this activity reflect with your group on
• What issues came up for you as you tried to represent these data?
• What does the data tell you about the group?
• What questions arise for you while looking at this data? How might you modify the surveyin order to address these?
• Did everyone interpret the original question in the same way?
• What were you thinking when you made your own decision?
Consider the following question
How many countries have you visited?
Elect a scribe to sketch a line plot with reasonable intervals on the board. Collect data on the line plot by marking an X for the value of each person’s response. (Note: a line plot is a graph for numerical data that is similar to a bar chart. It is one of the plots in common use in statistics.)Try to form statements that describe the data. What can they say for the class as a whole about the number of countries that they have visited?
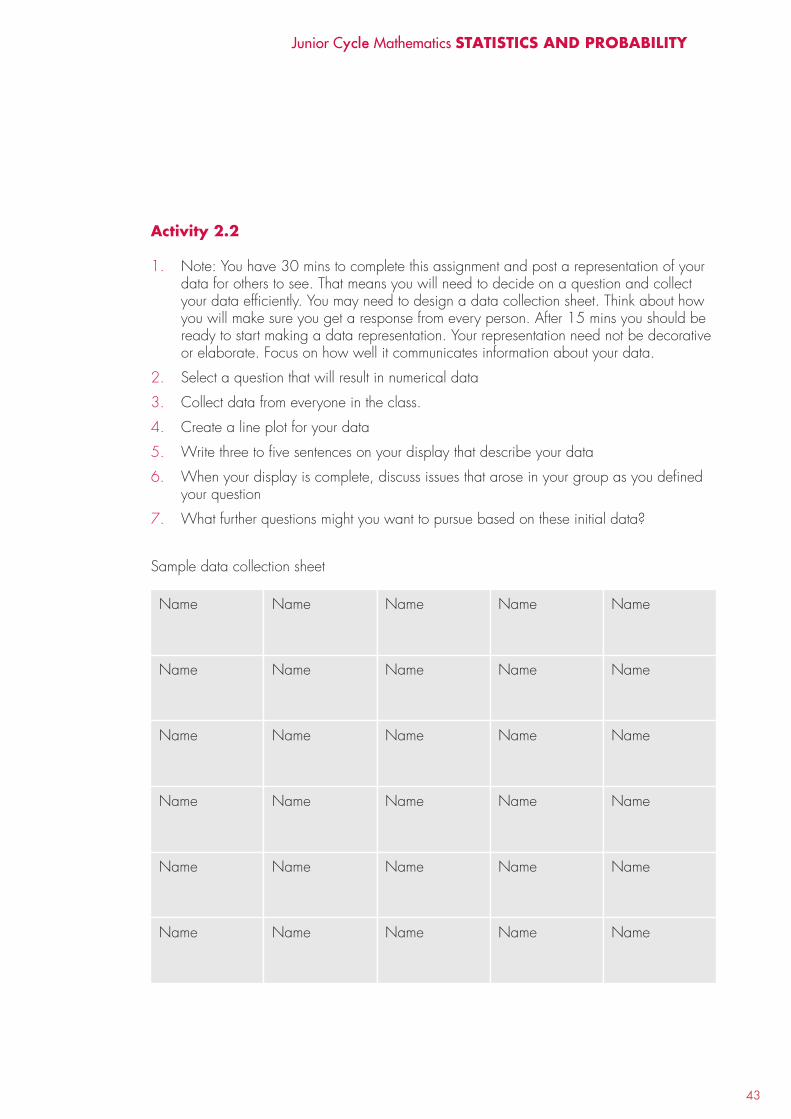
43
Activity 2.2
1. Note: You have 30 mins to complete this assignment and post a representation of yourdata for others to see. That means you will need to decide on a question and collectyour data efficiently. You may need to design a data collection sheet. Think about howyou will make sure you get a response from every person. After 15 mins you should beready to start making a data representation. Your representation need not be decorativeor elaborate. Focus on how well it communicates information about your data.
2. Select a question that will result in numerical data
3. Collect data from everyone in the class.
4. Create a line plot for your data
5. Write three to five sentences on your display that describe your data
6. When your display is complete, discuss issues that arose in your group as you definedyour question
7. What further questions might you want to pursue based on these initial data?
Sample data collection sheet
Name Name Name Name Name
Name Name Name Name Name
Name Name Name Name Name
Name Name Name Name Name
Name Name Name Name Name
Name Name Name Name Name
Junior Cycle Mathematics STATISTICS AND PROBABILITY
Mathematics Resources for Students
JUNIOR CYCLE – Geometry and Trigonometry
© NCCA 2009
Mathematics Resources for Students
InTROduCTIOn
This booklet is designed to supplement the work you have done in Junior Cycle geometry with your teacher. There are activities included for use as homework or in school. The activities will help you to understand more about the concepts you are learning in geometry. Some of the activities have spaces for you to fill in, while others will require you to use drawing instruments and paper of your own. You may not need or be able to complete all activities; your teacher will direct you to activities and/or questions that are suitable.
The sequence in which the sections/topics are presented here is not significant. You may be studying these in a different order, or dipping in and out of various sections over the course of your study and/or revision.
In the first topic (synthetic geometry) it is important that you understand the approach taken. Although only HL students are required to present the proof of some theorems, all students are expected to follow the logic and deduction used in these theorems. This type of understanding is required when solving problems such as those given in the section headed ‘other questions to consider’.
Each activity or question you complete should be kept in a folder for reference and revision at a later date.
The JC Mathematics specification is available on curriculumonline.ie
1
Junior Cycle Mathemathics GEOMETRY And TRIGOnOMETRY
InTROduCTIOnThe activities described below and the questions that follow allow you to deepen your understanding of concepts in geometry as well as solve problems using these concepts and their applications.
Activity 1.1 The following activity is to help you understand the properties of different triangles.Revise the ideas of acute angle, obtuse angle and right angle. You may want to discuss with someone else the difference between ‘could be true’ and ‘could never be true’ before you start.
GEOMETRY 1
Synthetic geoMetRy
LEARnInG OuTCOMEAs a result of completing the activities in this section you will be able to• complete a number of constructions
• use the following terms related to logic and deductive reasoning: theorem, proof,axiom, corollary, converse, implies
• investigate theorems and solve problems.
HL learners will
• extend their understanding of geometry through the use of formal proof for certaintheorems.
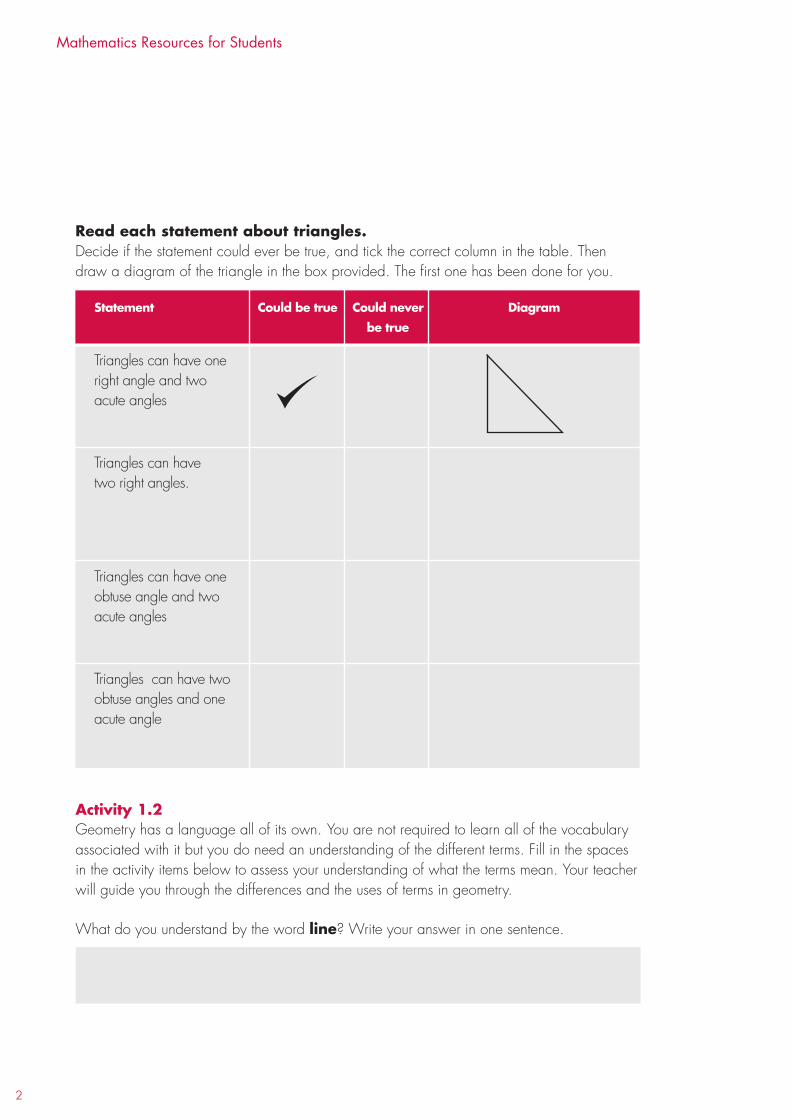
2
Mathematics Resources for Students
Read each statement about triangles.Decide if the statement could ever be true, and tick the correct column in the table. Then draw a diagram of the triangle in the box provided. The first one has been done for you.
Activity 1.2 Geometry has a language all of its own. You are not required to learn all of the vocabulary associated with it but you do need an understanding of the different terms. Fill in the spaces in the activity items below to assess your understanding of what the terms mean. Your teacher will guide you through the differences and the uses of terms in geometry.
What do you understand by the word line? Write your answer in one sentence.
Triangles can have one right angle and two acute angles
Triangles can have two right angles.
Triangles can have one obtuse angle and two acute angles
Triangles can have two obtuse angles and one acute angle
Statement Could be true Could never diagram be true
3
What do you understand by the word triangle? Write your answer in one sentence.
What do you understand by the word angle? Write your answer in one sentence.
What do you understand by the word definition? Write your answer in one sentence.
What do you understand by the word theorem? Write your answer in one sentence.
What do you understand by the word axiom? Write your answer in one sentence.
What do you understand by the word corollary? Write your answer in one sentence.
What do you understand by the phrase geometrical proof? Write your answer in one sentence.
What do you understand by the word converse? Write your answer in one sentence.
Junior Cycle Mathemathics GEOMETRY And TRIGOnOMETRY
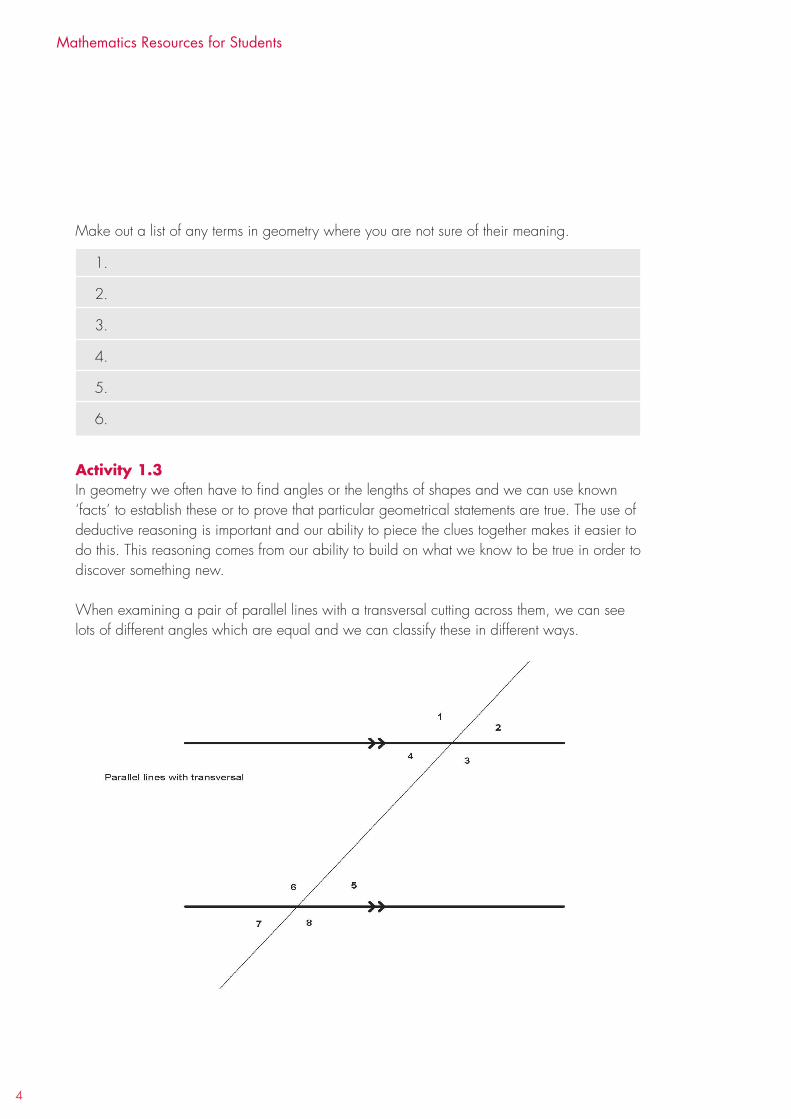
4
Mathematics Resources for Students
Make out a list of any terms in geometry where you are not sure of their meaning.
Activity 1.3 In geometry we often have to find angles or the lengths of shapes and we can use known ‘facts’ to establish these or to prove that particular geometrical statements are true. The use of deductive reasoning is important and our ability to piece the clues together makes it easier to do this. This reasoning comes from our ability to build on what we know to be true in order to discover something new.
When examining a pair of parallel lines with a transversal cutting across them, we can see lots of different angles which are equal and we can classify these in different ways.
1.
2.
3.
4.
5.
6.
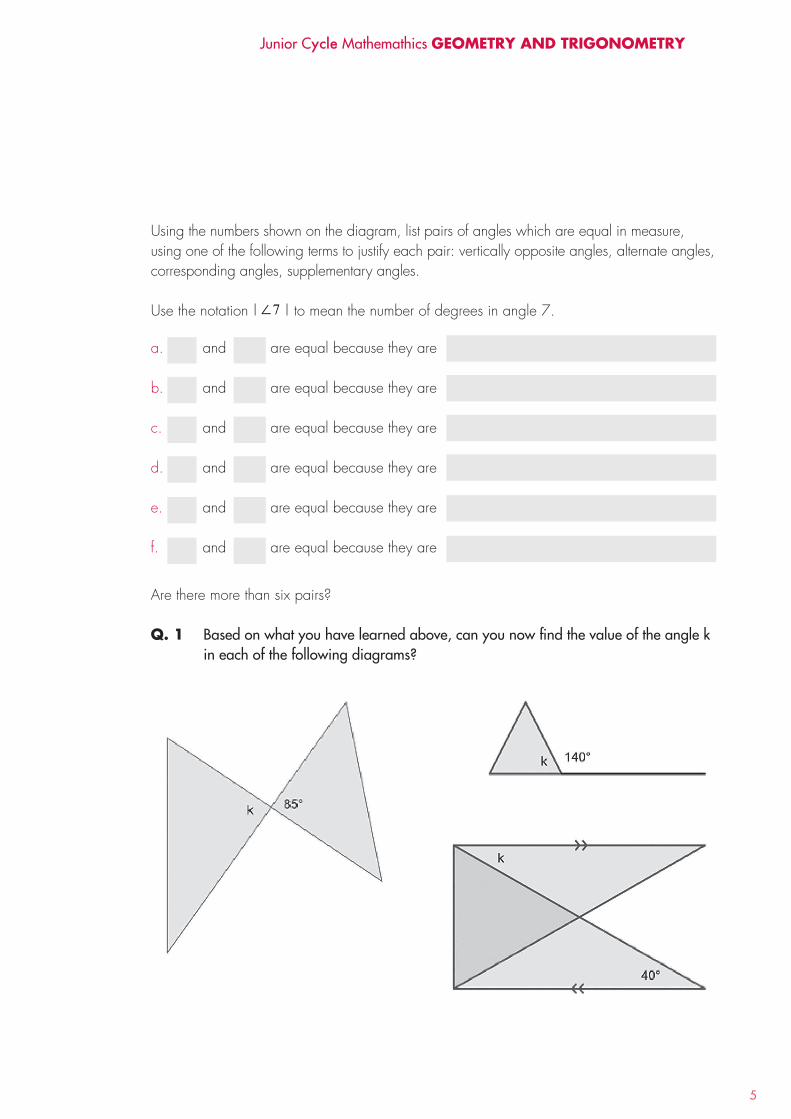
5
Using the numbers shown on the diagram, list pairs of angles which are equal in measure, using one of the following terms to justify each pair: vertically opposite angles, alternate angles, corresponding angles, supplementary angles.
Use the notation | | to mean the number of degrees in angle 7.
a. and are equal because they are
b. and are equal because they are
c. and are equal because they are
d. and are equal because they are
e. and are equal because they are
f. and are equal because they are
Are there more than six pairs?
Q. 1 Based on what you have learned above, can you now find the value of the angle kin each of the following diagrams?
7∠
Junior Cycle Mathemathics GEOMETRY And TRIGOnOMETRY
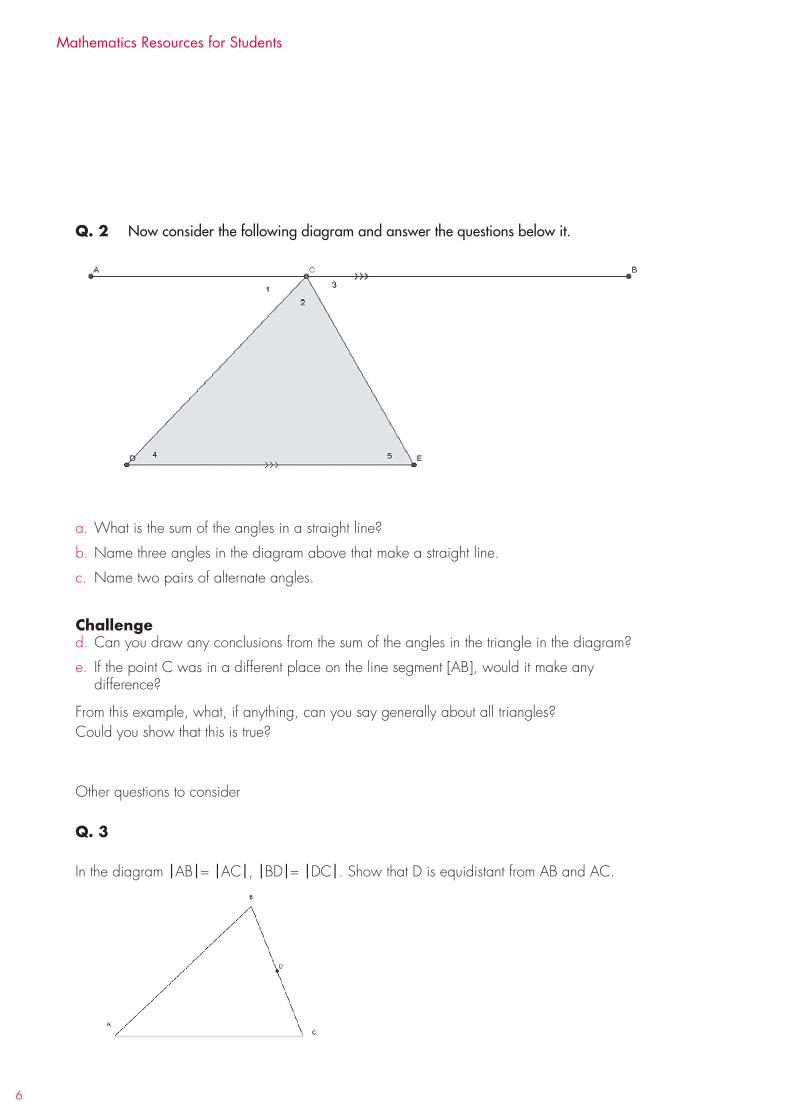
6
Mathematics Resources for Students
Q. 2 Now consider the following diagram and answer the questions below it.
a. What is the sum of the angles in a straight line?
b. Name three angles in the diagram above that make a straight line.
c. Name two pairs of alternate angles.
Challenged. Can you draw any conclusions from the sum of the angles in the triangle in the diagram?
e. If the point C was in a different place on the line segment [AB], would it make anydifference?
From this example, what, if anything, can you say generally about all triangles? Could you show that this is true?
Other questions to consider
Q. 3
In the diagram |AB|= |AC|, |BD|= |DC|. Show that D is equidistant from AB and AC.
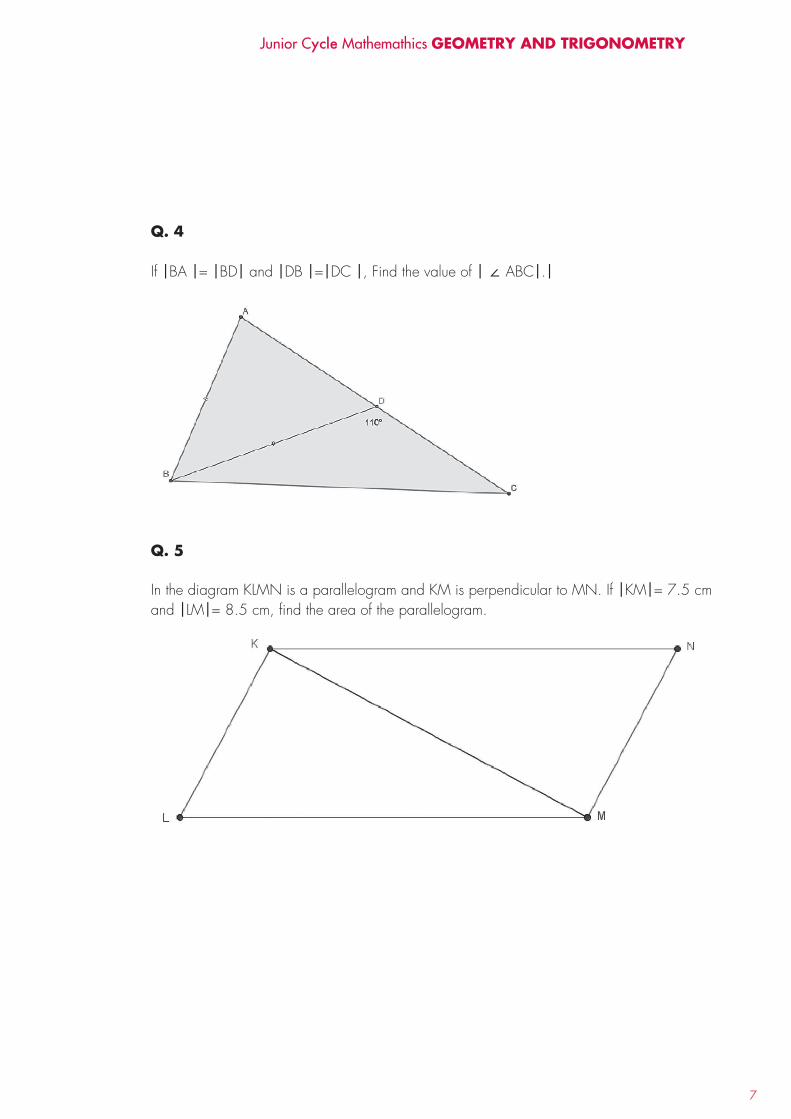
7
Q. 4
If |BA |= |BD| and |DB |=|DC |, Find the value of | ∠ ABC|.|
Q. 5
In the diagram KLMN is a parallelogram and KM is perpendicular to MN. If |KM|= 7.5 cm and |LM|= 8.5 cm, find the area of the parallelogram.
Junior Cycle Mathemathics GEOMETRY And TRIGOnOMETRY
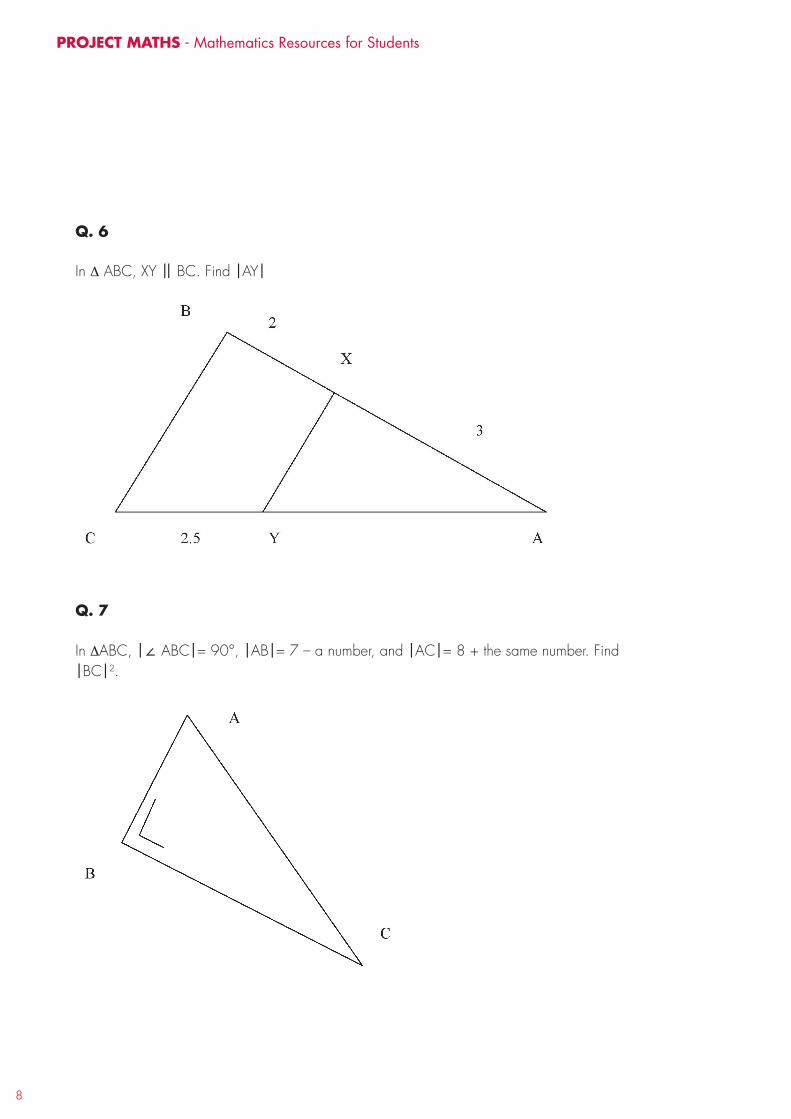
8
PROJECT MATHS - Mathematics Resources for Students
Q. 6
In ∆ ABC, XY || BC. Find |AY|
Q. 7
In ∆ABC, |∠ ABC|= 90°, |AB|= 7 – a number, and |AC|= 8 + the same number. Find |BC|2.
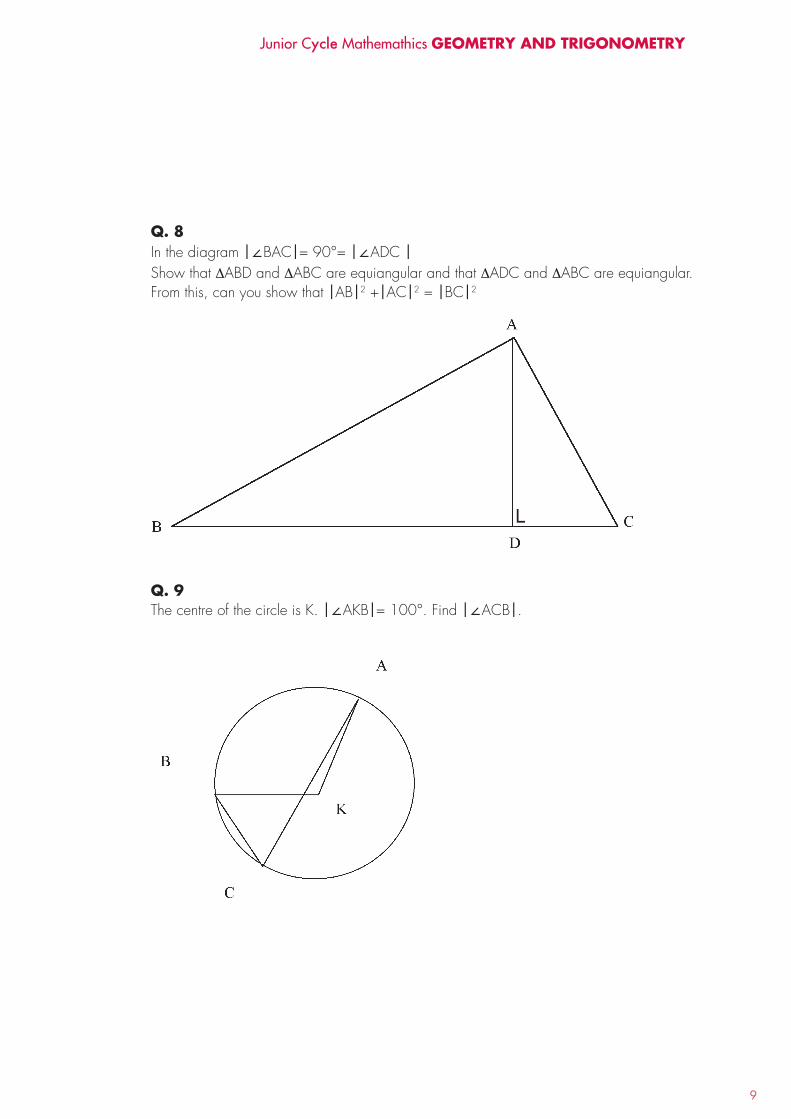
9
Q. 8 In the diagram |∠BAC|= 90°= |∠ADC |Show that ∆ABD and ∆ABC are equiangular and that ∆ADC and ∆ABC are equiangular. From this, can you show that |AB|2 +|AC|2 = |BC|2
Q. 9 The centre of the circle is K. |∠AKB|= 100°. Find |∠ACB|.
Junior Cycle Mathemathics GEOMETRY And TRIGOnOMETRY
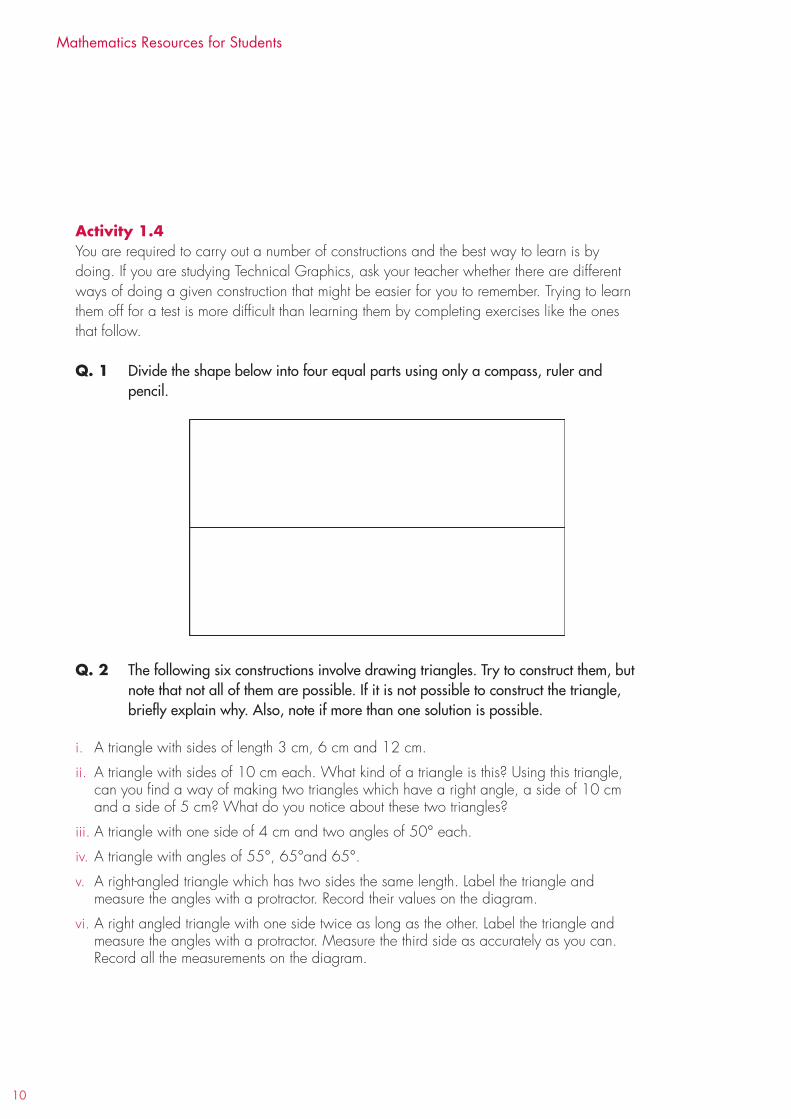
10
Mathematics Resources for Students
Activity 1.4You are required to carry out a number of constructions and the best way to learn is by doing. If you are studying Technical Graphics, ask your teacher whether there are different ways of doing a given construction that might be easier for you to remember. Trying to learn them off for a test is more difficult than learning them by completing exercises like the ones that follow.
Q. 1 Divide the shape below into four equal parts using only a compass, ruler andpencil.
Q. 2 The following six constructions involve drawing triangles. Try to construct them, butnote that not all of them are possible. If it is not possible to construct the triangle, briefly explain why. Also, note if more than one solution is possible.
i. A triangle with sides of length 3 cm, 6 cm and 12 cm.
ii. A triangle with sides of 10 cm each. What kind of a triangle is this? Using this triangle,can you find a way of making two triangles which have a right angle, a side of 10 cmand a side of 5 cm? What do you notice about these two triangles?
iii. A triangle with one side of 4 cm and two angles of 50° each.
iv. A triangle with angles of 55°, 65°and 65°.
v. A right-angled triangle which has two sides the same length. Label the triangle andmeasure the angles with a protractor. Record their values on the diagram.
vi. A right angled triangle with one side twice as long as the other. Label the triangle andmeasure the angles with a protractor. Measure the third side as accurately as you can.Record all the measurements on the diagram.
11
GEOMETRY 2
tRanSfoRMation geoMetRy
LEARnInG OuTCOMEAs a result of completing the activities in this section you will be able to
GT.6 investigate transformations of simple objects so that they can:a. recognise and draw the image of points and objects under translation, central symmetry, axial symmetry, and rotationb. draw the axes of symmetry in shapes
InTROduCTIOnThe activities described below and the questions that follow allow you to deepen your understanding of concepts in transformation geometry as well as solve problems using these concepts and their applications.
Translation in geometry is about movement of a point or object. The point or object can change its position or an object can change the direction in which it is facing. When we have located the object in a new position we call it the image, because it is like the original.
When we describe movement in the plane we can say to the left or right, up or down; to the north, south, east or west;or, later, we can use co-ordinates to describe the location of the image of an object or point.
Junior Cycle Mathemathics GEOMETRY And TRIGOnOMETRY
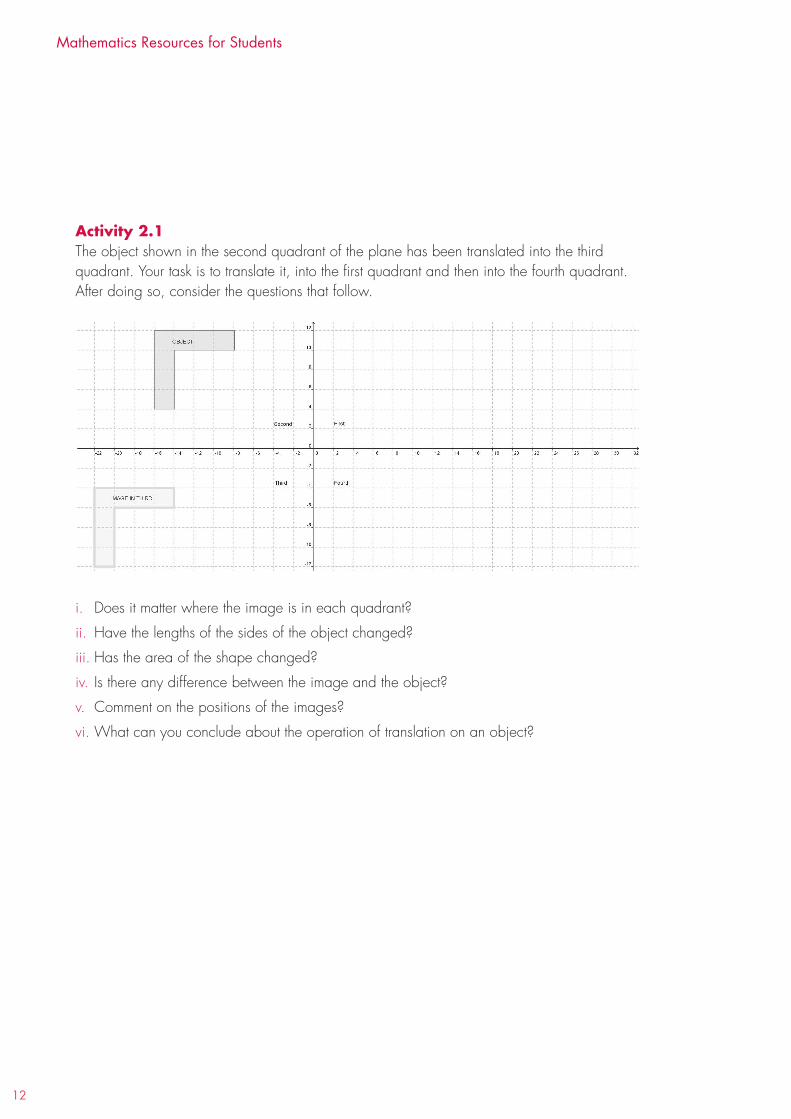
12
Mathematics Resources for Students
Activity 2.1The object shown in the second quadrant of the plane has been translated into the third quadrant. Your task is to translate it, into the first quadrant and then into the fourth quadrant. After doing so, consider the questions that follow.
i. Does it matter where the image is in each quadrant?
ii. Have the lengths of the sides of the object changed?
iii. Has the area of the shape changed?
iv. Is there any difference between the image and the object?
v. Comment on the positions of the images?
vi. What can you conclude about the operation of translation on an object?
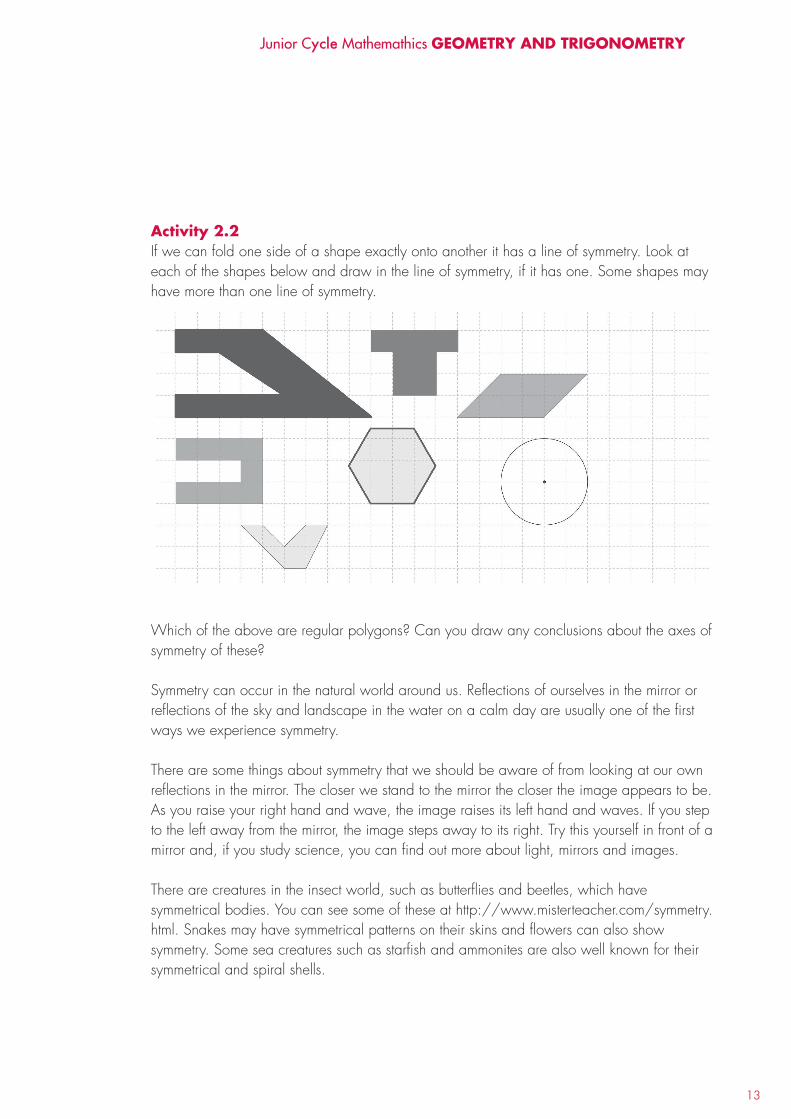
13
Activity 2.2If we can fold one side of a shape exactly onto another it has a line of symmetry. Look at each of the shapes below and draw in the line of symmetry, if it has one. Some shapes may have more than one line of symmetry.
Which of the above are regular polygons? Can you draw any conclusions about the axes of symmetry of these?
Symmetry can occur in the natural world around us. Reflections of ourselves in the mirror or reflections of the sky and landscape in the water on a calm day are usually one of the first ways we experience symmetry.
There are some things about symmetry that we should be aware of from looking at our own reflections in the mirror. The closer we stand to the mirror the closer the image appears to be. As you raise your right hand and wave, the image raises its left hand and waves. If you step to the left away from the mirror, the image steps away to its right. Try this yourself in front of a mirror and, if you study science, you can find out more about light, mirrors and images.
There are creatures in the insect world, such as butterflies and beetles, which have symmetrical bodies. You can see some of these at http://www.misterteacher.com/symmetry.html. Snakes may have symmetrical patterns on their skins and flowers can also show symmetry. Some sea creatures such as starfish and ammonites are also well known for their symmetrical and spiral shells.
Junior Cycle Mathemathics GEOMETRY And TRIGOnOMETRY
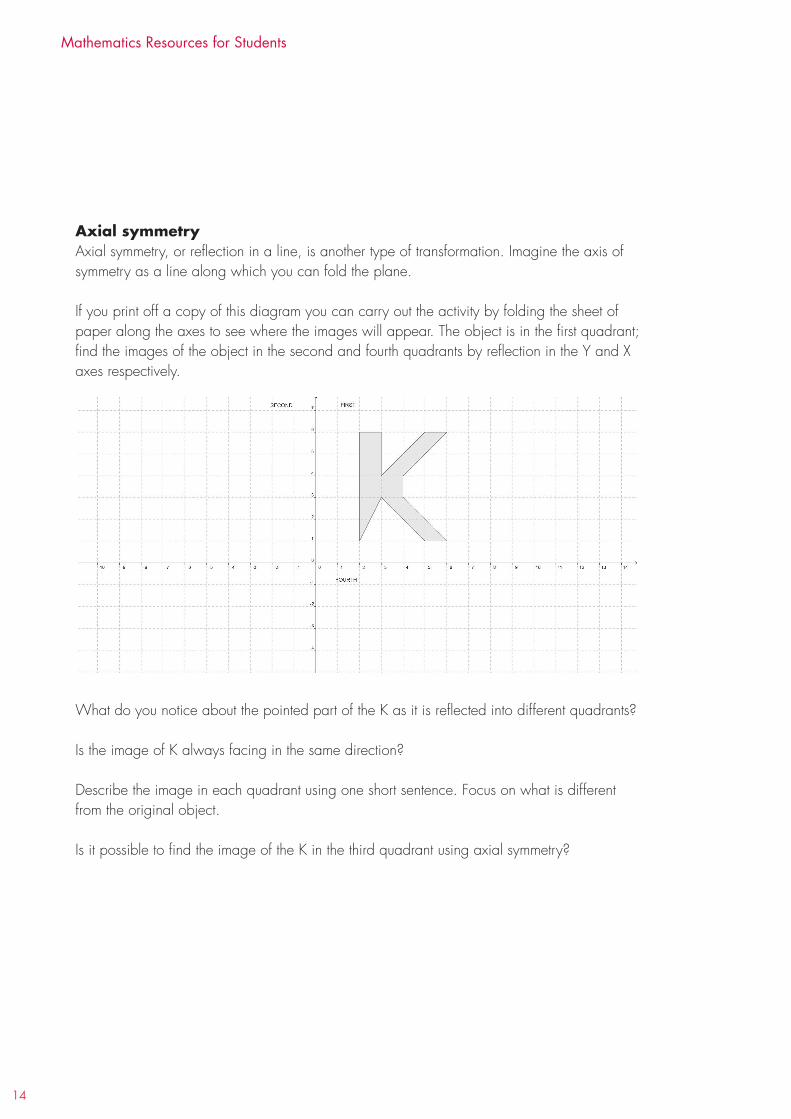
14
Mathematics Resources for Students
Axial symmetry Axial symmetry, or reflection in a line, is another type of transformation. Imagine the axis of symmetry as a line along which you can fold the plane.
If you print off a copy of this diagram you can carry out the activity by folding the sheet of paper along the axes to see where the images will appear. The object is in the first quadrant; find the images of the object in the second and fourth quadrants by reflection in the Y and X axes respectively.
What do you notice about the pointed part of the K as it is reflected into different quadrants?
Is the image of K always facing in the same direction?
Describe the image in each quadrant using one short sentence. Focus on what is different from the original object.
Is it possible to find the image of the K in the third quadrant using axial symmetry?
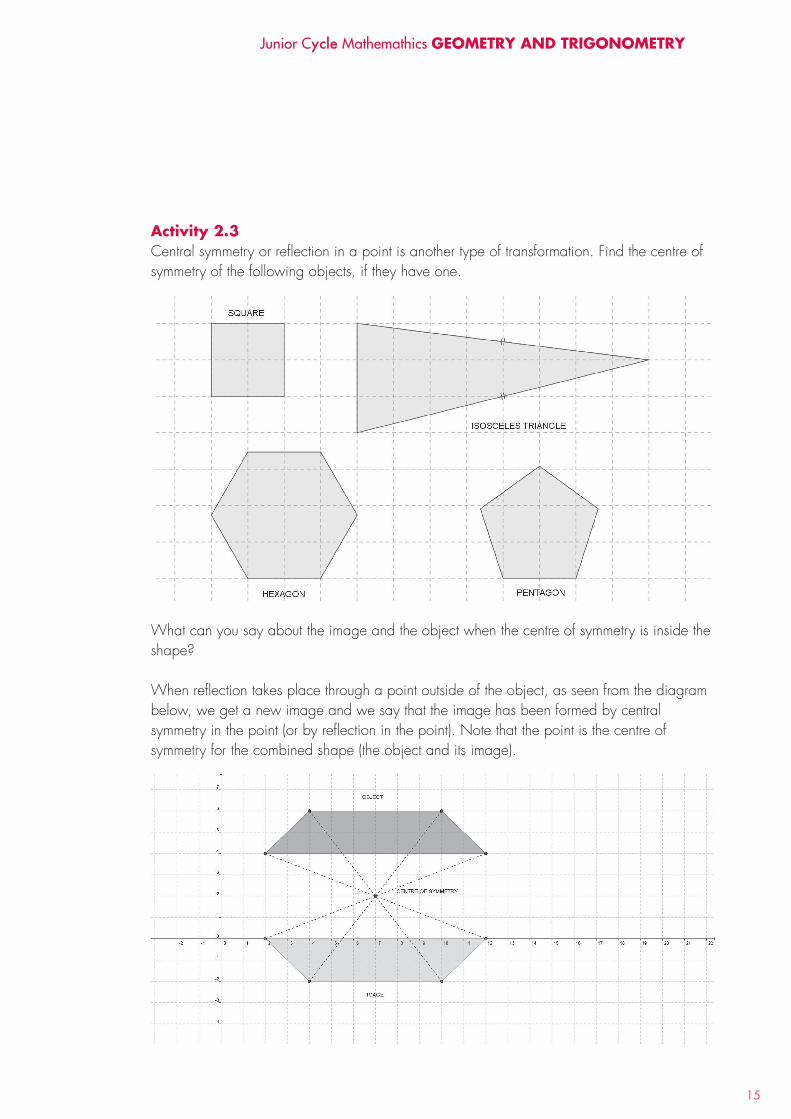
15
Activity 2.3Central symmetry or reflection in a point is another type of transformation. Find the centre of symmetry of the following objects, if they have one.
What can you say about the image and the object when the centre of symmetry is inside the shape?
When reflection takes place through a point outside of the object, as seen from the diagram below, we get a new image and we say that the image has been formed by central symmetry in the point (or by reflection in the point). Note that the point is the centre of symmetry for the combined shape (the object and its image).
Junior Cycle Mathemathics GEOMETRY And TRIGOnOMETRY

16
Mathematics Resources for Students
Q. 1 Draw the image of the shape in the diagram by central symmetry through theorigin (0,0) and then answer the questions that follow.
i. What happened to the object when it was reflected in the origin (0,0)? Explain this in onesentence.
ii. How would you describe the orientation of the image after reflection?
iii. If you reflected the image back through the origin, would you get the original shape?
Central symmetry can be done through any point on the plane. Pick a point which will reflect the object above
i. into the fourth quadrant
ii. into the second quadrant.
Briefly describe the image in each case.
17
GEOMETRY 3
co-oRdinate geoMetRy
LEARnInG OuTCOMEAs a result of completing the activities in this section you will be able to
GT.5 investigate properties of points, lines and line segments in the co-ordinate plane
InTROduCTIOnThe activities described below and the questions that follow allow you to deepen your understanding of concepts in co-ordinate geometry as well as solve problems using these concepts and their applications.
The plotting of points has allowed us to find locations on maps for generations. A global positioning system (GPS) has replaced 6 figure grid references for specifying locations these days. Our mobile phones have this function and many cars have in-built or mobile ‘sat-nav’ technology to help us navigate our way around big cities or to unfamiliar places. When we get there we can store the location as a ‘way point’ and find it again easily next time.
Junior Cycle Mathemathics GEOMETRY And TRIGOnOMETRY
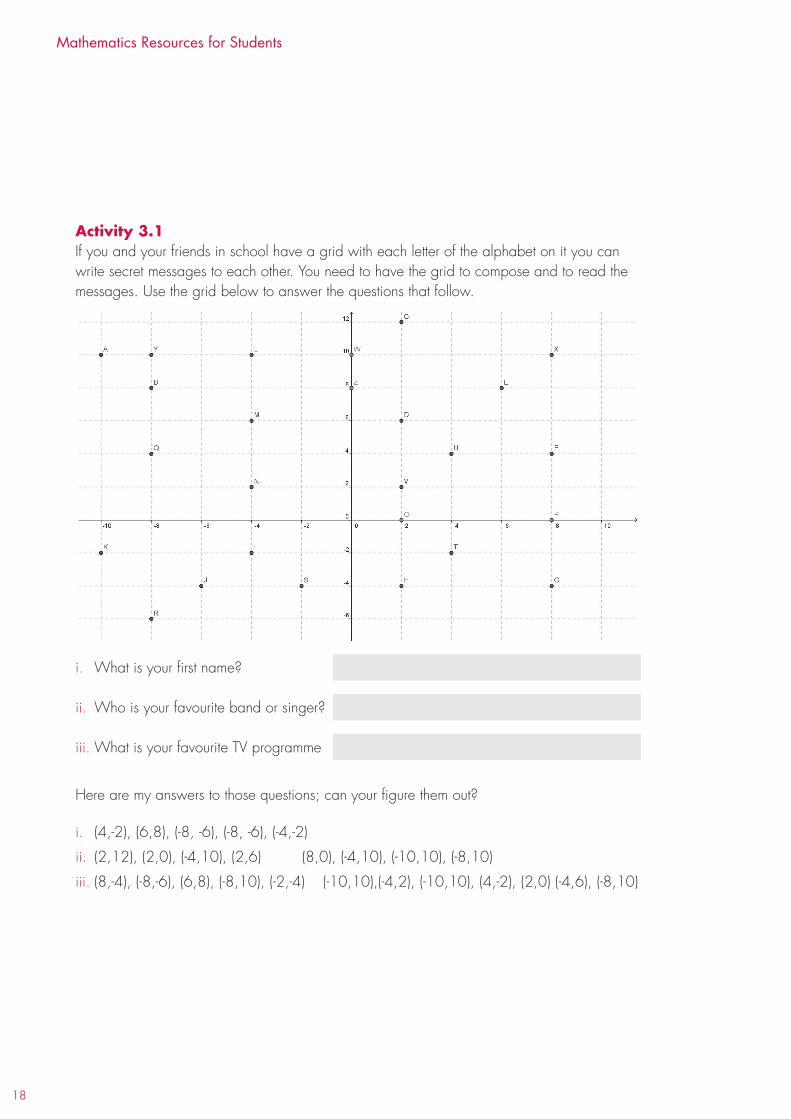
18
Mathematics Resources for Students
Activity 3.1If you and your friends in school have a grid with each letter of the alphabet on it you can write secret messages to each other. You need to have the grid to compose and to read the messages. Use the grid below to answer the questions that follow.
i. What is your first name?
ii. Who is your favourite band or singer?
iii. What is your favourite TV programme
Here are my answers to those questions; can your figure them out?
i. (4,-2), (6,8), (-8, -6), (-8, -6), (-4,-2)
ii. (2,12), (2,0), (-4,10), (2,6) (8,0), (-4,10), (-10,10), (-8,10)
iii. (8,-4), (-8,-6), (6,8), (-8,10), (-2,-4) (-10,10),(-4,2), (-10,10), (4,-2), (2,0) (-4,6), (-8,10)
19
Q. 1 Make up five questions that could be answered in codes by other students.
Q. 2 Write a message of one sentence in code that you can give to another student towork out. The sentence should be written with pairs of co-ordinates in brackets for each letter and spaces between each of the words.
Extension activityIt is easy for anyone to read a message using the above grid. Make your own grid with the letters in different places. Consider the following.
1. Can you confuse someone trying to break the code by having the same letter in twolocations on your grid?
2. It is possible to include numbers or words in your grid?
3. Could you put the ‘txt words’ that you use on your mobile onto a grid?
For further explorationRene Descartes was the mathematician famed for first devising the co-ordinated plane. Find out more about him and his life in your school library or on the internet if you have access (check out www.projectmaths.ie for information).
There are some famous codes that were used in the past to communicate or to encrypt messages. ENIGMA was one of these, and a movie was made about this code.
If you have access to the internet, search for information about Public Key Encryption (PKE).
Junior Cycle Mathemathics GEOMETRY And TRIGOnOMETRY
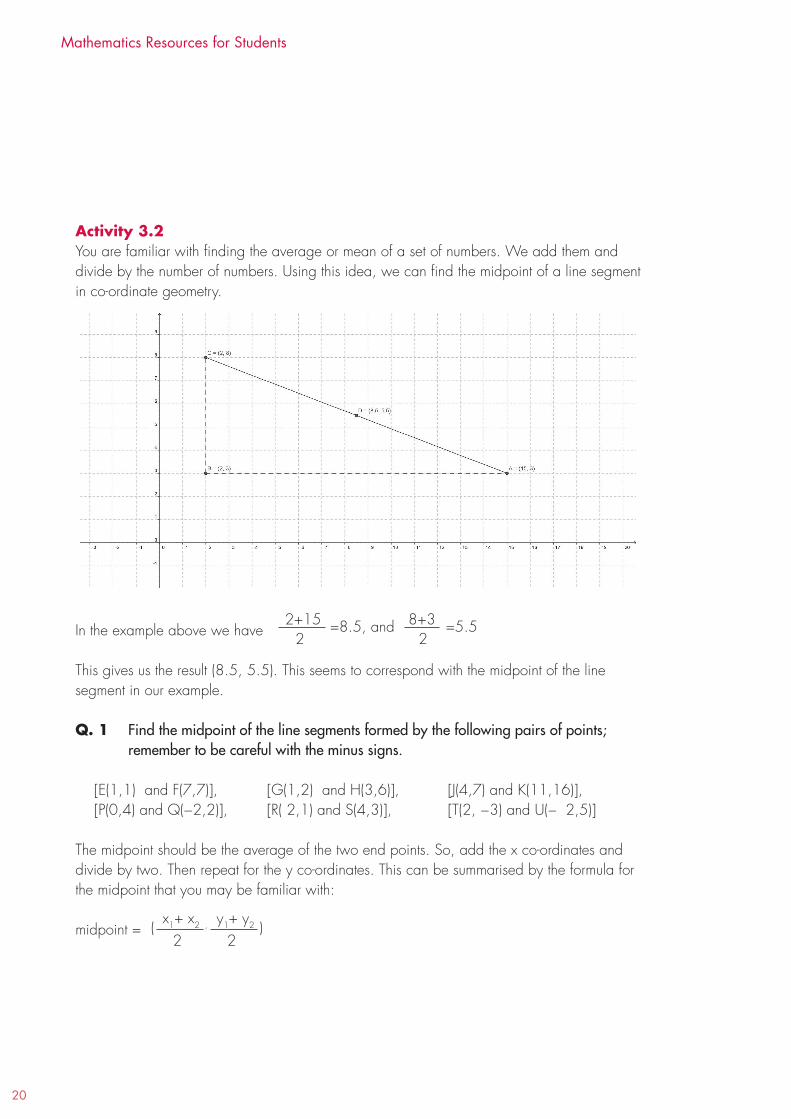
20
Mathematics Resources for Students
Activity 3.2You are familiar with finding the average or mean of a set of numbers. We add them and divide by the number of numbers. Using this idea, we can find the midpoint of a line segment in co-ordinate geometry.
In the example above we have
This gives us the result (8.5, 5.5). This seems to correspond with the midpoint of the line segment in our example.
Q. 1 Find the midpoint of the line segments formed by the following pairs of points;remember to be careful with the minus signs.
[E(1,1) and F(7,7)], [G(1,2) and H(3,6)], [J(4,7) and K(11,16)], [P(0,4) and Q(−2,2)], [R( 2,1) and S(4,3)], [T(2, −3) and U(− 2,5)]
The midpoint should be the average of the two end points. So, add the x co-ordinates and divide by two. Then repeat for the y co-ordinates. This can be summarised by the formula for the midpoint that you may be familiar with:
midpoint =
2+15 8+32 2
=8.5, and =5.5
x1+ x2 , y1+ y2
2 2( )
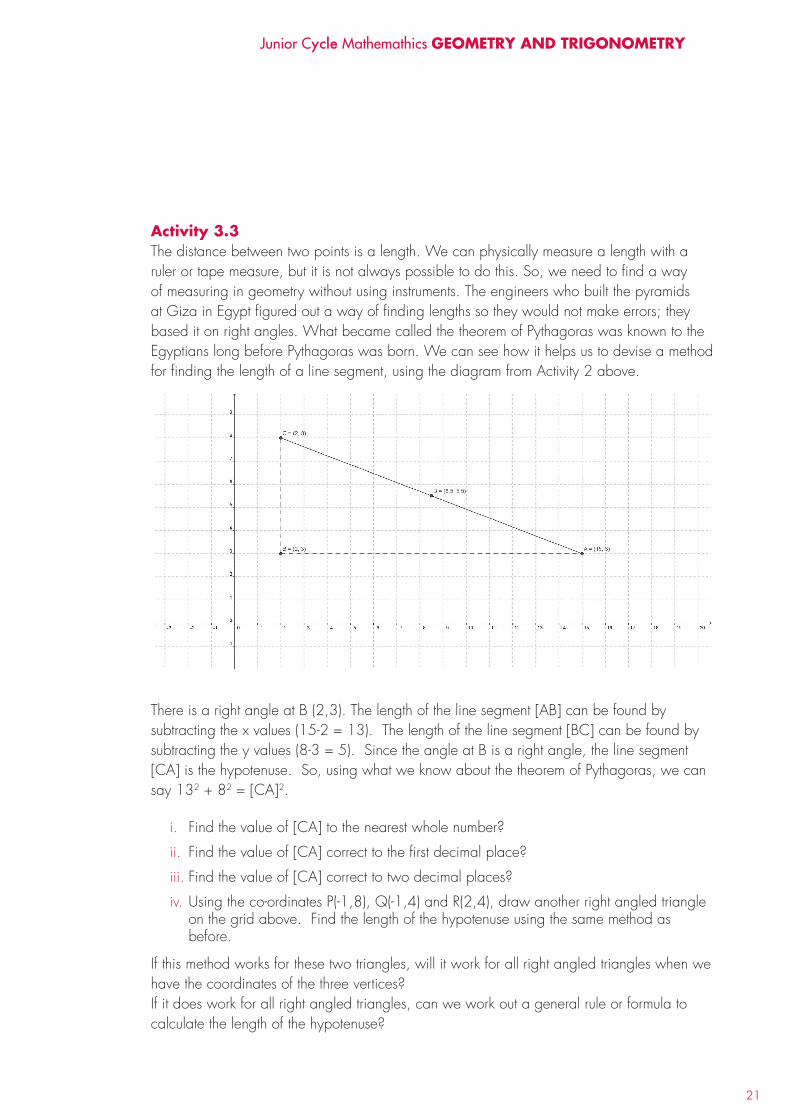
21
Activity 3.3The distance between two points is a length. We can physically measure a length with a ruler or tape measure, but it is not always possible to do this. So, we need to find a way of measuring in geometry without using instruments. The engineers who built the pyramids at Giza in Egypt figured out a way of finding lengths so they would not make errors; they based it on right angles. What became called the theorem of Pythagoras was known to the Egyptians long before Pythagoras was born. We can see how it helps us to devise a method for finding the length of a line segment, using the diagram from Activity 2 above.
There is a right angle at B (2,3). The length of the line segment [AB] can be found by subtracting the x values (15-2 = 13). The length of the line segment [BC] can be found by subtracting the y values (8-3 = 5). Since the angle at B is a right angle, the line segment [CA] is the hypotenuse. So, using what we know about the theorem of Pythagoras, we can say 132 + 82 = [CA]2.
i. Find the value of [CA] to the nearest whole number?
ii. Find the value of [CA] correct to the first decimal place?
iii. Find the value of [CA] correct to two decimal places?
iv. Using the co-ordinates P(-1,8), Q(-1,4) and R(2,4), draw another right angled triangleon the grid above. Find the length of the hypotenuse using the same method asbefore.
If this method works for these two triangles, will it work for all right angled triangles when we have the coordinates of the three vertices?If it does work for all right angled triangles, can we work out a general rule or formula to calculate the length of the hypotenuse?
Junior Cycle Mathemathics GEOMETRY And TRIGOnOMETRY
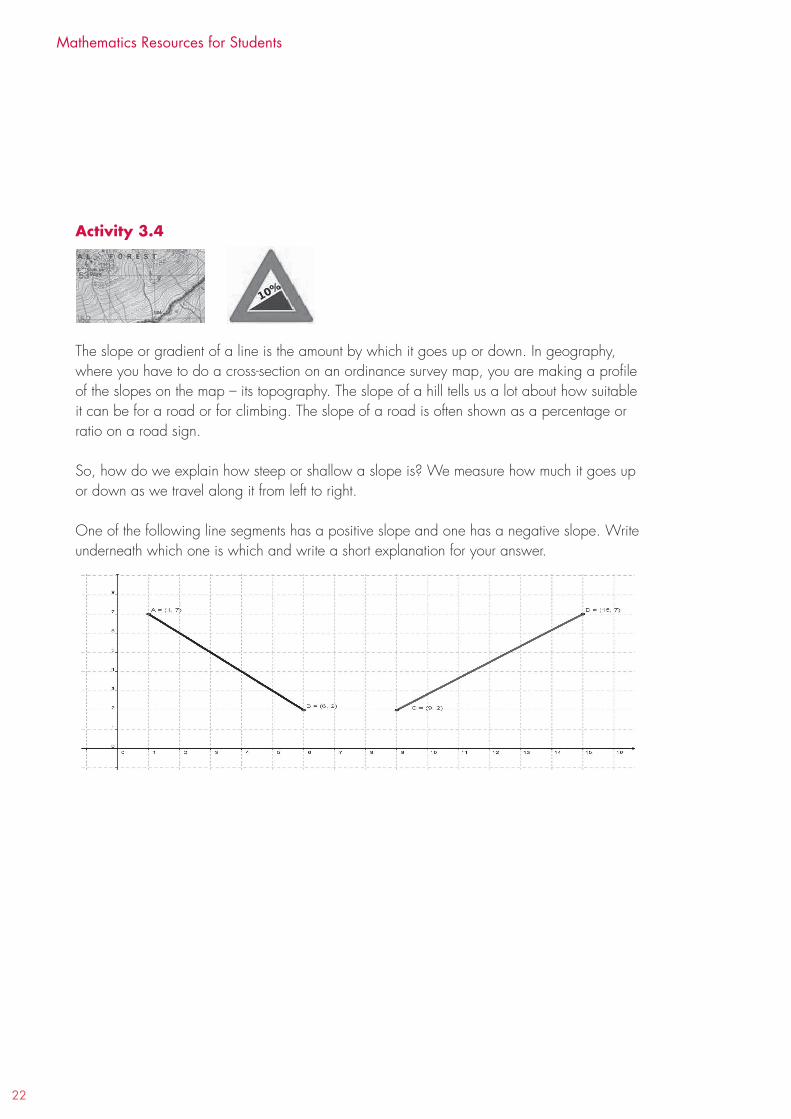
22
Mathematics Resources for Students
Activity 3.4
The slope or gradient of a line is the amount by which it goes up or down. In geography, where you have to do a cross-section on an ordinance survey map, you are making a profile of the slopes on the map – its topography. The slope of a hill tells us a lot about how suitable it can be for a road or for climbing. The slope of a road is often shown as a percentage or ratio on a road sign.
So, how do we explain how steep or shallow a slope is? We measure how much it goes up or down as we travel along it from left to right.
One of the following line segments has a positive slope and one has a negative slope. Write underneath which one is which and write a short explanation for your answer.
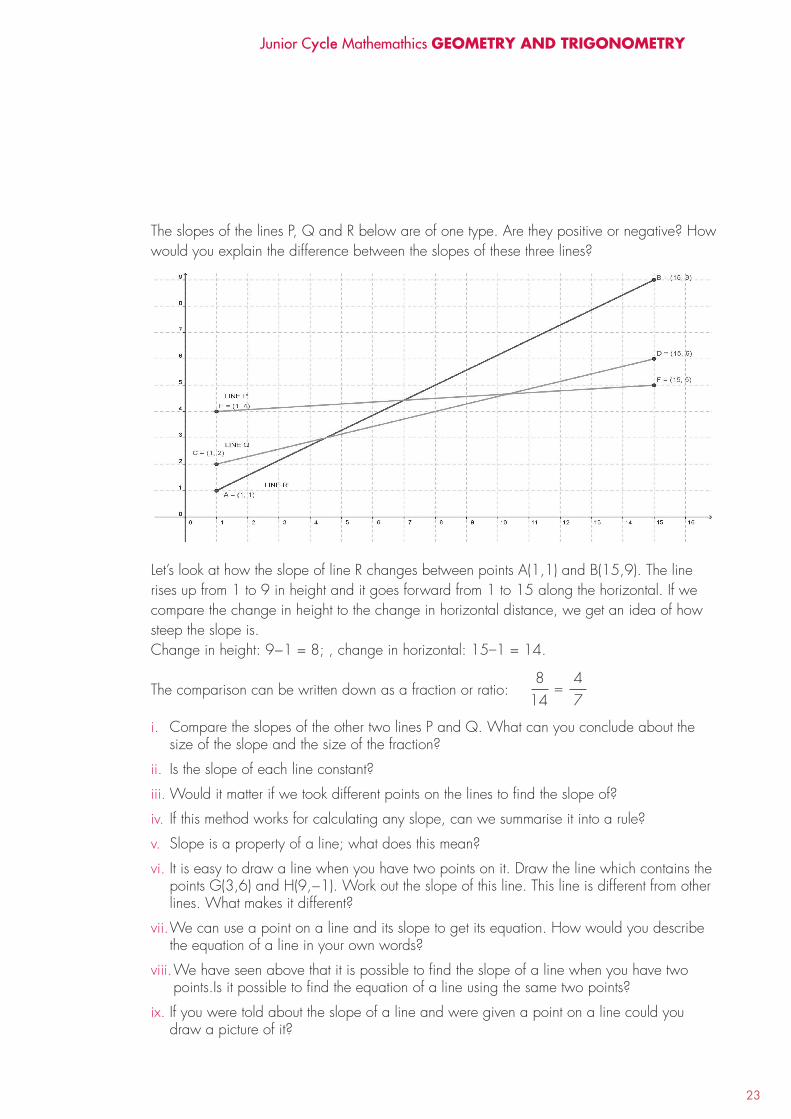
23
The slopes of the lines P, Q and R below are of one type. Are they positive or negative? How would you explain the difference between the slopes of these three lines?
Let’s look at how the slope of line R changes between points A(1,1) and B(15,9). The line rises up from 1 to 9 in height and it goes forward from 1 to 15 along the horizontal. If we compare the change in height to the change in horizontal distance, we get an idea of how steep the slope is.Change in height: 9−1 = 8; , change in horizontal: 15–1 = 14.
The comparison can be written down as a fraction or ratio:
i. Compare the slopes of the other two lines P and Q. What can you conclude about thesize of the slope and the size of the fraction?
ii. Is the slope of each line constant?
iii. Would it matter if we took different points on the lines to find the slope of?
iv. If this method works for calculating any slope, can we summarise it into a rule?
v. Slope is a property of a line; what does this mean?
vi. It is easy to draw a line when you have two points on it. Draw the line which contains thepoints G(3,6) and H(9,−1). Work out the slope of this line. This line is different from otherlines. What makes it different?
vii. We can use a point on a line and its slope to get its equation. How would you describethe equation of a line in your own words?
viii. We have seen above that it is possible to find the slope of a line when you have twopoints.Is it possible to find the equation of a line using the same two points?
ix. If you were told about the slope of a line and were given a point on a line could youdraw a picture of it?
8 414 7
=
Junior Cycle Mathemathics GEOMETRY And TRIGOnOMETRY
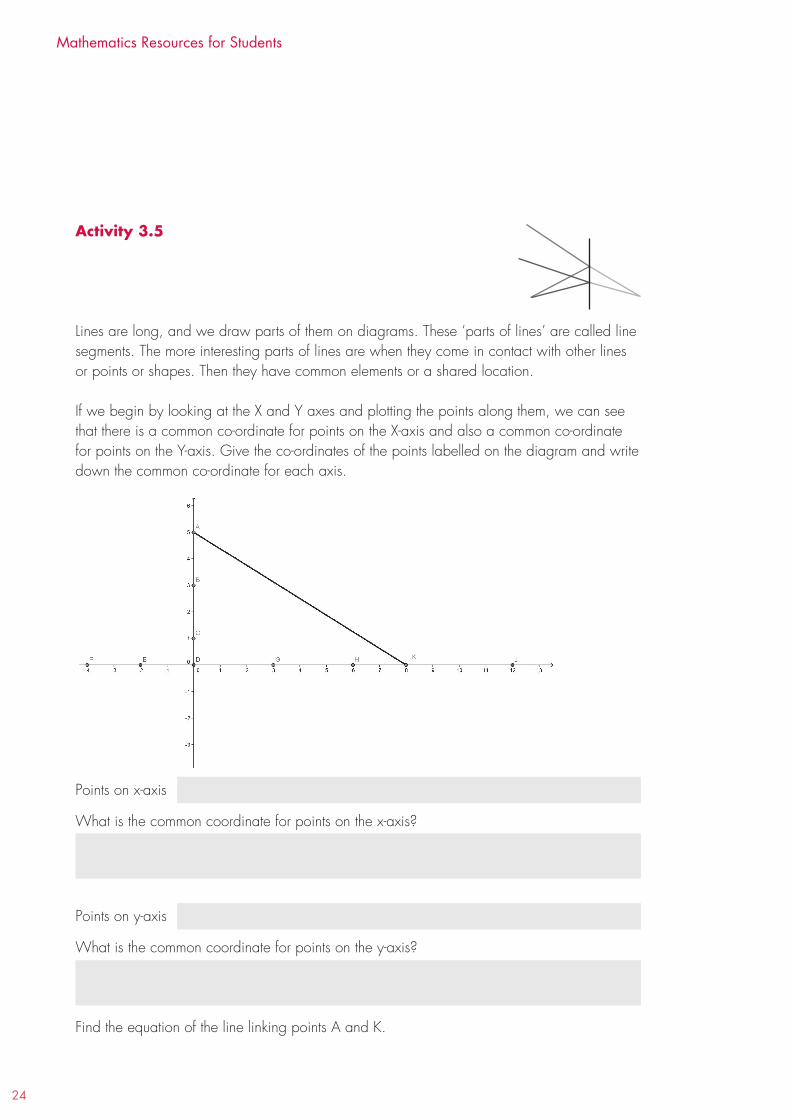
24
Mathematics Resources for Students
Activity 3.5
Lines are long, and we draw parts of them on diagrams. These ‘parts of lines’ are called line segments. The more interesting parts of lines are when they come in contact with other lines or points or shapes. Then they have common elements or a shared location.
If we begin by looking at the X and Y axes and plotting the points along them, we can see that there is a common co-ordinate for points on the X-axis and also a common co-ordinate for points on the Y-axis. Give the co-ordinates of the points labelled on the diagram and write down the common co-ordinate for each axis.
Points on x-axis
What is the common coordinate for points on the x-axis?
Points on y-axis
What is the common coordinate for points on the y-axis?
Find the equation of the line linking points A and K.
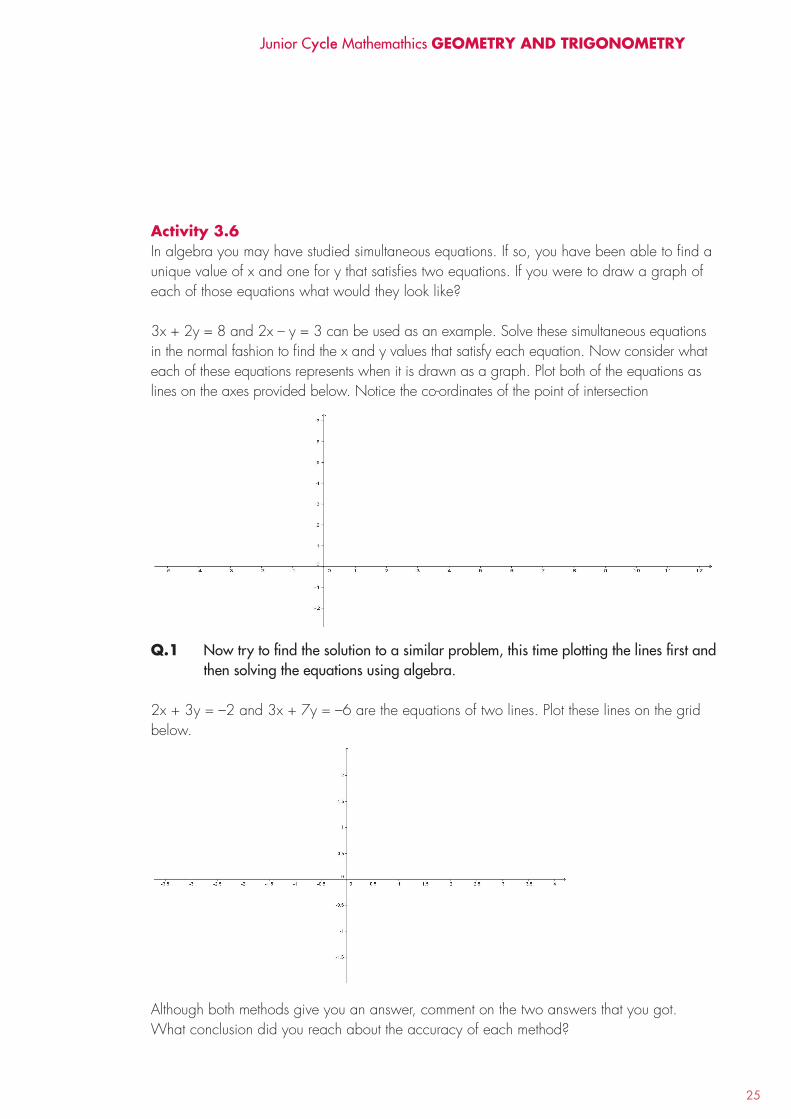
25
Activity 3.6In algebra you may have studied simultaneous equations. If so, you have been able to find a unique value of x and one for y that satisfies two equations. If you were to draw a graph of each of those equations what would they look like?
3x + 2y = 8 and 2x – y = 3 can be used as an example. Solve these simultaneous equations in the normal fashion to find the x and y values that satisfy each equation. Now consider what each of these equations represents when it is drawn as a graph. Plot both of the equations as lines on the axes provided below. Notice the co-ordinates of the point of intersection
Q.1 Now try to find the solution to a similar problem, this time plotting the lines first andthen solving the equations using algebra.
2x + 3y = –2 and 3x + 7y = –6 are the equations of two lines. Plot these lines on the grid below.
Although both methods give you an answer, comment on the two answers that you got. What conclusion did you reach about the accuracy of each method?
Junior Cycle Mathemathics GEOMETRY And TRIGOnOMETRY

26
Mathematics Resources for Students
Activity 3.7Describe parallel lines in one sentence.
What common property would you identify from the opposite sides [AB] and [CD] of the shape shown in the diagram below. How can you show that the property is the same in both sets of lines? Will this always be true for parallel lines?
Generalise your findings into a rule that will apply to all parallel lines.
Other linesDraw the line x = 4 and the line y = 4. Investigate the slopes of these lines. Write a couple of sentences to summarise your findings.
Q. 1 In the diagram below the lines are at right angles. Find the slope of each line andcompare them. Write down any ideas you have about the slopes of perpendicular lines.

27
GEOMETRY 4
tRigonoMetRy
LEARnInG OuTCOMEAs a result of completing the activities in this section you will be able to
GT.4 evaluate and use trigonometric ratios (sin, cos, and tan, defined in terms of right-angled triangles) and their inverses, involving angles between 0° and 90° at integer values and in decimal form
InTROduCTIOnThe activities described below and the questions that follow allow you to deepen your understanding of concepts in trigonometry as well as solve problems using these concepts and their applications.
Activity 4.1It is claimed that the ancient Egyptians used a rope with twelve equally spaced beads on it to check if their right angles were correct. Tie twelve equally spaced beads onto a length of wool or cord as illustrated below and see if you can form a right angle the way they did in ancient times.
Are all of the following triangles right angled? Triangle A has sides of 3, 4 and 5. Triangle B has sides of 6, 8 and 10. Triangle C has sides of 9, 12 and 15.
Junior Cycle Mathemathics GEOMETRY And TRIGOnOMETRY
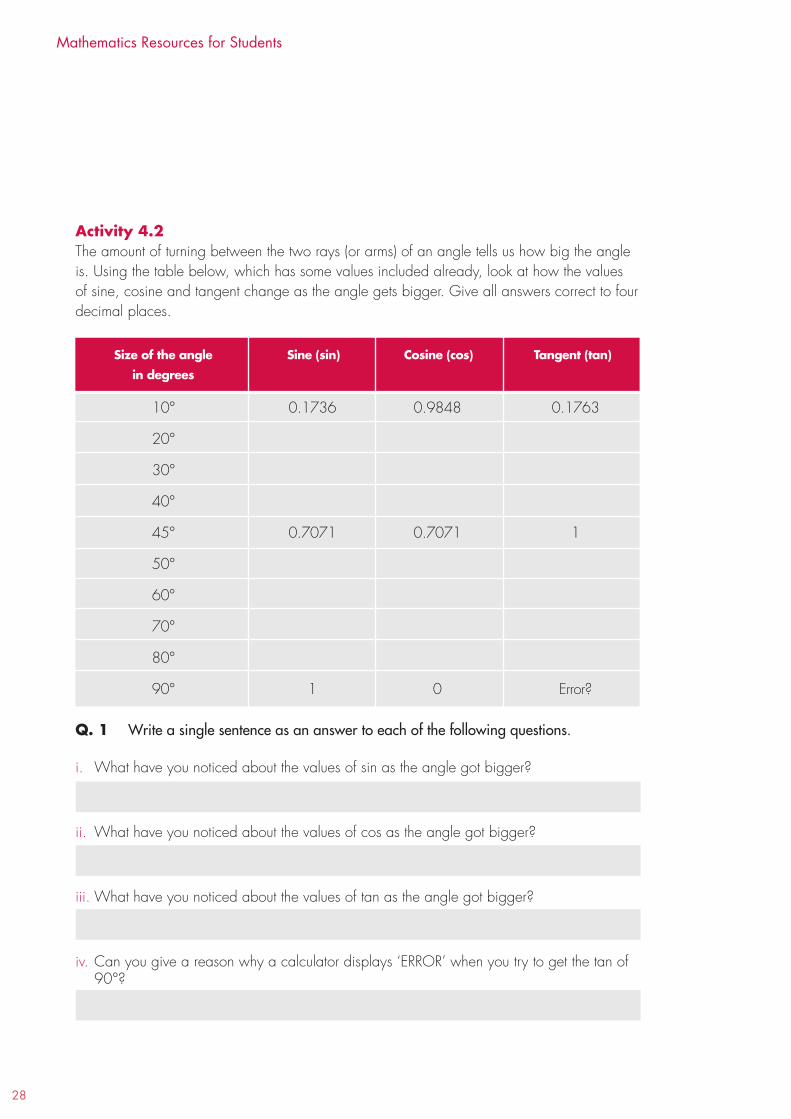
28
Mathematics Resources for Students
Activity 4.2The amount of turning between the two rays (or arms) of an angle tells us how big the angle is. Using the table below, which has some values included already, look at how the values of sine, cosine and tangent change as the angle gets bigger. Give all answers correct to four decimal places.
Q. 1 Write a single sentence as an answer to each of the following questions.
i. What have you noticed about the values of sin as the angle got bigger?
ii. What have you noticed about the values of cos as the angle got bigger?
iii. What have you noticed about the values of tan as the angle got bigger?
iv. Can you give a reason why a calculator displays ‘ERROR’ when you try to get the tan of90°?
10° 0.1736 0.9848 0.1763
20°
30°
40°
45° 0.7071 0.7071 1
50°
60°
70°
80°
90° 1 0 Error?
Size of the angle Sine (sin) Cosine (cos) Tangent (tan) in degrees
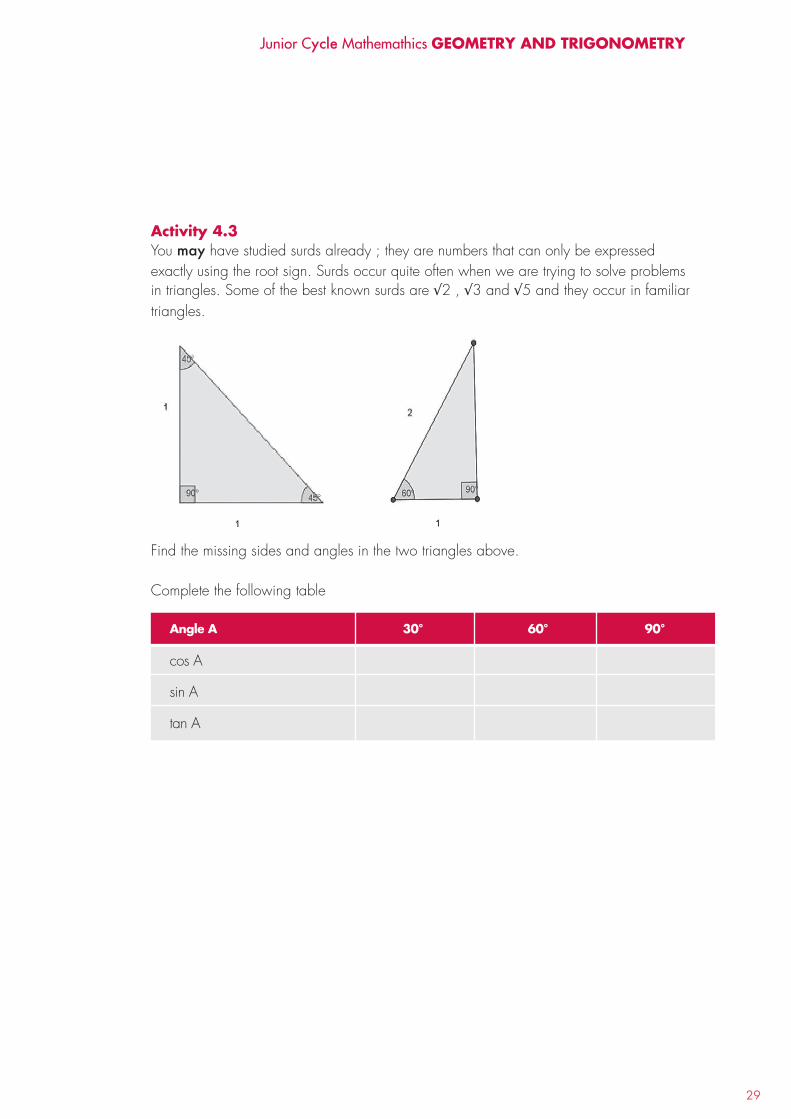
29
Activity 4.3You may have studied surds already ; they are numbers that can only be expressed exactly using the root sign. Surds occur quite often when we are trying to solve problems in triangles. Some of the best known surds are √2 , √3 and √5 and they occur in familiar triangles.
Find the missing sides and angles in the two triangles above.
Complete the following table
cos A
sin A
tan A
Angle A 30° 60° 90°
Junior Cycle Mathemathics GEOMETRY And TRIGOnOMETRY
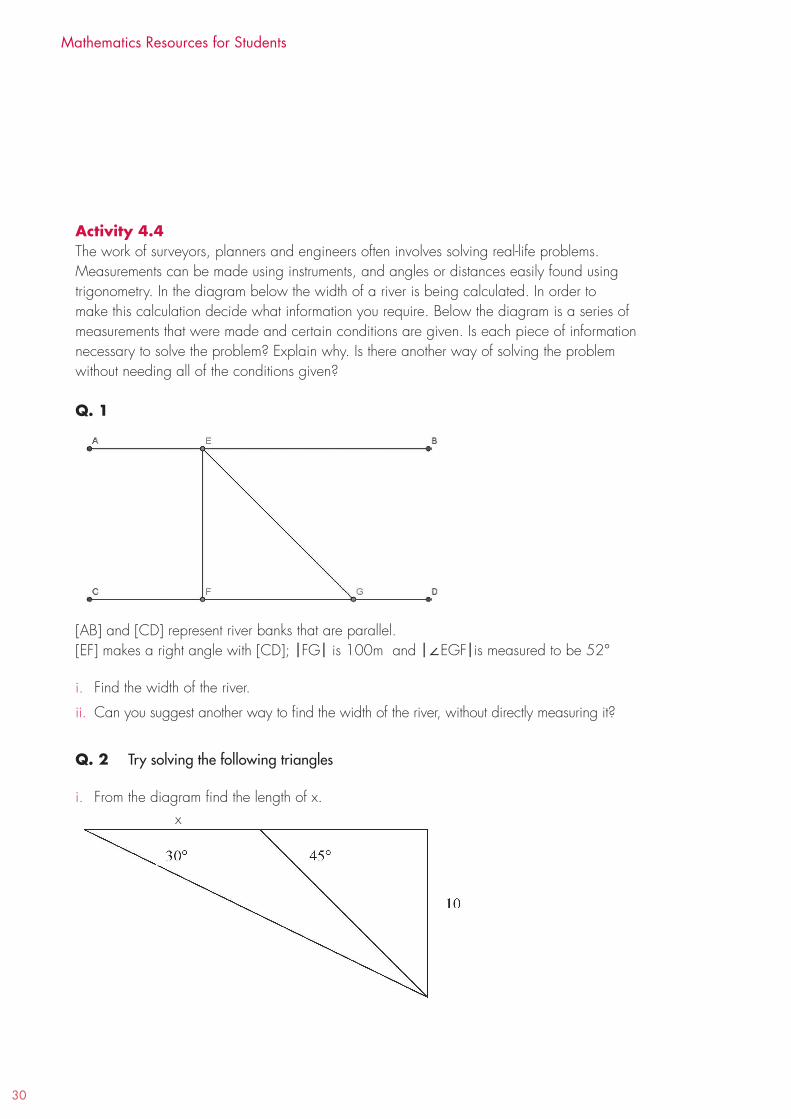
30
Mathematics Resources for Students
Activity 4.4The work of surveyors, planners and engineers often involves solving real-life problems. Measurements can be made using instruments, and angles or distances easily found using trigonometry. In the diagram below the width of a river is being calculated. In order to make this calculation decide what information you require. Below the diagram is a series of measurements that were made and certain conditions are given. Is each piece of information necessary to solve the problem? Explain why. Is there another way of solving the problem without needing all of the conditions given?
Q. 1
[AB] and [CD] represent river banks that are parallel.[EF] makes a right angle with [CD]; |FG| is 100m and |∠EGF|is measured to be 52°
i. Find the width of the river.
ii. Can you suggest another way to find the width of the river, without directly measuring it?
Q. 2 Try solving the following triangles
i. From the diagram find the length of x.x
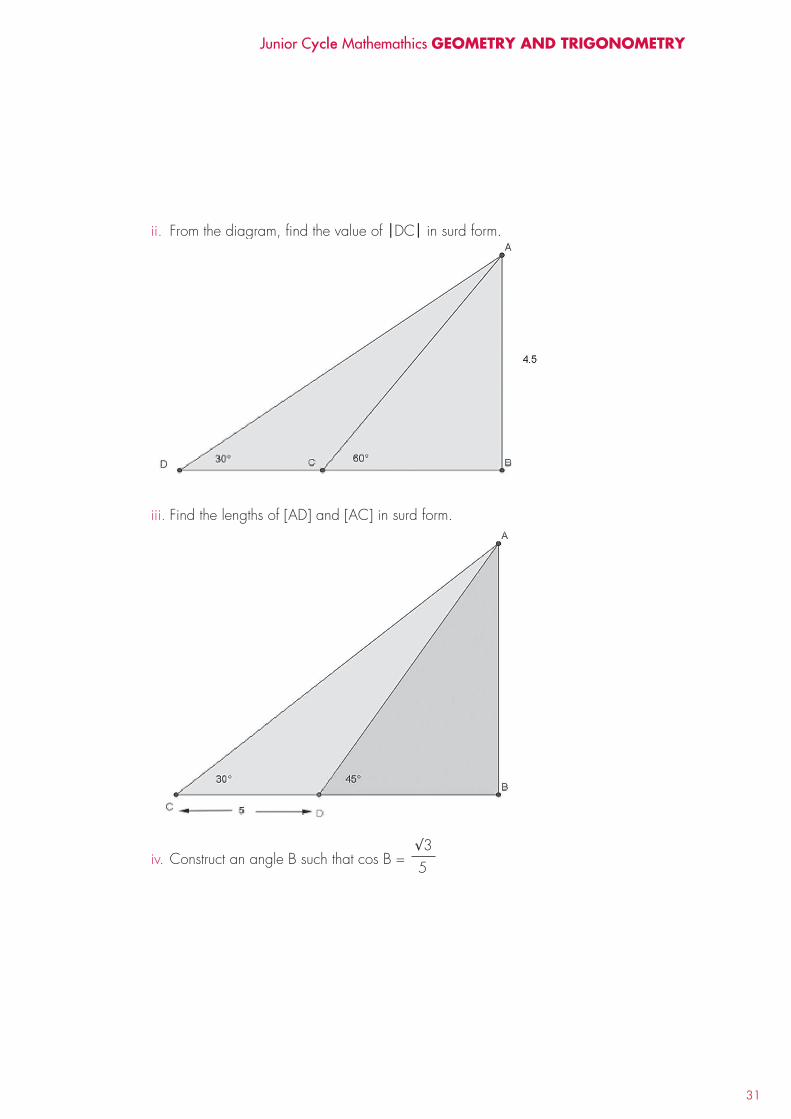
31
ii. From the diagram, find the value of |DC| in surd form.
iii. Find the lengths of [AD] and [AC] in surd form.
iv. Construct an angle B such that cos B =√35
Junior Cycle Mathemathics GEOMETRY And TRIGOnOMETRY
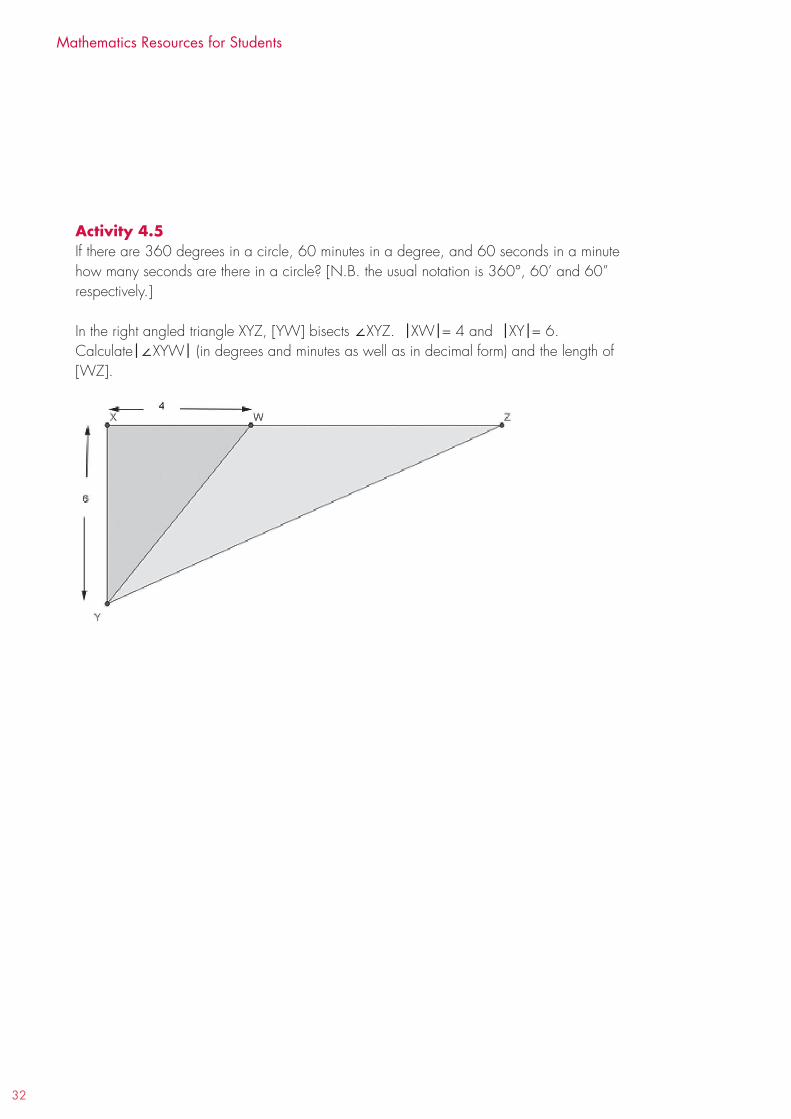
32
Mathematics Resources for Students
Activity 4.5If there are 360 degrees in a circle, 60 minutes in a degree, and 60 seconds in a minute how many seconds are there in a circle? [N.B. the usual notation is 360°, 60’ and 60” respectively.]
In the right angled triangle XYZ, [YW] bisects ∠XYZ. |XW|= 4 and |XY|= 6.Calculate|∠XYW| (in degrees and minutes as well as in decimal form) and the length of[WZ].