Embed Size (px)
Citation preview

Supporting the Academic Excellence, Engagement, and
College Readiness of High School ESOL Students Through
ESOL Student Service Learning Clubs
Office of Shared Accountability
November 2013
Nyambura Susan Maina, Ph.D., Trisha McGaughey, M.Ed.,
and Julie Wade, M.A.

OFFICE OF SHARED ACCOUNTABILITY
Mr. Geoffrey T. Sanderson, Associate Superintendent
850 Hungerford Drive
Rockville, Maryland 20850
301-279-3553
Dr. Joshua P. Starr Dr. Kimberly A. Statham Superintendent of Schools Deputy Superintendent of
Teaching, Learning,
and Programs

Montgomery County Public Schools Office of Shared Accountability
Program Evaluation i ESOL SSL Club
Table of Contents
List of Tables ................................................................................................................................. iii
List of Figures ..................................................................................................................................v
Executive Summary ...................................................................................................................... vii
Summary of Findings ................................................................................................................... viii
Evaluation Question 1 .............................................................................................................. viii
Evaluation Question 2 ..................................................................................................................x
Recommendations ..................................................................................................................... xii
Background ......................................................................................................................................1
Student Service Learning Program in MCPS ..............................................................................1
Goals of the ESOL SSL Program ................................................................................................2
MCPS Community Partnerships and ESOL SSL Club ...............................................................4
Methods of Intervention/Support .................................................................................................4
ESOL SSL Club Staff Characteristics .........................................................................................5
Review of Literature ........................................................................................................................5
Relationship Between Service Learning and Academic Achievement .......................................5
Review of MCPS Studies Related to the ESOL SSL Club ..........................................................6
Methods............................................................................................................................................6
Purpose of Study ..........................................................................................................................6
Evaluation Questions ...................................................................................................................6
Study Design ................................................................................................................................7
Study Sample ...............................................................................................................................7
Study Measures ............................................................................................................................7
Instruments and Data Sources ......................................................................................................8
Analysis Procedures .....................................................................................................................9
Results ............................................................................................................................................11
Demographic Characteristics of ESOL Students .......................................................................11
Description of Analytic Samples ...............................................................................................12
Evaluation Question 1 ................................................................................................................13
Summary of Findings Related to Evaluation Question 1 ..........................................................20
Evaluation Question 2 ................................................................................................................21
Summary of Findings Related to Evaluation Question 2 ..........................................................37
Discussion/Summary .....................................................................................................................37
Recommendations ......................................................................................................................38

Montgomery County Public Schools Office of Shared Accountability
Program Evaluation ii ESOL SSL Club
Strengths and Limitations Associated with the Design and Methods Used in the Study ..........39
Acknowledgements ........................................................................................................................40
References ......................................................................................................................................41
Appendix A Student Service Learning Implementation Plan .......................................................43
Appendix C Demographic Compositions of Students in the Six High Schools ...........................45
Appendix D Demographic Characteristics of ESOL Students in the Six High School SSL
Club ....................................................................................................................................46
Appendix E ESOL Student Service Learning Activities as Described by Schools .......................47
Appendix F Selected Verbatim Comments from Club Advisors Interviews .................................51

Montgomery County Public Schools Office of Shared Accountability
Program Evaluation iii ESOL SSL Club
List of Tables
Table 1 Demographic Characteristics of ESOL Students in Six High Schools with ESOL
SSL Clubs and ESOL Students in all MCPS High Schools ........................................... 12
Table 2 Demographic Characteristics of ESOL Students in Analytic Groups ............................ 13
Table 3 Adjusted Mean Number of SSL Hours Earned During School Year 2012–2013
by ESOL SSL Club Members and Non-Club Comparison Group ................................... 14
Table 4 Percentage of Students With Completed SSL Requirement by End of School
Year 2012–2013: ESOL SSL Club Members and Non-Club Comparison Group .......... 14
Table 5 Percentage of Days Attending School During School Year 2012–2013: ESOL
SSL Club Members and Non-Club Comparison Group ................................................... 15
Table 6 End-of-Year Grade Point Average (GPA): ESOL SSL Club Members and Non-
Club Comparison Group ................................................................................................... 16
Table 7 Percentage of Students Earning a C or Better in Semester 1 and 2 Mathematics
and Language Courses: ESOL SSL Club Members and Non-Club Comparison
Group ................................................................................................................................ 17
Table 8 Percentage of Students With Eligible Status in Fourth Marking Period of School
Year 2012–2013: ESOL SSL Club Members and Non-Club Comparison Group .......... 18
Table 9 Percentage of Students Promoted to the Next Grade Level at the End of School
Year 2012–2013: ESOL SSL Club Members and Non-Club Comparison Group .......... 18
Table 10 Percentage of Students Passing HSAs During School Year 2012–2013: ESOL
SSL Club Members and Non-Club Comparison Group ................................................... 19
Table 11 Estimated Marginal Mean Difference of Change from 2012 to 2013 and Effect
Size for ACCESS for ELL Scores .................................................................................... 20
Table 12 Description of Characteristics of Survey Respondents................................................. 21
Table 13 ESOL SSL Club Participants, Club Activities and SSL Hours Reported by
School ............................................................................................................................... 23
Table 14 How Students Heard about ESOL SSL Club for ESOL SSL Club and Non-club
Peers .................................................................................................................................. 24
Table 15 Number and Percent of Students Indicating Participation in School Sponsored
Activities ........................................................................................................................... 25
Table 16 Number and Percent Reporting When they First Decided to Go to College by
Grade ................................................................................................................................. 29
Table 17 Number and Percent Reporting Actions They Took to Prepare and Plan for
College .............................................................................................................................. 30
Table 18 Number and Percent of ESOL Students Reporting Frequency of Discussions
About College ................................................................................................................... 31

Montgomery County Public Schools Office of Shared Accountability
Program Evaluation iv ESOL SSL Club
Table 19 Number and Percent of ESOL Students Indicating Level of Agreement With
Statements about Plans After High School ....................................................................... 32
Table 20 Reasons for Joining the ESOL SSL Club as Reported by Survey Respondents .......... 32
Table 21 Number and Percent Indicating Ways They Benefited from Participating in the
ESOL SSL Club ................................................................................................................ 33
Table 22 What Students Liked About the ESOL SSL Club ........................................................ 34
Table 23 What Students Learned in ESOL SSL Club ................................................................. 34
Table 24 What Students Want to Add/Change About ESOL SSL Club ..................................... 35
Table C1 Demographic Composition of Students in the Six High Schools ................................ 45
Table D1 Demographic Characteristics of ESOL Students in the Six High School SSL
Club ................................................................................................................................... 46
Table E1 Description of ESOL SSL Club Activities Through Which Students Earned
SSL Hours by School ........................................................................................................ 47
Table E2 Number and Percent of Respondents Indicating When They First Decided to
Go to College .................................................................................................................... 50
Table E3 Actions Students Have Taken to Prepare and Plan for College by Grade ................... 50
Table F1 Verbatim Examples of Student Learning ..................................................................... 51
Table F2 Verbatim Examples of Relationship Building .............................................................. 51
Table F3 Verbatim Examples of Agencies and Individuals Who Contributed to Success
of ESOL SSL Club............................................................................................................ 52
Table F4 Suggestions for Enhancing the ESOL SSL Club.......................................................... 52

Montgomery County Public Schools Office of Shared Accountability
Program Evaluation v ESOL SSL Club
List of Figures
Figure 1. Academic, creative problem solving, and social emotional learning outcomes
addressed through the ESOL SSL Club. ............................................................................. 3
Figure 2. Top five countries last lived in before moving to United States as reported by
557 students responding to the ESOL SSL survey. .......................................................... 22
Figure 3. Primary language used at home as reported by 560 students responding to the
ESOL SSL survey. ............................................................................................................ 23
Figure 4. Responses of 601students on ESOL SSL survey to “How did you earn SSL
hours you have now?” ....................................................................................................... 26
Figure 5. Plans after high school graduation reported by 601 survey respondents. .................... 27
Figure 6. Most helpful sources of information for plans after graduation reported by 601
respondents, total and by club membership. ..................................................................... 28

Montgomery County Public Schools Office of Shared Accountability
Program Evaluation vi ESOL SSL Club
This page is intentionally left blank.

Montgomery County Public Schools Office of Shared Accountability
Program Evaluation vii ESOL SSL Club
Executive Summary
The purpose of this study was to examine the impact of the English for Speakers of Other
Languages (ESOL) Student Service Learning (SSL) Club on academic and non-academic
outcomes for students receiving ESOL services during 2012–2013 in six high schools in
Montgomery County Public Schools (MCPS). The ESOL SSL Club convenes regularly outside
the students’ instructional day. Four high schools partnered with Montgomery College—Takoma
Park/Silver Spring (MC–TP/SS): Montgomery Blair, Springbrook, John F. Kennedy, and
Northwood; one high school partnered with the City of Gaithersburg (Gaithersburg); and another
partnered with Rotary International (Watkins Mill). As part of the regular club meetings,
participating students were led by adult facilitators to identify needs in the community and
address them through service-learning opportunities. There were 346 students who participated
in ESOL SSL Clubs in 2012–2013. The objectives of the ESOL SSL Club are to—
increase the number of SSL hours earned toward the graduation requirement,
promote school attendance,
increase grade point average (GPA) and raise course grades,
increase passing rates on high school assessments (HSAs),
increase literacy skills,
increase engagement in community activities,
increase engagement in school activities, and
increase understanding of college and career expectations.
In order to estimate the impact of the ESOL SSL Club on specified academic and non-academic
outcomes, this study used a multi-method four-part data collection design. Student-level records
of club participation/engagement in community activities documented by club staff at each
school, club advisor interviews, ESOL student survey, and a variety of data from MCPS official
records were used to address the following two questions:
1. Did participation in the ESOL SSL Club contribute to a significant difference in:
a) the number of SSL hours earned toward graduation, b) the average attendance,
c) GPA and passing rates in identified courses, d) eligibility rates, e) grade-level
promotion, f) percentage of students passing HSAs, and g) literacy skills between
ESOL SSL Club participants and ESOL students who did not participate in the club?
2. Did participation in the ESOL SSL Club contribute to an increase in: a) level of
engagement in community activities, b) level of engagement in school activities, and
c) student understanding of college expectations?
To address the first evaluation question, multivariate analyses were used to compare academic
outcomes of students in the ESOL SSL Club (n = 346) with non-club peers (n = 346). To
address the second evaluation question, comparisons of survey responses for students in the club
and non-club peers were conducted to determine if there were any differences in college
expectations and in engagement in school and community activities between the two groups. In
each of the analyses related to outcomes, preexisting differences between the two groups of
students were controlled for through statistical procedures using propensity scores and use of
covariates.
Montgomery County Public Schools Office of Shared Accountability
Program Evaluation viii ESOL SSL Club
Summary of Findings
Evaluation Question 1. Did participation in the ESOL SSL Club contribute to a significant
difference in: a) the number of SSL hours earned toward graduation, b) the average attendance,
c) GPA and passing rates in identified courses, d) eligibility rates, e) grade-level promotion, f)
percentage of students passing HSAs, and g) literacy skills between ESOL SSL Club participants
and ESOL students who did not participate in the club?
Only results that provided evidence of statistically significant differences between club and non-
club peers on academic and non-academic outcomes during school year 2012–2013 are presented
in this summary.
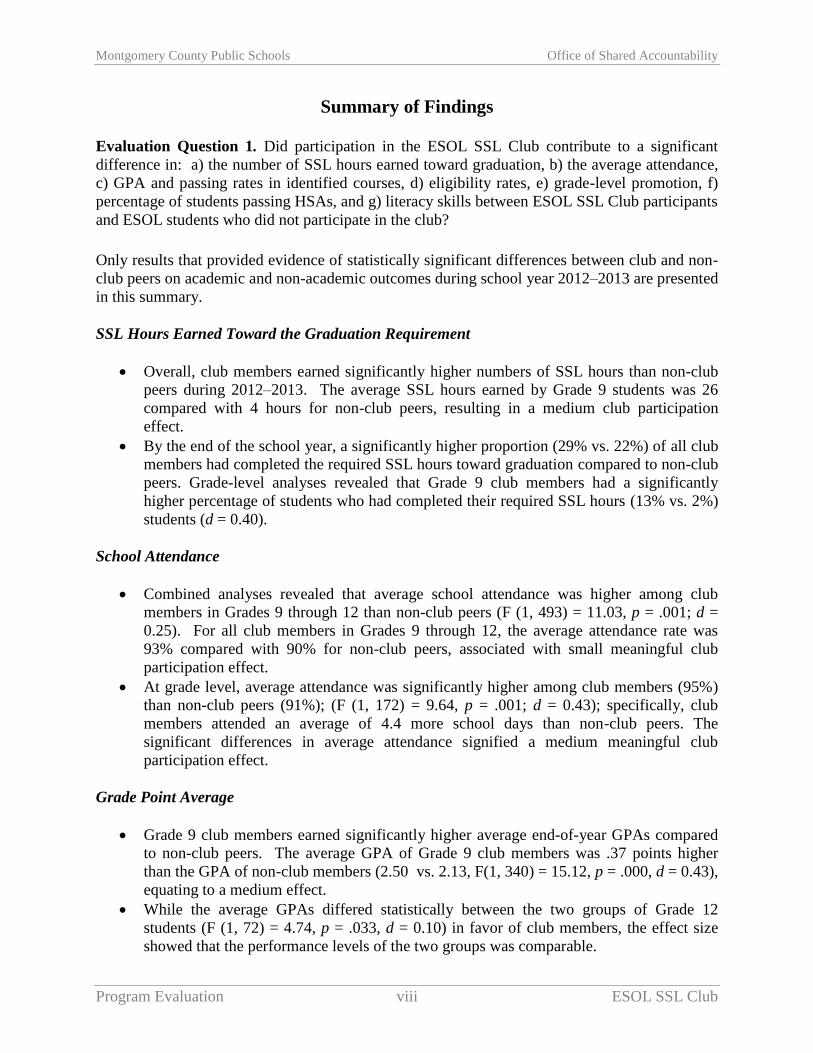
SSL Hours Earned Toward the Graduation Requirement
Overall, club members earned significantly higher numbers of SSL hours than non-club
peers during 2012–2013. The average SSL hours earned by Grade 9 students was 26
compared with 4 hours for non-club peers, resulting in a medium club participation
effect.
By the end of the school year, a significantly higher proportion (29% vs. 22%) of all club
members had completed the required SSL hours toward graduation compared to non-club
peers. Grade-level analyses revealed that Grade 9 club members had a significantly
higher percentage of students who had completed their required SSL hours (13% vs. 2%)
students (d = 0.40).
School Attendance
Combined analyses revealed that average school attendance was higher among club
members in Grades 9 through 12 than non-club peers (F (1, 493) = 11.03, p = .001; d =
0.25). For all club members in Grades 9 through 12, the average attendance rate was
93% compared with 90% for non-club peers, associated with small meaningful club
participation effect.
At grade level, average attendance was significantly higher among club members (95%)
than non-club peers (91%); (F (1, 172) = 9.64, p = .001; d = 0.43); specifically, club
members attended an average of 4.4 more school days than non-club peers. The
significant differences in average attendance signified a medium meaningful club
participation effect.
Grade Point Average
Grade 9 club members earned significantly higher average end-of-year GPAs compared
to non-club peers. The average GPA of Grade 9 club members was .37 points higher
than the GPA of non-club members (2.50 vs. 2.13, F(1, 340) = 15.12, p = .000, d = 0.43),
equating to a medium effect.
While the average GPAs differed statistically between the two groups of Grade 12
students (F (1, 72) = 4.74, p = .033, d = 0.10) in favor of club members, the effect size
showed that the performance levels of the two groups was comparable.

Montgomery County Public Schools Office of Shared Accountability
Program Evaluation ix ESOL SSL Club
Performance on Mathematics and Reading Courses Taken in 2012–2013
Grade-level analyses of report card grades revealed that a significantly higher proportion
of Grade 9 club members earned a C or better in each of the mathematics and language
courses taken in 2012–2013 compared to their non-club peers. Specifically:
o The proportions of Grade 9 students who earned a C or better in semester 1 (76% vs.
52%; d = 0.64) and semester 2 (75% vs. 57%; d = 0.45) mathematics courses was
significantly higher among club members than non-club peers. The effect sizes
associated with these differences showed medium to large educationally meaningful
club participation effect associated with earning a C or better in mathematics courses.
o The proportions of Grade 9 students who earned a C or higher in semester 1 (81% vs.
70%; d = 0.35) or semester 2 (78%% vs. 63%; d = 0.40) language courses was
significantly higher among club members than non-club peers. The effect sizes
associated with these differences showed small educationally meaningful club
participation effect associated with earning a C or better in language courses.
A significantly higher proportion of Grade 12 club members earned a C or better in
semester 1 language courses (83% vs. 59%; d = 0.70) taken in 2012–2013 than non-club
peers, signifying a large meaningful club participation effect associated with earning a C
or better in the language course.
Academic Eligibility
Club participation was associated with significantly higher rates of academic eligibility in
Grade 9, contributing to educationally meaningful impact. Grade 9 club members (72%
vs. 60%; d = 0.31) were more likely to earn a GPA higher than 2.0, making them
academically “eligible” for the fourth marking period compared to non-club member
peers.
Grade Advancement/Promotion/Record of Continued Education
The proportion of Grade 9 students who were promoted to the next grade level was
significantly higher among club members than non-club peers (75% vs. 65%, d = 0.29),
signifying a small practically meaningful club participation effect on promotion rates.
Promotion was determined by whether or not the student had earned the required number
of credits to be ready for the next grade.
HSA Taken During the 2012–2013 School Year
Higher percentages of club members passed each of the HSAs compared with non-club
peers during school year 2012–2013. However, the differences in HSA passing rates were
not statistically significant.

Montgomery County Public Schools Office of Shared Accountability
Program Evaluation x ESOL SSL Club
Literacy Skills
Participation in the club was positively associated with development of English language
skills, particularly in areas that involved communicating through listening, speaking, and
oral language in general. The analyses revealed that club members made significantly
higher average gains in composite Assessing Comprehension and Communication in
English State to State for English Language Learners (ACCESS for ELL) scores and in
the domains of listening, speaking, and oral language from spring 2012 to spring 2013.
The standardized effect sizes ranged from 0.27 to 0.40, signifying meaningful gains in
literacy skills in the composite score and listening, speaking, and oral language domains
for club members.
Evaluation Question 2. Did participation in the ESOL SSL Club contribute to an increase in:
a) level of engagement in community activities, b) level of engagement in school activities, and
c) student understanding of college expectations?
Overall, findings from student survey, student records of club participation, and club advisors
interviews suggested that the ESOL SSL Club helped the students: a) connect to the community,
b) expand on their skills and knowledge, and c) explore career and college options by increasing
their understanding of expectations and preparation needed for college or career.
Connection to Community
Developing relationships. The club provided a setting for a variety of relationships to
develop: MCPS and community partnerships, positive staff-to-student interaction, student-to-
student relationships, and student-to-community relationships through service projects. These
interactions and relationships increased the ESOL students’ level of engagement in school-
sponsored activities, increased their confidence to interact with others, made students feel
they were valuable contributors in the community, and increased students’ understanding of
the American culture.
Participation in community-based activities. Evidence of how the club increased student
engagement in community activities was summarized from analyses of student survey
responses, club advisor records and interviews, as well records of SSL hours earned during
the school year.
o The number of activities recorded per student varied by school and ranged from 9 to 33
activities. Across all schools, the average number of recorded community activities per
club member ranged from 4 to 9.
o Several sources of evidence indicated that participation in the ESOL SSL Club
contributed to increased engagement in community and school activities. Club members
reported that the club helped them earn more SSL hour (93%) and they enjoyed attending
the club activities (91%). These findings were consistent with the analysis of SSL hours
earned by club members and non-club peers, which found that club members earned
more hours during the 2012–2013 school year.
Montgomery County Public Schools Office of Shared Accountability
Program Evaluation xi ESOL SSL Club
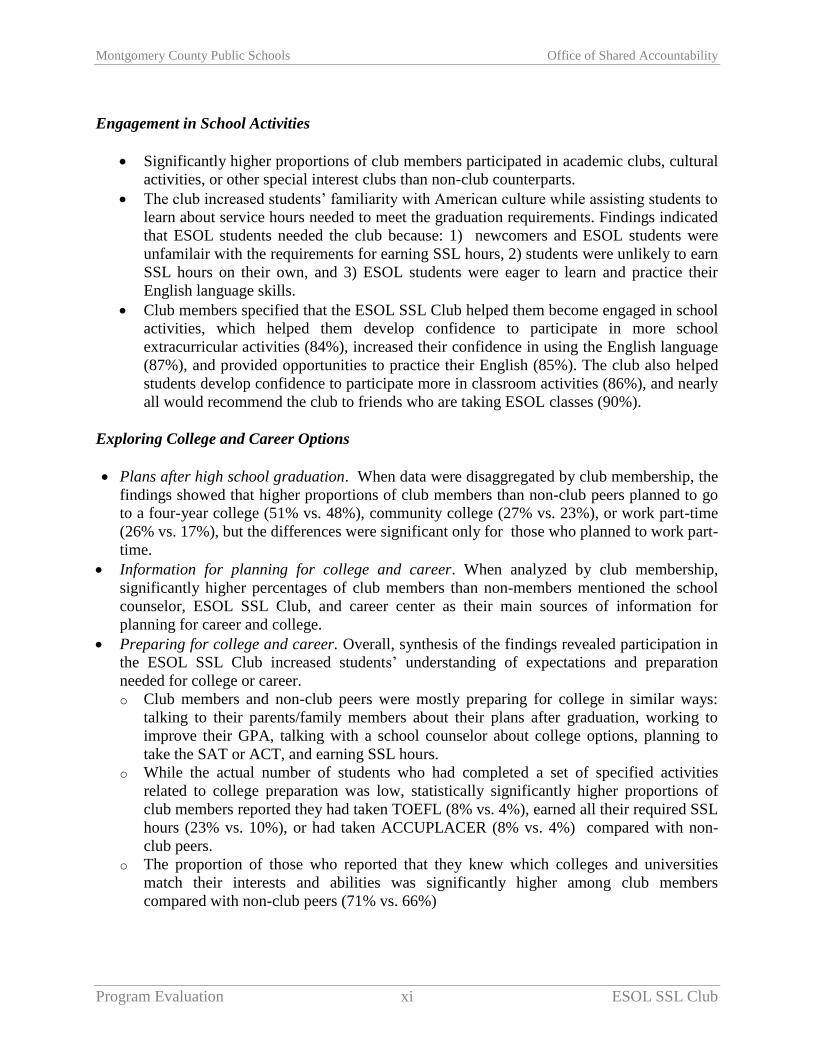
Engagement in School Activities
Significantly higher proportions of club members participated in academic clubs, cultural
activities, or other special interest clubs than non-club counterparts.
The club increased students’ familiarity with American culture while assisting students to
learn about service hours needed to meet the graduation requirements. Findings indicated
that ESOL students needed the club because: 1) newcomers and ESOL students were
unfamilair with the requirements for earning SSL hours, 2) students were unlikely to earn
SSL hours on their own, and 3) ESOL students were eager to learn and practice their
English language skills.
Club members specified that the ESOL SSL Club helped them become engaged in school
activities, which helped them develop confidence to participate in more school
extracurricular activities (84%), increased their confidence in using the English language
(87%), and provided opportunities to practice their English (85%). The club also helped
students develop confidence to participate more in classroom activities (86%), and nearly
all would recommend the club to friends who are taking ESOL classes (90%).
Exploring College and Career Options
Plans after high school graduation. When data were disaggregated by club membership, the
findings showed that higher proportions of club members than non-club peers planned to go
to a four-year college (51% vs. 48%), community college (27% vs. 23%), or work part-time
(26% vs. 17%), but the differences were significant only for those who planned to work part-
time.
Information for planning for college and career. When analyzed by club membership,
significantly higher percentages of club members than non-members mentioned the school
counselor, ESOL SSL Club, and career center as their main sources of information for
planning for career and college.
Preparing for college and career. Overall, synthesis of the findings revealed participation in
the ESOL SSL Club increased students’ understanding of expectations and preparation
needed for college or career.
o Club members and non-club peers were mostly preparing for college in similar ways:
talking to their parents/family members about their plans after graduation, working to
improve their GPA, talking with a school counselor about college options, planning to
take the SAT or ACT, and earning SSL hours.
o While the actual number of students who had completed a set of specified activities
related to college preparation was low, statistically significantly higher proportions of
club members reported they had taken TOEFL (8% vs. 4%), earned all their required SSL
hours (23% vs. 10%), or had taken ACCUPLACER (8% vs. 4%) compared with non-
club peers.
o The proportion of those who reported that they knew which colleges and universities
match their interests and abilities was significantly higher among club members
compared with non-club peers (71% vs. 66%)
Montgomery County Public Schools Office of Shared Accountability
Program Evaluation xii ESOL SSL Club
Overview Knowledge/Understanding About Expectations for College
The club helped members understand the college application process, gain the skills needed
for completing a college application, and to a lesser extent completing financial aid forms.
More than 70% of the club members reported: a) they knew what academic and career
interest to pursue in college; 2) staff at their school helped them understand college
requirements; 3) they knew the type of college they would apply to; and 4) they understood
how to find information on colleges.
Compared with non-club peers, club members were more likely to agree that they knew
which colleges and universities matched their interest and abilities. In addition, a higher
proportion of club members than non-club members indicated that a staff member helped
them identify colleges that matched their interests and abilities.
Only one third of club members and non-members, alike, agreed that they understood how to
complete a financial aid application.
Recommendations
The following recommendations are based on the findings from the study:
Continue to use the ESOL SSL Club to provide meaningful learning opportunities through
which students with limited English skills can apply their skills and knowledge to real-world
issues and problems and earn required SSL hours.
Continue to support a career and college bound culture for newcomers to the country by
highlighting the most critical aspects of being career and college ready—
o making strong course selections connected to college and career aspirations,
o developing a strong high school transcript,
o taking timely college preparation tests (e.g., SAT/ACT),
o completing SSL requirements,
o visiting and selecting colleges,
o applying for admissions, financial aid, and
o seeking scholarships.
Support students with resources to increase their familiarity with multiple opportunities
available to them after high school graduation and to help them navigate applications for
college admission, financial aid, and scholarships.
Increase activities that enhance the development of English language skills and participation
in school and community activities.
Continue to assist with documentation of their SSL hours and student reflection for ESOL
students who are still learning English.
Consider inviting guest speakers (e.g., recent alumni, college admissions officers) to build
student understanding of college life and the academic expectations of colleges, including
choosing the right college that matches student abilities and interest.
Increase outreach to ESOL students not involved in the ESOL SSL Club.
Share best practices for creating and sustaining MCPS/community partnerships that support
ESOL SSL Clubs among the high schools.
Examine reasons for limited impact of the SSL club on academic outcomes for Grade 10 and
Grade 11 students.

Montgomery County Public Schools Office of Shared Accountability
Program Evaluation xiii ESOL SSL Club
This page is intentionally left blank.

Montgomery County Public Schools Office of Shared Accountability
Program Evaluation 1 ESOL SSL Club
Supporting the Academic Excellence, Engagement, and College Readiness of
High School ESOL Students Through ESOL Student Serving Learning Clubs
Nyambura Susan Maina, Ph.D. & Trisha A. McGaughey, M.Ed., & Julie Wade, M.A.
The Office of Shared Accountability (OSA) conducted an outcome study to examine the impact
of the Student Service Learning (SSL) Club on academic and non-academic outcomes for
participating English for Speakers of Other Languages (ESOL) students in six Montgomery
County Public Schools (MCPS) high schools. This study was requested by the Department of
Enriched and Innovative Programs, Office of Curriculum and Instructional Programs.
It is a Maryland State Department of Education (MSDE) graduation requirement that students
complete 75 SSL hours. Students begin working on this MSDE graduation requirement after
completing Grade 5. Accumulated SSL hours are reflected quarterly on student report cards. The
required 75 hours is prorated based on the grade of first-time enrollment in MCPS (Appendix A).
The graduation requirement is intended to result in students becoming life-long contributors to
the community.
Background
Student Service Learning Program in MCPS
SSL is designed to address recognized community needs and is connected to curriculum goals
(MSDE, 2013). Preparation, action, and reflection are the three phases of service learning that
distinguish SSL from traditional volunteering and community service. All service learning in the
areas of indirect service, direct service, and advocacy include phases of preparation, action, and
reflection. As such, quality service learning provides the student with knowledge, skills,
attitudes, and career exploration opportunities that lead to effective citizenship in an increasingly
diverse and interconnected world. A summary of SSL best practices is shown in Appendix B.
MCPS has identified three major ways that students can meet their SSL requirements
(MCPS, 2013a). SSL hours can be earned through one or a combination of the following:
1. School Courses. Full participation in the SSL aspects and successful completion of
specific middle school and high school courses during the instructional day (e.g., Grade 6
science; Grade 7 English; and Grade 8 social studies; National, State and Local
Government; and specific high school electives identified in the MCPS Course Bulletin).
2. School Clubs. Membership and full participation in service activities promoted by
school-sponsored clubs and organizations outside of the instructional day.
3. Community Organizations and Opportunities. Full participation in opportunities and
organizations preapproved by MCPS for SSL outside of the instructional day.
Montgomery County Public Schools Office of Shared Accountability
Program Evaluation 2 ESOL SSL Club
Goals of the ESOL SSL Program
The overall goal of SSL in MCPS is to promote a behavior of lifelong service to the community
by providing the student with knowledge, skills, attitudes, and career exploration opportunities
that lead to effective citizenship in an increasingly diverse and interconnected world (MCPS,
2013b). By addressing recognized needs in the community through SSL, students are
encouraged to—
explore careers,
expand skills and knowledge,
strengthen character,
develop responsibility,
achieve curricular objectives,
connect to community organizations, and
reflect throughout the experiences.
ESOL SSL Club as Targeted Support. The ESOL SSL Club is a targeted response to needs of
ESOL students to enable them to earn SSL hours, graduate on time, and be college and career
ready. Many MCPS students meet the SSL graduation requirement ‘on their own.’ Such
students are familiar with the local community and are able to find opportunities to serve through
the MCPS SSL database, with parental assistance, sibling advice, using family connections, and
other means. While the goal for ESOL students is to meet the SSL requirement in meaningful
ways, ESOL students often experience difficulty completing SSL requirements for a variety of
reasons (Fink, 2011). ESOL students may need to earn all their service hours in high school
because it is difficult for recent immigrants to provide evidence of service learning hours they
may have earned prior to entering MCPS. Some ESOL students who complete middle school in
MCPS are often not at the academic level to be enrolled in the middle school courses in which
they can earn up to 30 SSL hours, because at every grade level, the academic performance of
students who are learning English lags behind that of non-ESOL peers in all academic areas
(MCPS, 2013c). In addition, some students may not be aware of the necessity of earning SSL
hours as a requirement for graduation from high school.
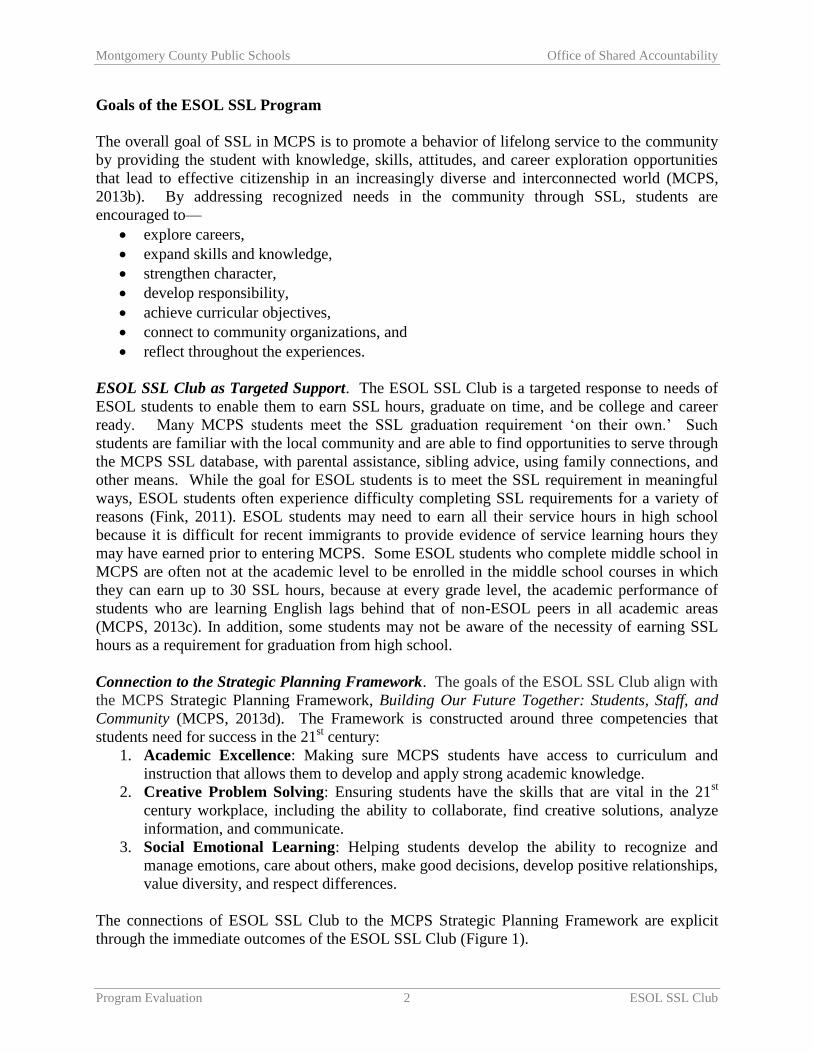
Connection to the Strategic Planning Framework. The goals of the ESOL SSL Club align with
the MCPS Strategic Planning Framework, Building Our Future Together: Students, Staff, and
Community (MCPS, 2013d). The Framework is constructed around three competencies that
students need for success in the 21st century:
1. Academic Excellence: Making sure MCPS students have access to curriculum and
instruction that allows them to develop and apply strong academic knowledge.
2. Creative Problem Solving: Ensuring students have the skills that are vital in the 21st
century workplace, including the ability to collaborate, find creative solutions, analyze
information, and communicate.
3. Social Emotional Learning: Helping students develop the ability to recognize and
manage emotions, care about others, make good decisions, develop positive relationships,
value diversity, and respect differences.
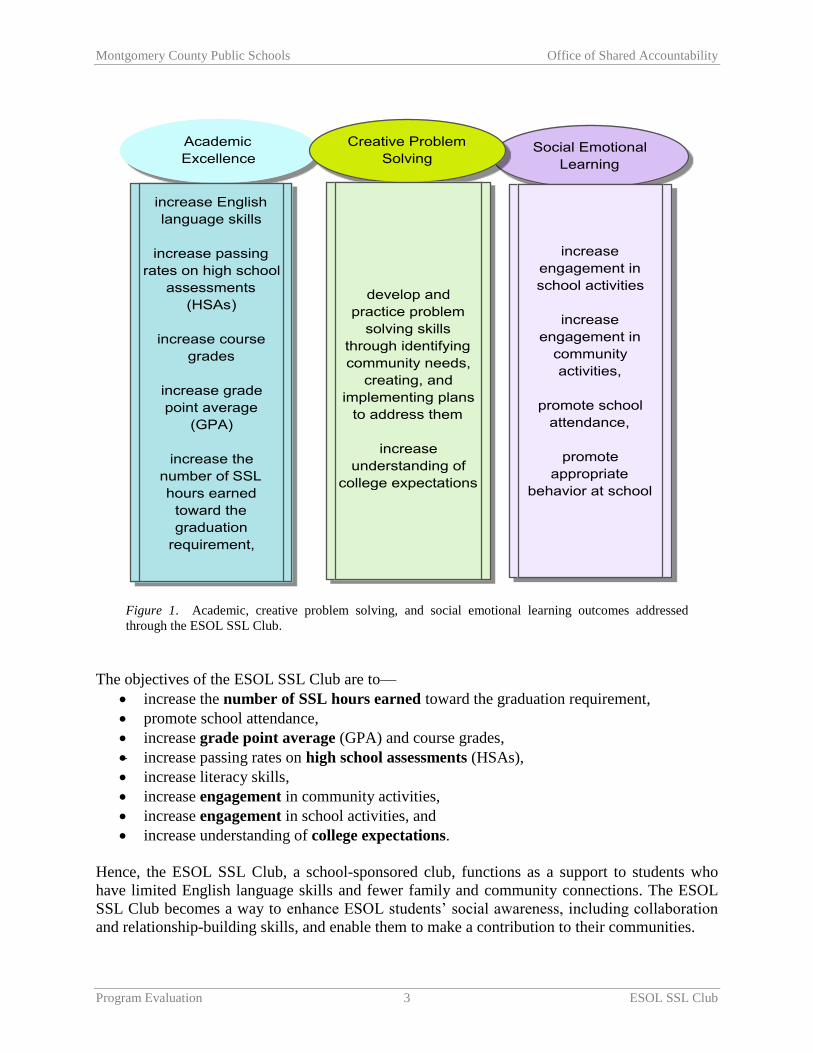
The connections of ESOL SSL Club to the MCPS Strategic Planning Framework are explicit
through the immediate outcomes of the ESOL SSL Club (Figure 1).
Montgomery County Public Schools Office of Shared Accountability
Program Evaluation 3 ESOL SSL Club
Figure 1. Academic, creative problem solving, and social emotional learning outcomes addressed
through the ESOL SSL Club.
The objectives of the ESOL SSL Club are to—
increase the number of SSL hours earned toward the graduation requirement,
promote school attendance,
increase grade point average (GPA) and course grades,
increase passing rates on high school assessments (HSAs),
increase literacy skills,
increase engagement in community activities,
increase engagement in school activities, and
increase understanding of college expectations.
Hence, the ESOL SSL Club, a school-sponsored club, functions as a support to students who
have limited English language skills and fewer family and community connections. The ESOL
SSL Club becomes a way to enhance ESOL students’ social awareness, including collaboration
and relationship-building skills, and enable them to make a contribution to their communities.

Montgomery County Public Schools Office of Shared Accountability
Program Evaluation 4 ESOL SSL Club
With full participation in the ESOL SSL Club at their high school, students are expected to make
progress toward achieving districtwide milestones to measure student progress corresponding to
the following indicators:
Record of progress toward meeting the service learning graduation requirement
Reports cards documenting academic grades of C or higher
Attendance records documenting 80% or better average daily attendance
School records of continued education (promotion to next grade level)
GPA of 2.0 and higher
Fundamental knowledge regarding postsecondary education (application, resume, course
options, etc.)
MCPS Community Partnerships and ESOL SSL Club
Through MCPS collaboration with the Maryland Campus Compact Volunteers in Service to
America,1 a volunteer was identified to engage ESOL youth in participating in service learning
projects, monitor the program and student progress, and assess the student learning and
community impact. The ESOL SSL Club was implemented in collaboration with Montgomery
College—Takoma Park/Silver Spring (MC–TP/SS). Montgomery Blair High School (Blair) has
participated in the MC–TP/MCPS program for the past four years. During 2012–2013, students
from three additional high schools (Springbrook, John F. Kennedy [Kennedy], and Northwood)
participated in the MC–TP/MCPS coordinated ESOL SSL Club (Appendix C). The activities of
the ESOL SSL Club were co-developed and coordinated by the MC-TP/MCPS implementation
team to support education completion, career preparation, civic engagement, and life-long
learning.
Two additional high schools, Gaithersburg and Watkins Mill, provided ESOL SSL Clubs that
worked with community partners in 2012–2013. Gaithersburg High School’s partners were the
Audubon Naturalist Society (ANS) and the City of Gaithersburg. The City of Gaithersburg
provided support to Gaithersburg High School’s ESOL SSL Club throughout the year through
Maura Dinwiddle in partnership with the City of Gaithersburg Student Union. Watkins Mill High
School partnered with the Rotary Club International.
Methods of Intervention/Support
The ESOL SSL Club convened regularly at each of the six high schools collaborating with
MC-TP/SS, the City of Gaithersburg, and Rotary Club International outside of the students’
instructional day. As part of the regular club meetings, participating students, led by adult
facilitators, identified needs in the community to be addressed through service-learning
opportunities. In addition, some club meetings focused on college and career planning, including
providing guidance and support for students’ preparation of applications, resumes, and college
information gathering.
1AmeriCorps VISTA is the national service program designed specifically to fight poverty.
See http://www.compact.org/initiatives/americorpsvista-program/vista-faqs/ for more information.
Montgomery County Public Schools Office of Shared Accountability
Program Evaluation 5 ESOL SSL Club
ESOL SSL Club Staff Characteristics
Each participating high school ESOL SSL Club had support and supervision at regular club
meetings and weekend SSL activities provided by the following team of adults:
One SSL ESOL advisor identified by the high school principal
One staff member familiar with ESOL and SSL from the MC–TP/SS campus or the
partnering organizations
One ESOL resource teacher provided by the MCPS ESOL Office
One or two Phi Theta Kappa Honor society students from MC–TP/SS
One ESOL counselor
Review of Literature
Relationship Between Service Learning and Academic Achievement
Nature of service learning opportunities matters. Students who come to the United States from
other countries come with varied educational experiences. As such, there are a variety of school
programs designed to assist students who are recent arrivals to the United States and have limited
English proficiency (Boyson & Short, 2003; Medina, 2009; Schultz & Vanna, 2008). Though
working with university students, Baldwin, Buchanan, & Rudisill (2007), found “considerable
agreement in the academic community that service learning is a multi-tiered pedagogy that can
be implemented at any level of education, preschool through graduate school” (p. 316). Service
learning can take place in many forms and locations. Students may experience it in their school
or through their community. Research suggests that service learning serves students best when
tied to classroom activities and student reflection on their service experiences (Pinzon & Barriga,
2006). A recent report by the Latino Youth Collaborative Steering Committee (LYCSC)
recommended that service learning should include a variety of opportunities for youth of various
ages in order to allow older youth who might need to care for younger siblings the chance to
connect with positive after-school activities prior to reaching the graduation point (LYCSC,
Montgomery County, 2010).
Participation in SSL and academic gains. Literature suggests that service learning may be used
to increase and retain academic skills in mathematics, writing, reading, social studies, science,
and language (Pearson, 2002). The high school/transition programs that have been studied
showed increased high school graduation, more high school credits earned, higher GPAs earned,
and increased enrollment in higher-level courses (James, Jurich, & Estes, 2001). The programs
discussed in these articles were similar to the ESOL SSL Club; they did not use a single
intervention but a combination of strategies to improve student performance such as community
involvement and extended learning.
Benefit from information about college. In general, immigrant students have unique needs for
information and assistance with access to higher education. A study in Texas by the American
Youth Policy Forum (AYPF) reported that many immigrant students and their families are
unaware of postsecondary opportunities (2009). The belief that postsecondary education is not a
feasible option for them leads students to disengage from school and drop out. The report also
Montgomery County Public Schools Office of Shared Accountability
Program Evaluation 6 ESOL SSL Club
concluded that English language learners (ELLs), along with all students, benefit from well-
coordinated partnerships between various agencies and institutions providing youth services
(AYPF, 2009). Researchers identified ELLs among youth who have the hardest time overcoming
labor market barriers, and who are most likely to join the growing ranks of disconnected youths
(Hooker & Brand, 2009). Beyond the challenges of gaining both linguistic and academic
proficiency, many secondary-level ELLs face particular barriers to college- and career-readiness.
They are more likely to be first generation college-going students, as only 22% of ELLs have at
least one parent with a postsecondary degree, compared with 44% of non-ELL youths. As such,
they are less likely to have role models in their communities who have attended college; even
families who have higher levels of education in their native countries may lack important
information about postsecondary options and the college application process in the United States.
Any program or policy that takes a long-term approach to ELL success must ensure that ELL
youths receive extra assistance in learning about the college application, selection, and goal-
setting processes, in order to build their “college knowledge.”
Review of MCPS Studies Related to the ESOL SSL Club
OSA previously reported on a comparison of outcomes for students participating in the ESOL
SSL Club at Blair with ESOL students not participating in the program (Fink, 2011). Compared
to their peers without ESOL SSL Club experiences, ESOL SSL Club participants had 1) higher
GPAs, 2) higher proficiency on four HSAs, 3) higher attendance rates, 4) lower suspension rates,
5) lower likelihood of withdrawing from school, and 6) higher percentage of SSL hours. Based
on the study, a rigorous research study to examine the impact of the ESOL SSL Club on
academic and affective outcomes of the participants was recommended.
Methods
Purpose of Study
The purpose of this study was to examine the impact of the ESOL SSL Club on academic and
nonacademic outcomes of participating ESOL students during school year 2012–2013 in six high
schools.
Evaluation Questions
This study was guided by the following evaluation questions:
1. Did participation in the ESOL SSL Club contribute to a significant difference in: a)
the number of student service learning hours earned toward graduation, b) average
attendance, c) passing rates in identified courses, d) eligibility rates, e) grade-level
promotion, f) percentage of students passing HSAs, and g) literacy skills between
ESOL SSL Club participants and ESOL students who did not participate in the club?
2. Did participation in the ESOL SSL Club contribute to an increase in: a) level of
engagement in community activities, b) level of engagement in school activities, and
c) student understanding of college expectations?

Montgomery County Public Schools Office of Shared Accountability
Program Evaluation 7 ESOL SSL Club
Study Design
A nonequivalent comparison-group design was applied to assess the impact of the club on
student outcomes (Bordens & Abbott, 2008; Fraenkel & Wallen, 2009; Perrin, 2009; Shadish,
Cook, & Campbell, 2002). Nonequivalent comparison-group design contains a treatment group
(i.e., ESOL SSL Club participants) and a nonequivalent untreated comparison group (i.e., non-
ESOL SSL Club members). The groups are “nonequivalent” because there is no random
assignment of students to the club.
A multi-method, four-part data collection design was implemented; data collection strategies
included: records of student participation/engagement in community activities documented by
the ESOL SSL Club staff at each school, interviews with club advisors, surveys of ESOL
students, and outcome data compiled from MCPS databases. All ESOL students at the six high
schools were presented with the opportunity to participate in the ESOL SSL Club. Participation
in the club was voluntary.
Study Sample
The study sample was comprised of students currently enrolled in ESOL programs at six
participating high schools.
Treatment group. The treatment group was ESOL students participating in the ESOL
SSL Club during school year 2012–2013.
Comparison group. The comparison group was a sample of ESOL students not
participating in the ESOL SSL Club, matched using propensity scores that were
computed based on demographic characteristics and grade level. The comparison group
was equal in number to the sample of ESOL SSL Club members.
Study Measures
The following indicators were examined in this study:
1. Progress toward SSL hours. Number of service learning hours earned during school year
2012–2013 for ESOL students in the two study groups (SSL Club and comparison
group).
2. School attendance rates. The average student attendance rates (percentage of days
attended during 2012–2013) for the two groups.
3. Literacy skills. ACCESS for ELLs2 overall composite and domain scores were used to
measure change in literacy skills. Scale scores provide a psychometrically derived score
(accounting for all tier and grade level differences) for each language domain. Scores are
reflected on a scale of 100–600 (World Class Instructional Design and Assessment
[WIDA], 2013).
4. HSA passing rates. Attaining a passing score on each HSA test taken: English, Algebra I,
Biology, and Government.
2 Assessing Comprehension and Communication in English State-to-State for English Language Learners. This is
the new English proficiency test for Maryland.
Montgomery County Public Schools Office of Shared Accountability
Program Evaluation 8 ESOL SSL Club
5. Report card grades. Attaining C or better on final grades in mathematics and
English/reading courses taken.
6. End-of-year GPA. Cumulative GPA at end of school year 2012–2013.
7. Academic eligibility. Maintaining a marking period GPA of 2.0 or higher.
8. Evidence of continued education. Promotion to the next grade level, as determined by
whether or not the student had earned the required number of credits to qualify for the
next grade.
9. Level of student engagement in school and community activities. Record of student-level
participation and attendance in activities of the ESOL SSL Club throughout the year as
documented by SSL Club advisors.
10. Familiarity with post-secondary education options. Students’ responses to questions
about college and career plans on a survey of high school ESOL students administered in
the spring of 2013.
These measures correspond to indicators of progress within domains of academic excellence,
creative problem solving and social emotional learning competences as described in the MCPS
Strategic Planning Framework (MCPS, 2013d).
Instruments and Data Sources
The instruments and data sources were:
1. Survey of high school ESOL students. The student survey was developed by OSA in
collaboration with the MCPS SSL coordinator and MC–TP/SS partners. The items on the
survey focused on student understanding of college expectations, familiarity with post-
secondary education options, level of engagement in school activities and community
activities, and students’ experiences with the ESOL SSL Club. The survey was pilot-tested
with ESOL students at one of the six high schools and revised appropriately. At the
recommendation of ESOL teachers, Multidisciplinary Education, Training, and Support
(METS) and ESOL level 1 students were exempted from taking the survey because the
survey only was available in English. Electronic web-based surveys were administered
to ESOL students in the six high schools in May 2013. Through the facilitation and
coordination of the ESOL resource teachers at each school, students took the survey in a
computer lab setting. ESOL teachers were asked to report to OSA the number of students
in the METS program and beginning ESOL students who were exempted from taking the
survey.
2. Student participation in community activities worksheet. The goal of this tool was to
determine the level of student participation in ESOL SSL Club activities available at each
school. This instrument was designed to collect student-level data about the number of
activities available in each school, level of participation, as well as number of SSL hours
earned through the ESOL SSL Club during the school year. For the four schools
partnering with MC–TP/SS, student-level information was compiled throughout the year
and submitted to OSA at the end of the school year by the Service Learning Collaborative
coordinator for Montgomery College, Takoma Park as well as club advisors. For
Gaithersburg and Watkins Mill high schools, the data were compiled and submitted by
the club advisors.

Montgomery County Public Schools Office of Shared Accountability
Program Evaluation 9 ESOL SSL Club
3. Interviews with ESOL SSL Club advisors. An OSA researcher conducted in-person or
e-mail interviews with the six club advisors. The interview protocol elicited information
on: structure of the ESOL SSL Club, advisors’ perception of the impact of the club,
challenges faced, and suggestions for improvements. Four of the interviews were
conducted face to face, and two of the advisors responded to the questions by e-mail.
4. Student level outcome data. The following data were compiled from MCPS databases:
SSL hours, attendance, ACCESS scores, HSA scores, mathematics and language course
grades, GPA, eligibility, and evidence of continued education (promotion).
Analysis Procedures
Three different analytical procedures were applied to address the evaluation questions:
1) logistic regression analytic models to examine rates of attaining academic outcomes between
two groups of students for dichotomous variables (e.g., measured through passing HSA, final
grades C or higher, eligibility, promotion); 2) analyses of covariance (ANCOVA) to detect
differences between the two groups of students for attendance, GPA, change in ACCESS for
ELL scores, and SSL hours completed during the school year; 3) descriptive analyses of
structured survey items; and 4) content analyses of open-ended survey items and SSL Club
advisor interviews.
Evaluation Question 1
The objectives of evaluation question 1 were to: a) describe the performance of ESOL SSL Club
members on a variety of measures, b) compare the performance of ESOL SSL Club members
and non-club members, and c) assess whether differences between the two groups of ESOL
students are meaningful in an educational setting. As such, statistical significance tests and effect
size statistics were used to address this question. Because of the limited sample size of student
subgroups within the two study groups, the data were not disaggregated by student subgroups.
Steps 1 to 6 were used to address the first evaluation question.
Step 1: Descriptive analyses of students. Demographic characteristics of ESOL students
in the six schools and by club membership were summarized.
Step 2: Propensity score computation. To statistically control for the nonequivalence of
the ESOL SSL Club participants and non-participants, a propensity score was computed (based
on Free and Reduced-price Meals System (FARMS) status, special education status, grade level,
gender, and race/ethnicity using logistic regression (Luellen, Shadish, & Clark, 2005). The use of
the propensity score method provided an effective approach for controlling any preexisting
differences between the two groups of students. The propensity scores were divided into
quintiles (five categories) and subsequently used as a covariate in the multivariate analyses in
Steps 4 and 5 (Rosenbaum & Rubin, 1984).
Step 3: Drawing a sample. A matched sample of ESOL students not participating in the
ESOL SSL Club was drawn using propensity score matching method.

Montgomery County Public Schools Office of Shared Accountability
Program Evaluation 10 ESOL SSL Club
Step 4: Logistic regression. Logistic regression analytical procedures were applied to
assess any differences in proportion between two groups of students (ESOL SSL Club members
and non-club members)—
who attained report card grades of C or higher in mathematics and English/reading
courses;
who were promoted to the next grade level;
who had academic eligibility as measured by attainment of GPA of 2.0 and higher; and
who passed HSA tests in English, Algebra I, Biology, and Government.
Step 5: Analyses of Covariance. Analyses of covariance (ANCOVA) were applied to
detect any statistically significant differences in the parametric outcome variables between the
two groups (SSL hours earned, average student attendance, GPA) while simultaneously
controlling for preexisting or intervening variables through the propensity score categories
computed in Step 2. Repeated measure analyses were used for ACCESS for ELL scores from
2012 to 2013. The dependent variables were overall composite scores and domain scores for club
and non-club members. Students with ACCESS scores for both years were included in the
analyses.
Step 6: Computation of effect sizes. Effect sizes were computed to assess any practically
meaningful differences in measures between the two groups of ESOL students. In evaluating effects
of out-of-school programs, effect sizes of 0.15 and above are considered important by
educational researchers (i.e., the larger the effect sizes, the stronger the impact of the
intervention) (Wasik & Slavin, 1993; Cohen, 1988; Borman, Slavin, Cheung, Chamberlain,
Madden, & Chambers, 2005). A statistically significant result does not mean the result has
practical or educational value. In addition, although effect size is meant to represent a “true”
effect in the population, it is important to understand that effect size estimates may be influenced
by sampling and the nature of measures being examined. In this study, we are concerned about
the magnitude, direction, and relevance of effect, and it was important to use some critical
thinking and perspective when evaluating practical significance. As such, only analyses that
yielded evidence of: a) statistically significant differences between the two groups, and
b) practically meaningful differences between the groups were considered likely to reveal a true
difference between the two groups if one exists.
A second set of analyses was conducted to replicate steps 1 to 6 of the analytical procedures
using a different sample of non-club peers. In the replicated analyses, the comparison group was
selected randomly from non-club ESOL students in the six study schools. Generally, similar
patterns were found in the direction of most of the findings as those generated using a matched
sample.
Evaluation Question 2
The objective of evaluation question 2 was to assess the extent to which the ESOL SSL Club
contributed to students’ understanding of college expectations, level of engagement in school
activities, and engagement in community activities. Data analysis procedures included:

Montgomery County Public Schools Office of Shared Accountability
Program Evaluation 11 ESOL SSL Club
Descriptive analyses of survey items. Descriptive statistics of survey items were
completed to determine the frequency of responses to each of the structured items, and open-
ended responses were summarized.
Analyses of familiarity with college options/school and community engagements.
Comparisons of responses for students in the ESOL SSL Club and non-club students were made
to determine if there were any differences in levels of familiarity with college options and
engagement in school and community activities between the two groups. These analyses
assessed if being in the club contributed to an increase in students’ understanding of college
expectations and engagement in school and community activities.
Analyses of students’ perceptions of club membership. Examination was made of ESOL
SSL Club members’ responses to survey questions asking about their experiences in the club.
Students who indicated they had been club members during any of the two years were included
in the analyses of students’ perceptions of the ESOL SSL Club.
Analyses of interviews and communication. Content analysis was conducted on ESOL
SSL Club advisors’ interviews and other electronic communications with program implementers
in the course of school year 2012–2013.
Results
First, characteristics of ESOL students in the six study schools and in all MCPS high schools are
presented. Then, characteristics of the analytic groups—ESOL SSL Club members and matched
non-club members—are described. Finally, the results from evaluation questions 1 and 2 are
presented.
Demographic Characteristics of ESOL Students
A total of 2,865 students in 25 MCPS high schools received ESOL instruction (or were eligible
to receive instruction) during school year 2012–2013. In the six study schools with ESOL SSL
Clubs, there were 1,159 ESOL students. The demographic characteristics of the ESOL students
in the six study schools, and ESOL students in all MCPS high schools, are shown in Table 1 and
Appendix D, Table D1. On grade level, gender, and percentage of students receiving special
education services, the compositions of the two ESOL groups were similar. However,
significant differences emerged in the race/ethnic composition and in FARMS participation. The
percentages of Black or African American and Hispanic/Latino students among the ESOL
students in the six study schools were significantly higher than the percentages across all ESOL
students in MCPS. On the other hand, percentages of Asian and White students were lower in
the study schools than among all MCPS ESOL students. Notably, the percentage of students
who had ever participated in FARMS was significantly higher among the six study schools
compared with all MCPS ESOL students.

Montgomery County Public Schools Office of Shared Accountability
Program Evaluation 12 ESOL SSL Club
*p < .05; Difference is significant.
Description of Analytic Samples
A dataset of all students who were participating in ESOL in the six high schools was compiled.
Students who participated in the ESOL SSL Club were flagged. Following that, a subsample of
ESOL students who attended the six study schools but who did not participate in the ESOL SSL
Club were identified. Propensity scores were generated using gender, race/ethnicity, grade level,
receipt of FARMS services, and receipt of special education services. Propensity score matching
was used to reduce the potential influence of preexisting differences on the estimate of ESOL
SSL Club membership effects on outcomes for ESOL SSL Club members and non-members.
The characteristics of the two matched analytic groups are shown in Table 2.
Table 1
Demographic Characteristics of ESOL Students in Six High Schools with ESOL SSL Clubs
and ESOL Students in all MCPS High Schools
Demographic characteristics
ESOL students in six
study schools
(N = 1,159)
ESOL students in all
MCPS high schools
(N = 2,865)
% %
Gender Male 56.2 55.1
Female 43.8 44.9
Grade
Grade 9 48.4 46.0
Grade 10 24.7 25.2
Grade 11 13.5 15.4
Grade 12 13.4 13.4
Race/ethnicity
Black or African American 23.4* 20.4
Asian 9.8* 17.2
Hispanic/Latino 65.1* 56.2
White 1.5* 5.7
Other, or Two or More Races 0.3 0.4
Receipt of FARMS
(current or previous) FARMS 90.7* 78.1
Special education (current) Special education, any level 3.0 3.6

Montgomery County Public Schools Office of Shared Accountability
Program Evaluation 13 ESOL SSL Club
The two analytic groups—students in the ESOL SSL Club and the non-club member comparison
group—were similar in their percentages of grade level, gender, race/ethnicity, receipt of
FARMS, and receipt of special education services. Chi-square tests revealed no statistically
significant differences between the two analytic groups on any of the demographic
characteristics reported.
Evaluation Question 1. Did participation in the ESOL SSL Club contribute to a significant
difference in: a) the number of SSL hours earned toward graduation, b) the average attendance,
c) passing rates in identified courses, d) eligibility rates, e) grade-level promotion, f) percentage
of students passing HSAs, and g) literacy skills between ESOL SSL Club participants and ESOL
students who did not participate in the club?
To address question 1, an examination of the specified measures of student performance was
conducted for ESOL SSL Club members and for ESOL non-club members. Data on the
specified outcomes of the two groups was compared using ANCOVA or logistic regression
where appropriate. In each set of analyses, a calculated propensity score (quintile) variable was
used as a control for preexisting differences between the two groups of students. Where
appropriate or where data were available, prior years’ achievement data were used as covariates
to remove the effect of prior performance on the outcomes examined in this study.
Student Service Learning Hours Earned. The number of SSL hours earned by students in
the two groups was examined through ANCOVA, with hours earned during 2012–2013 as the
dependent variable (calculated by subtracting beginning-of-year hours from end-of-year hours)
and propensity score quintile as covariate. Only students with record of SSL hours at the
beginning and end of 2012–2013 school year were included in the analyses for this outcome.
Table 2
Demographic Characteristics of ESOL Students in Analytic Groups
Demographic characteristics
Students in ESOL
SSL Club
(N = 346)
Students not in
ESOL SSL Club
(N = 346)
n % n %
Gender Male 152 43.9 162 46.8
Female 194 56.1 184 53.2
Grade
Grade 9 168 48.6 173 50.0
Grade 10 92 26.6 90 26.0
Grade 11 47 13.6 46 13.3
Grade 12 39 11.3 37 10.7
Race/ethnicity
Black or African American 92 26.6 79 22.8
Asian 46 13.3 41 11.8
Hispanic/Latino 200 57.8 224 64.7
White 6 1.7 2 0.6
Two or More Races 2 0.6 0 0.0
Receipt of FARMS
(current or previous) FARMS 313 90.5 316 91.3
Special education (current) Special education, any level 4 1.2 4 1.2

Montgomery County Public Schools Office of Shared Accountability
Program Evaluation 14 ESOL SSL Club
Table 3 shows the adjusted mean number of hours earned during the school year for each of the
groups at each grade level.
In Grades 9 and 10, students in the ESOL SSL Club earned more hours during school year 2012–
2013 than similar students who did not participate in the ESOL SSL Club. Grade 9 club
members earned a statistically significantly higher average of 26 hours during the school year
compared with non-club peers who earned an average of 4 hours (F(1,244) = 9.93, p = .001,
d = 0.40). Grade 10 students in the ESOL SSL Club also earned more SSL hours than their non-
club counterparts (24 compared with 17), but the difference was not statistically significant
(Table 3). The same comparison for Grades 11 and 12 did not produce statistically significant
differences.
Further, the percentage of students who had completed the SSL hours required for graduation by
the end of school year 2012–2013, by club membership, and by grade also was examined using
logistic regression (Table 4) . The SSL requirement of 75 hours is prorated based on the grade of
first enrollment in MCPS (Appendix A). The required SSL hours for students first enrolling in
MCPS in Grade 9 would be 45; 35 hours for Grade 10; 20 hours for Grade 11; and 10 hours for
students first entering MCPS in Grade 12. Table 4 shows the percentage of ESOL SSL Club
members and non-club members in each grade who had earned the SSL hours required for
graduation by the end of school year the 2012–2013.
Table 3
Adjusted Mean Number of SSL Hours Earned During School Year 2012–2013
by ESOL SSL Club Members and Non-Club Comparison Group
Grade in school
Adjusted Means
Effect of ESOL SSL Club
Membership
Students in ESOL
SSL Club
Students not in
ESOL SSL Club
Mean N Mean N
Mean
diff.
Std.
Error p ES (d)
Grade 9 26.04 129 4.38 116 21.69 4.99 .001 0.40
Grade 10
24.02 87 17.23 81 6.79 3.71 .190 --
Grade 11
39.88 41 48.97 42 -9.09 12.38 .600 --
Grade 12 48.60 38 52.34 35 -3.74 11.68 .810 --
Table 4
Percentage of Students With Completed SSL Requirement by End of School Year 2012–2013:
ESOL SSL Club Members and Non-Club Comparison Group
Grade in school
Students in ESOL
SSL Club
Students not in ESOL
SSL Club
Effect of ESOL SSL Club
Membership
N
% Completed
SSL Req. N
% Completed
SSL Req.
Diff. in
%
Odds
Ratio p ES (d)
Grade 9 168 12.5 173 1.7 10.8 7.96 .001 1.15
Grade 10
92 25.0 90 18.9 6.1 1.41 .340 --
Grade 11
47 38.3 46 56.5 -18.2 0.43 .054 -0.47
Grade 12 39 97.4 37 83.8 13.6 8.14 .060 --
All grades 346 28.9 346 22.3 6.6 1.44 .038 0.20

Montgomery County Public Schools Office of Shared Accountability
Program Evaluation 15 ESOL SSL Club
Among the students in all grades, a significantly higher percentage of club members compared
with non-club members had completed their required SSL hours by the end of school year
2012–2013 (OR = 1.44, p = .04). In Grade 9, a statistically and practically significant higher
percentage of club members completed their required number of SSL hours by the end of the
school year (13% vs. 2%, OR = 7.96, p = .001) when compared with non-club members. Club
membership was not related to the percentage of Grade 10 students who had met the SSL
requirement by the end of the school year. At the same time, compared to non-club peers, a
significantly lower percentage of Grade 11 club members had completed the required SSL hours
by the end of the school year (38% vs. 57%). The negative medium effect (d = -0.47) indicated
that the average hours earned by Grade 11 club members at this point, lagged significantly
behind that of non-club members. The proportion of Grade 12 students who had completed their
required SSL hours were comparable between the two groups (Table 4).
School Attendance. School attendance of ESOL SSL Club members and non-club
members was compared using ANCOVA procedures; the percentage of days attended during
school year 2012–2013 was the dependent variable, and the propensity score quintile and the
previous year’s attendance rate were covariates. Table 5 shows the percentage of adjusted mean
days club members and non-club members attended school by grade level and overall.
The average rate of attendance for all groups was well over 80%, which was the standard set for
the SSL club objective for attendance. Among all students in Grades 9 through 12, club
membership was significantly and positively related to better school attendance (F(1,493) =
11.03, p = .001, d = 0.25), equating to small but practically meaningful impact. On average,
students who participated in the ESOL SSL Club had an attendance rate of 93% and their non-
club peers attended at the rate of 90%, a difference of about five and one half days in a full
school year (Table 5). At the grade level, club participation attendance was higher for club
members than non-club members, but the effect was statistically significant only in Grade 9
(F(1, 179) = 9.64, p = .002, d = 0.43), resulting in medium practically meaningful impact.
Table 5
Percentage of Days Attending School During School Year 2012–2013:
ESOL SSL Club Members and Non-Club Comparison Group
Grade in school
Adjusted Means
Effect of ESOL SSL Club
Membership
Students in ESOL
SSL Club
Students not in ESOL
SSL Club
N
% Days
Attended N
% Days
Attended
Mean
diff.
Std.
Error p ES (d)
Grade 9 88 95.03 92 90.63 4.41 1.00 .002 0.43
Grade 10
81 92.08 81 89.29 3.53 1.07 .068 0.29
Grade 11
39 89.99 40 88.50 1.49 2.00 .600 0.09
Grade 12 38 91.35 35 88.81 2.54 1.44 .211 0.21
All grades 248 92.66 246 89.62 3.04 0.65 .001 0.25

Montgomery County Public Schools Office of Shared Accountability
Program Evaluation 16 ESOL SSL Club
GPA and Passing Rates in Identified Courses
The effect of club membership on school performance was analyzed by examining GPA and
report card grades in English/reading and mathematics, eligibility, and promotion to the next
grade. Performance of the two groups was compared with ANCOVA (for GPA analysis), and
logistic regression (for categorical indicators for course grade, eligibility, and promotion
analyses). In each set of analyses, the propensity score quintile was used as a control variable. In
addition, the analyses controlled for previous year GPA for students in Grades 10 through 12.
Analyses with the combined group of Grades 9 through 12 students were not conducted since
previous GPA was not available for Grade 9 students, who make up a large proportion of each
group. GPA is computed for high school level courses, so most Grade 9 students did not have a
previous year GPA, or they had a GPA based only on one or two courses.
Grade Point Average. Table 6 shows the end-of-year GPA of students in the ESOL SSL
Club and their non-club member peers. Grade-level analyses revealed a significant association
between club membership and end-of-year GPA for students in Grade 9 and students in Grade
12.6 The GPA of Grade 9 club members was .37 points higher than the GPA of non-club
members (2.50 compared with 2.13, (F(1, 340) = 15.12, p = .000, d = 0.43), equating to a
medium effect. In Grade 12, club members ended the year with a GPA of 2.56 and non-club
members had 2.49 (F(1, 72) = 4.74, p = .033, d = 0.10). While the GPAs differed statistically
between the two groups, the effect size showed that the performance levels of the two groups
were comparable and the difference in mean GPAs was not meaningful in an educational setting.
Earning a Grade of C or Better in Mathematics and Reading courses. End-of-semester
grades in mathematics and language (English, ESOL, or reading) were also examined for the two
groups of students. Table 7 shows the percentage of students in each group earning a final
course grade of C or better for the courses.
Table 6
End-of-Year Grade Point Average (GPA):
ESOL SSL Club Members and Non-Club Comparison Group
Grade in school
Adjusted Means
Students in ESOL
SSL Club
Students not in ESOL
SSL Club
Effect of ESOL SSL Club
Membership
N
End-of-
Year GPA N
End-of-
Year GPA
Mean
diff.
Std.
Error p
ES
(d)
Grade 9 168 2.50 173 2.13 0.37 0.047 .000 0.43
Grade 10
83 2.28 81 2.30 -0.02 0.021 .539 --
Grade 11
39 2.42 40 2.37 0.05 0.020 .213 --
Grade 12 38 2.56 35 2.49 0.07 0.015 .033 0.10

Montgomery County Public Schools Office of Shared Accountability
Program Evaluation 17 ESOL SSL Club
In Grade 9, the percentage of students earning a C or better in each of the mathematics and
language courses was significantly greater (odds ratios ranged from 1.89 to 3.17) for club
members as compared with non-club peers (Table 7). At the same time, no discernible pattern
was observed for club participation effects in mathematics or reading for Grade 10 students. The
proportion of Grades 10 and 11 club members and non-club peers attaining a grade of C or better
in mathematics or reading were statistically similar. In Grade 12, a significantly higher
percentage of club members earned a C or higher in their semester 1 language course (83% vs.
59%, OR = 4.15, p = .046), compared with non-club peers, contributing to a large and
meaningful effect (d = 0.79).
Academic Eligibility. Consistent with the findings for report card grades, Grades 9 and
12 ESOL SSL Club members were more likely to earn a GPA higher than 2.0, making them
academically “eligible” for fourth marking period as compared to their non-club member peers,
Table 7
Percentage of Students Earning a C or Better in Semester 1 and 2 Mathematics and Language Courses:
ESOL SSL Club Members and Non-Club Comparison Group
Students in ESOL
SSL Club
Students not in ESOL
SSL Club
Effect of ESOL SSL Club
Membership
N
% Earning
C or Better N
% Earning
C or Better
Diff.
in %
Odds
Ratio p ES (d)
Mathematics, Semester 1
Grade 9 165 76.4 169 51.5 24.9 3.17 .000 0.64
Grade 10
89 77.5 78 64.1 13.4 1.48 .321 --
Grade 11
43 72.1 41 65.9 6.2 0.95 .936 --
Grade 12 35 80.0 30 60.0 20.0 2.28 .196 --
Mathematics, Semester 2
Grade 9 153 73.9 147 56.5 17.4 2.24 .001 0.45
Grade 10
87 65.5 75 62.7 2.8 0.66 .293 --
Grade 11
42 66.7 40 70.0 -3.3 0.69 .625 --
Grade 12 34 73.5 28 46.4 27.1 3.09 .079 --
Language, Semester 1
Grade 9 165 81.2 167 69.5 11.7 1.89 .015 0.35
Grade 10
88 80.7 78 73.1 7.6 0.91 .826 --
Grade 11
44 77.3 43 79.1 1.8 1.43 .636 --
Grade 12 36 83.3 34 58.8 24.5 4.15 .046 0.79
Language, Semester 2
Grade 9 163 77.9 165 63.0 14.9 2.08 .004 0.40
Grade 10
88 75.0 78 71.8 3.2 0.74 .493 --
Grade 11
44 75.0 43 72.1 2.9 2.46 .243 --
Grade 12 37 70.3 34 52.9 7.4 2.29 .179 --
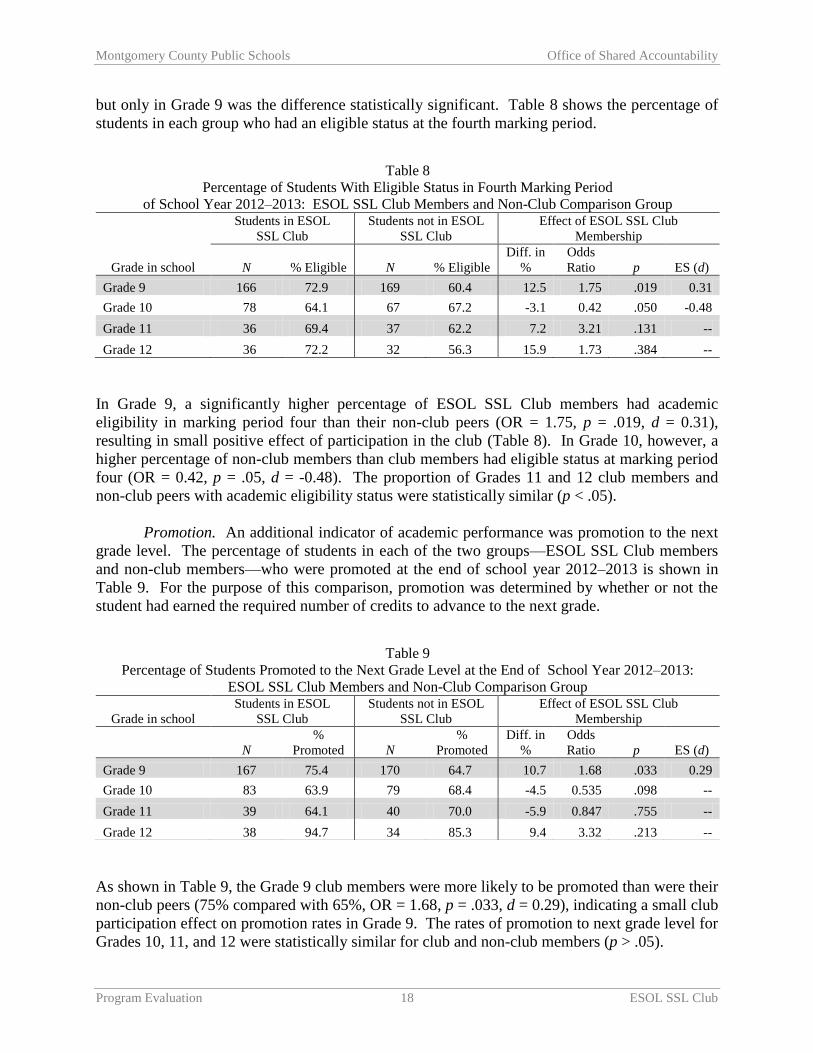
Montgomery County Public Schools Office of Shared Accountability
Program Evaluation 18 ESOL SSL Club
but only in Grade 9 was the difference statistically significant. Table 8 shows the percentage of
students in each group who had an eligible status at the fourth marking period.
In Grade 9, a significantly higher percentage of ESOL SSL Club members had academic
eligibility in marking period four than their non-club peers (OR = 1.75, p = .019, d = 0.31),
resulting in small positive effect of participation in the club (Table 8). In Grade 10, however, a
higher percentage of non-club members than club members had eligible status at marking period
four (OR = 0.42, p = .05, d = -0.48). The proportion of Grades 11 and 12 club members and
non-club peers with academic eligibility status were statistically similar (p < .05).
Promotion. An additional indicator of academic performance was promotion to the next
grade level. The percentage of students in each of the two groups—ESOL SSL Club members
and non-club members—who were promoted at the end of school year 2012–2013 is shown in
Table 9. For the purpose of this comparison, promotion was determined by whether or not the
student had earned the required number of credits to advance to the next grade.
As shown in Table 9, the Grade 9 club members were more likely to be promoted than were their
non-club peers (75% compared with 65%, OR = 1.68, p = .033, d = 0.29), indicating a small club
participation effect on promotion rates in Grade 9. The rates of promotion to next grade level for
Grades 10, 11, and 12 were statistically similar for club and non-club members (p > .05).
Table 8
Percentage of Students With Eligible Status in Fourth Marking Period
of School Year 2012–2013: ESOL SSL Club Members and Non-Club Comparison Group
Grade in school
Students in ESOL
SSL Club
Students not in ESOL
SSL Club
Effect of ESOL SSL Club
Membership
N % Eligible N % Eligible
Diff. in
%
Odds
Ratio p ES (d)
Grade 9 166 72.9 169 60.4 12.5 1.75 .019 0.31
Grade 10
78 64.1 67 67.2 -3.1 0.42 .050 -0.48
Grade 11
36 69.4 37 62.2 7.2 3.21 .131 --
Grade 12 36 72.2 32 56.3 15.9 1.73 .384 --
Table 9
Percentage of Students Promoted to the Next Grade Level at the End of School Year 2012–2013:
ESOL SSL Club Members and Non-Club Comparison Group
Grade in school
Students in ESOL
SSL Club
Students not in ESOL
SSL Club
Effect of ESOL SSL Club
Membership
N
%
Promoted N
%
Promoted
Diff. in
%
Odds
Ratio p ES (d)
Grade 9 167 75.4 170 64.7 10.7 1.68 .033 0.29
Grade 10
83 63.9 79 68.4 -4.5 0.535 .098 --
Grade 11
39 64.1 40 70.0 -5.9 0.847 .755 --
Grade 12 38 94.7 34 85.3 9.4 3.32 .213 --

Montgomery County Public Schools Office of Shared Accountability
Program Evaluation 19 ESOL SSL Club
HSA performance. Performance on the four HSA exams was examined for students in
the ESOL SSL Club and for their non-club member peers. The percentage of students who
passed the HSA during school year 2012–2013 was examined for each group. HSA results were
limited to HSAs taken during school year 2012–2013 because any influence of the ESOL SSL
Club would be limited to that timeframe. Results were not broken down by grade because
students can take the tests in any grade, and may repeat tests not passed. Table 10 shows the
passing rate for HSAs taken during 2012–2013 for each group.
Higher percentages of club members than non-club peers passed each of the HSAs during school
year 2012–2013, but the differences in passing rates were not statistically different (p > .05).
English language skills. To assess changes in English language skills, ACCESS for ELLs
overall composite and scores in the domains of listening, speaking, reading, writing, oral
language, literacy, and comprehension for 2012 and 2013 were used. Only students with scores
for both years were included in the analysis. Altogether, 444 students with scores for both years
were included in the analyses.
A one-way within subjects (or repeated measures) ANOVA was conducted to compare the effect
of club participation on change in ACCESS for ELL scores from spring 2012 and 2013 while
controlling for ESOL level. The within-subject factors were scores in the domains of listening,
writing, oral, speaking, literacy, and overall composite scores from 2012 to 2013. The between-
subject factor was club membership with two levels: club member and non-club member. The
findings revealed a significant club participation effect on change in overall ACCESS for ELL
scores (F(1,442) = 4.36, p = .04). Further analyses also showed significant club effect on the
mean change in ACCESS for ELL scores for the listening (F(1,442) = 11.21, p = .00), speaking
(F(1,442) = 8.00, p = .01), and oral language (F(1,442) = 17.10, p = .00) domains in favor of club
members. The effect sizes for the listening (d = 0.30), speaking (d = 0.27), and oral language
(d = 0.40) domains signified small to medium meaningful effect in language development of the
club members relative to non-club members. Table 11 displays the mean differences in change in
scores for each of the ACCESS domains and the overall composite for club members and non-
club peers.
Table 10
Percentage of Students Passing HSAs During School Year 2012–2013:
ESOL SSL Club Members and Non-Club Comparison Group
HSA Subject
Students in ESOL
SSL Club
Students not in ESOL
SSL Club
Effect of ESOL SSL Club
Membership
N % Passed N % Passed
Diff. in
%
Odds
Ratio p ES (d)
English 10 69 36.2 66 27.3 8.9 1.64 .199 --
Algebra I
76 23.7 62 22.6 1.1 1.08 .859 --
Biology
53 49.1 64 37.5 11.6 1.57 .240 --
Government 46 43.5 47 29.8 13.7 2.03 .115 --

Montgomery County Public Schools Office of Shared Accountability
Program Evaluation 20 ESOL SSL Club
Table 11
Estimated Marginal Mean Difference of Change from 2012 to 2013 and
Effect Size for ACCESS for ELL Scores
Domain
Students in
ESOL SSL Club
Students not in
ESOL SSL Club Mean
Diff.
Std.
Error p
ES
(d) Mean n SD Mean n SD
Listening 34.74 226 37.23 21.89 218 43.46 12.844 3.84 .00 0.30
Speaking 33.02 226 43.36 21.74 218 40.57 11.279 3.99 .01 0.27
Reading 15.03 226 23.24 17.88 218 27.84 -2.85 2.43 .24 --
Writing 25.47 226 22.24 22.71 218 27.52 2.77 2.37 .24 --
Oral Language 33.91 226 31.10 21.86 218 30.27 12.049 2.91 .00 0.40
Literacy 20.27 226 16.59 20.31 218 21.78 -0.04 1.83 .98 --
Overall 24.39 226 16.63 20.74 218 20.09 3.651 1.75 .04 0.18
These results suggest that the club had a positive effect, contributing to development of English
language skills, particularly in areas that included communicating with others through listening,
speaking, and oral language in general.
Summary of Findings Related to Evaluation Question 1
Participation in the ESOL SSL Club was related to many of the outcome measures examined in
this study particularly those related to expanding students’ skills and knowledge. Analyses
revealed that club members, particularly those in Grade 9, consistently outperformed their non-
club peers on a range of measures. Specifically:
Grade 9 club members completed significantly more SSL hours during the 2012–2013
school year than their non-club peers. All club members in Grades 9 through 12 in
general and Grade 9 club members in particular were more likely to have completed their
SSL requirement by the end of the school year.
Club membership appeared to have a positive impact on school attendance. Grade 9 club
members, as well as all club members in Grades 9 through 12, had significantly higher
attendance rates than their non-club peers.
The average end-of-year GPA for club members was higher than those of non-club
members in grades 9 and 12. In addition, Grade 9 club members were more likely to earn
a C or better in their mathematics and language courses than their Grade 9 non-club
peers. The related measure of academic eligibility also showed that a higher percentage
of club members in Grade 9 were academically eligible at the fourth marking period than
their non-club peers. Finally, similar results were found when the percentages of students
promoted to the next grade were compared: Grade 9 club members were more likely to
be promoted than their non-club peers. No evidence of significant club participation
effects were observed with regard to passing HSA exams in English 10, Algebra I,
Biology, and Government.
Participation in the ESOL SSL Club was related to development of English language
skills, particularly in areas that involved communicating with others through listening,
speaking, and oral language in general. On average, club members made greater gains in
composite ACCESS for ELL scores from 2012 to 2013 than non-club peers, and in the
domains of listening, speaking, and oral language.

Montgomery County Public Schools Office of Shared Accountability
Program Evaluation 21 ESOL SSL Club
Evaluation Question 2. Did participation in the ESOL SSL Club contribute to an increase in:
a) level of engagement in community activities, b) level of engagement in school activities, and
c) student understanding of college expectations?
This section presents findings from an online survey administered in May 2013 to Grades 9
through 12 ESOL students in the six schools with ESOL SSL Clubs. From MCPS records, 1,159
students in the six high schools in the study were identified as receiving ESOL services during
school year 2012–2013. A total of 203 Level 1 ESOL students and students in the METS
program were exempted from the survey, leaving a target sample of 956 students. A total of 601
students responded to the survey, yielding an overall response rate of 63%. Typical of most
surveys, the response rate varied from item to item.
Characteristics of Survey Respondents
Table 12 describes the self-reported characteristics of the survey respondents. One item on the
survey asked if students were club members in 2012, 2013, or both years. ESOL SSL Club
members and non-club members were represented in similar proportions across grades and
ethnicities; the ESOL SSL Club group had a higher proportion of female respondents while the
non-club group had a higher proportion of male respondents, compared with the total respondent
groups.
Table 12
Description of Characteristics of Survey Respondents
Characteristic
All survey
Respondents
(N = 601)
ESOL SSL Club
Membersa
(N = 372)
Non-SSL Club
Members
(N = 229)
n % n % n %
School
Blair HS 168 28.0 122 32.8 46 20.1
Gaithersburg HS 123 20.5 87 23.4 36 15.7
Kennedy HS 70 11.6 41 11.0 29 12.7
Northwood HS 99 16.5 49 13.2 50 21.8
Springbrook HS 46 7.7 20 5.4 26 11.4
Watkins Mill HS 95 15.8 53 14.2 42 18.3
Grade
9 228 37.9 133 35.8 95 41.5
10 187 31.1 122 32.8 65 28.4
11 116 19.3 68 18.3 48 21.0
12 70 11.6 49 13.2 21 9.2
Gender
Female 282 46.9 193 51.9 89 38.9
Male 300 49.9 168 45.2 132 57.6
Not Reported 19 3.2 11 3.0 8 3.5
Ethnicity
Hispanic/Latino 346 57.6 213 57.3 133 58.1
Not Hispanic/Latino 238 39.6 152 40.9 86 37.6
Not reported 17 2.8 7 1.9 10 4.4 aESOL SSL Club membership was a self-report of membership for one or both school years and/or students who
responded to items about their experiences in the ESOL SSL Club.

Montgomery County Public Schools Office of Shared Accountability
Program Evaluation 22 ESOL SSL Club
About 58% of all survey respondents indicated they were Hispanic/Latino; similar percentages of
club and non-club respondents also reported they were Hispanic/Latino. While most respondents
readily identified their ethnicity as either Hispanic/Latino or non-Hispanic/Latino, nearly half of
the respondents selected “other” for race. This finding has implications beyond the scope of this
study. Bearing in mind that the majority identified themselves as Hispanic/Latino, it is probable
that immigrants, particularly of Hispanic/Latino origin do not perceive themselves in terms of the
typical race categories as specified in the survey (American Indian or Alaskan native, Asian,
Black or African American, Native Hawaiian or Pacific Islander, or White). Also, limited
English proficiency could make it difficult for some respondents to distinguish between race and
ethnicity.
Country Lived in Before Moving to the United States. One third (33%) of the students
who provided open-ended responses last lived in El Salvador before moving to the United States
(USA) (Figure 2). The remaining survey respondents last lived in: Ethiopia (10%), a variety of
African countries (7%), Guatemala (6%), or Dominican Republic (5%). Also mentioned by more
than 10 respondents were Honduras, Peru, Cameroon, Vietnam, countries in the region of the
middle east, Mexico, Haiti, Ghana, India, and the Philippines.
Figure 2. Top five countries last lived in before moving to United States as reported by 557 students responding to
the ESOL SSL survey.
Consistent with the reported country last lived in before moving to the USA, responses to an
open-ended item showed that Spanish (55%), French (10%), or Amharic (10%) were the
languages most often reported to be the respondents’ primary language at home (Figure 3).
32.9
10.2
6.6 5.6 5.2
0
5
10
15
20
25
30
35
El Salvador Ethiopia Other African Guatemala Dominican
Republic
Per
cent
Res
po
nd
ents
Top Five countries Respondents Last Lived in before Moving to USA

Montgomery County Public Schools Office of Shared Accountability
Program Evaluation 23 ESOL SSL Club
Figure 3. Primary language used at home as reported by 560 students responding to the ESOL SSL survey.
Club Participation and Student Engagement in the Community
The number of activities offered by the ESOL SSL Club in each school varied. The number of
available activities, the average number of activities that club members participated in, and the
average number of SSL hours earned by club members in the club activities are shown in
Table 13. The activities data were compiled by the club advisors; they represent overall ESOL
SSL Club activity participation (whereas other findings in this section are based on reports from
the students who responded to the ESOL SSL survey).
The number of activities varied by school, with one school offering 9 activities and another up to
33 activities (Table 13; Appendix E, Table E1). Across the six high schools, the average number
of activities an ESOL SSL Club member participated in ranged from four to nine. The average
number of SSL hours earned through ESOL SSL Club activities ranged from two to nine. These
findings indicated that the ESOL SSL Clubs provided multiple opportunities for ESOL students
to earn SSL hours and those students got involved in their communities as they engaged in the
various activities and projects.
Table 13
ESOL SSL Club Participants, Club Activities and SSL Hours Reported by School
Blair 92 23 21 4.3 5.0 19.0 3.6 4.4
Gaithersburg 148 33 26 5.8 6.0 42.5 8.9 9.4
Kennedy 52 22 17 4.0 3.9 9.5 2.0 2.1
Northwood 62 23 23 5.3 5.8 12.0 2.7 3.0
Springbrook 65 17 17 9.0 5.2 21.0 7.7 5.1
Watkins Mill 27 9 8 3.9 2.4 NA NA NA Note. Data as reported by club advisors. aThis number may represent only a portion of total SSL hours earned during the school year.
54.5
9.8 9.5 4.6 5
0
10
20
30
40
50
60
Spanish French Amaharic/Oromo English OtherPer
cent
Res
po
nd
ents
Primary Language
N
Total Club
Activities
Available
Club Activity Participation
Per Student
Reported SSL Hours Earned
in Cluba
Max Mean
S.D.
Max.
Hours
Mean
Hours
S.D.
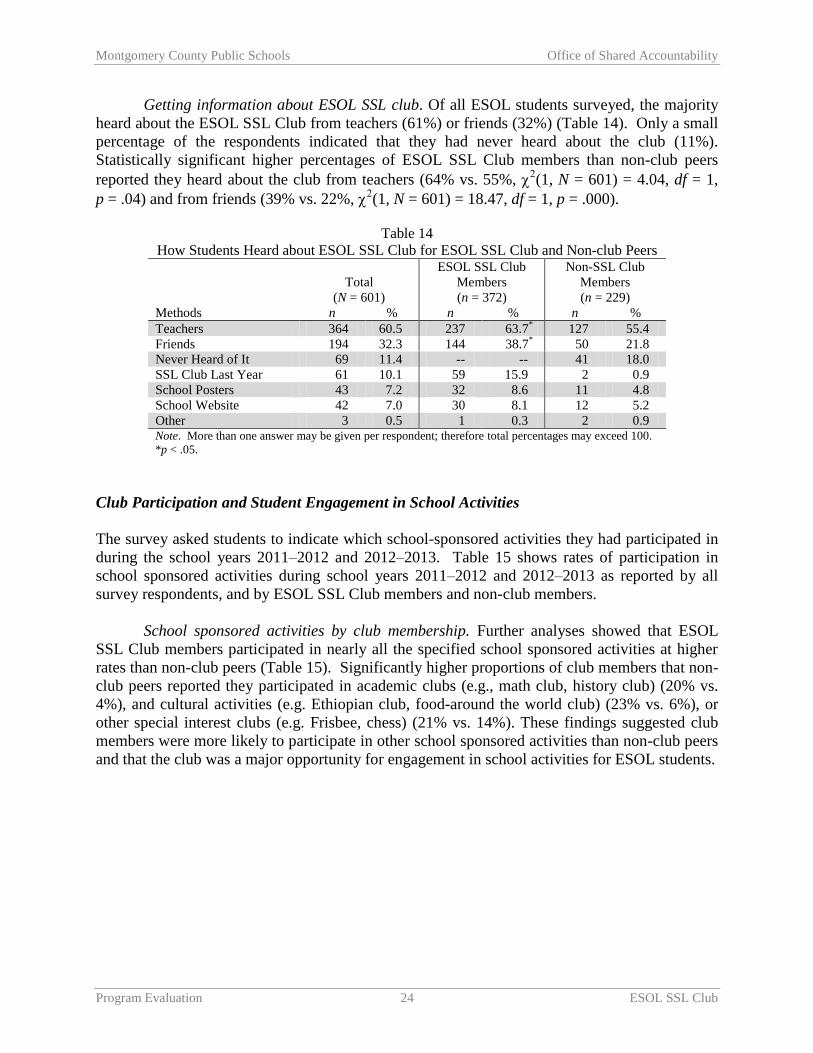
Montgomery County Public Schools Office of Shared Accountability
Program Evaluation 24 ESOL SSL Club
Getting information about ESOL SSL club. Of all ESOL students surveyed, the majority
heard about the ESOL SSL Club from teachers (61%) or friends (32%) (Table 14). Only a small
percentage of the respondents indicated that they had never heard about the club (11%).
Statistically significant higher percentages of ESOL SSL Club members than non-club peers
reported they heard about the club from teachers (64% vs. 55%, (1, N = 601) = 4.04, df = 1,
p = .04) and from friends (39% vs. 22%, (1, N = 601) = 18.47, df = 1, p = .000).
Table 14
How Students Heard about ESOL SSL Club for ESOL SSL Club and Non-club Peers
Total
(N = 601)
ESOL SSL Club
Members
(n = 372)
Non-SSL Club
Members
(n = 229)
Methods n % n % n %
Teachers 364 60.5 237 63.7*
127 55.4
Friends 194 32.3 144 38.7*
50 21.8
Never Heard of It 69 11.4 -- -- 41 18.0
SSL Club Last Year 61 10.1 59 15.9 2 0.9
School Posters 43 7.2 32 8.6 11 4.8
School Website 42 7.0 30 8.1 12 5.2
Other 3 0.5 1 0.3 2 0.9 Note. More than one answer may be given per respondent; therefore total percentages may exceed 100.
*p < .05.
Club Participation and Student Engagement in School Activities
The survey asked students to indicate which school-sponsored activities they had participated in
during the school years 2011–2012 and 2012–2013. Table 15 shows rates of participation in
school sponsored activities during school years 2011–2012 and 2012–2013 as reported by all
survey respondents, and by ESOL SSL Club members and non-club members.
School sponsored activities by club membership. Further analyses showed that ESOL
SSL Club members participated in nearly all the specified school sponsored activities at higher
rates than non-club peers (Table 15). Significantly higher proportions of club members that non-
club peers reported they participated in academic clubs (e.g., math club, history club) (20% vs.
4%), and cultural activities (e.g. Ethiopian club, food-around the world club) (23% vs. 6%), or
other special interest clubs (e.g. Frisbee, chess) (21% vs. 14%). These findings suggested club
members were more likely to participate in other school sponsored activities than non-club peers
and that the club was a major opportunity for engagement in school activities for ESOL students.
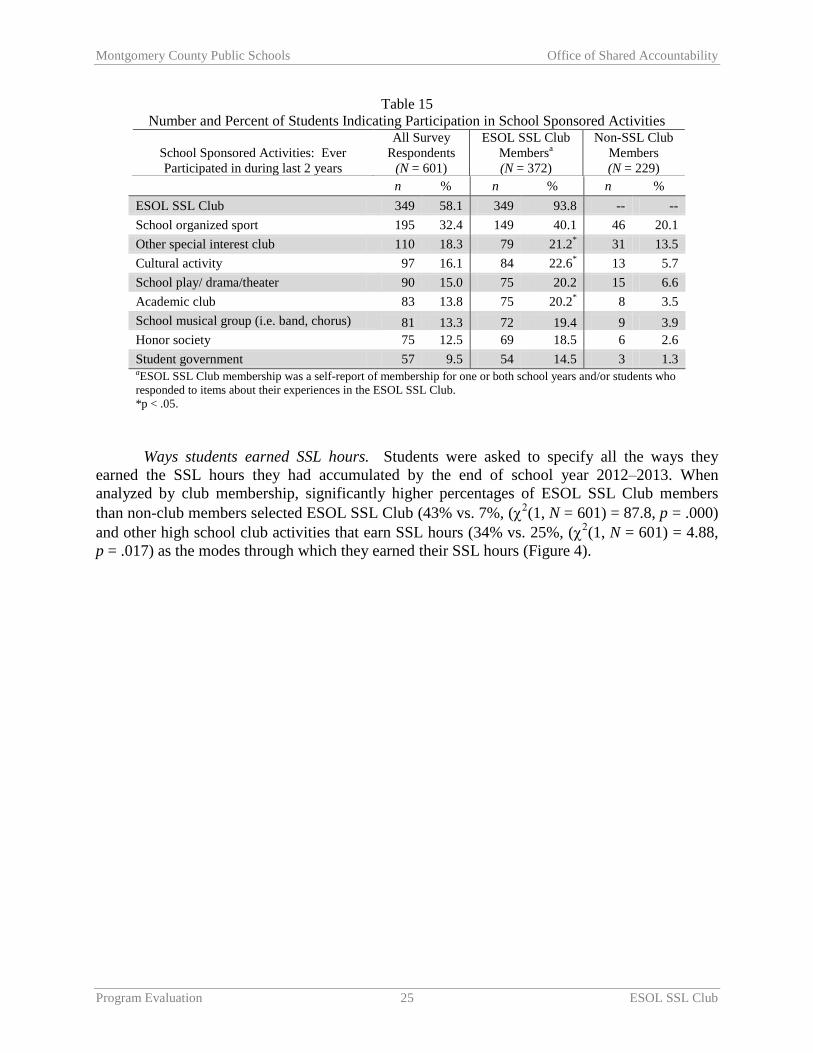
Montgomery County Public Schools Office of Shared Accountability
Program Evaluation 25 ESOL SSL Club
Table 15
Number and Percent of Students Indicating Participation in School Sponsored Activities
n % n % n %
ESOL SSL Club 349 58.1 349 93.8 -- --
School organized sport 195 32.4 149 40.1 46 20.1
Other special interest club 110 18.3 79 21.2*
31 13.5
Cultural activity 97 16.1 84 22.6*
13 5.7
School play/ drama/theater 90 15.0 75 20.2 15 6.6
Academic club 83 13.8 75 20.2*
8 3.5
School musical group (i.e. band, chorus) 81 13.3 72 19.4 9 3.9
Honor society 75 12.5 69 18.5 6 2.6
Student government 57 9.5 54 14.5 3 1.3 aESOL SSL Club membership was a self-report of membership for one or both school years and/or students who
responded to items about their experiences in the ESOL SSL Club.
*p < .05.
Ways students earned SSL hours. Students were asked to specify all the ways they
earned the SSL hours they had accumulated by the end of school year 2012–2013. When
analyzed by club membership, significantly higher percentages of ESOL SSL Club members
than non-club members selected ESOL SSL Club (43% vs. 7%, ((1, N = 601) = 87.8, p = .000)
and other high school club activities that earn SSL hours (34% vs. 25%, ((1, N = 601) = 4.88,
p = .017) as the modes through which they earned their SSL hours (Figure 4).
School Sponsored Activities: Ever
Participated in during last 2 years
All Survey
Respondents
(N = 601)
ESOL SSL Club
Membersa
(N = 372)
Non-SSL Club
Members
(N = 229)
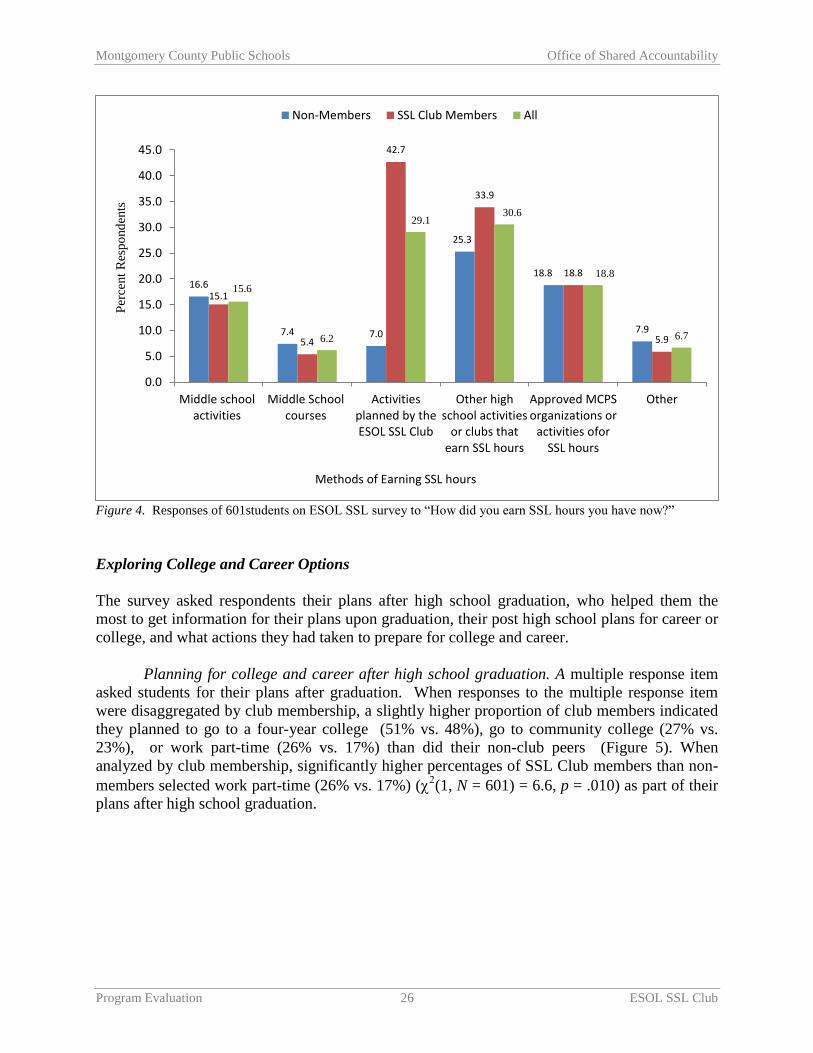
Montgomery County Public Schools Office of Shared Accountability
Program Evaluation 26 ESOL SSL Club
Figure 4. Responses of 601students on ESOL SSL survey to “How did you earn SSL hours you have now?”
Exploring College and Career Options
The survey asked respondents their plans after high school graduation, who helped them the
most to get information for their plans upon graduation, their post high school plans for career or
college, and what actions they had taken to prepare for college and career.
Planning for college and career after high school graduation. A multiple response item
asked students for their plans after graduation. When responses to the multiple response item
were disaggregated by club membership, a slightly higher proportion of club members indicated
they planned to go to a four-year college (51% vs. 48%), go to community college (27% vs.
23%), or work part-time (26% vs. 17%) than did their non-club peers (Figure 5). When
analyzed by club membership, significantly higher percentages of SSL Club members than non-
members selected work part-time (26% vs. 17%) ((1, N = 601) = 6.6, p = .010) as part of their
plans after high school graduation.
16.6
7.4 7.0
25.3
18.8
7.9
15.1
5.4
42.7
33.9
18.8
5.9
15.6
6.2
29.1 30.6
18.8
6.7
0.0
5.0
10.0
15.0
20.0
25.0
30.0
35.0
40.0
45.0
Middle schoolactivities
Middle Schoolcourses
Activitiesplanned by theESOL SSL Club
Other highschool activities
or clubs thatearn SSL hours
Approved MCPSorganizations or
activities oforSSL hours
Other
Per
cent
Res
po
nd
ents
Methods of Earning SSL hours
Non-Members SSL Club Members All

Montgomery County Public Schools Office of Shared Accountability
Program Evaluation 27 ESOL SSL Club
Figure 5. Plans after high school graduation reported by 601 survey respondents.
Who helped students get information for planning for career and college? As a group,
survey respondents identified family members (50%), teachers (31%), and school counselors
(29%) as the people who most helped them with information for college and career planning.
Similar proportions between club members and non-club members reported they were helped by
family members (50% vs. 49%) and teachers (33% vs. 27%), for club members and non-
members, respectively (Figure 6). Significantly higher percentages of ESOL SSL Club members
than non-club peers selected school counselor ((1, N = 601) = 5.0, p = .026), ESOL SSL Club
((1, N = 601) = 12.5, p = .000), and career center (
(1, N = 601) = 4.0, p = .045) as sources of
their information for planning career and college after graduation.
22.7
48.0
11.4
17.0
2.6
6.6 9.2
5.2
27.4
51.3
12.1
26.1
5.9 7.3
10.8
3.5
25.6
50.1
11.8
22.6
4.7 7
10.1
4.2
0
10
20
30
40
50
60
Go toCommuntyCollege/2
year college
Go to a 4year college
Work fulltime
Work part-time
Go to tradeschool
Join military No specificplans
Other
Per
cent
Res
po
nd
ents
Plans after High School
Non-Members SSL Club Members All
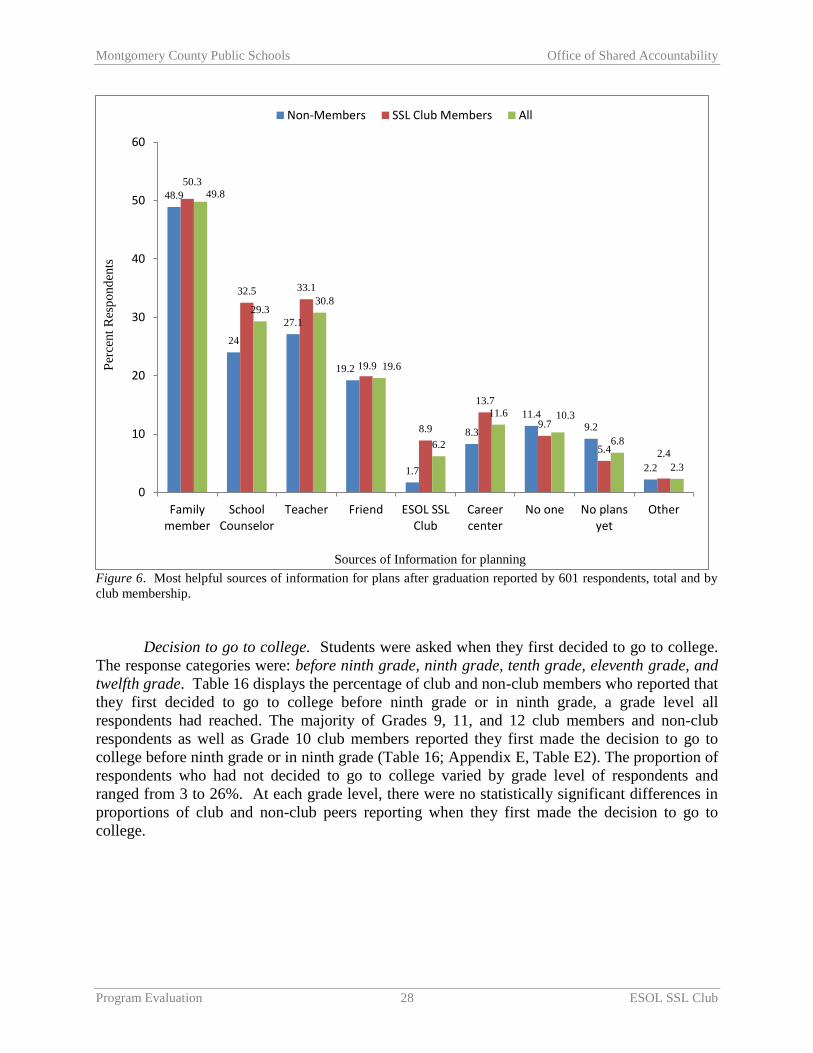
Montgomery County Public Schools Office of Shared Accountability
Program Evaluation 28 ESOL SSL Club
Figure 6. Most helpful sources of information for plans after graduation reported by 601 respondents, total and by
club membership.
Decision to go to college. Students were asked when they first decided to go to college.
The response categories were: before ninth grade, ninth grade, tenth grade, eleventh grade, and
twelfth grade. Table 16 displays the percentage of club and non-club members who reported that
they first decided to go to college before ninth grade or in ninth grade, a grade level all
respondents had reached. The majority of Grades 9, 11, and 12 club members and non-club
respondents as well as Grade 10 club members reported they first made the decision to go to
college before ninth grade or in ninth grade (Table 16; Appendix E, Table E2). The proportion of
respondents who had not decided to go to college varied by grade level of respondents and
ranged from 3 to 26%. At each grade level, there were no statistically significant differences in
proportions of club and non-club peers reporting when they first made the decision to go to
college.
48.9
24
27.1
19.2
1.7
8.3
11.4
9.2
2.2
50.3
32.5 33.1
19.9
8.9
13.7
9.7
5.4 2.4
49.8
29.3 30.8
19.6
6.2
11.6 10.3
6.8
2.3
0
10
20
30
40
50
60
Familymember
SchoolCounselor
Teacher Friend ESOL SSLClub
Careercenter
No one No plansyet
Other
Per
cent
Res
po
nd
ents
Sources of Information for planning
Non-Members SSL Club Members All
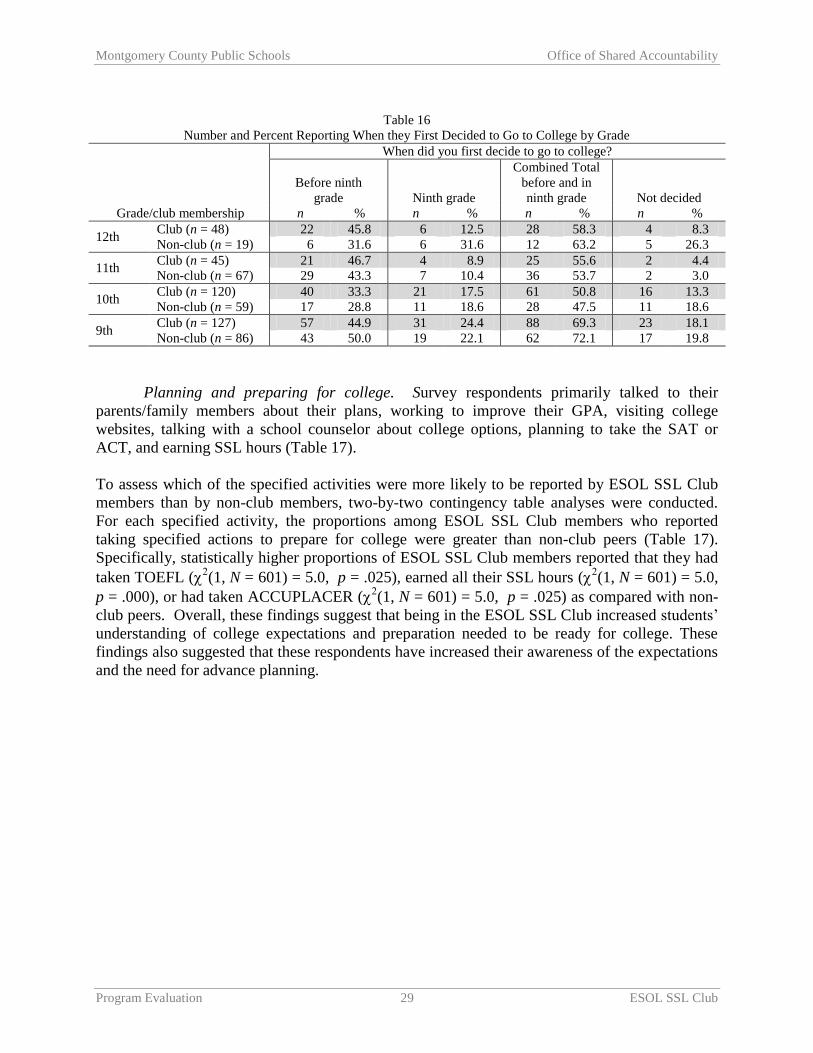
Montgomery County Public Schools Office of Shared Accountability
Program Evaluation 29 ESOL SSL Club
Table 16
Number and Percent Reporting When they First Decided to Go to College by Grade
Grade/club membership
When did you first decide to go to college?
Before ninth
grade Ninth grade
Combined Total
before and in
ninth grade Not decided
n % n % n % n %
12th Club (n = 48) 22 45.8 6 12.5 28 58.3 4 8.3
Non-club (n = 19) 6 31.6 6 31.6 12 63.2 5 26.3
11th Club (n = 45) 21 46.7 4 8.9 25 55.6 2 4.4
Non-club (n = 67) 29 43.3 7 10.4 36 53.7 2 3.0
10th Club (n = 120) 40 33.3 21 17.5 61 50.8 16 13.3
Non-club (n = 59) 17 28.8 11 18.6 28 47.5 11 18.6
9th Club (n = 127) 57 44.9 31 24.4 88 69.3 23 18.1
Non-club (n = 86) 43 50.0 19 22.1 62 72.1 17 19.8
Planning and preparing for college. Survey respondents primarily talked to their
parents/family members about their plans, working to improve their GPA, visiting college
websites, talking with a school counselor about college options, planning to take the SAT or
ACT, and earning SSL hours (Table 17).
To assess which of the specified activities were more likely to be reported by ESOL SSL Club
members than by non-club members, two-by-two contingency table analyses were conducted.
For each specified activity, the proportions among ESOL SSL Club members who reported
taking specified actions to prepare for college were greater than non-club peers (Table 17).
Specifically, statistically higher proportions of ESOL SSL Club members reported that they had
taken TOEFL ((1, N = 601) = 5.0, p = .025), earned all their SSL hours (
(1, N = 601) = 5.0,
p = .000), or had taken ACCUPLACER ((1, N = 601) = 5.0, p = .025) as compared with non-
club peers. Overall, these findings suggest that being in the ESOL SSL Club increased students’
understanding of college expectations and preparation needed to be ready for college. These
findings also suggested that these respondents have increased their awareness of the expectations
and the need for advance planning.

Montgomery County Public Schools Office of Shared Accountability
Program Evaluation 30 ESOL SSL Club
Table 17
Number and Percent Reporting Actions They Took to Prepare and Plan for College
Specified Items
ESOL SSL Club
Member
(N = 372)
Non-Club
Member
(N = 229)
n % n %
Talked to parents/family about my college plans 191 51.3 103 45.0
Working to bring up GPA 174 46.8 106 46.3
Visited college websites 114 30.6 56 24.5
Talked with a school counselor about college options 107 28.8 50 21.8
Planned to take SAT 96 25.8 53 23.1
Visited at least one college campus 94 25.3 44 19.2
Have earned all SSL hours
86 23.1*
22 9.6
Plan to take ACT 63 16.9 36 15.7
Getting more involved in extra-curricular activities 55 14.8 27 11.8
Have taken ACCU-PLACER
30 8.1*
8 3.5
Have taken TOEFL
30 8.1* 8 3.5
Have taken a college prep class at school 24 6.5 12 5.2
Have taken SAT
18 4.8 3 1.3
Have taken ACT 15 4.0 5 2.2
Note. This was an open-ended question and more than one response could be given, so percentages may not add to 100.
*p < .05.
A closer look at the actions taken to prepare for college showed some differences by grade level.
Details can be seen in Appendix E, Table E3.
Frequency of discussion and visits to colleges. Several survey items addressed activities
related to discussions about college and college visits. For students in the ESOL SSL Club and
their non-club peers, more discussions about college and career were very often or often reported
between the students and their family members (58%) and friends (51%) than with staff at school
(41%) (Table 18). About one quarter (27%) of non-club members reported they had not
discussed college with a staff member at all. About one quarter (27%) of ESOL SSL Club
members and over one third (37%) of non-club peers reported they had not visited a college
website at all. No significant differences were found between ESOL SSL Club members and
non-club members with regard to frequency of discussion about or visit to colleges.
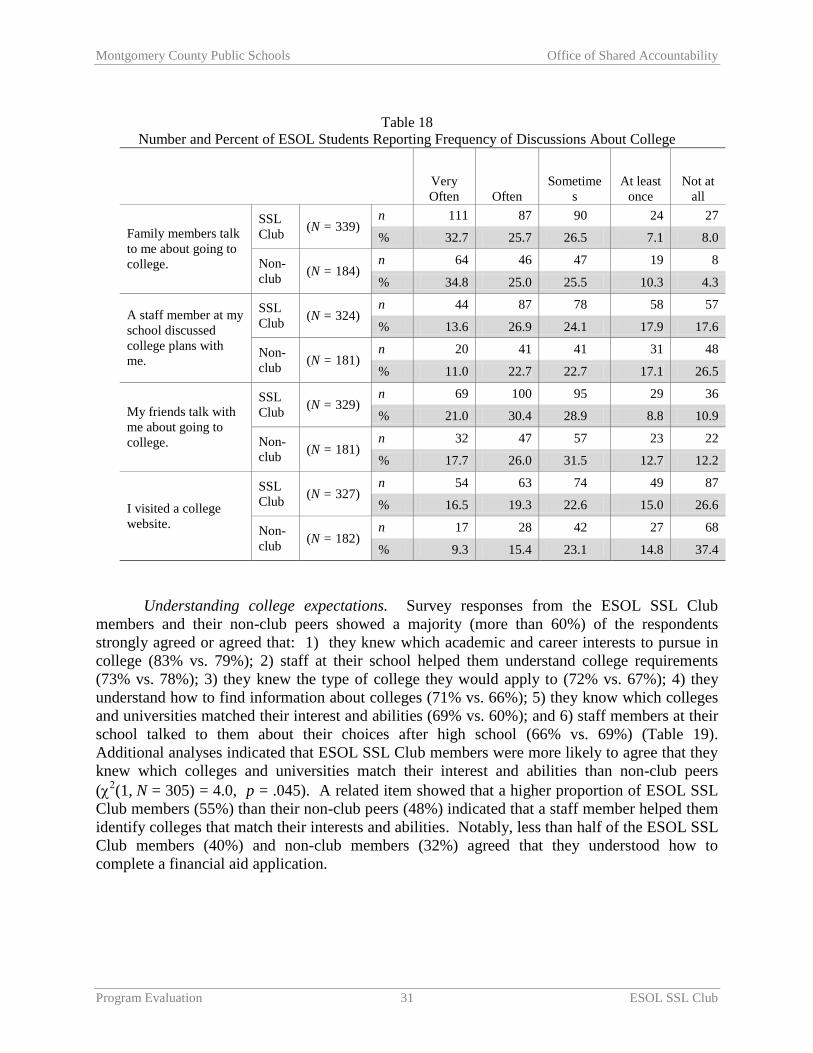
Montgomery County Public Schools Office of Shared Accountability
Program Evaluation 31 ESOL SSL Club
Table 18
Number and Percent of ESOL Students Reporting Frequency of Discussions About College
Very
Often Often
Sometime
s
At least
once
Not at
all
Family members talk
to me about going to
college.
SSL
Club (N = 339)
n 111 87 90 24 27
% 32.7 25.7 26.5 7.1 8.0
Non-
club (N = 184)
n 64 46 47 19 8
% 34.8 25.0 25.5 10.3 4.3
A staff member at my
school discussed
college plans with
me.
SSL
Club (N = 324)
n 44 87 78 58 57
% 13.6 26.9 24.1 17.9 17.6
Non-
club (N = 181)
n 20 41 41 31 48
% 11.0 22.7 22.7 17.1 26.5
My friends talk with
me about going to
college.
SSL
Club (N = 329)
n 69 100 95 29 36
% 21.0 30.4 28.9 8.8 10.9
Non-
club (N = 181)
n 32 47 57 23 22
% 17.7 26.0 31.5 12.7 12.2
I visited a college
website.
SSL
Club (N = 327)
n 54 63 74 49 87
% 16.5 19.3 22.6 15.0 26.6
Non-
club (N = 182)
n 17 28 42 27 68
% 9.3 15.4 23.1 14.8 37.4
Understanding college expectations. Survey responses from the ESOL SSL Club
members and their non-club peers showed a majority (more than 60%) of the respondents
strongly agreed or agreed that: 1) they knew which academic and career interests to pursue in
college (83% vs. 79%); 2) staff at their school helped them understand college requirements
(73% vs. 78%); 3) they knew the type of college they would apply to (72% vs. 67%); 4) they
understand how to find information about colleges (71% vs. 66%); 5) they know which colleges
and universities matched their interest and abilities (69% vs. 60%); and 6) staff members at their
school talked to them about their choices after high school (66% vs. 69%) (Table 19).
Additional analyses indicated that ESOL SSL Club members were more likely to agree that they
knew which colleges and universities match their interest and abilities than non-club peers
((1, N = 305) = 4.0, p = .045). A related item showed that a higher proportion of ESOL SSL
Club members (55%) than their non-club peers (48%) indicated that a staff member helped them
identify colleges that match their interests and abilities. Notably, less than half of the ESOL SSL
Club members (40%) and non-club members (32%) agreed that they understood how to
complete a financial aid application.

Montgomery County Public Schools Office of Shared Accountability
Program Evaluation 32 ESOL SSL Club
Table 19
Number and Percent of ESOL Students Indicating Level of Agreement
With Statements about Plans After High School
ESOL SSL Club
Members
Non-Club
Members
Total
Strongly
Agree/Agree
Total
Strongly
Agree/Agree
N n % N n %
I know which academic and career interests I want to
pursue when I go to college. 313 261 83.4 172 136 79.1
A staff member at my school helped me understand the
requirements for college admission (e.g., GPA, college
test scores). 312 228 73.1 174 136 78.2
I know the type of college I will apply to (2-year vs.
4-year). 301 218 72.4 168 113 67.3
I understand how to find information about colleges. 318 225 70.8 178 118 66.3
I know which colleges and universities match my
interests and abilities.
305 211 69.2*
173 104 60.1
A staff member at my school talked to me about my
choices after high school. 310 204 65.8 169 117 69.2
A staff member at my school helped me identify
colleges that match my interests and abilities. 304 167 54.9 166 79 47.6
I understand how to complete a financial aid
application. 293 117 39.9 158 51 32.3 *p < .05.
Students’ Experience in ESOL SSL Club
There were 372 students who responded to the survey items intended for only ESOL SSL Club
members and the response rate varied by question. More than half of those who provided a
reason for joining the club indicated that they joined the ESOL SSL Club to earn more SSL
hours (58%). In addition, more than one third stated that the club was recommended by teachers
at the school (39%), they wanted to practice their English language skills (34%), or to participate
in school activities (33%) (Table 20).
Table 20
Reasons for Joining the ESOL SSL Club as Reported by Survey Respondents
Reason
(N = 224)
n %
I needed to earn more SSL hours. 129 57.6
It was recommended by teachers at my school. 88 39.3
I wanted to practice my English language skills. 76 33.9
I wanted to participate in school activities. 73 32.6
It was recommended by friends. 61 27.2
I wanted to learn how to apply for college. 41 18.3
I wanted to make friends. 27 12.1
Other. 4 1.8 Note. More than one answer may be given per respondent; therefore percentages may not add to 100.
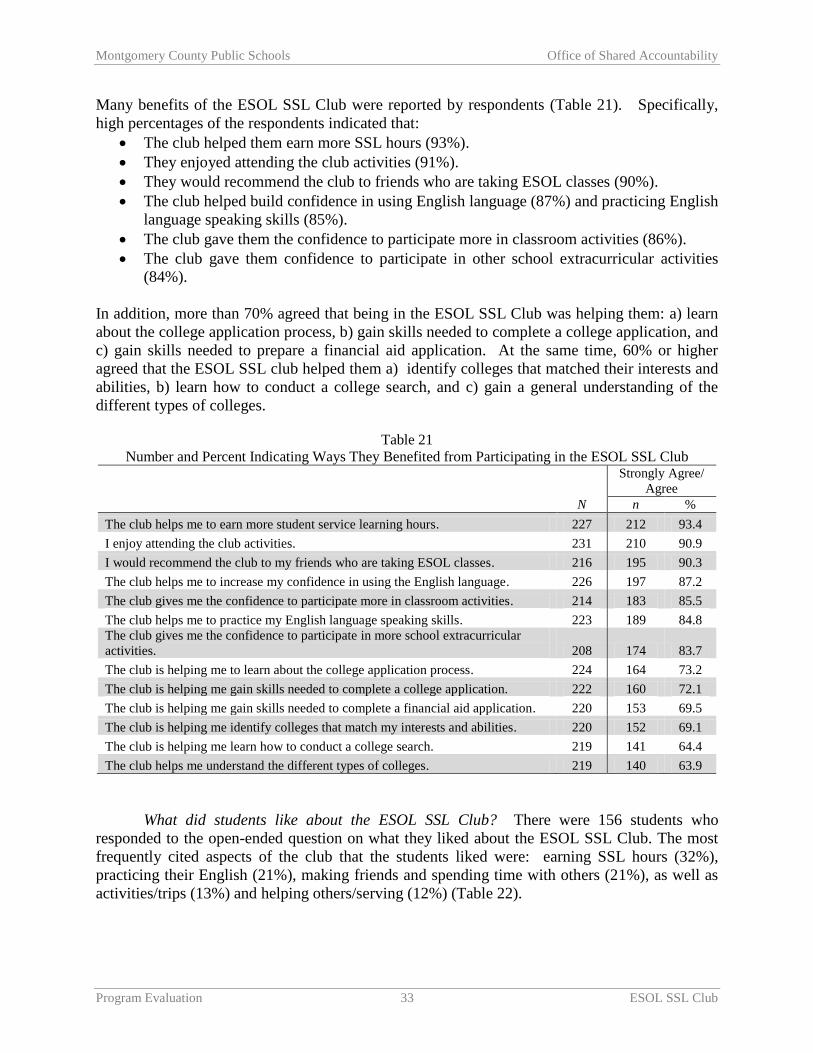
Montgomery County Public Schools Office of Shared Accountability
Program Evaluation 33 ESOL SSL Club
Many benefits of the ESOL SSL Club were reported by respondents (Table 21). Specifically,
high percentages of the respondents indicated that:
The club helped them earn more SSL hours (93%).
They enjoyed attending the club activities (91%).
They would recommend the club to friends who are taking ESOL classes (90%).
The club helped build confidence in using English language (87%) and practicing English
language speaking skills (85%).
The club gave them the confidence to participate more in classroom activities (86%).
The club gave them confidence to participate in other school extracurricular activities
(84%).
In addition, more than 70% agreed that being in the ESOL SSL Club was helping them: a) learn
about the college application process, b) gain skills needed to complete a college application, and
c) gain skills needed to prepare a financial aid application. At the same time, 60% or higher
agreed that the ESOL SSL club helped them a) identify colleges that matched their interests and
abilities, b) learn how to conduct a college search, and c) gain a general understanding of the
different types of colleges.
Table 21
Number and Percent Indicating Ways They Benefited from Participating in the ESOL SSL Club
N
Strongly Agree/
Agree
n %
The club helps me to earn more student service learning hours. 227 212 93.4
I enjoy attending the club activities. 231 210 90.9
I would recommend the club to my friends who are taking ESOL classes. 216 195 90.3
The club helps me to increase my confidence in using the English language. 226 197 87.2
The club gives me the confidence to participate more in classroom activities. 214 183 85.5
The club helps me to practice my English language speaking skills. 223 189 84.8
The club gives me the confidence to participate in more school extracurricular
activities. 208 174 83.7
The club is helping me to learn about the college application process. 224 164 73.2
The club is helping me gain skills needed to complete a college application. 222 160 72.1
The club is helping me gain skills needed to complete a financial aid application. 220 153 69.5
The club is helping me identify colleges that match my interests and abilities. 220 152 69.1
The club is helping me learn how to conduct a college search. 219 141 64.4
The club helps me understand the different types of colleges. 219 140 63.9
What did students like about the ESOL SSL Club? There were 156 students who
responded to the open-ended question on what they liked about the ESOL SSL Club. The most
frequently cited aspects of the club that the students liked were: earning SSL hours (32%),
practicing their English (21%), making friends and spending time with others (21%), as well as
activities/trips (13%) and helping others/serving (12%) (Table 22).

Montgomery County Public Schools Office of Shared Accountability
Program Evaluation 34 ESOL SSL Club
Table 22
What Students Liked About the ESOL SSL Club
Response
Total
N = 156
n %
Earn SSL hours/Help with SSL requirements 50 32.1
Practice English 33 21.2
Make Friends/Spend time with Others 32 20.5
Activities/Trips 20 12.8
Help Others 19 12.2
Learn Things/Learn about Environment 17 10.9
Learn about College 13 8.3
Other (e.g., food, fun, help with homework, good program) 3 2.6 Note. This was an open-ended question and more than one response could be given, so percentages may
not add to 100.
What did students learn in ESOL SSL Club? There were 133 students who provided
responses to an open-ended survey question about what they learned at the ESOL SSL Club.
The students reported learning about team work and social skills (34%) and improving English
language skills—grammar, speaking, writing, and communication (19%). Respondents also
mentioned learning to help others (17%), learning about colleges (16%), and learning about the
environment (12%) (Table 23).
Table 23
What Students Learned in ESOL SSL Club
Response
Total
N = 133
n % Team work/working together/being social/ importance of participation/showing
respect 45 34.0
Learn English/grammar/speak/write/communication skills 25 18.8
How to help others 23 17.3
Learn about colleges and process 21 15.8
Learn about environment/earth 16 12.0
Importance of SSL hours/how to get SSL hours 15 11.3
Activities (yard sale, make book, crochet, clean, resume, etc.) 12 9.0 Note. This was an open-ended question and more than one response could be given, so percentages may not add to 100.
What would students change about the ESOL SSL Club? When asked what they would
change about the club, the largest percentage of respondents indicated that the club was good and
they would not change anything (35%). Others suggested adding more activities and trips
(16%), recruiting more members (15%), having more frequent meetings (11%), and
incorporating more information about college (8%). Some other suggestions included changing
the schedule of club meetings so they do not happen at lunchtime, or that club members need to
use more English and less Spanish at the club meetings (Table 24).

Montgomery County Public Schools Office of Shared Accountability
Program Evaluation 35 ESOL SSL Club
Table 24
What Students Want to Add/Change About ESOL SSL Club
Response
Total
N = 137
n %
Don’t change anything/nothing/good as is 48 35.0
More activities/trips 22 16.1
More members/offer to more/would like to share with others 21 15.3
More time/more meetings/more days 15 10.9
More college information 11 8.0
Other (e.g., food, speak more English/less Spanish, schedule meeting at time other
than lunchtime) 27 19.7 Note. This was an open-ended question and more than one response could be given, so percentages may not add to 100.
ESOL SSL Club Sponsor Interviews
ESOL SSL Club Fosters Student Learning in a Variety of Ways
Club advisors observed that the ESOL SSL Club created an evironment for students to learn
about SSL requirements, college expectations, and American culture. The following section
summarizes the responses of six club advisors as captured in one-on-one interview sessions or e-
mail communication. Overall, the findings indicated the following:
The ESOL SSL Club provides targeted support to ESOL students.
The ESOL SSL Club creates opportunities for building a variety of strategic relationships
between: MCPS and community partners, students and staff, students and students, and
students and community.
The ESOL SSL Club fosters student learning in all three competency areas addressed in
the MCPS Strategic Planning Framework: academic excellence, social emotional
learning, and creative problem solving. Students practice English language skills and
experience increased self-awareness. Students serve as bilingual mentors to others and
students’ experience increased student engagement in school.
To extend the reach of the ESOL SSL Club to more students, club advisors suggested
having more in-school SSL Club activities or incorporating a high school course based on
activities to earn SSL hours.
Increasing familiarity with American culture and graduation requirements for earning
student service learning hours. Club advisors indicated that ESOL students are eager to learn and
practice their English language skills and need the club because they are unfamilair with the
requirements for earning SSL hours and are unlikely to earn SSL hours on their own
(Appendix F, Table F1). Interviews also indicated that the ESOL SSL Club increased student
engagement in school activities. One interviewed advisor stated ESOL students are new to the
country and to the school…they come aware of performing community service, but not how to
document their service or make sure it is approved service. Another advisor indicated that
through the club, they [ESOL student] get to feel part of something…to help the community…to
learn about American culture.
Montgomery County Public Schools Office of Shared Accountability
Program Evaluation 36 ESOL SSL Club
Relationship Building: Strengthening Community/MCPS Partnerships and Interpersonal
Relationships. According to the interviews of the ESOL SSL Club advisors, the club provided a
setting for a variety of relationships to develop. These relationships included: MCPS and
community partnerships, positive staff-to-student interactions, student-to-student relationships,
and student-to-community relationships through service projects. These interactions and
relationships increased the ESOL students’ level of engagement in school sponsored activities,
increased their confidence to interact with others, made students feel they were valuable
contributors in the community, and increased students’ understanding of the American culture
(Appendix F, Table F2). An advisor at one school shared that the club partnered with the
Audubon Society and that the society provided students with monthly lessons related to eco-
systems, habitat, and the watershed. Another club advisor indicated that sponsoring the club
helped her learn more about the students outside of school and about the community surrounding
the school. One advisor said ESOL students want to belong to a group…be part of a school club.
Staff positions/individuals/agencies key to success of ESOL SSL Club. Some key
individuals, staff positions, community partners/agencies, as well as the more proficient ESOL
students were commended for contributing to the success of the ESOL SSL Club (Appendix F,
Table F3). Some advisors shared the following comments about agencies and individuals that
contributed to the success of the club:
The most important resource for the club is the teacher sponsor who students know, like,
and trust.
Through partnership with the City of Gaithersburg Student Union, the club has been
successful introducing ESOL students to after-school activities in the community.
The coordinator, Service Learning Collaborative, MC–TP/SS has done well connecting
with students.
The mix of students (new ESOL, Grade 12 ESOL students in need of SSL hours to
graduate, non-ESOL bilingual students who hear the club announcements or come with
friends) has had the unexpected consequence of providing bilingual mentoring, role
models, and motivation for new ESOL students.
Insights for Sustainability of the ESOL SSL Club and Partnerships. While each of the
club advisors recommended continuation of the ESOL SSL Club, some shared suggestions for
improvements (Appendix F, Table F4). To make the club more robust, the advisors suggested:
Have more activities at school because transportation is often a problem for these
students.
Embed SSL hours in high school courses so that all students have access to earning the
hours they need for graduation.
Consider having a bilingual sponsor or staff member to extend the club outreach and
meet needs of ESOL level 1 and METS students.

Montgomery County Public Schools Office of Shared Accountability
Program Evaluation 37 ESOL SSL Club
Summary of Findings Related to Evaluation Question 2
Several sources of evidence indicated that participation in the club contributed to
students’ increased engagement in community and school activities. Student survey
responses as well as reports from club advisors indicated that participation in the club
was helpful in earning SSL hours and participating in community activities. These
findings were consistent with the analysis of SSL hours earned by club members and
non-club peers which found that club members earned more hours during the 2012–2013
school year (Tables 3 and 4).
Findings from surveys indicated that club members were more likely than non-club peers
to report that they participated in other school sponsored activities. In addition, 84% of
club members surveyed reported that the ESOL SSL Club gives them the confidence to
participate in other school and extracurricular activities (Table 21).
Overall, the findings suggested that being in the ESOL SSL Club increased student
understanding of expectations and preparation needed for college or career. Compared to
non-club peers, club members were more likely to know which colleges and universities
match their interests and abilities (Table 19). More than 70% of the club members who
responded to a survey reported that the club is helping to understand the college
application process and to gain the skills needed for completing a college application and
financial aid forms (Table 21).
Discussion/Summary
Service learning is an integral part of academic work. SSL teaches students that they can put
their skills to use to solve problems in their community (MCPS, 2013a). The ESOL SSL clubs
were facilitated through three different types of robust MCPS/community partnership models:
MC–TP/SS partnered with Blair, Springbrook, Kennedy, and Northwood high schools; City of
Gaithersburg and Audubon Society partnered with Gaithersburg High School; and Rotary
International with Watkins Mill High School. While the structure of these models differed
somewhat, the MCPS/community partnerships were important in facilitating meaningful school-
sponsored events to help students get involved in the community and subsequently earn their
SSL hours. When compared with non-club peers, club members from the six high schools: 1)
earned larger numbers of SSL hours in 2012–2013 and higher proportions of Grade 9 and 12
students had completed their required number of SSL hours, 2) had higher average attendance
rates, and 3) made larger gains in English language development. Grade-specific analyses
revealed that Grade 9 club members: 1) earned significantly higher GPAs, 2) had significantly
higher academic eligibility rates, and 3) were promoted to the next grade level at significantly
higher proportions than non-club peers. An earlier study on outcomes for ESOL SSL Club
members in one high school also reported similar results for some of these measures (Fink,
2011). The findings also corroborate studies that pointed out that English language learners and
particularly newcomers benefit from well-coordinated partnerships between a variety of agencies
and institutions serving youth.

Montgomery County Public Schools Office of Shared Accountability
Program Evaluation 38 ESOL SSL Club
Lastly, the findings provided insights on how the clubs could be enhanced. The suggestions
included adding more courses through which students can earn SSL hours, having bilingual
facilitators, and encouraging greater use of the English language among club members.
Recommendations
The following recommendations are based on the findings from the study:
Continue to use the ESOL SSL Club to provide meaningful learning opportunities through
which students with limited English skills can apply their skills and knowledge to real-world
issues and problems and earn required SSL hours.
Continue to support a career and college bound culture for newcomers to the country by
highlighting the most critical aspects of being career and college ready—
o making strong course selections connected to college and career aspirations,
o developing a strong high school transcript,
o taking timely college preparation tests (e.g., SAT/ACT),
o completing SSL requirements,
o visiting and selecting colleges,
o applying for admissions, financial aid, and
o seeking scholarships.
Support students with resources to increase their familiarity with multiple opportunities
available to them after high school graduation and to help them navigate applications for
college admission, financial aid, and scholarships.
Increase activities that enhance the development of English language skills and participation
in school and community activities.
Continue to assist with documentation of their SSL hours and student reflection for ESOL
students who are still learning English.
Consider inviting guest speakers (e.g., recent alumni, college admissions officers) to build
student understanding of college life and the academic expectations of colleges, including
choosing the right college that matches student abilities and interest.
Increase outreach to ESOL students not involved in the ESOL SSL Club.
Share best practices for creating and sustaining MCPS/community partnerships that support
ESOL SSL Clubs among the schools.
Examine reasons for limited impact of the SSL club on academic outcomes for Grade 10 and
Grade 11 students.

Montgomery County Public Schools Office of Shared Accountability
Program Evaluation 39 ESOL SSL Club
Strengths and Limitations Associated with the Design and Methods Used in the Study
The findings generated from the study will not establish a causal relationship between club
participation and the academic and nonacademic outcomes examined in the study due to lack of
random assignment of students to the club.
Strengths
a. Study design used statistical procedures to control for preexisting differences and reduce
selection bias. To control for potential differences between the students who joined the
club and their non-club peers, both matching and advanced statistical procedures were
applied.
b. Access to a variety of student-level information improved the quality of information. The
completeness and quality of information in MCPS databases was instrumental for
consistent reporting of each of the outcome variables at student level, grade, or course
level where applicable; the quality of data and variety of measures contributed to the
internal validity of the study.
c. A variety of academic and nonacademic outcomes were examined using a variety of
methods and data sources; this was a strength because it reflects the multidimensional
nature of the goals of the club and out-of-school learning opportunities from many
viewpoints. The variety of measures and data sources contributed to the external validity
of the study.
d. A relatively high response rate on the student survey (63%) comprised of respondents
from each grade level and across six schools, reflected a representative sample of high
school ESOL students.
Limitations
a. The use of quasi-experimental design could not adequately account for instances whereby
the ESOL students “compare notes” about their experiences in the club with their non-
club peers or influences of other interventions with similar goals that target ESOL
students.
b. The scope of this study was to examine outcomes and not to examine the implementation
of activities in the clubs per se. Therefore, there is limited information that would
supplement and aid the interpretation of the quantitative measurements related to
activities implemented by each club at the school level or expound on the nature of
MCPS community partnerships in each school.
c. The limited English language proficiency levels of the target population affected their
ability to: a) complete two open-ended questions on the student survey b) complete a
critical thinking assessment:

Montgomery County Public Schools Office of Shared Accountability
Program Evaluation 40 ESOL SSL Club
o Language demand of the student survey. The survey was pilot-tested; however, some
students needed their ESOL teachers to guide them through the survey. Responses to
the open-ended items for: a) the year they enrolled in MCPS and b) the grade they
enrolled in MCPS were not usable. In addition, researchers observed that some
students, who did not check that they were a current or previous club member,
answered some or all of questions related to the club. Subsequently, some background
information indicators were not reported or used to facilitate additional analyses as
previously intended.
o Language demand of critical thinking assessment. The initial design was to examine
club impact on club members’ critical thinking skills. Because the students were
learning English and the assessments required a good command of the English
language, the critical thinking assessment was not administered.
Acknowledgements
This study has benefitted from input and support from a wide number of individuals. We would
like to acknowledge the enthusiastic input and support from our collaborating partners:
1) Ms. Pamela Meador, coordinator, Service Learning Program, 2) Mr. James Walters,
Montgomery College, Takoma Park, 3) Ms. Jessica Wyatt, coordinator, Service Learning
Collaborative, Montgomery College, Takoma Park. Ms. Pamela Meador requested the study; the
three played important roles in clarifying the request, planning the study, developing and pilot
testing the instruments, and compiling club participation data. We thank the ESOL SSL club
advisors—Mrs. Katie M. Lazo, Ms. Margaret J. Vanbuskirk, Mrs. Julie P. Desai, Mrs. Lulu
Fetzer-Munoz, Mrs. Djina Satara-Petrovic, Ms. Emily A. Alexiou, Mr. Luis G. Arce, Ms. Yu
Ying Huang, and Mrs. Veena Seshadri for their on-site input on club activities, facilitating the
administration of online surveys, and participating in interviews; ESOL resource teachers helped
schedule the time for survey administration and achieve a reasonable response rate. The study
also benefitted from input and collaboration with other OSA staff specifically: Dr. Shahpar
Modaressi, supervisor, Program Evaluation Unit, for valuable guidance in the design of the study
and finalizing of this report; Mr. Kai C. Liu, accountability support specialist, Testing Unit, for
extracting and compiling data on ESOL students; Mrs. Natalie L. Wolanin, logistics support
specialist, Program Evaluation Unit, for file building and analysis of student surveys; and
Dr. Kecia L. Addison, supervisor, Applied Research Unit, for peer review.

Montgomery County Public Schools Office of Shared Accountability
Program Evaluation 41 ESOL SSL Club
References
American Youth Policy Forum. (2009). Issue brief: Moving English language learners to
college- and career-readiness. Washington, DC: American Youth Policy Forum.
Baldwin, S.C., Buchanan, A.M., & Rudisill, M.E. (2007). What teacher candidates learned
about diversity, social justice, and themselves from service-learning experiences.
Journal of Teacher Education, 58(4), 315–327.
Bordens, K.S. & Abbott, B.B. (2008). Research design and methods: A process approach.
(7th ed.). San Francisco, CA: McGraw Hill.
Borman, G.D., Slavin, R.E., Cheung, A., Chamberlain, A., Madden, N. & Chambers, B. “The
National Randomized Field Trial of Success for All: Second-Year Outcomes,” American
Educational Research Journal, Winter 2005, 42(4), 673–696.
Boyson, B.A. & Short, D.J. (2003). Secondary school newcomer programs in the United States.
Santa Cruz, CA: Center for Research on Education, Diversity & Excellence (CREDE).
Cohen, J. (1988). Statistical power analysis for the behavioral sciences (2nd ed.). Hillsdale, NJ:
Erlbaum.
Fink, S. (2011). Summary results of the Montgomery College—Takoma Park/Montgomery
County Public Schools partnership program. Rockville, MD: Montgomery County
Public Schools.
Fraenkel, J., & Wallen, N. (2009). How to design and evaluate research in education. (7th ed.).
Boston, MA: McGraw Hill.
Hooker, S. & Brand, B. (2009). Success at every step: How 23 programs support youth on the
path to college and beyond. Washington, DC: American Youth Policy Forum.
James, D.W., Jurich, S., & Estes, S. (2001). Raising minority academic achievement: A
compendium of education programs and practices. Washington, DC: American Youth
Policy Forum.
Latino Youth Collaborative Steering Committee, Montgomery County. (2010). Report of the
Latino Youth Collaborative Steering Committee Montgomery County, Maryland: A
generation of youth hanging in the balance. Retrieved November 15, 2011 from
http://www.montgomery countymd.gov/ content/home/pdf/lyc_ report.pdf.
Luellen, J.K., Shadish, W.R., & Clark, M.H. (2005). Propensity scores: An introduction and
experimental test. Evaluation Review, 29(6), 530–558.
Maryland State Department of Education. (2013). Service Learning in Maryland. Montgomery
County Service Learning Fact Sheet. Baltimore, MD.
Montgomery County Public Schools Office of Shared Accountability
Program Evaluation 42 ESOL SSL Club
Medina, J. (2009, January 25). In school for the first time, teenage immigrants struggle. The New
York Times, p. A1.
Montgomery County Public Schools. (2013a). Student service learning (SSL), give a little time
make a big difference: Guide for students and parents. Rockville, MD: Montgomery
County Public Schools.
Montgomery County Public Schools. (2013b). Student service learning (SSL) Program
Overview. Rockville, MD: Montgomery County Public Schools.
Montgomery County Public Schools. (2013c). Annual Report on our Call to Action. Rockville,
MD: Montgomery County Public Schools.
Montgomery County Public Schools. (2013d). Building our Future Together: Students, Staff,
and Community. Rockville, MD: Montgomery County Public Schools.
Pearson, S. (2002) Finding common ground: Service-learning and education reform—A survey
of 28 leading school reform models, Washington, DC: American Youth Policy Forum,
2002.
Perrin, N. (2009). Research methods to guide effective dissemination and implementation
projects. Retrieved November 21, 2011, from
https://wwwdev.iths.org/sites/wwwdev.iths.org/files/eventmedia/4DIRW%20Research%
20methods%20Perrin%20slides.pdf.
Pinzon, D.P. & Barriga, F.D.D. (2006). Critical thinking in a higher education service-learning
program. In J. Szente, Academic enrichment programs for culturally and linguistically
diverse children: A service learning experience. Childhood Education, 85(2), 113–117.
Rosenbaum P.R., Rubin D.B. (1984). Reducing bias in observational studies using
subclassification on the propensity score. Journal of the American Statistical
Association, 79. 516–524.
Schultz, R. & Vana, C. (2008). Coming to America: Minneapolis’s newcomer program. School
Administrator. Arlington, VA: 65(10), 18–19.
Shadish, W.R., Cook, T.D., & Campbell, D.T. (2002). Experimental & quasi-experimental
designs for generalized causal inference. Boston, MA: Houghton Mifflin.
Wasik, B.A. & Slavin, R.E. (1993). Preventing early reading failure with one-to-one tutoring: A
review of five programs. Reading Research Quarterly, 28(2), 178–200 Apr–Jun 1993.
World Class Instructional Design and Assessment (WIDA) Consortium, 2013). ACCESS for
ELLs Interpretative Guide for Score Reports: Spring 2013.
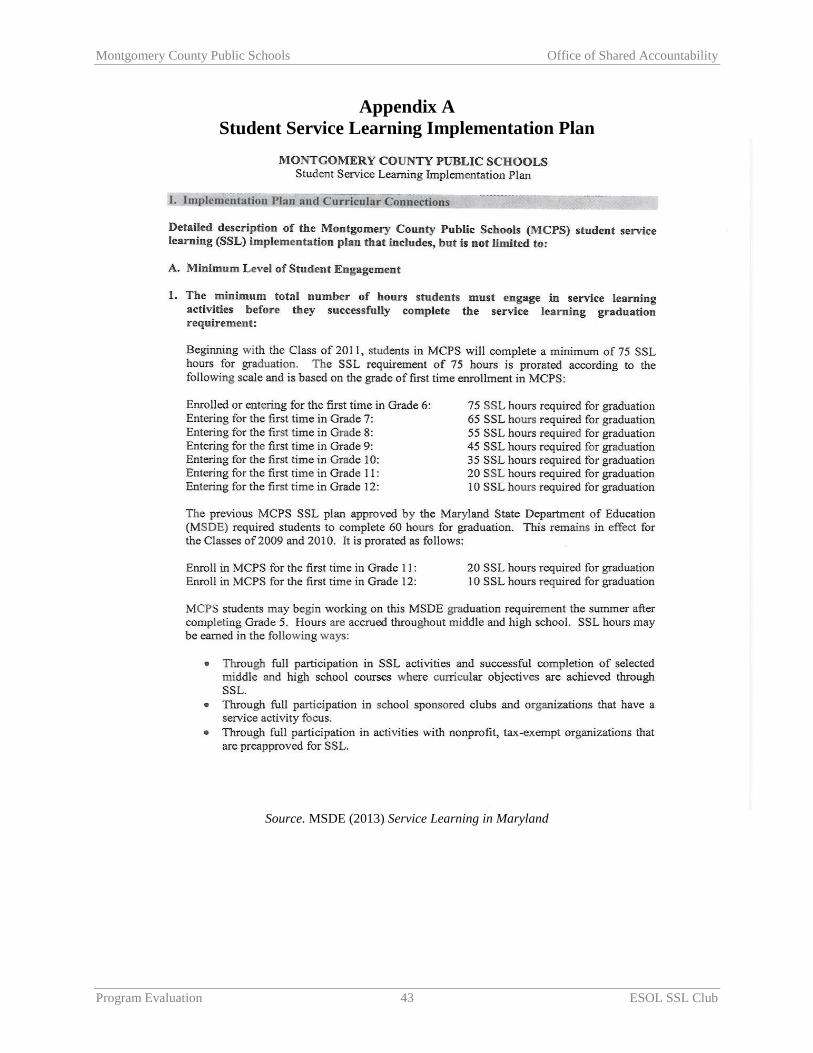
Montgomery County Public Schools Office of Shared Accountability
Program Evaluation 43 ESOL SSL Club
Appendix A
Student Service Learning Implementation Plan
Source. MSDE (2013) Service Learning in Maryland
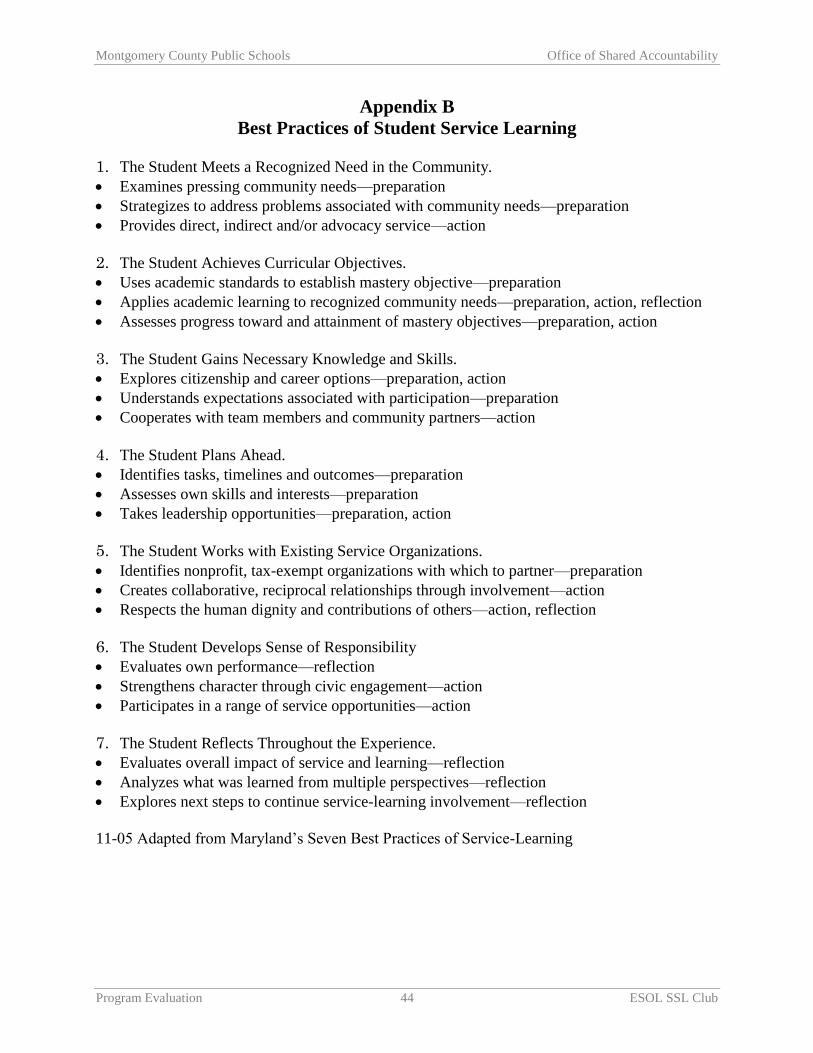
Montgomery County Public Schools Office of Shared Accountability
Program Evaluation 44 ESOL SSL Club
Appendix B
Best Practices of Student Service Learning
1. The Student Meets a Recognized Need in the Community.
Examines pressing community needs—preparation
Strategizes to address problems associated with community needs—preparation
Provides direct, indirect and/or advocacy service—action
2. The Student Achieves Curricular Objectives.
Uses academic standards to establish mastery objective—preparation
Applies academic learning to recognized community needs—preparation, action, reflection
Assesses progress toward and attainment of mastery objectives—preparation, action
3. The Student Gains Necessary Knowledge and Skills.
Explores citizenship and career options––preparation, action
Understands expectations associated with participation—preparation
Cooperates with team members and community partners—action
4. The Student Plans Ahead.
Identifies tasks, timelines and outcomes—preparation
Assesses own skills and interests—preparation
Takes leadership opportunities—preparation, action
5. The Student Works with Existing Service Organizations.
Identifies nonprofit, tax-exempt organizations with which to partner—preparation
Creates collaborative, reciprocal relationships through involvement—action
Respects the human dignity and contributions of others—action, reflection
6. The Student Develops Sense of Responsibility
Evaluates own performance—reflection
Strengthens character through civic engagement—action
Participates in a range of service opportunities—action
7. The Student Reflects Throughout the Experience.
Evaluates overall impact of service and learning—reflection
Analyzes what was learned from multiple perspectives—reflection
Explores next steps to continue service-learning involvement—reflection
11-05 Adapted from Maryland’s Seven Best Practices of Service-Learning
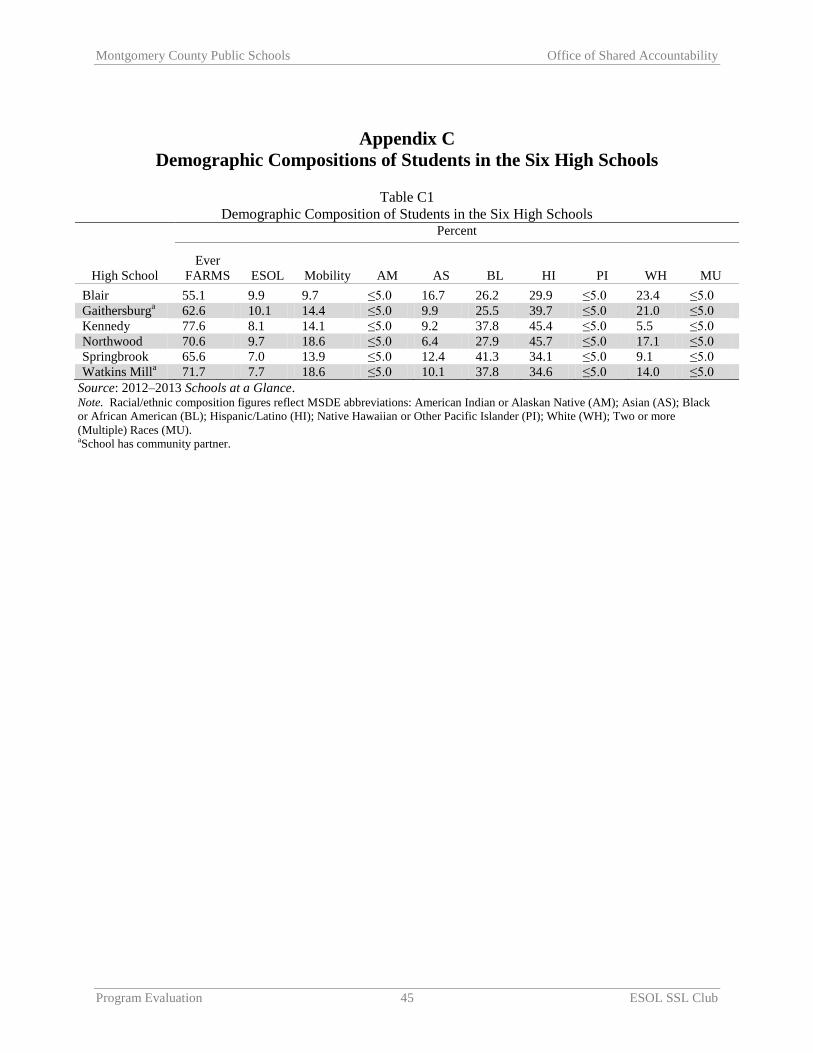
Montgomery County Public Schools Office of Shared Accountability
Program Evaluation 45 ESOL SSL Club
Appendix C
Demographic Compositions of Students in the Six High Schools
Table C1
Demographic Composition of Students in the Six High Schools
High School
Percent
Ever
FARMS ESOL Mobility AM AS BL HI PI WH MU
Blair 55.1 9.9 9.7 ≤5.0 16.7 26.2 29.9 ≤5.0 23.4 ≤5.0
Gaithersburga
62.6 10.1 14.4 ≤5.0 9.9 25.5 39.7 ≤5.0 21.0 ≤5.0
Kennedy 77.6 8.1 14.1 ≤5.0 9.2 37.8 45.4 ≤5.0 5.5 ≤5.0
Northwood 70.6 9.7 18.6 ≤5.0 6.4 27.9 45.7 ≤5.0 17.1 ≤5.0
Springbrook 65.6 7.0 13.9 ≤5.0 12.4 41.3 34.1 ≤5.0 9.1 ≤5.0
Watkins Milla
71.7 7.7 18.6 ≤5.0 10.1 37.8 34.6 ≤5.0 14.0 ≤5.0
Source: 2012–2013 Schools at a Glance. Note. Racial/ethnic composition figures reflect MSDE abbreviations: American Indian or Alaskan Native (AM); Asian (AS); Black
or African American (BL); Hispanic/Latino (HI); Native Hawaiian or Other Pacific Islander (PI); White (WH); Two or more
(Multiple) Races (MU). aSchool has community partner.

Montgomery County Public Schools Office of Shared Accountability
Program Evaluation 46 ESOL SSL Club
Appendix D
Demographic Characteristics of ESOL Students in the Six High School SSL Club
Table D1
Demographic Characteristics of ESOL Students in the Six High School SSL Club
Characteristics
Gaithersburg
(N = 250)
Kennedy
(N = 154)
Blair
(N = 314)
Northwood
(N = 169)
Springbrook
(N = 146)
Watkins Mill
(N = 126)
n % n % n % n % n % n %
Gender Female 123 49.2 62 40.3 132 42 73 43.2 59 40.4 59 46.8
Male 127 50.8 92 59.7 182 58 96 56.8 87 59.6 67 53.2
Race
Amind 0 0 0 0 0 0 0 0 0 0 0 0
Asian 24 9.6 19 12.3 20 6.4 18 10.7 15 10.3 18 14.3
AfamBlack 32 12.8 33 21.4 103 32.8 34 20.1 44 30.1 25 19.8
White 5 2 1 0.6 2 0.6 8 4.7 0 0 1 0.8
Hispanic 188 75.2 100 64.9 189 60.2 108 63.9 87 59.6 82 65.1
Grade
9 135 54 81 52.6 127 40.4 99 58.6 63 43.2 56 44.4
10 61 24.4 36 23.4 81 25.8 36 21.3 39 26.7 33 26.2
11 24 9.6 19 12.3 56 17.8 22 13 19 13 17 13.5
12 30 12 18 11.7 50 15.9 12 7.1 25 17.1 20 15.9
FARMS
Never FARMS 30 12 16 10.4 21 6.7 19 11.2 15 10.3 7 5.6
Prior to 2013
FARMS 34 13.6 27 17.5 43 13.7 25 14.8 18 12.3 11 8.7
FARMS in 2013 186 74.4 111 72.1 250 79.6 125 74 113 77.4 108 85.7
SPECIAL Ed
Never Special
Ed 244 97.6 148 96.1 306 97.5 165 97.6 141 96.6 119 94.4
Special Ed in
2013 6 2.4 6 3.9 8 2.5 3 1.8 5 3.4 7 5.6
SSL Club
Not in Club 148 59.2 106 68.8 239 76.1 117 69.2 89 61 108 85.7
SSL Club 101 40.4 48 31.2 72 22.9 51 30.2 56 38.4 18 14.3

Montgomery County Public Schools Office of Shared Accountability
Program Evaluation 47 ESOL SSL Club
Appendix E
ESOL Student Service Learning Activities as Described by Schools
Table E1
Description of ESOL SSL Club Activities Through Which Students Earned SSL Hours by School
School Activities Blair
(23 Activities) Club Introduction/Welcome Back Sem2 – (2)
Prep for Weekend Activities – (6)
Behavior at Activities/Club
SSL Paperwork
Sign for Parade Float with Department of Environmental Protection
Labeling Newsletters with PTA – (2) (Note: this also included taking critical thinking
pre-test)
Card Making for NIH – (3)
Community Sing
Financial Aid and Admissions from Montgomery College
Introduction Walk for Water – (2)
OSA Pilot Test
Community Dance
Critical Thinking Post Test
Gaithersburg
(33 Activities) Eco Lunch/Eco Trip to Audubon/Eco SSL Form Help – (5)
Pumpkin Patch
Cheers for volunteers
Seneca Creek clean up
Raking leaves
Smith Center Orientation/Trip/Reflection – (3)
Migration Lessons (2)
ESOL Science class
Recycling planning/Trip – (2)
Green Building Learning
Gaithersburg Environmental Award group work
Bag It video – (2)
Writing for MCPS
Water Summit at Bohrer Park
Verification form completion
Calendar planning
Watershed lesson - (2)
Rake Lake
Public Comment Process Lesson, City of Gaithersburg
Bohrer Park Clean up
Meador Post evaluation lesson
Soil and mulch lesson
Bohrer Park Cleanup and Picnic
Kennedy
(22 Activities) Introduction/Welcome back – (2)
PTSA Mail Sorting
Intro Weekend Activities – (3)
SSL Paperwork/Forms – (2)
Coupons – (2)
Sign for Parade Float with Department of Environmental Protection
Holiday Cards for Soldiers
Card Making for NIH (2)

Montgomery County Public Schools Office of Shared Accountability
Program Evaluation 48 ESOL SSL Club
Table E1
Description of ESOL SSL Club Activities Through Which Students Earned SSL Hours by School
School Activities Critical Thinking Pre-test
Unspecified
Walk for Water Intro/Signs – (2)
Prep work for PTK ceremony
Montgomery College Financial Aid/Admissions (2)
Critical Thinking Post Test
Northwood
(23 Activities) Introduction/Welcome back – (2)
Intro Weekend Activities – (4)
Coupons (3)
Intro to Weekend/Applications for PTK Ceremony/Coupons
Sign for Parade Float with Department of Environmental Protection
Holiday Cards for Soldiers
Critical Thinking Pre-test/Post-test - (2)
Knitting/Crochet – (4)
Intro to Community Sing
Montgomery College Financial Aid/Admissions - (2)
Walk for Water Signs/Booklets – (2)
Springbrook
(17 Activities) Intro Meeting
Thanksgiving project
Christmas project
Valentine’s Day project
Montgomery County Workshop
Book project
Mother’s Day
Dancer
Children’s Book
Unspecified – (8)
Watkins Mill
(9 Activities) Unspecified – (9)
Additional Activities Documented for Blair HS Students (N = 92)
Activity by students n %
Business Conference for Latina Women at MCC 16 17.4
National Book Festival 13 14.1
Pyramid Atlantic Yard Sale/Fundraiser (Oct. 13) 12 13.0
Takoma Park Library Book Sale 12 13.0
Hope House Halloween Party 10 10.9
Hope House Mural Restoration at Montgomery College 8 8.7
Cultural Arts Center Performance at MCC-TP/SS 7 7.6
Pancake Breakfast at Pyramid Atlantic 6 6.5
Phi Theta Kappa Induction Ceremony-April 5 5.4
Pyramid Atlantic Basketball Tournament 5 5.4
Takoma Park Street Festival 5 5.4
Tie Dye for the Children’s Inn at NIH 5 5.4
Carpe Diem Arts Community Sing (Apr. 21) 4 4.3
Carpe Diem Arts Community Dance 3 3.3
Pyramid Atlantic Yard Sale/Fundraiser (Dec. 1) 3 3.3
Phi Theta Kappa Induction Ceremony-November 2 2.3
Sign Making for Walk for Water 2 2.3
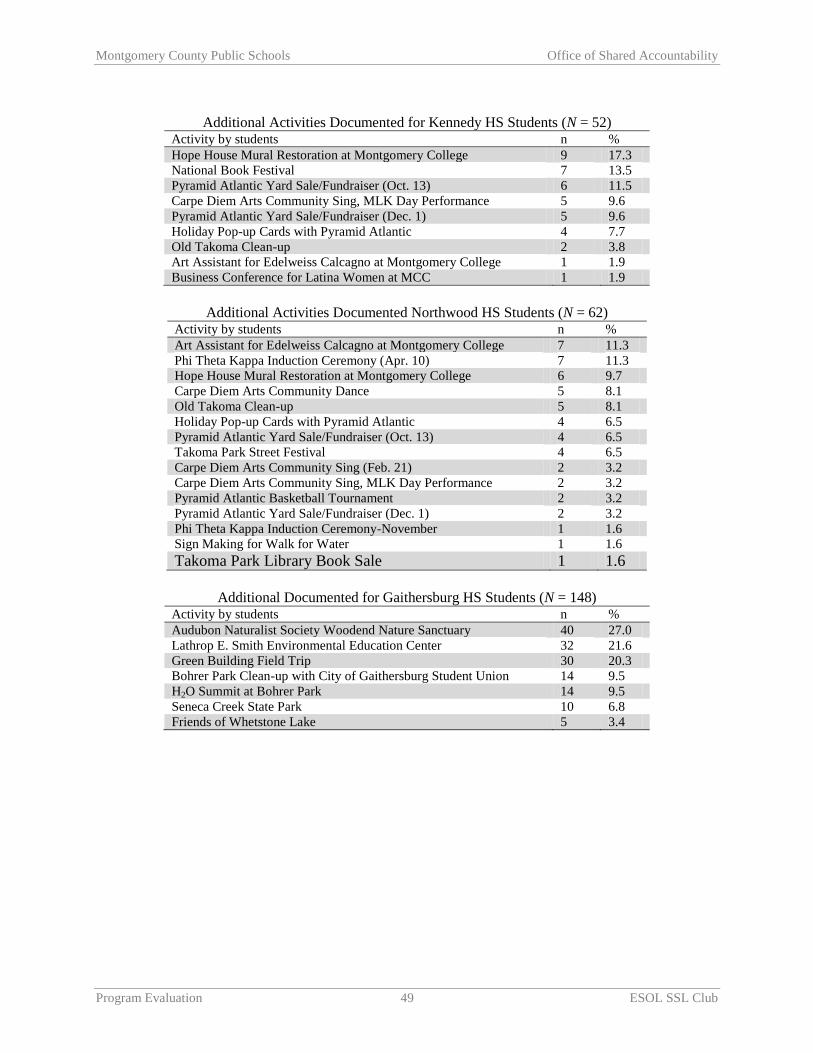
Montgomery County Public Schools Office of Shared Accountability
Program Evaluation 49 ESOL SSL Club
Additional Activities Documented for Kennedy HS Students (N = 52)
Activity by students n %
Hope House Mural Restoration at Montgomery College 9 17.3
National Book Festival 7 13.5
Pyramid Atlantic Yard Sale/Fundraiser (Oct. 13) 6 11.5
Carpe Diem Arts Community Sing, MLK Day Performance 5 9.6
Pyramid Atlantic Yard Sale/Fundraiser (Dec. 1) 5 9.6
Holiday Pop-up Cards with Pyramid Atlantic 4 7.7
Old Takoma Clean-up 2 3.8
Art Assistant for Edelweiss Calcagno at Montgomery College 1 1.9
Business Conference for Latina Women at MCC 1 1.9
Additional Activities Documented Northwood HS Students (N = 62)
Activity by students n %
Art Assistant for Edelweiss Calcagno at Montgomery College 7 11.3
Phi Theta Kappa Induction Ceremony (Apr. 10) 7 11.3
Hope House Mural Restoration at Montgomery College 6 9.7
Carpe Diem Arts Community Dance 5 8.1
Old Takoma Clean-up 5 8.1
Holiday Pop-up Cards with Pyramid Atlantic 4 6.5
Pyramid Atlantic Yard Sale/Fundraiser (Oct. 13) 4 6.5
Takoma Park Street Festival 4 6.5
Carpe Diem Arts Community Sing (Feb. 21) 2 3.2
Carpe Diem Arts Community Sing, MLK Day Performance 2 3.2
Pyramid Atlantic Basketball Tournament 2 3.2
Pyramid Atlantic Yard Sale/Fundraiser (Dec. 1) 2 3.2
Phi Theta Kappa Induction Ceremony-November 1 1.6
Sign Making for Walk for Water 1 1.6
Takoma Park Library Book Sale 1 1.6
Additional Documented for Gaithersburg HS Students (N = 148)
Activity by students n %
Audubon Naturalist Society Woodend Nature Sanctuary 40 27.0
Lathrop E. Smith Environmental Education Center 32 21.6
Green Building Field Trip 30 20.3
Bohrer Park Clean-up with City of Gaithersburg Student Union 14 9.5
H2O Summit at Bohrer Park 14 9.5
Seneca Creek State Park 10 6.8
Friends of Whetstone Lake 5 3.4

Montgomery County Public Schools Office of Shared Accountability
Program Evaluation 50 ESOL SSL Club
Table E2
Number and Percent of Respondents Indicating When They First Decided to Go to College
Respondents grade/club
membership
Before ninth
grade
In ninth
grade
In tenth
grade
In eleventh
grade
In twelfth
grade Not decided
n % n % n % n % n % n %
12
Club (n = 48) 22 45.8 6 12.5 1 2.1 9 18.8 6 12.5 4 8.3
Non-club (n = 19) 6 31.6 6 31.6 0 .0 2 10.5 0 0 5 26.3
11
Club (n = 45) 21 46.7 4 8.9 5 11.1 13 28.9 n/a n/a 2 4.4
Non-club (n = 67) 29 43.3 7 10.4 9 13.4 16 23.9 n/a n/a 2 3.0
10
Club (n = 120) 40 33.3 21 17.5 26 21.7 n/a n/a n/a n/a 16 13.3
Non-club (n = 59) 17 28.8 11 18.6 13 22.0 n/a n/a n/a n/a 11 18.6
9
Club (n = 127) 57 44.9 31 24.4 n/a n/a n/a n/a n/a n/a 23 18.1
Non-club (n = 86) 43 50.0 19 22.1 n/a n/a n/a n/a n/a n/a 17 19.8
Table E3
Actions Students Have Taken to Prepare and Plan for College by Grade
Grade 9
(N = 162)
Grade 10
(N = 174)
Grade 11
(N = 109)
Grade 12
(N = 67)
n % n % n % n %
Visit college websites 46 22.3 49 28.2 47 43.1 28 41.8
Visited at least one college campus 52 25.2 35 20.1 27 24.8 24 35.8
Talk with a school counselor about
college options 42 20.4 37 21.3 48 44.0 30 44.8
Talk to parents/family about my plans 103 50.0 85 48.9 66 60.6 40 59.7
Working to bring up GPA 94 45.6 83 47.7 65 59.6 38 56.7
Getting more involved in extra-
curriculars 30 14.6 22 12.6 17 15.6 13 19.4
Took a college prep class at school 7 3.4 5 2.9 10 9.2 14 20.9
Taking a tutoring class outside school 3 1.5 0 0.0 2 1.8 3 4.5
Plan to take ACT 30 14.6 29 16.7 36 33.0 4 6.0
Plan to take SAT 40 19.4 44 25.3 55 50.5 10 14.9
Taken ACCUPLACER 6 2.9 9 5.2 5 4.6 16 23.9
Taken TOEFL 13 6.3 15 8.6 3 2.8 7 10.4
Have earned all SSL hours 21 10.2 27 15.5 22 20.2 38 56.7
Taken SAT 5 2.4 1 0.6 1 0.9 14 20.9
Taken ACT 3 1.5 3 1.7 3 2.8 11 16.4
Other 1 0.5 2 1.1 2 1.8 0 0.0
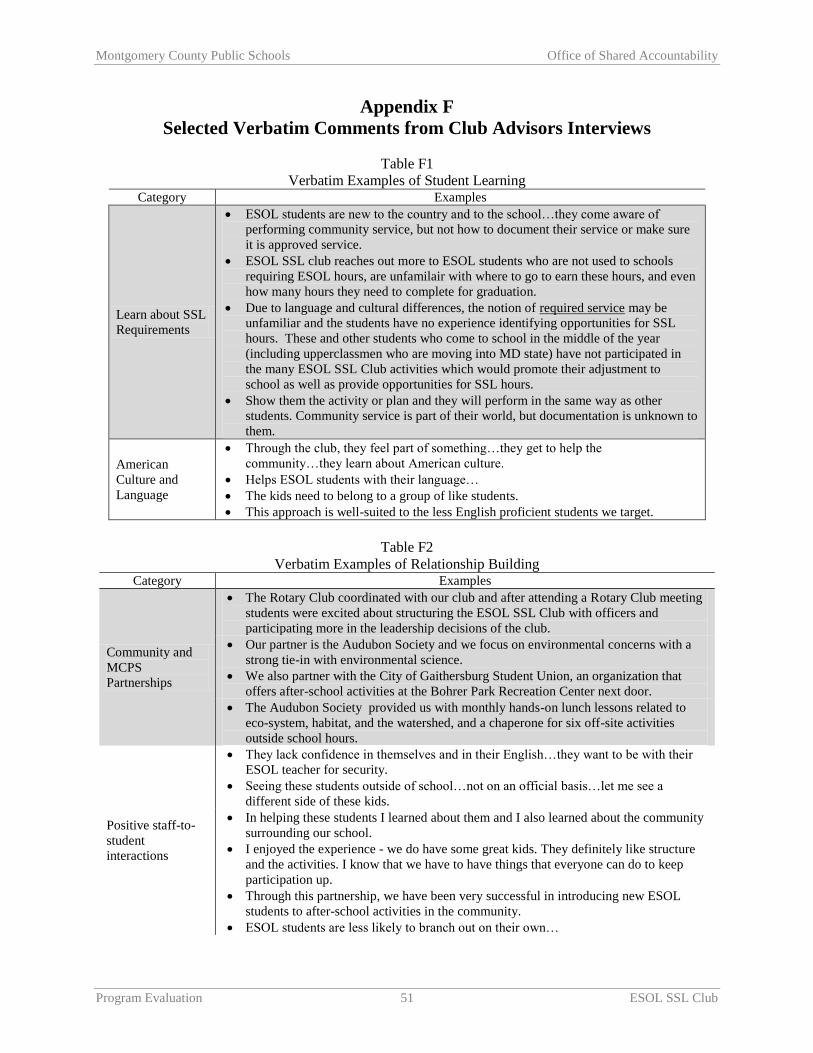
Montgomery County Public Schools Office of Shared Accountability
Program Evaluation 51 ESOL SSL Club
Appendix F
Selected Verbatim Comments from Club Advisors Interviews
Table F1
Verbatim Examples of Student Learning Category Examples
Learn about SSL
Requirements
ESOL students are new to the country and to the school…they come aware of
performing community service, but not how to document their service or make sure
it is approved service.
ESOL SSL club reaches out more to ESOL students who are not used to schools
requiring ESOL hours, are unfamilair with where to go to earn these hours, and even
how many hours they need to complete for graduation.
Due to language and cultural differences, the notion of required service may be
unfamiliar and the students have no experience identifying opportunities for SSL
hours. These and other students who come to school in the middle of the year
(including upperclassmen who are moving into MD state) have not participated in
the many ESOL SSL Club activities which would promote their adjustment to
school as well as provide opportunities for SSL hours.
Show them the activity or plan and they will perform in the same way as other
students. Community service is part of their world, but documentation is unknown to
them.
American
Culture and
Language
Through the club, they feel part of something…they get to help the
community…they learn about American culture.
Helps ESOL students with their language…
The kids need to belong to a group of like students.
This approach is well-suited to the less English proficient students we target.
Table F2
Verbatim Examples of Relationship Building Category Examples
Community and
MCPS
Partnerships
The Rotary Club coordinated with our club and after attending a Rotary Club meeting
students were excited about structuring the ESOL SSL Club with officers and
participating more in the leadership decisions of the club.
Our partner is the Audubon Society and we focus on environmental concerns with a
strong tie-in with environmental science.
We also partner with the City of Gaithersburg Student Union, an organization that
offers after-school activities at the Bohrer Park Recreation Center next door.
The Audubon Society provided us with monthly hands-on lunch lessons related to
eco-system, habitat, and the watershed, and a chaperone for six off-site activities
outside school hours.
Positive staff-to-
student
interactions
They lack confidence in themselves and in their English…they want to be with their
ESOL teacher for security.
Seeing these students outside of school…not on an official basis…let me see a
different side of these kids.
In helping these students I learned about them and I also learned about the community
surrounding our school.
I enjoyed the experience - we do have some great kids. They definitely like structure
and the activities. I know that we have to have things that everyone can do to keep
participation up.
Through this partnership, we have been very successful in introducing new ESOL
students to after-school activities in the community.
ESOL students are less likely to branch out on their own…

Montgomery County Public Schools Office of Shared Accountability
Program Evaluation 52 ESOL SSL Club
Table F2
Verbatim Examples of Relationship Building Category Examples
Student-to-student
relationships
Students have become a part of a school club…learned how to help the
community…able to earn the service hours that they need…want to belong to a group
and without the club they couldn’t have earned the hours they needed.
The club has participated in the public comment process.
Students work with those peers that they are comfortable with and the structure
provided by the leader of the club helps a great deal. Having one or two activities a
week that the kids can participate in together is good.
I want to let the kids take leadership and let them think of projects to earn SSL hours.
Table F3
Verbatim Examples of Agencies and Individuals Who Contributed to Success of ESOL SSL Club Category Examples
Staff
The ESOL teacher is essential to bringing these kids into the club.
The most important resource for the club is a teacher sponsor whom students know,
like, and trust.
MCPS SSL Coordinator and the ESOL teachers who would push our organization to
their students…telling them about getting involved and earning SSL
hours…informing them of upcoming events.
MCPS SSL Coordinator provided us with the most support…support for materials
and events.
The club leader from Montgomery College has done very well connecting with the
students. She is very competent and organized and encourages the kids to participate
in activities in their communities. She has had them participate in community clean
ups and various cultural events, etc.
Organizations We also partner with the City of Gaithersburg Student Union. Through this
partnership, we have been very successful in introducing new ESOL students to after-
school activities in the community.
Students
Trying to communicate through English is tough although possible with the help of
the more proficient students. Students bring friends with them.
Perhaps due to the varied and extensive outreach, club membership includes a variety
of students from the newest ESOL beginners in 9th grade to 12th graders in need of
emergency hours and non-ESOL bilingual students who hear the announcements and
want to get involved. This mix of students has had the unexpected consequence of
providing bilingual mentoring, role models, and motivation for new ESOL students.
Table F4
Suggestions for Enhancing the ESOL SSL Club Category Examples
Suggestions
Many students work after school or have transportation issues so it's a good idea to
keep most activities close to the local neighborhoods as much as possible.
Maybe some projects within the school from time to time would be good too.
I strongly believe 45 hours should be embedded in high school courses that all
students have access to (including each ESOL level). Extra-curricular activities are
worth their weight in gold but place an undue burden on students and teachers.
We need to try to do more things at school because transportation to events is a
problem. Having community events close to the school so we wouldn’t need buses
would help.
If we continue to target newcomer students, a bilingual sponsor may be more
effective and less stressed.