Embed Size (px)
Citation preview

SUPPORTING STUDENTS’ UNDERSTANDING OF
PERCENTAGE
MASTER THESIS
Veronika Fitri Rianasari
NIM 09715014
SURABAYA STATE UNIVERSITY
POSTGRADUATE PROGRAM
MATHEMATICS EDUCATION STUDY PROGRAM
2011

SUPPORTING STUDENTS’ UNDERSTANDING OF
PERCENTAGE
MASTER THESIS
A Thesis Submitted to Surabaya State University Postgraduate Program
as a Partial Fulfillment of the Requirements
for the Degree of Master of Science
in Mathematics Education Program
Veronika Fitri Rianasari
NIM 09715014
SURABAYA STATE UNIVERSITY
POSTGRADUATE PROGRAM
MATHEMATICS EDUCATION STUDY PROGRAM
2011

iii
DEDICATION
This thesis is dedicated to my parents, my sisters and my
brothers who give me never ending love and supports.
It is also dedicated to my fiancé who has been a great source of
my motivation and inspiration.
I Love You

iv
ABSTRACT
Rianasari, Veronika Fitri. 2011. Supporting Students’ Understanding of
Percentage. Master Thesis, Mathematics Education Study Program, Master
Program of Surabaya State University. Supervisor: (I) Prof. I Ketut Budayasa,
Ph.D., and (II) Sitti Maesuri Patahuddin, Ph.D.
Keywords: design research, percentage, understanding, pre knowledge,
contextual situations, bar models
Many researches revealed that pupils often find difficulties to understand
percentage although they are able to recite percent as per hundred and carry out
the computations correctly. This might happen due to the way in which the
learning percentage has been taught that tends to focus on procedures and recall
instead of getting a real understanding of percentage. Considering this facts, this
research aimed to develop a local instructional theory to support students to
extend their understanding of percentage. This research used design research
method as an appropriate means to achieve the research aim.
In Realistic Mathematics Education approach, in which the basic concept is
rooted from Freudenthals’ idea, mathematics is the activity of organizing matter
from reality. Therefore, mathematics should be experientially real for the students.
Consequently, in this research the instructional activities were designed through
exploring some contextual situations in which percentages play role.
This research involved students and mathematics teachers of grade 5 in SD
Laboratorium UNESA and SD BOPKRI III Demangan Baru Yogyakarta. The
research conducted in SD Laboratorium UNESA was conducted in two cycles and
it aimed at trying out the initial hypothetical learning trajectory. The research in
SD Laboratorium UNESA became the preliminary researches of the research in
SD BOPKRI III. In this research, the students involved were the students who
have learned about percentage. Therefore they had pre knowledge about
percentage. Most of the students were get used to work in formal level in solving
percentage problems.
The result of the teaching experiment showed that students’ pre knowledge
influenced their learning process. In some cases most of the students tended to do
procedural computations, which probably did not make sense for them, instead of
using their common sense. The result of the teaching experiment also showed that
investigating contextual situations in which percentage play a role could stimulate
students to extend their understanding of percentage. Students’ learning process in
extending their understanding was started from developing sense of fullness of
percentage, which afterwards continued to constructing the meaning of percent
itself. Based on this basic knowledge, they were given opportunities to construct
sense of percentage as a relative value and also to apply this knowledge in a
situation in which the percentages are needed. Furthermore, the students expanded
their knowledge to percentage greater than a hundred. Through the learning
process, the students also got opportunities to explore some strategies such as
using benchmark percentages or using bar model. These strategies seemed to
make sense for them rather than procedural algorithm strategies.

v
ABSTRAK
Rianasari, Veronika Fitri. 2011. Upaya-Upaya yang Mendukung Pemahaman
Siswa Mengenai Persentase. Tesis, Program Studi Pendidikan Matematika,
Program Pascasarjana Universitas Negeri Surabaya. Pembimbing: (I) Prof. I Ketut
Budayasa, Ph.D., dan (II) Sitti Maesuri Patahuddin, Ph.D.
Kata-kata Kunci: penelitian desain, persentase, pemahaman, pemahaman awal,
situaasi kontekstual, model bar
Banyak penelitian menunjukkan bahwa siswa sering menemukan kesulitan
untuk memahami persentase meskipun mereka bisa mengungkapkan bahwa
persen adalah per seratus dan dapat melakukan perhitungan dengan benar. Hal ini
mungkin terjadi karena pembelajaran persentase cenderung berfokus pada
prosedur dan ingatan dan bukan pada pemahaman mengenai persentase.
Menyadari fakta-fakta ini, penelitian ini bertujuan untuk mengembangkan teori
instruksional lokal untuk mendukung siswa untuk memperluas pemahaman
mereka mengenai persentase. Penelitian ini menggunakan metode penelitian
desain sebagai metode yang tepat utnuk mencapai tujuan penelitian.
Dalam pendekatan Pendidikan Matematika Realistik, yang konsep dasarnya
berakar dari ide Freudenthal, matematika harus berdasarkan pengalaman yang
nyata bagi siswa. Sehingga, dalam penelitian ini kegiatan instruksional dirancang
melalui eksplorasi situasi-situasi kontekstual yang melibatkan persentase.
Penelitian ini melibatkan siswa-siswa dan guru-guru matematika kelas 5 di
SD Laboratorium Unesa dan SD Bopkri III Demangan Baru Yogyakarta.
Penelitian di SD Laboratorium Unesa dilakukan dalam dua siklus dan bertujuan
untuk mengujicobakan desain pembelajaran awal. Penelitian di SD Laboratorium
Unesa menjadi penelitian awal bagi penelitian di SD Bopkri III. Dalam penelitian
ini, siswa yang terlibat adalah siswa yang telah belajar persentase. Oleh karena
itu, mereka memiliki pengetahuan awal mengenai persentase. Sebagian besar
siswa terbiasa memecahkan masalah persentase dengan cara yang formal.
Hasil eksperimen menunjukkan bahwa pengetahuan awal siswa berpengaruh
pada proses belajar mereka. Pada beberapa kasus, sebagian besar siswa cenderung
melakukan perhitungan prosedural, yang mungkin tidak masuk akal bagi mereka,
daripada menggunakan penalaran. Hasil eksperimen juga menunjukkan bahwa
investigasi situasi kontekstual yang melibatkan persentase dapat menstimulasi
siswa untuk memperluas pemahaman mereka mengenai persentase. Proses belajar
siswa dalam memperluas pemahaman mereka dimulai dari mengembangkan sense
persentase, yang kemudian dilanjutkan dengan mengkonstruksi arti persen.
Berdasarkan pemahaman dasar ini, mereka diberi kesempatan untuk
mengkonstruksi makna persentase sebagai nilai relatif dan juga menggunakan
pengetahuan ini dalam situasi yang membutuhkan persentase. Selanjutnya, siswa-
siswa memperluas pengetahuan mereka mengenai persentase yang lebih besar dari
seratus. Melalui proses belajar ini, siswa juga mendapatkan kesempatan untuk
mengeksplorasi beberapa strategi seperti persentase sederhana atau model bar.
Strategi-strategi ini tampak lebih bermakna bagi mereka dibandingkan strategi
yang menggunakan perhitungan prosedural.
vi
ACKNOWLEDGEMENT
In the first place I would like to offer my highest gratitude to Jesus Christ,
my Lord and my Saviour who always gives me His endless love and guides my
life. I would like to thank Jesus Christ for letting me accomplish this master thesis
entitled Supporting Students’ Understanding of Percentage.
This master thesis would not have been possible without the guidance,
supports, assistance, and encouragement from many people. I would like to
present my purest gratitude to all wonderful people with their great and valuable
help and encouragement during my struggle on this journey of study.
First and foremost, I gratefully acknowledge Prof. I Ketut Budayasa, Ph.D,
Sitti Maesuri, Ph.D, as my supervisors for their supervision, advice, and guidance.
I also gratefully acknowledge Barbara van Amerom as my Dutch supervisor for
her help, supports and guidance from the early stage of this research. I truly and
deeply respect and admire them.
Second, I like to offer my gratitude to the member of my master thesis
examiners and reviewers, Prof. Dr. Sitti Maghfirotun Amin, M.Pd., Dr. Agung
Lukito, M.S. and Prof. Dr. R. K. Sembiring for their valuable input, suggestions
and feedback on my master thesis. This master thesis would not have been
possible without their valuable suggestions, criticisms and questions for the
improvement of this master thesis.
Third, I dedicated my gratefully thank to Prof. Dr. I Ketut Budayasa, Ph.D
as the Director of Post Graduate Program and to Dr. Agung Lukito, M.S as the
Head of Mathematics Education Master Program. Their support and help to this
study program enable us to cope with any problems related to the management of
the program, especially for International Master Program on Mathematics
Education (IMPoME). Moreover, I dedicated my gratefully thank to all of my
lecturers in Post Graduate Program of Mathematics Education of Surabaya State
University for their supports and guidance during my study. I also dedicated my
gratefully thank to all my lecturers in Freudenthal Institute of Utrecht University
in Netherland for their supports and guidance during my one year study in
Netherland. I would like to dedicate my gratitude for them for spending their
precious time during this study.
Fourth, my sincere gratitude is dedicated to my colleagues in this master
program, especially for the eleven students of IMPoME 2009. They were my
family when I was far from my home. They have been motivating colleagues who
always give help and supports during my study. Thanks for our beautiful
friendship!
Finally, last but definitely not least, I am most grateful to the most
wonderful people of my life. My father, Markus Ramen Sudiran, has always been

vii
a caring father who always motivates and encourages me to pursue this life. My
mother, Khatarina Mariani, has always been my source of energy with her endless
prayers, love and care. My sisters, Theresia Renny Andarwati and Yoanne Dian
Retnosari, and my brothers, Iwan Wijayanto and Agustinus Heru Aprianto, have
always been my motivation with their advice and love. Moreover, my deepest
gratitude will be delivered to my lovely fiancé, Nobertus Ribut Santoso, who
always loves me and has been my source of motivation and inspiration. For all
these wonderful people of my life, I would like to dedicate my greatefully thank
for all of you. I feel so blessed to have you in my life. I love you so much.
Veronika Fitri Rianasari

viii
TABLE OF CONTENTS
APPROVAL ............................................................................................................ ii
DEDICATION ....................................................................................................... iii
ABSTRACT ...................................................................................................................... iv
ABSTRAK ......................................................................................................................... v
TABLE OF CONTENTS .............................................................................................. viii
LIST OF FIGURES ......................................................................................................... xi
LIST OF TABLES .......................................................................................................... xii
LIST OF APPENDICES ............................................................................................... xiii
1 INTRODUCTION ...................................................................................................... 1
1.1 Background .............................................................................................. 1
1.2 Research Question .................................................................................... 3
1.3 Aim of the Research ................................................................................. 3
1.4 Definition of Key Terms .......................................................................... 4
1.5 Significance of the research...................................................................... 5
1.6 Assumptions ............................................................................................. 6
2 THEORETICAL FRAMEWORK ............................................................................ 7
2.1 Percentage ................................................................................................ 7
2.1.1 Percentage as part whole relationship ................................................ 7
2.1.2 Percentage as a ratio .......................................................................... 8
2.2 The Didactical Use of Bar Model ........................................................... 10
2.3 The strategies to work with percentage .................................................. 11
2.4 Realistic Mathematics Education ........................................................... 12

ix
2.5 Emergent Perspective ............................................................................. 14
2.6 Percentage in the Indonesian Curriculum for 5th grade .......................... 16
2.7 Hypothetical Learning Trajectory .......................................................... 17
2.8 Hypothetical Learning Trajectory of the Preliminary Researches ......... 18
2.8.1 Hypothetical Learning Trajectory 1 ................................................. 18
2.8.2 Hypothetical Learning Trajectory 2 ................................................. 39
3 RESEARCH METHOD ........................................................................................... 45
3.1 Design Research Methodology .............................................................. 45
3.2 Research Subjects ................................................................................... 47
3.3 Data Collection ....................................................................................... 47
3.4 Data Analysis, Reliability, and Validity ................................................. 48
3.4.1 Data Analysis ................................................................................... 48
3.4.2 Reliability ......................................................................................... 49
3.4.3 Validity ............................................................................................ 50
4 THE IMPROVED HYPOTHETICAL LEARNING TRAJECTORY ............... 51
5 RETROSPECTIVE ANALYSIS ............................................................................ 61
5.1 Pre test .................................................................................................... 62
5.1.1 Exploring students’ sense of fullness of percentage ........................ 62
5.1.2 Exploring students’ prior knowledge of the meaning of percent ..... 63
5.1.3 Exploring students’ acquisition in working with percentage greater
than a hundred .................................................................................. 67
5.1.4 Exploring students’ acquisition in using their prior knowledge to
solve a problem ................................................................................ 68
5.1.5 Conclusion of the pre test ................................................................ 70
5.2 Retrospective Analysis of the HLT 3 ..................................................... 71

x
5.2.1 Developing sense of fullness of percentage ..................................... 71
5.2.2 Constructing the meaning of percent ............................................... 77
5.2.3 Constructing sense of percentage as a relative value ....................... 87
5.2.4 Using percentage in proportional comparison problem ................... 94
5.2.5 Expanding knowledge to percentage greater than 100 .................. 101
5.3 Post test ................................................................................................. 106
5.4 Discussion ............................................................................................ 109
5.4.1 Contextual Situation ...................................................................... 110
5.4.2 Intertwinement of mathematical topics .......................................... 110
6 CONCLUSIONS ..................................................................................................... 112
6.1 Answer to the research question ............................................................ 112
6.2 Local Instructional Theory .................................................................... 117
6.3 The Weaknesses of the Research .......................................................... 120
6.4 Recommendation ................................................................................... 121
6.4.1 Reflection ........................................................................................ 121
6.4.2 Revision .......................................................................................... 122
6.4.3 Recommendation for further research ............................................ 123
REFERENCES ............................................................................................................. 126
VISUALIZATION OF THE LEARNING TRAJECTORY................................... 129

xi
LIST OF FIGURES
Figure 5.1 Some of students’ works in determining percentage ........................... 66
Figure 5.2 Rio’s answer in the pre test in determining the sweeter drink ............. 69
Figure 5.3 Various students’ strategies to estimate the percentage of loading
process ................................................................................................................... 73
Figure 5.4 Students’ work in shading the loading bar .......................................... 76
Figure 5.5 Bar model used to estimate percentage of the area used to plant chilli 80
Figure 5.6 One of students’ strategies using 10% as the benchmark percentage . 83
Figure 5.7 One of students’ strategies using grid pattern...................................... 83
Figure 5.8 The work of Rani’s group .................................................................... 85
Figure 5.9 An example of student’ answers using percentage to solve proportional
comparison problem .............................................................................................. 96
Figure 5.10 Gandhang’s answer that compared absolutely the volume of extract
orange .................................................................................................................... 97
Figure 5.11 Rio’s answer in drawing chocolate having 50% extra free ............. 102
Figure 5.12 An example of incorrect answer in working with percentage greater
than a hundred ..................................................................................................... 103
Figure 5.13 Rio’s answer using bar model and benchmark percentages ............ 104
Figure 5.14 Rani’s answer using benchmark percentages .................................. 105
Figure 5.15 One of student’s works using formal computation .......................... 108

xii
LIST OF TABLES
Table 2.1 An Interpretative framework for analyzing individual and collective
activity at the classroom level ............................................................................... 15
Table 2.2 Learning fraction, decimal, and percentage for 5th graders in Indonesian
curriculum ............................................................................................................. 17
Table 2.3 The instructional activities in HLT 1 .................................................... 19
Table 2.4 The Outline of HLT 2 ........................................................................... 40
Table 4.1 The instructional activities in HLT 3 .................................................... 51
Table 4.2 The outline of HLT 3 ............................................................................ 53
Table 6.1 Local instructional theory for learning percentage in grade 5 ............ 117

xiii
LIST OF APPENDICES
Appendix 1: The Analysis of the First Cycle in SD Laboratorium ........... A-Error!
Bookmark not defined.
Appendix 2: The Retrospective Analysis of the Second Cycle in SD Laboratorium
........................................................................... A-Error! Bookmark not defined.
Appendix 3: The lesson plans of teaching experiment .... A-Error! Bookmark not
defined.
Appendix 4: Students’ worksheet ..................... A-Error! Bookmark not defined.
Appendix 5: Pre Test ......................................... A-Error! Bookmark not defined.
Appendix 6: Post Test ....................................... A-Error! Bookmark not defined.

xiii

1
CHAPTER I
INTRODUCTION
1 INTRODUCTION
1.1 Background
Percentage is one of the most widely used mathematical topics in daily life
and holds substantial place in the school curriculum for almost any science and
social studies (Arthur J. Baroody et al, 1998; James E. Schwartz et al, 1994;
Parker and Leinhardt, 1995). The relationship between percentage and other
mathematical concepts such as fraction and decimal offers many possibilities to
do arithmetic in a flexible way (Galen et al, 2008). Percentages are not only
another way of writing down simple fractions, but also derive their right to exist
from the limitations of regular fractions; fractions are difficult to compare with
each other, and the scale that they provide is rather unrefined (Galen et al, 2008).
Considering the importance of percentage in daily life, percentage has been
taught since elementary school. However, many percentage problems indicate that
education is primarily focused on procedures and recall instead of getting a real
understanding of percentage (Van den Hauvel-Panhuizen, 1994). At the other
hand understanding of percentage is necessary to ensure proper interpretation of
social studies, science materials, and many situations in daily life (James E.
Schwartz et al, 1994). Many students can quickly learn how to calculate
percentage accurately because they are familiar with those computations they
have already learned in working with fractions and decimals, but they might
struggle to explain what percentage is actually stating.
2
Regarding this fact, there were two important issues that were well-
considered as the reasons to design new instructional activities in this research.
The first issue is pupils often find it difficult to understand percentage and apply it
to solve problems in context (Kouba et al., 1988 in Koay Phong Lee, 1998; Parker
and Leinhardt, 1995). The finding in the study of Koay (1998) shows that ability
to recite percent as per hundred and carry out the computations correctly does not
lead to the ability to interpret and apply the concept in context. Koay found it
easier for students to perform computation problems than to explain the meaning
of percent and also knowledge of percent was often rigid and rule-bound.
The second issue is about the way of teaching and learning mathematics in
Indonesia. Mathematics in Indonesian curriculum tended to be taught in a very
formal way; teachers explain the mathematics operation and procedures, give
some examples, and ask pupils to do the other similar problems (Armanto, 2002).
Formal way of teaching on percentage tends to restrict pupils’ creativity and
flexibility in their strategies to solve the percent problem. When students solve
percent problem (e.g., 75% of 160), most of them know that they have to
transform 75% to the fraction 75/100 and then multiply with the ‘whole’, but if
they are asked to explain how they come to the answer, they struggle to explain it.
It shows that many of students can remember the ‘right rule’ for finding
percentage but cannot explain what percentage is. Considering this fact, the
teaching and learning of percentage need to focus on how understanding of
percentage can be taught.

3
The need to focus on how understanding of percentage can be taught leads
to the need of activities that are aimed at supporting students making sense of
percentage. This need leads to the third issue namely explorative activities. In
Realistic Mathematics Education where teaching is built on the informal
knowledge of the students, it is important to give students the opportunity to
explore some daily life contexts in which percentages play a role (Van den
Hauvel-Panhuizen, 2003). This idea is relevant with Freudenthal’s idea that views
mathematics as a human activity instead of seeing mathematics as a subject to be
transmitted (Freudenthal, 1991). In many books and researches about percentage,
there are many problems that can provoke students to think about percentage,
such as discount problems, tax problems, increasing or decreasing rate of
population and so on. In order to develop instructional activities on percentage for
Indonesian students, it is important to adjust those kinds of problems based on
Indonesian contexts and situations.
1.2 Research Question
The research question of this study is ‘How to support students to extend
their understanding of percentage?’.
1.3 Aim of the Research
Considering those three issues in teaching and learning percentage, this
research aimed at developing a local instructional theory to support students’ to
extend their understanding of percentage.

4
1.4 Definition of Key Terms
In this section, some important terms relating with the research will be
explained. This explanation aimed to help the reader to follow the idea of this
research.
1. Understanding
Understanding is the number of linkages that one can make between his/her
schema and an abstract or physical object such as a picture, situation,
information, or concept. One has a good understanding of an object, if he/she
could make many linkages relating to the essential aspects of the object. Skemp
(1987) said that to understand something means to assimilate it into an
appropriate schema.
2. Support
Support is any kind of effort of giving encouragement to someone or
something to succeed. In this research, support means any kinds of efforts
provided by researcher or teacher to stimulate students in learning percentage.
The support in this research includes the instructional activities, tools,
guidance, and questions posed by teacher.
3. Percentage
Percentage is relationship based on a one-hundred-part whole and it gives
relative measure, not an absolute measure.
4. Extend the understanding of percentage
Extend the understanding of percentage means constructing the understanding
of percentage that is not much explored in the previous learning. In this

5
research, the understanding of percentage that student has to grasp is that a
percentage is relationship based on a one-hundred-part whole that gives
relative measure. Students do not have to explain this in this manner, but they
have to show an awareness of the fact that percentages are always related to
something. The awareness of this idea can be shown by some indicators.
Students are aware of this idea if and only if the students know that when they
divide a whole into ten or a hundred parts then one part represents 1% or 10%
of the whole and the students know that they cannot compare percentages
absolutely without taking into account to what the percentages refer. With
respect to computational goals, a variety of types of computations with
percentage are explored, such as compute the part of a whole while the
percentage is given. However, it is more important that students are able to use
percentage in a situation in which they are needed, when different parts of
different wholes have to be compared.
1.5 Significance of the research
The significance of this research concerned with the theoretical significance
and practical significance for teachers or researchers. With the respect of
theoretical significance, this research contributes to an empirically grounded
instructional theory for learning percentage. With the respect of practical
significance, this research gives an overview to the researcher and other
researchers about how to design an instructional activity for learning percentage
and also this research gives an overview to mathematics teachers about how to
teach percentage that focus on supporting their understanding.

6
1.6 Assumptions
This research was built upon some assumptions. The first assumption was
that the students were serious in doing the task given during the teaching
experiment. The second assumption was that the teacher was serious in
conducting the teaching and learning process. The third assumption was that the
environment of the school was conducive in supporting the teaching and learning
process.

7
CHAPTER II
THEORETICAL FRAMEWORK
2 THEORETICAL FRAMEWORK
As described in the first chapter, the aim of this research is to develop local
instructional theory on supporting students to extend their understanding of
percentage for young students, age 10 or 11 years old in 5thgrade. For those need,
this chapter presents the theoretical framework that aims to provide base of this
research. Literatures about percentage, Realistic Mathematics Education (RME),
about Indonesia curriculum, and about hypothetical learning trajectory were
studied to elaborate this theoretical framework.
2.1 Percentage
Percentage is one of the most widely used mathematical topics in daily life.
The many uses of percentage have led to varying interpretations of the meaning of
percentage (Parker and Leinhardt, 1995). According to Parker and Leinhardt
(1995), percentage can describe part whole relationship and can describe a ratio
based upon the meaning of percentage.
2.1.1 Percentage as part whole relationship
Percentage as part whole relationship describes relative value of the part
compared to the whole. Percentages are relationships based on a one-hundred-
part whole and it gives relative measure, not an absolute measure (Fosnot & Dolk,
2002). Students do not have to explain this in this manner, but they have to show
an awareness of the fact that percentages are always related to something and that

8
they therefore cannot be compared without taking into account to what they refer
(Van den Heuvel-Panhuizen, 1994).
A common example is a news report that candidate receive 45% of the vote.
The percentage describes the subset of people who vote for the candidate compare
to the set of all people who vote. Within the part whole relationship meaning, the
percentage ‘100%’ is interpreted as the whole. However, percentages greater than
100 are particularly problematic here. Students may struggle to interpret a
percentage such as 150% because in this case the part is bigger than the whole.
Other problems instead of part-whole problems such as increase-decrease
problems are needed to incorporate the broad range of common application.
2.1.2 Percentage as a ratio
Percentage as a ratio describes a comparison between two quantities from
different sets or different attributes of the same set. Van den Heuvel-Panhuizen
(1994) describes that a key feature of percentage, that one has to understand in
order to have insight, is that a percentage is a relation between two numbers or
magnitudes that is expressed by means of a ratio. It describes relative amount by
which one set is compared to another. For example, suppose the price of an item
was originally Rp 12.000,00 and has been increased to Rp 15.000,00. The ratio of
the new price to the original price is 150/120; or as stated in percentage, the new
price is 125% of the original price.

9
In this research, the researcher only focused on the meaning of percentage
as part whole relationship. Researcher only focused on this meaning because it is
the most salient of comparative situations, imaginable for young students in grade
5, and can support students understanding of percentage as relationship based on
one-hundred-part whole. Lembke (1991) asserts that an important component of
percentage knowledge is the understanding of the concept of the base 100,
knowing that percentage always involves comparison of something to 100. That is
not coincidental that the scale goes to 100. This is because in this way it is
possible to place percentages neatly into our number system so that we can easily
convert them into decimal (Galen et al, 2008).
Learning process of percentage should include goals concerning the
understanding of percentage and also computational goals. With respect to
computational goals, a variety of types of computations with percentage are
explored, such as compute the part of a whole while the percentage is given.
However, it is more important that students are able to use percentage in a
situation in which they are needed, when different parts of different wholes have
to be compared (Van den Heuvel-Panhuizen, 1994).
There are many situations in daily life in which percentage play a role. In
this research, the contextual situations used as a support in the learning percentage
are situations in which percentage plays an important role in comparing
proportion. Those contextual situations are discount, concentration of an
ingredient, loading in computer process, and other contextual situations in which
percentage play a role.

10
2.2 The Didactical Use of Bar Model
Although the meanings of percentage are diverse, the essence of percentage
is proportionality; percentage is used to describe proportional relationship (Parker
and Leinhardt, 1995). Percentages indicate the proportion of a specific total that is
set to 100 (Galen et al, 2008). This aspect of proportional relationship involving
an equivalent relationship between two ratios suggests that there is needed to offer
an appropriate model to support student to reason proportionally. The model
offered in this research is bar model.
In the learning process of percentage, learning percentage is embedded
within the whole of the rational number domain and is strongly entwined with
learning fraction, decimals and ratio with the bar model connecting these rational
number concepts (Middleton et al in Van den Heuvel-Panhuizen, 2003). The use
of model bar in learning percentage is beneficial for students. The first benefit is
that bar model has area that makes it easier to talk in terms of “the whole” (Galen
et al, 2008). As the second benefit, the bar model gives a good hold for estimating
an approximate percentage, especially in cases where the problems concern
numbers that cannot be simply converted to an simple fraction or percentage. The
third benefit is that the bar model provides the students with more opportunity to
progress. This also means that the bar model can function on different levels of
understanding (Van den Heuvel-Panhuizen, 2003).

11
2.3 The strategies to work with percentage
In this research, the students had pre knowledge about strategy to work with
percentage. They knew the procedural algorithm to solve percentage problem,
especially in computing a part of a whole if the percentage is given. Since the
procedural algorithm sometimes did not make sense for them, the students should
be given opportunities to explore any number of strategies to work with
percentages that are meaningful for them. Based on the research and discussion of
Parker and Leinhardt (1999), it has been discussed some strategies. Those
strategies are using benchmark percentage, proportional thinking strategies, and
additive building-up or splitting strategies. In this research, researcher only
focused on using benchmark percentage and additive building-up strategies. As
what have been discussed in the previous subchapter, the use of bar model also
can be one of the strategies to work with percentage. Therefore, the strategies
besides procedural algorithm that the students could use to work with percentage
problem are given as follows:
1. Benchmarks percentage strategy
Benchmark of percentages describes a percent that can be replaced by a fraction
with numerator of one, known as a unit fraction; for example, 50% of something
is ½ of that thing, and 25% of something is ¼ of that thing. By thinking of these
benchmark percent values as fractions, students are able to make use of
elementary fractional relationships when solving problems (Parker and Leinhardt,
1999).
12
2. Additive building-up or splitting strategy
Additive building-up or splitting strategy refers to addition of some benchmarks
percentage. For example in determining 15% of Rp 100.000,00, first one might
find 10% of Rp 100.000,00, and find 5% of Rp 100.000,00, then add those two
calculations (10 % of Rp 100.000,00 and 5% of Rp 100.000,00) to get the final
result.
3. Using bar model
Bar model can be used as a tool to estimate percentage. The benchmark
percentages, fractions, or decimals can be used in this model to solve percentage
problems.
2.4 Realistic Mathematics Education
Realistic Mathematics Education (RME) is a domain-specific instruction
theory for mathematics education (Treffers, 1987; Van den Heuvel-Panhuizen,
2003). RME is rooted in Freudenthal’s interpretation of mathematics as a human
activity (Gravemeijer, 1994). Based on Freudenthal’s idea, mathematics must be
connected to reality, stay close to students and should be relevant to society. The
use of realistic contexts became one of the determining characteristics of this
approach to mathematics education (Van den Heuvel-Panhuizen, 2003). In this
research, daily life percent problems are a set of contextual problem situation for
students to learn about percentage.
This section will elaborate the characteristics of RME used as a guideline in
designing the instructional activity. The RME approach will be further explained

13
by elaborating five characteristics defined by Treffers (1987) that can be seen as
heuristics for instructional design.
1. Phenomenological exploration
In the first of instructional activity, the mathematical activities take place within a
concrete context. This mathematical activity should be experientially real for
students. In this research, daily life situations in which percentage play an
important role such as loading proces, discount, area, and free extra context are
employed as the contextual situation for students to learn.
2. Using models and symbols for progressive mathematization
In learning mathematics, varieties of vertical instruments such as models and
symbols are offered, explored, and developed to bridge the level difference from a
concrete level to a more formal level. In this research, students’ informal
knowledge as the result of explorative activities has to be developed into formal
knowledge of percentage. Students drawing in estimating loading process served
as the bases of the emergence of bar model as a tool to work with percentage.
3. Using students’ own construction and productions
Giving opportunities for students to explore and contribute various strategies can
support students’ individual productions. Students’ own productions can indicate
where they are and how they progress in learning process. In each activity, teacher
has a role to provide opportunities for students to explore their own strategy.
4. Interactivity
Interaction among students and between students and teacher can support the
development of students’ learning process. These interactions are supported by a

14
classroom culture which is conducive. Therefore, one of the tasks of the teacher is
to establish the desired classroom culture (Gravemeijer & Cobb, 2006). This
social interaction can stimulate students to shorten their learning path and support
their own production. In this research, the social interaction is facilitated by group
discussion, presentation of students’ production, and criticizing strategies among
groups.
5. Intertwinement
In designing an instructional activity, it is important to do integration of the
various domains. This intertwining of learning strands is exploited in solving real
life percent problems, in which problems not only support their understanding of
percentage but also support the development of students’ number sense; especially
the relation between percentage and fraction or decimal. In addition, in this
research, the learning of percentage is also intertwined with the area topic.
2.5 Emergent Perspective
Gravemeijer & Cobb (2006) stated that “a key element in the ongoing
process of experimentation is the interpretation of both the students’ reasoning
and learning and the means by which that learning is supported and organized”.
They contend that it is important to be explicit about how one is going about
interpreting what is going on in the classroom. In this research, the framework
used for interpreting classroom discourse and communication is the emergent
perspective.

15
Table 2.1 An Interpretative framework for analyzing individual and collective
activity at the classroom level
Social Perspective Psychological Perspective
Classroom social norms Beliefs about our own role, others’ roles,
and the general nature of mathematical
activity
Socio-mathematical norms Specifically mathematical beliefs and
values
Classroom mathematical practices Mathematical conceptions and activity
Based on Gravemeijer & Cobb (2006), three aspects of emergent perspective are
elaborated. The explanation and discussion of these aspects is relatively brief
because the aim is to develop the rationale for the theoretical framework rather
than to present detailed analyses of these aspects.
The first aspect of emergent perspective concerns the social norms that are
established in the classroom. Social norms refer to expected ways of acting and
explaining that is established through negotiation between the teacher and
students. The examples of social norms that engaged in classroom included the
obligations for students to explain and justify solutions, attempt to make sense of
explanation given by other students, and giving opinion indicating agreement and
disagreement.
The second aspect is socio-mathematical norms. Socio-mathematical norms
refer to the expected ways of explicating and acting in the whole class discussion
that are specific to mathematics. The examples of socio-mathematical norms
include what count as a different mathematical solution, a sophisticated
mathematical solution, and acceptable mathematical explanation and justification.

16
With the respect of the socio-mathematical norms, students’ explanation and
reasoning dealing with investigating contextual problems about percentage are
explored.
The last social aspect of emergent perspective is classroom mathematical
practices. Classroom mathematical practice refers to the normative ways of acting,
communicating, symbolizing mathematically that are specific to particular
mathematical ideas or concepts. Students interpretation or ideas about percentage,
the way they make visual model of percentage, and the way they work with
percentage will be analyzed.
2.6 Percentage in the Indonesian Curriculum for 5th grade
In Indonesia National Curriculum, percentage is taught in 5th grade of
elementary school. Before students learn about percentage, they have already
learned about meaning of fraction and addition and subtraction of fraction in the
3rd and 4th grade. The following table describes learning fraction, decimal, and
percentage for 5th graders in the second semester in Indonesian National
Curriculum.
17
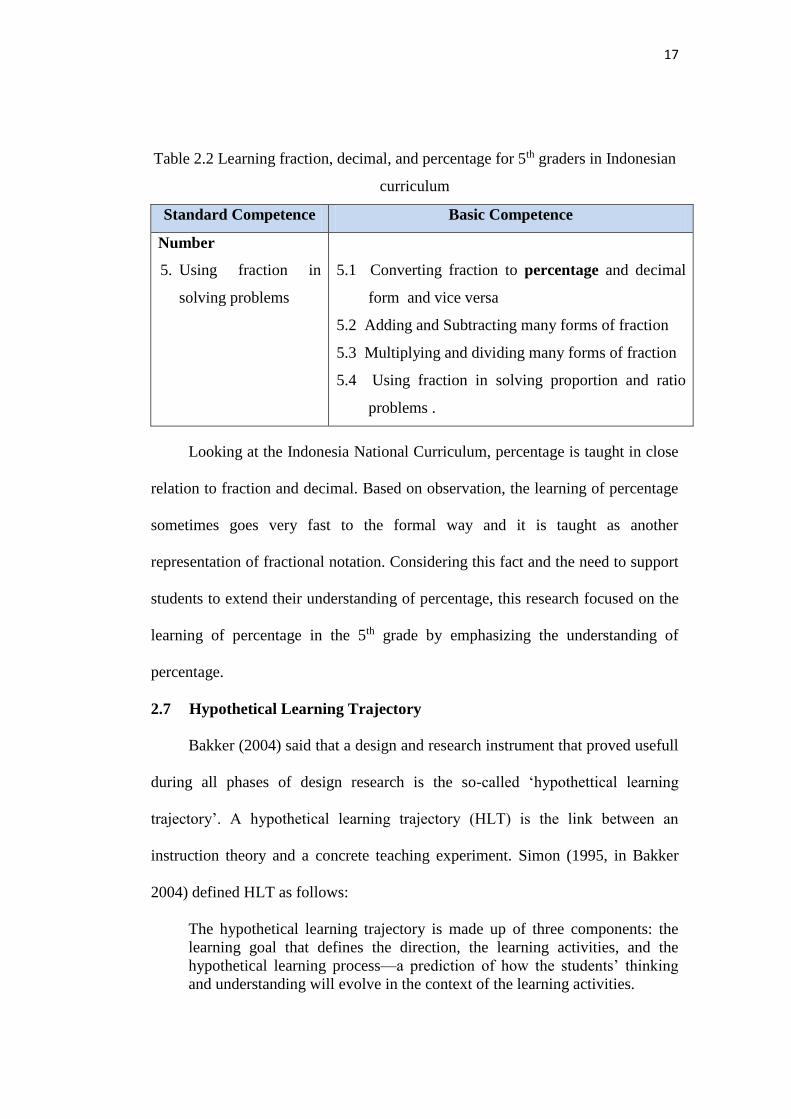
Table 2.2 Learning fraction, decimal, and percentage for 5th graders in Indonesian
curriculum
Standard Competence Basic Competence
Number
5. Using fraction in
solving problems
5.1 Converting fraction to percentage and decimal
form and vice versa
5.2 Adding and Subtracting many forms of fraction
5.3 Multiplying and dividing many forms of fraction
5.4 Using fraction in solving proportion and ratio
problems .
Looking at the Indonesia National Curriculum, percentage is taught in close
relation to fraction and decimal. Based on observation, the learning of percentage
sometimes goes very fast to the formal way and it is taught as another
representation of fractional notation. Considering this fact and the need to support
students to extend their understanding of percentage, this research focused on the
learning of percentage in the 5th grade by emphasizing the understanding of
percentage.
2.7 Hypothetical Learning Trajectory
Bakker (2004) said that a design and research instrument that proved usefull
during all phases of design research is the so-called ‘hypothettical learning
trajectory’. A hypothetical learning trajectory (HLT) is the link between an
instruction theory and a concrete teaching experiment. Simon (1995, in Bakker
2004) defined HLT as follows:
The hypothetical learning trajectory is made up of three components: the
learning goal that defines the direction, the learning activities, and the
hypothetical learning process—a prediction of how the students’ thinking
and understanding will evolve in the context of the learning activities.

18
Simon (1995, in Simon and Tzur, 2004) described that an HLT consists of the
goal for the students’ learning, the mathematical task that will be used to promote
student learning, and hypotheses about the process of the students’ learning.
Whereas the teacher’s goal for student learning provides a direction for the other
components, the selection of learning tasks and the hypotheses about the process
of student learning are interdependent. Therefore, an HLT informs researcher and
teacher how to carry out a particular teaching experiment (Bakker, 2004). During
the preliminary and teaching experiment, HLT was used as a guideline for
conducting teaching practice. HLT was also used in the retrospective analysis as
guideline and point of reference in answering the research question.
2.8 Hypothetical Learning Trajectory of the Preliminary Researches
2.8.1 Hypothetical Learning Trajectory 1
Implementing many ideas elaborated in the theory above, this research used
many daily life contexts such as discount, computer process, and some other
contexts in which percentage plays an important role. As the starting point, this
research designed an activity to assess informal knowledge of students on
percentage. In Realistic Mathematics Education where teaching is built on the
informal knowledge of the students, the teaching of percentage could start with
assessing what the students already know about percentage (Van den Heuvel-
Panhuizen, 1994). After that, the context about computer process, estimating the
percentage of loading process, was chosen to construct the meaning of percentage.
To give students opportunity to explore the meaning of percentage, some contexts
related to part whole relationship were elaborated.

19
Those kinds of activities were elaborated in a set of instructional activities.
This set of instructional activities is divided into six different main activities and it
is accomplished in seven days. The instructional activities are presented below:
Table 2.3 The instructional activities in HLT 1
No Learning Goals Mathematical ideas Activities
1 Students are able
to recall their
informal
knowledge of
percentage
- Making poster about the
use of percentage in daily
life
2 Students are able
to construct the
meaning of
percent as ”so
many out of 100”
- Percent means “so
many out of 100”.
- Percentage describes
part whole
relationship.
- Estimating percentage
of loading process
- Shading loading bar if
the percentage of
loading process is
known
- Estimating area
3 Students are able
to work with
benchmark
percentages
- Percent means “so
many out of 100”.
- Percentage describes
part whole
relationship.
- Estimating area
problem
- Estimating the number
of students
4 Students are able
to construct sense
of percentage as
relative value
- Percentage describes
part whole
relationship; it
describes the relative
value of the part
compared to the
whole.
- Percentages are
always related to
something.
- Investigating two
different percentages
of discounts.
5 Students are able
to use percentage
in comparison
problem
- Percentage describes
relative amount by
which one set is
compared to another.
- Percentages indicate
the proportion of a
specific total that is
set to 100.
- Percentage can be
used to standardize
Ordering the sweetness
of drinks

20
No Learning Goals Mathematical ideas Activities
different quantities so
they can be compared
directly.
6 Students are able
to extend their
knowledge to
percentage
greater than 100
Percentages are not
always less than 100,
but it can be greater
than 100.
- Drawing a chocolate
bar with 50% extra
free
- Investigating the
increasing weight of
chocolate
The instructional activities for learning percentage that were embedded in the
hypothetical learning trajectory will be described in detail as follows:
2.8.1.1 Exploring informal knowledge of percentage
Goal:
- Students are able to show their informal knowledge of percentage.
- Students know some situations in which percentage play role.
- Students realize that percentage is widely used in our daily life.
Activity: Making poster of percentage
Description of the activity:
Before the first lesson, teacher gives homework to students to collect all things
around them that show the use of percentage in their daily life. They can collect
some advertisements or pictures from magazine or newspaper, or table ingredients
that involve percentage, or other information involving percentage. In this first
meeting, they have to make a poster about the use of percentage in a group of four
or five students. After making the poster, all groups have to show the poster in the
classroom and they have to tell what the poster is going about.

21
Conjecture of students’ informal knowledge:
- Students show the use of percentage in discount price. I think most of the
students will show the picture about percentage of discount because it is one of
the familiar contexts in daily life.
- Students show the percentage of sugar or any substance in ingredient table.
- Students show information involving percent from magazine or newspaper, for
example report of vote for candidate in an election.
Class discussion:
When students tell about the poster, teacher can pose question to determine
what they already know about percentage. For example if student make a poster
that involve the use of percentage in the discount of clothes in supermarket,
teacher can pose such questions “Do you feel happy if there is discount in the
price? Why?” or “How if the discount is 90% or only 5%?” to know whether they
realizes that percentage close to 100 means almost everything and percentage
close to 0 means almost nothing. In the class discussion, teacher also can ask
students whether they know the meaning of the symbol “%”.Having discussion
about the poster of percentage can probe students’ informal knowledge of
percentage.
2.8.1.2 Constructing the meaning of percent
Goal: Students are able to construct the meaning of percent as “so many out of
100”.

22
Activity: Estimating loading process and shading loading bar
a. Students are asked to estimate how much the percentage of the loading process
in each loading bar below:
How much is the percentage of the loading bar in each picture? How do you
come to your answer?
b. Students are given three percentages of loading process (10%, 2%, 60%, and
98%), and students are asked to shade part of loading bar that is fully loaded.
Here students also have to explain their strategy in drawing the loading
process.
Description of the activity:
In this activity teacher asks students about their experience in playing game in
computer or play station or in working with computer. Then teacher asks students
whether they have seen loading bar in those kind of activities. To make clear
about how loading bar works, teacher will show loading bar in the computer and
display how it works. There are two different activities in this section.
First Activity
In the first activity, first teacher will display the loading bar and then pauses the
process of the loading in a certain moment. While the teacher displays the loading
Loading : ____%
Loading : ____%
Loading : ____%
Loading : ____%

23
process, he/she hides the percentage. Here, teacher starts to have discussion with
the whole class in estimating the percentage of the loading process. In order to
give more opportunity for students in estimating the percentage of the loading
process, students are given a worksheet contain some pictures of loading process
and they have to estimate the percentage.
Second Activity
In the second activity, teacher only gives the percentage of the loading process
(10%, 2%, 60%, and 98%), and then he/she asks students to shade the part of the
loading bar that is fully loaded. In this activity, students are given a paper
containing blank bars so that they can work in the paper. The blank bars given are
presented in big size so that students can shade the part of loading bar that is fully
loaded as precise as possible.
In these activities, students work in group of four or five students.
Conjecture of students’ strategies:
First activity:
- Students might estimate the loading process by using their intuition. For
example they might estimate that the percentage of loading process from the
first loading process is around 25%. For students who give this answer, teacher
can provoke students by giving such question “How can you make your friends
sure that the percentage of the loading process is 20%?”.
- Students might measure the length of the bar and think of the order of number
1 up to 100 and their position in the loading bar.

24
- Students might use their known percentage to estimate the percentage of the
loading process. In the first loading process, they might recognize that the
percentage of the part that is fully loaded is a half of 50%.
Second activity:
- Students make guessing in drawing the loading process.
- Students think the order of the number 1 up to 100 and their position in the
loading bar.
- Students measure the picture of the blank bar and then divide it into 100 parts.
- Students might use their known percentage to shade the part of loading bar that
is fully loaded.
Class Discussion:
Since in the previous activities students have known many situations in
which percentage play role, here teacher introduces another use of percentage in
computer process, especially in loading process. In the beginning of activity,
teacher can asks students about their interpretation if the percentage in the loading
process is very small or otherwise very big close to 100%.
In this class discussion, the first discussion is about the way they estimate
the percentage of loading process. In estimating the percentage of loading process,
students might have different strategies and answer. They might use their intuition
or use their known percentage to estimate the percentage of the loading process.
The next discussion is about how they shade the part of loading bar that is
fully loaded if the percentage of loading process is given. This activity is the
continuation of the previous activity and it is quite abstract for students because in

25
this activity they have to imagine the situation and then draw the loading process.
In shading the loading bar, they are expected to see the relationship between the
given percentage and the percentage of the whole loading process (100%) and
also are expected to see that the loading bar actually consists of 100 parts, each
part represents 1%.
By discussing these activities, students also are expected to develop their
sense of the relative value of the part (loading process) compared to the whole. In
estimating loading process, relative size of the part is viewed as a sense of fullness
of loading process along the linear scale, with 0% means the loading process is
started and 100% means the loading process is finished.
Next Activity:
Activity: Estimating the area of fishpond
Teacher says the story about the area of his/her yard in his/her village.
Teacher says that in her/his village, he/she has a house with the total area of the
yard is 100 m2. Teacher says that 10 percent of the yard is used as fishpond.
Teacher asks students to estimate the area of the fishpond.
The questions are: How much is the area used as fishpond? How do you come to
your answer?
Description of the activity:
Teacher tells the story about the area of the yard in her/his house and the
percentage of the area used as fishpond. Then teacher asks students to find the
area used as fishpond. In this activity, teacher asks students to make a drawing of
the situation. In investigating this problem students work individually.

26
Conjecture of students’ strategy:
- Students might draw a representation of the yard and then divide it into ten
parts. After dividing, they conclude that one small part that has area 10 m2
represent the area of the fishpond.
- Students draw a representation of the yard and then divide it into or a hundred
parts. After dividing, they conclude that ten small parts that has area 10 m2
represent the area of the fishpond.
- Students directly divide the area of the yard (100 m2) by ten or by one hundred
without making drawing.
Class Discussion:
In the mathematical congress of estimating loading process students have
already estimated the percentage in the loading process and discuss the meaning
of percent. This activity is designed to see whether they really know the meaning
of percent. In this activity, the discussion focuses on the way students estimate the
area of the fishpond. Students might come up with different strategies to solve it.
The meaning of percent can be explored by questions such as “Why do you divide
the area of the yard into ten? Why one small part represents 10%? or “Why do
you divide the area of the yard into a hundred parts? Why ten small parts
represent 10%?.
2.8.1.3 Working with benchmark percentage
Goal: Students are able to construct the meaning of percent as “so many out of
100” and they were able to use their previous knowledge about bar model as a
tool to solve percentage problem.

27
First Activity: Estimating field area
The problem goes as follows:
Mr. Hadi has a field with the total area is 400 m2. He plans to plant rice in 75% of
the field and the rest is used to plant corn. How much is the area used to plant
rice? How much is the area used to plant corn? How do you come to your answer?
Description of the activity:
Teacher tells story about a field of Mr. Hadi that is used to plant rice and corn.
After telling the story, then teacher asks students to find the area used to plant rice
and corn. In this activity, students will work in a group of four or five students.
Conjecture of students’ strategy:
Students’ strategies in finding the area used to plant rice:
- Students might draw the field in square or rectangle form and then divide it
into some parts. They might divide it into four, or ten, or hundred parts.
- Students will split 75% into 50% and 25%. First they determine 50% of 400 m2
then they continue to determine 25% of 400 m2.
Students’ strategies in finding the area used to plant corn:
- Students will start with the percentage of area used to plant rice. Since 75% of
the field has already used to plant rice, then the area used to plant corn is 25%
(100% minus 75%). Then they will determine 25% of 400 m2 by making
drawing of the field.
- After finding the area used to plant rice, students will directly find the area
used to plant corn by subtracting the total area of field by the area used to plant
rice.

28
Class Discussion:
Since in the previous activity students have already discussed the meaning
of percent, in this activity students are given opportunity to solve a percentage
problem to see whether they know the meaning of 75% of a certain amount. In
this activity, the given problem is about the area of field that is designed in
purpose to give students opportunity to make drawing as a representation of the
situation and to make connection with their previous activity.
In this activity, the discussion focuses on the way students estimate the area
used to plant rice and corn. Students might come up with different strategies to
solve it. In this activity, teacher can provoke students to recall their experience in
working with bar or drawing in the previous activity.
Second Activity: Estimating the number of students joining music
extracurricular
Here is an announcement about music extracurricular in SD Harapan.
“In SD Harapan, the number of students in grade 5 and 6 is 200 students. From
200 students, 60% of the students join music extracurricular in the school.”
Here is conversation between two students that discuss about the announcement:
Rina : Hmm….I think there are many students in grade 5 and 6 interest in music
extracurricular. What do you think Budi?
Budi : Yeahh….I think so…
Rina : I think 120 students in grade 5 joining the music extracurricular.
Budi : I don’t think so… I think only 100 students joining the music
extracurricular.
29
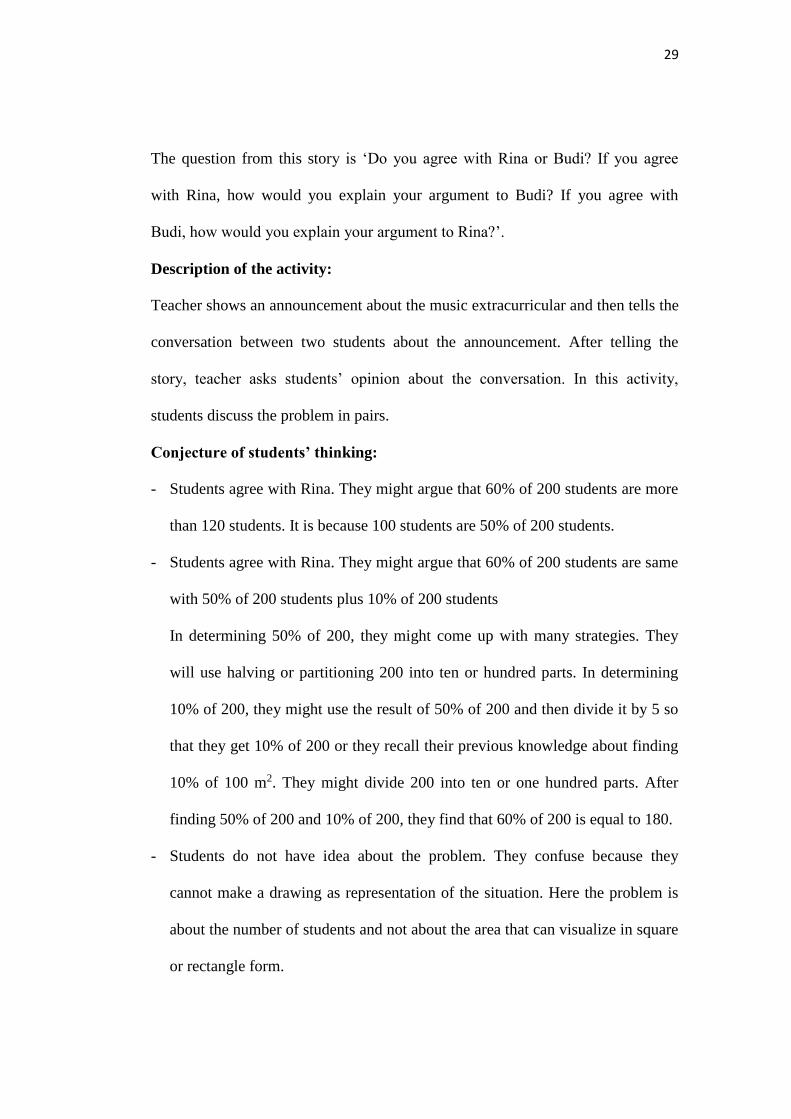
The question from this story is ‘Do you agree with Rina or Budi? If you agree
with Rina, how would you explain your argument to Budi? If you agree with
Budi, how would you explain your argument to Rina?’.
Description of the activity:
Teacher shows an announcement about the music extracurricular and then tells the
conversation between two students about the announcement. After telling the
story, teacher asks students’ opinion about the conversation. In this activity,
students discuss the problem in pairs.
Conjecture of students’ thinking:
- Students agree with Rina. They might argue that 60% of 200 students are more
than 120 students. It is because 100 students are 50% of 200 students.
- Students agree with Rina. They might argue that 60% of 200 students are same
with 50% of 200 students plus 10% of 200 students
In determining 50% of 200, they might come up with many strategies. They
will use halving or partitioning 200 into ten or hundred parts. In determining
10% of 200, they might use the result of 50% of 200 and then divide it by 5 so
that they get 10% of 200 or they recall their previous knowledge about finding
10% of 100 m2. They might divide 200 into ten or one hundred parts. After
finding 50% of 200 and 10% of 200, they find that 60% of 200 is equal to 180.
- Students do not have idea about the problem. They confuse because they
cannot make a drawing as representation of the situation. Here the problem is
about the number of students and not about the area that can visualize in square
or rectangle form.
30
Class Discussion:
Since in the previous activity students have already worked with benchmark
percentages such as 50% and 25%, here students are given opportunity to solve a
percentage problem with other benchmark percentages. In this activity, students
are faced in the situation in which they cannot directly make visual representation
of the situation to solve the problem. Here, they have to recall their previous
knowledge about the meaning of percent and working with benchmark
percentage. The given problem is about the number of students joining music
extracurricular that is designed in purpose to give students opportunity to work
with percentage as relative value of the part compared to the whole in discrete
objects.
In this activity, the discussion focuses on students’ reasoning on why they
agree with Rina or Budi. Students might come up with different reasoning about
it. Teacher can provoke students by posing questions such as “How do you know
that 60% of 200 students are equal to 120 students? Could you make drawing of
your strategy?” . Through discussing the problem, students are expected to see
that percentage describes part whole relationship. By investigating the problem
students are also expected to consider that in determining the percentage of a
certain amount, they can use benchmark percentages to help them to estimate the
percentage.

31
2.8.1.4 Constructing sense of percentage as a relative value
Goal: Students are able to recognize that percentages describe relative value of
the part compare to the whole and percentages are always related to something (in
this problem percentages relates to prices).
Activity: Investigating discount problem
The discount problem is given as follows:
Two department stores, Ramayana and Matahari, offer discount for their products.
Ramayana department store offer 30% discount for toys and Matahari department
store offer 40% discount for toys. If you want to buy toys, which store do you
prefer?
Description of the activity:
Teacher tells about two advertisements that he/she saw in newspaper. After telling
the advertisement, students are given the problem above and they have to discuss
the problem in a group of four or five students. When discussing the problem,
they have to make a poster describing their opinion and their reasoning.
Conjecture of students’ strategy:
- Students will prefer Matahari department store to buy toys because the
discount is bigger than in Ramayana so that the price will be cheaper.
For students who argue like this, teacher can give stimulating question such as
“How do you know that the price in Matahari department store is cheaper than
30%
40%

32
in Ramayana while one thing that you know is only the discount?”. If students
still argue that the bigger the price the cheaper the price, teacher could ask
“How do you convince your friend that the price in Matahari department store
is cheaper than in Ramayana department store? Can you give an example of
one case?”. From these stimulating questions, it is expected that children will
consider that percentage are always related to something.
- Some students maybe will recognize that to determine the price in each
department store, one has to know the original price.
For students who have this opinion, teacher can ask such questions “How if the
prices are same?” or “How if the prices are not same?”. From the question, it is
expected that students will gain more insight that different reference will lead
to different result.
Class Discussion:
From the first activity of making poster, teacher recalls many uses of
percentage in daily life and discount context assumed as one of the most familiar
contexts for students. In this activity students are given a situation in which there
are two different discounts offered in two different stores. This discount context is
used to have students discuss what these advertisements really tell them.
In the class discussion, maybe almost all students will argue that Matahari
gives the best price because the amount of reduction is bigger. Here, teacher does
not ask for any argument first, but the teacher gives them opportunity to discuss in
groups why they think shopping at Matahari is better. After students give
argument, teacher can provoke their reasoning through asking questions such

33
“Are you sure? How do you convince your friend that your answer is true?”. In
the discussion teacher also give opportunity for students to discuss about the
possibilities of the original price of the toys.
In the case where the original prices are same, it is clear that the price in
Matahari is cheaper than in Ramayana. In the case where the original prices are
not same, there are many interesting things to discuss. The main discussion in this
case is about the reduced prices (absolute values) and the percentages (relative
values) that describe the relationship between the reduced prices with the original
prices.
Through this activity, students are expected to realize that percentages
describe relative value of the reduced price compare to the original price. Students
also expected to explore that percentages are always related to something (prices)
and cannot be compared without taking into account to what they refer because
reduction in percentage gives relative value, not an absolute value.
2.8.1.5 Using percentage in comparison problem
Goal: Students are able to use percentages in a situation in which percentages are
needed; when different parts of different wholes have to be compared.
Activity: Ordering the sweetness of drinks
Syrup: 80 ml Syrup: 30 ml Syrup: 60 ml
(3)
300 ml
(2)
200 ml
(1)
500 ml

34
Can you order those three drinks from the sweetest drink to the least sweet? To
make sure that your answer is true, how would you explain your answer to your
friends?
Description of the activity:
The activity uses three glasses having different volume of drink. Each drink
contains of different amount of syrup. In this activity, teacher asks students to
observe those drinks and report their observation data dealing with the volume of
drinks and syrup in those glasses. After the children observe those glasses, then
teacher asks students to order the sweetness of each drink. In this activity,
students work in group of 4 or five students.
Conjecture of students’ strategies:
- Some students maybe will order those drinks based on the volume of the syrup
without considering the volume of the drink. For students who give this
solution, teacher can pose stimulating question “How about the volume of the
drink? Does the volume of the drink not influence the sweetness of those
drinks?. From the question, it is expected that students will consider the
volume of the water in determining the sweetness of those drinks.
- Since the question is determining the sweetness of each drink, students may
think about the concentration of syrup in each glass. Students might draw the
glasses and then estimate the concentration of syrup in each glass by using
simple fraction.
In estimating the concentration of syrup, students will compare the volume of
syrup with the volume of drink. Then students might come up with fractions

35
that are difficult to compare. They find that the volume of syrup in the first
glass is 4/25 of the volume of the drink, the volume of syrup in the second
glass is 3/20 of the volume of the drink, and the volume of syrup in the third
glass is 1/5 of the volume of the drink.
For students who come to this answer, teacher can ask question “Why do you
get difficulties in comparing those fractions? Do you have idea how to make
those fractions become easy to compare?”. From the question, it is expected
that students will recognize that different denominators make those fractions
become difficult to compare so that they have to make it equal. In order to
make it become equal, those numbers are easy to compare in base of 100.
- Students might estimate the concentration of syrup in each glass by using
percentage. In estimating the percentage, they might use a bar like the bar in
the loading process problem. The example of their strategy goes as follows:
They might estimate that the volume of syrup in the first glass is 16% of the
volume of the drink. By using bar, they also find that that the volume of syrup
in the second glass is 15% of the volume of the drink and the volume of syrup
in the third glass is 20% of the volume of the drink. For students who give this
kind of solution, teacher can pose question “Why do you prefer percentage in
this problem?”. It is expected that students will consider that using percentage
make them easy to compare the kind of proportional problem.
The percentage of
syrup in the first glass
500 ml
100%
50ml
10%
80ml
16%

36
Class Discussion:
In this activity, researcher expects the children to invent percentage as the
answer to a problem. The researcher place the children in situation in which
comparing proportion by using fraction makes things obscure. In this class
discussion, the first discussion is about the way students order those three drinks
from the sweetest to the least sweet. They might only determine the sweetness of
the drinks based on the volume of syrup or they compare the volume of the syrup
with the volume of the drink. If students only focus on the volume of syrup, it
means that they only look at the absolute amount of syrup without comparing to
the volume of water.
Next discussion is about how students order those three drinks from the
sweetest to the last one if they compare the volume of syrup with the volume of
the drink. Students might come up with different strategies to solve it. By
investigating the problem and discussing different strategies used by students,
students are expected to see that percentages make them easy to compare
proportions. The mathematical idea behind this activity is that percentage
describes relative value of the part compared to the whole and it can be used to
standardize different quantities so they can be compared directly.
2.8.1.6 Exploring percentage greater than 100
Goal: Students are able to extend their knowledge to percentage greater than 100
First Activity: Drawing a chocolate bar with 50% extra free
Teacher tells students about the advertisement that says ‘Now available a new
product of Silver Queen chocolate with 50% extra free from the previous

37
product’. Teacher asks students to draw the new product of Silver Queen
chocolate.
Description of the activity:
Teacher tells the advertisement and then asks students to draw the chocolate with
50% free extra in their own paper. In this activity they work individually.
Conjecture of students drawing:
-
Class Discussion:
In this activity, researcher place students on different problem, not on a
‘part-whole’ problem that has already done in the previous activities, but in an
‘increase-decrease’ problem. In drawing the new product of Silver Queen
chocolate, students might have different drawings. Teacher can use different
students’ drawings as discussion matter to discuss the ‘50% extra’. This problem
is designed to prepare students to expand their knowledge about percentage
greater than 100. This activity is expected can bridge students to expand their
knowledge from percentage less than 100 to percentage greater than 100.
Second Activity: Investigating the increasing weight of chocolate
The problem is given as follows:
The old product of Toblerone chocolate has weight 200 gram. There is new
product of Toblerone having weight 150% of the old product. What do you think
about the new product of Toblerone? Does it increase or decrease? How much the
weight of the new product?
50% free extra 50% free extra
-

38
Description of the activity:
In discussing the problem, students work in pairs. After they discussed in pair,
teacher asks some students to present their answer.
Conjecture of students’ thinking:
- Students will think that the weight of the new product of Toblerone increases.
- Students will split 150% into 100% and 50%. After they split the percentage,
students will recognize that this situation is the same with 50% free extra
problem that they have done before. To find the weight of the new product of
Toblerone, students will determine 50% of 200 gram that is 100 gram and then
add this result with the weight of the old product that is 200 gram, so that they
get 300 gram as the result.
- Students don’t have any idea about it. They might confuse because they cannot
make drawing that represent the situation.
Class Discussion:
In the activity, students are given a problem in which percentage greater
than 100 plays role. In investigating this problem, students can recall their
knowledge about percentage less than 100. Through investigating this activity,
students are expected to consider that percentages are not always less than 100 but
it can be greater than 100 and they are also expected to consider that they can use
their knowledge about percentage less than 100 to investigate percentage problem
in which the percentage is greater than 100.

39
2.8.2 Hypothetical Learning Trajectory 2
In this section, the researcher presented the hypothetical learning trajectory
2 (HLT2) as the refinement of HLT 1 that is presented in the subchapter 2.6
above. The HLT 1 above was implemented in the first cycle of experiment in SD
Laboratorium Unesa. The analysis of the first cycle of experiment was presented
in appendix 1. Based on the analysis of the first cycle of experiment, the
researcher improved and adjusted some activities in HLT 1. The HLT 2 as the
refinement of HLT 1 was also implemented in SD Laboratorium Unesa but in
other group. The description of HLT 2 was presented in the table 2.4 below.

40
Table 2.4 The Outline of HLT 2
No Learning Goals Mathematical Ideas Activities Explanation Conjectures
1 - Students are
able to recall
their informal
knowledge of
percentage.
- Students know
some uses of
percentage in
daily life
- Making poster about the uses
of percentage in daily life.
- (The conjectures are the
same as the conjectures in
HLT1)
2 Students are able
to construct sense
of percentage
Percentage close to
100 means almost
‘all’ and percentage
close to 0 means
almost ‘nothing’.
- Shading loading bar if the
percentage of loading
process is known
Problem
Students were given four
loading bars and they had
to shade it based on the
percentage of loading
process (10%, 5%, 60%,
and 95%).
- Estimating percentage of
loading process
Problem:
Students are asked to
estimate how much the
In the second
activities, the
researcher designed
loading bars with
various lengths.
- Students just estimate
how much the part that is
fully loaded
- Students might measure
the length of the bar by
using ruler, and divide
the bar into five, ten or
twenty parts.

41
No Learning Goals Mathematical Ideas Activities Explanation Conjectures
percentage of the loading
process in each loading
bars.
3 - Students are
able to
construct the
meaning of
percent as ”so
many out of
100”.
- Students are
able to work
with benchmark
percentages
- Percent means “so
many out of 100”.
- Percentage
describes part
whole relationship.
- Investigating area problem
Problems:
1. Pak Rahmat has a house
with the total area of the
yard is 100m2. He makes a
fishpond in the yard with
the area is 15m2. Make
some drawings of the yard
and shade the part of the
yard used as the fishpond!
How much the percentage
of the area of the yard used
as the fishpond?
2. Pak Budi has a field with
the total area is 200 m2.
Some part of the field used
by Pak Budi to plant
banana tree. The total area
used to plant the banana
tress is 150 m2. Make
some drawings of the field
and shade the part of the
field used to plant banana
tree! How much the
In this activities,
the researcher
provided students
with paper grid so
that can help them
in making drawing,
to estimate the
percentage, and
especially to
support them to
explore the
meaning of
percentage as “so
many out of 100”.
- Students will draw the
yard or the field in
rectangle or square form.
They might use one
square in the grid paper
to represent 1m2.
- In shading the part of the
yard or the field, they
might just use
estimation.
- Students might shade 15
squares to represent 15
m2 or shade 150 squares
to represent 150 m2.
- In determining the
percentage of the area
used as the fishpond or
to plant banana tree,
students might measure
the length of the drawing
and divide it into ten or
twenty parts, so that they
get the area representing
10% or 5%.

42
No Learning Goals Mathematical Ideas Activities Explanation Conjectures
percentage of the area part
of the field used to plant
banana tree?
- Students might compare
the number of all squares
and the number of the
shaded squares. For
example: The number of
total squares is 100, the
number of the shaded
squares is 15, then the
percentage of area used
to as a fishpond is
15/100 and it equals to
15%.
- Students might use
algorithm to find the
percentage.
4 Students are able
to construct sense
of percentage as
relative value
- Percentage gives
relative measure,
not an absolute
measure.
- Percentage is an
operator so that it
always related to
something and the
operation of
multiplication is
involved.
- Investigating two different
percentages of discounts.
Problem:
Istana and Sriwijaya shop
are two shoes shops that
offer different discounts.
Istana shop offered 20%
discount and Sriwijaya shop
offered 25% discount for
their product.
‘If you want to buy shoes,
which shop do you
In this activity, the
researcher adjusted
the percentages
because the
researcher wanted
students to use
benchmark
percentage to solve
a problem and not
merely use
algorithm.
- Students will prefer
Sriwijaya shop because
the discount is bigger
than those in Istana shop
so that the price will be
cheaper.
- Some students might
realize that the original
prices in both shops
might be different.
- Students might prefer
Istana shop because of

43
No Learning Goals Mathematical Ideas Activities Explanation Conjectures
prefer?’. other considerations such
as the quality or the
distance of the shop.
5 Students are able
to use percentage
in comparison
problem
- Percentage
describes relative
amount by which
one set is
compared to
another.
- Percentages
indicate the
proportion of a
specific total that
is set to 100.
- Percentage can be
used to standardize
different quantities
so they can be
compared directly.
- Ordering the sweetness of
drinks
Problem:
Students are given two drinks
illustrated as follows:
Do you think both drinks
have the same sweetness? If
not, which drink is the
sweeter drink?
Since the findings
in the first try out
showed that the
problem in HLT 1
was complicated
for students, then
the researcher
simplified the
problem. Here, the
number of glasses
is reduced and the
number in problem
is simplified. These
adjustments aims to
help student to not
constrained with
the problem
otherwise to help
student to cope
with mathematical
level.
- Some students might
determine the sweeter
drink based on the
volume of the syrup.
- Students just guess to
determine the sweeter
drink.
- Students might compare
the volume of syrup and
the volume of drink by
using fraction or
percentage
6 Students are able
to extend their
knowledge to
Percentages are not
always less than 100,
but it can be greater
- Drawing a chocolate bar
with 50% extra free
‘The new product Choco
(The conjectures are the
same as the conjectures in
HLT1.)

44
No Learning Goals Mathematical Ideas Activities Explanation Conjectures
percentage greater
than 100.
than 100
chocolate have 50% extra
free from the previous
product’
Draw the old and the new
product of chocolate
Choco!
- Investigating the increasing
weight of chocolate
Problem:
The old product of Fresh
toothpaste has weight 200
gram. The new product of
Fresh toothpaste is now
available with the weight is
150% of the weight of the
old product.
What do you think about
the new product of Fresh?
Does it increase or
decrease? How much the
weight of the new product?

45
CHAPTER III
RESEARCH METHOD
3 RESEARCH METHOD
The issues that will be discussed in this chapter are: (1) design research
methodology, (2) research subjects, (3) data collection, and (4) data analysis,
reliability, and validity.
3.1 Design Research Methodology
The main goal of this research is to investigate how to support students to
extend their understanding of percentage. For this need, this research used a type
of research method namely design research for achieving the research goal.
Design research is a type of research methods aimed to develop theories about
both the process of learning and the means that are designed to support that
learning (Gravemeijer & Cobb, 2006).
Gravemeijer & Cobb (2006) define what design research is by discussing
the three phases of conducting a design research. Those three phases are
preparation and design phase, teaching experiment, and retrospective analysis.
1. Preparation and design phase
This phase proposes to formulate a local instructional theory that can be
elaborated and refined while conducting the intended design research. The crucial
issue in this phase is that of clarifying its theoretical intent (Gravemeijer & Cobb,
2006). In this phase, the researcher was inspired by studying literature about
percentages, realistic mathematics education, and design research. During the
preparation and design phase, the researcher established the learning goals for the

46
students, develops a sequence of instructional activities and conjectures of
students’ strategy and students’ thinking. In the end of this phase, the result was a
formulation of what is called a hypothetical learning trajectory (HLT).
2. Design experiment
In this phase, the instructional activities are tried, revised, and re (designed)
during the experiment (Gravemeijer & Cobb, 2006). In this phase HLT functions
as the guidelines for the teacher and researcher. In this research, the experiment
were conducted in cyclic processes of trying, revising and re (designing) the
instructional activities. The experiment was conducted in three cycles. The first
two cycles became the preliminary research of the third cycle of research (that
later is called teaching experiment). The first cycle was conducted in three days
and the second and third cycles were conducted in three weeks. During the
experiment, the researcher adjusted the HLT.
3. Retrospective analysis
In the last phase, the researcher analyzed all data during the experiment. In
analyzing the data, HLT is used as guidelines and points of reference in answering
research question. In this research, the retrospective analysis was conducted
during and after the experiment.
At the heart of the design research there is a cyclic process of (re) designing,
testing instructional activities, and analyzing the learning process (Gravemeijer &
Cobb, 2006). From this cyclic process emerges a local instructional theory that is
still potentially revisable. In this research there were three cycles of experiment, in
which the first two cycles became the preliminary experiment of the last cycle

47
(teaching experiment). In this research, the researcher limited the number of the
cycles based on whether the data derived from the experiment could answer the
research question. Looking back to the research question, the data of experiment
could answer the research question if the researcher could gather enough data
showing that the students extend their understanding of percentage.
3.2 Research Subjects
The research was done in the fifth grade of SD Laboratorium UNESA and
SD BOPKRI III Demangan Baru Yogyakarta, Indonesia. Around twenty five
students in each school were involved in the experiment. The students are about
10 to 11 years old and they have learned about percentage in the school. SD
Laboratorium Surabaya is one of the schools that have been involved in PMRI
(Pendidikan Matematika Realistik Indonesia) under the supervision of Surabaya
State University and SD BOPKRI III Demangan Baru Yogyakarta is one of the
schools that have been involved in PMRI under the supervision of Sanata Dharma
University.
3.3 Data Collection
The data collection of this research was described as follows:
1. Video
In this research the video data provides the primary data. The video
recorded the activities and discussion in the whole class and in some groups of
students, and also recorded the interviews with teacher and some students.
Discussion with students during the activities and the class discussion were
recorded as data source to observe and investigate students’ reasoning in the
48
learning process. Short discussion with teacher was also recorded to know what
the teacher’s opinion and idea about the learning process. The videotaping in this
experiment will be recorded by two cameras. One camera was used as a static
camera to record the whole activities and the other camera was used as a dynamic
camera to record the activities in some groups of students.
2. Written data
The written data was provided as an addition to the video data. In this
research, the written data includes student’s work, observation sheet, assessments
result, and some notes gathered during the experiment. However, written
assessments cannot accurately convey students' immediate responses or physical
and verbal expressions. Consequently, observation is important here.
3.4 Data Analysis, Reliability, and Validity
The description of the data analysis and the description about how to ensure the
reliability and validity of this research are
3.4.1 Data Analysis
Doorman (2005) states that the main result of a design research is not a
design that works, but the reason how, why and to what extent it works.
Therefore, the initial instructional design was developed, tested, and analyzed to
explain how to support students to extend their understanding of percentage. In
this research, the data analysis focused on how students extend their
understanding by exploring the activities in the instructional design. The main
data that were needed to answer the research question were the videotaping of the
students activities and the class discussion following each of the activities. In

49
analyzing the data, especially for the transcript of the video and the students’
work, the researcher used codes towards those data. Here, coding was a process
for categorizing data and this process was used to help the reader to track the data.
3.4.2 Reliability
Reliability has to do with the quality of measurement. There are two types
of reliability – internal and external reliability. Bakker (2004) describes that
internal reliability refers to the reasonableness and argumentative power of
inferences and assertions. Bakker (2004) also defines that external reliability
means that the conclusions of the study should depend on the subjects and
conditions, and not on the researcher. In this research, ensuring the reliability was
improved by doing two following ways.
a. Data triangulation
Data triangulation relies upon gathering data from multiple sources during the
experiment. Considering the importance of data triangulation, the data in this
research was gathered by videotaping the learning experiment, collecting
students’ works, and collecting notes from observation and interview.
b. Cross interpretation
Cross interpretation was conducted by discussing data gathered during the
teaching experiment with the supervisors and the colleagues. The cross
interpretation was conducted in attempt to minimize the subjectivity of the
researcher’s point of view.

50
3.4.3 Validity
Internal validity refers to the quality of the data collection and the soundness
of the reasoning that has led to the conclusion. External validity is mostly
interpreted as the generalizability of the result (Bakker, 2004). In this research, the
validity was kept by doing two following ways:
a. Testing the conjecture
The validity of this research was kept by testing the conjecture during the
restrospective analysis.
b. Trackability of the conclusions
The teaching experiment was documented by videotaping the learning
experiment, collecting students’ works, and collecting notes from observation and
interview. By using this data, the researcher was able to describe detailed
information of the reasoning that leads to the conclusion. This information enables
the reader to track the reasoning that underpins the conclusion.
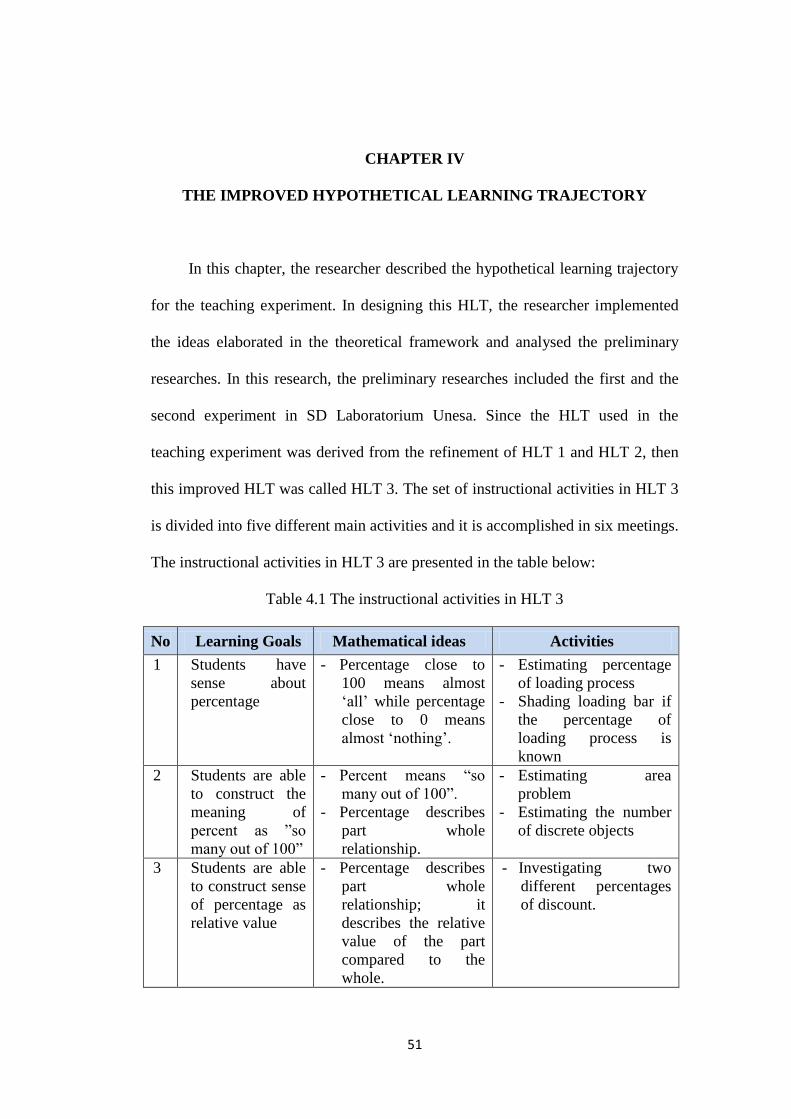
51
CHAPTER IV
THE IMPROVED HYPOTHETICAL LEARNING TRAJECTORY
4 THE IMPROVED HYPOTHETICAL LEARNING TRAJECTORY
In this chapter, the researcher described the hypothetical learning trajectory
for the teaching experiment. In designing this HLT, the researcher implemented
the ideas elaborated in the theoretical framework and analysed the preliminary
researches. In this research, the preliminary researches included the first and the
second experiment in SD Laboratorium Unesa. Since the HLT used in the
teaching experiment was derived from the refinement of HLT 1 and HLT 2, then
this improved HLT was called HLT 3. The set of instructional activities in HLT 3
is divided into five different main activities and it is accomplished in six meetings.
The instructional activities in HLT 3 are presented in the table below:
Table 4.1 The instructional activities in HLT 3
No Learning Goals Mathematical ideas Activities
1 Students have
sense about
percentage
- Percentage close to
100 means almost
‘all’ while percentage
close to 0 means
almost ‘nothing’.
- Estimating percentage
of loading process
- Shading loading bar if
the percentage of
loading process is
known
2 Students are able
to construct the
meaning of
percent as ”so
many out of 100”
- Percent means “so
many out of 100”.
- Percentage describes
part whole
relationship.
- Estimating area
problem
- Estimating the number
of discrete objects
3 Students are able
to construct sense
of percentage as
relative value
- Percentage describes
part whole
relationship; it
describes the relative
value of the part
compared to the
whole.
- Investigating two
different percentages
of discount.
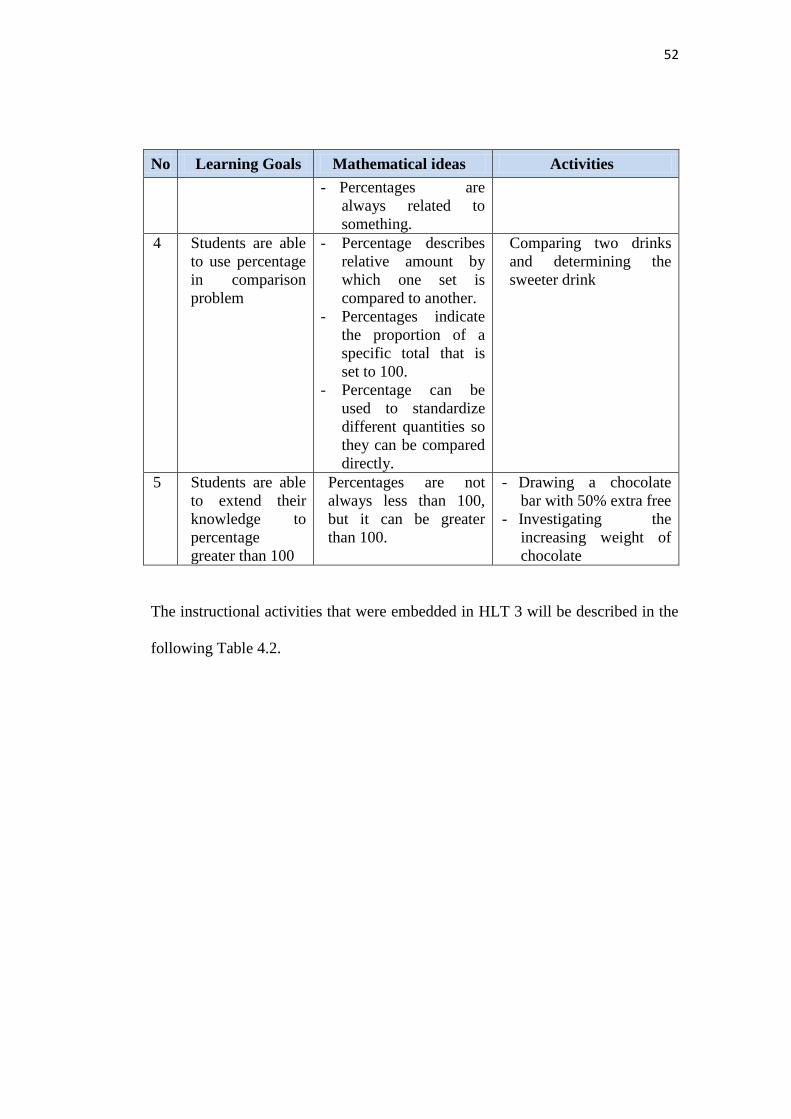
52
No Learning Goals Mathematical ideas Activities
- Percentages are
always related to
something.
4 Students are able
to use percentage
in comparison
problem
- Percentage describes
relative amount by
which one set is
compared to another.
- Percentages indicate
the proportion of a
specific total that is
set to 100.
- Percentage can be
used to standardize
different quantities so
they can be compared
directly.
Comparing two drinks
and determining the
sweeter drink
5 Students are able
to extend their
knowledge to
percentage
greater than 100
Percentages are not
always less than 100,
but it can be greater
than 100.
- Drawing a chocolate
bar with 50% extra free
- Investigating the
increasing weight of
chocolate
The instructional activities that were embedded in HLT 3 will be described in the
following Table 4.2.

53
Table 4.2 The outline of HLT 3
No Learning Goals Mathematical Ideas Activities Explanation Conjectures
1 Students are able
to construct the
sense of
percentage
Percentage close to
100 means almost
‘all’ and percentage
close to 0 means
almost ‘nothing’.
- Estimating percentage of
loading process
Students are asked to
estimate how much the
percentage of the loading
process in each loading
bars.
- Shading loading bar if the
percentage of loading
process is known
Students were given four
loading bars and they had to
shade it based on the
percentage of loading
process (95%, 20%, and
11%).
In the first activities,
the researcher
designed loading
bars with different
lengths.
- Students just estimate
how much the part that is
fully loaded
- Students might measure
the length of the bar by
using ruler, and divide
the bar into five, ten or
twenty parts.
2 - Students are
able to
construct the
meaning of
percent as ”so
many out of
100”.
- Students are
able to work
- Percent means “so
many out of 100”.
- Percentage
describes part
whole relationship.
- Estimating area problem
(by using grid paper)
1. Pak Rahmat wants to
build a house in the area
of 100 m2. 10% of the
area will be used as
fishpond, 75% will be
used as the building of
the house, and the rest
In the first session of
investigating area
problem, the
students will be
given with paper
grid that have size 1
cm x 1 cm to support
them to explore the
meaning of
Estimating area problem
(by using grid paper)
First problem:
- Students might assume
that one square represent
1%.
- Students might assume
that one column or one
row represent 10%.

54
No Learning Goals Mathematical Ideas Activities Explanation Conjectures
with benchmark
percentages
15% will be used as the
yard. Below the sketch
of the area
a. Coloured the part of the
area used as fishpond,
building, and yard!
b. How much the area used
as fishpond, building,
and yard?
2. In Kaliurang, Pak
Rahmat has a field with
the area is 200 m2. Some
parts of the field used to
plant chilli. The area of
the field used to plant
chilli is 150 m2. Make
the drawing of the field
and shade the part used
to plant chilli. How
percentage as “so
many out of 100”. In
the next session, the
students will not be
given grid paper
anymore. This aims
to give students
opportunity to
progress.
In investigating the
percentage of
discrete objects, the
students will be
given a number of
pieces of paper to
represent candies or
chocolates. These
pieces of paper will
be given to the
students who need
support to figure out
the situation. These
pieces of paper also
aim to bridge this
activity (in which
they work with
Second problem:
- Students will draw the
field in rectangle form.
- In shading the field used
to plant chilli, they might
just use estimation, they
might count the squares,
or they might measure
by using ruler.
- In determining the
percentage of the area
used to plant chilli,
students might assume
that two small squares
represent 1%, so that 150
squares equals to 75%.
- Students might measure
the length of the drawing
and divide it into ten or
twenty parts, so that they
use benchmark
percentages such as 10%
or 5%.
- Students might compare
the number of all squares
and the number of the
shaded squares. For

55
No Learning Goals Mathematical Ideas Activities Explanation Conjectures
much the percentage of
the area used to plant
chilli?
- Estimating area problem
(without using grid paper)
Problems:
1. Pak Tono has a field
with the area is 100 m2.
From the total area, 60
m2 of the field is used to
plant tomato. Draw the
sketch of the field and
shade the part of the
field used to plant
tomato! How much the
percentage of the area of
the field used to plant
tomato? Explain your
answer!
2. Pak Budi has a field with
the area is 200 m2. From
the total area, 180 m2 is
used to plant corn. Draw
the sketch of the field
and shade the part of the
field used to plant corn!
How much the
discrete objects)
with the previous
activity (in which
they work with grid
paper in
investigating
continuous objects).
example: The number of
total squares is 200, the
number of the shaded
squares is 150, then the
percentage of area used
to plant chilli is 150/200
and it equals to 75/100
or 75%.
- Students might use
algorithm to find the
percentage.
Estimating area problem
(without using grid paper)
- Students will draw the
field in rectangle form.
They might divide the
drawing into many small
squares (make it similar
to grid paper).
- They might draw a
rectangle and divide it
into ten or twenty parts.
- In shading the field used
to plant tomato or corn,
they might just use
estimation or they might

56
No Learning Goals Mathematical Ideas Activities Explanation Conjectures
percentage of the area of
the field used to plant
corn? Explain your
answer!
- Investigating the
percentage of discrete
objects
Problems:
1. Bu Rini sells candies.
She sells grape and
strawberry candies. Bu
Rini has 120 candies that
will be sold. 10% of the
candies are grape
candies. How much
grape candies that Bu
Rini has? Explain your
answer!
2. Bu Sita sells chocolate.
From 60 chocolates that
will be sold, only 12
chocolates that are
unsold. How much the
percentage of the
chocolate that is unsold?
Explain your answer!
measure by using ruler.
- In determining the
percentage of the area
used to plant tomato or
corn, students might
determine 1% of the
drawing or they might
measure the length of the
drawing and divide it
into ten or twenty parts,
so that they use
benchmark percentage
such as 10% or 5%.
- Students might compare
the number of all squares
and the number of the
shaded squares.
- Students might use
algorithm to find the
percentage.
Investigating the
percentage of discrete
objects
- Students might use the
pieces of paper to
represent the candies or

57
No Learning Goals Mathematical Ideas Activities Explanation Conjectures
chocolates.
- Students might group the
pieces of paper into ten
or twenty groups, so that
they get 10% or 5% of
the amount.
- Students might use
algorithm to solve the
problem.
3 Students are able
to construct sense
of percentage as
relative value
- Percentage gives
relative measure,
not an absolute
measure.
- Percentage is an
operator so that it
always related to
something and the
operation of
multiplication is
involved.
- Investigating two
different percentages of
discounts.
Problem:
Istana and Sriwijaya shop
are two shoes shops that
offer different discounts.
Istana shop offered 20%
discount and Sriwijaya shop
offered 25% discount for
their product.
‘If you want to buy shoes,
which shop do you
prefer?’.
In HLT 2, this
activity only
focussed on class
discussion. The
students just
discussed their idea
among friends and
with the teacher, so
that not all students
have opportunity to
share their own idea.
In HLT 3, the
students will be
provided with a
worksheet, so that
each student will
have opportunity to
share their own idea.
- Students will prefer
Sriwijaya shop because
the discount is bigger
than those in Istana shop
so that the price will be
cheaper.
- Some students might
realize that the original
prices in both shops
might be different.
- Students might prefer
Istana shop because of
other considerations such
as the quality or the
distance of the shop.

58
No Learning Goals Mathematical Ideas Activities Explanation Conjectures
After they share their
idea in a given
worksheet, then they
will be engaged in a
class discussion.
4 Students are able
to use percentage
in comparison
problem
- Percentage
describes relative
amount by which
one set is
compared to
another.
- Percentages
indicate the
proportion of a
specific total that
is set to 100.
- Percentage can be
used to standardize
different quantities
so they can be
compared directly.
- Ordering the sweetness of
drinks
Problem:
1. Students are given two
drinks illustrated as
follows:
Do you think both drinks
have the same sweetness? If
not, which drink is the
sweeter drink?
2.
In this activity, there
were two similar
problems that have
to be solved. The
first problem is
simpler than the
second problem. The
first problem
involves simple
proportions that aims
to help students to
not constrained with
the problem
otherwise to help
student to cope with
mathematical level.
- Students might use
fractions to determine
the concentration of
extract orange and then
compare those fractions
by using decimal.
- (The other conjectures
are the same as the
conjectures in HLT1)

59
No Learning Goals Mathematical Ideas Activities Explanation Conjectures
Do you think both drinks
have the same sweetness?
If not, which drink is the
sweeter drink?
5 Students are able
to extend their
knowledge to
percentage greater
than 100.
Percentages are not
always less than 100,
but it can be greater
than 100
- Drawing a chocolate bar
with 50% extra free
Problem:
‘The new product Choco
chocolate have 50% extra
free from the previous
product’
Draw the old and the new
product of chocolate
Choco! If the weight of
the old product is 100
gram, how much the
weight of the new
product? Explain your
answer!
- Investigating the
increasing weight of
chocolate
Problem:
1. The old product of Fresh
toothpaste has weight 200
gram. The new product of
Fresh toothpaste is now
In this activity, we
design one extra
problem about the
expanded field. This
problem aims to
support student to
make progress and
to support them to
transfer to another
context.
- Students might use bar
model to calculate 150%
of 200 gram or 135% of
300 m2.
- (The other conjectures
are the same as the
conjectures in HLT1)

60
No Learning Goals Mathematical Ideas Activities Explanation Conjectures
available with the weight
is 150% of the weight of
the old product.
What do you think about
the new product of
Toblerone? Does it
increase or decrease?
How much the weight of
the new product?
2. Long ago, Pak Budi has a
field with having area 300
m2. Now, Pak Budi has
expanded his field, and the
area of the recent field is
135% of the area of the
previous field. How much
the area of the recent
field? Explain your
answer!

61
CHAPTER V
RETROSPECTIVE ANALYSIS
5 RETROSPECTIVE ANALYSIS
In this chapter, the researcher presented the retrospective analysis from the
teaching experiment. In this teaching experiment, HLT 3 as the refinement of
HLT 2 was implemented in fifth grade of SD BOPKRI III Demangan Baru
Yogyakarta. Twenty five students of fifth grade were involved in this teaching
experiment. The characteristic of the students in this teaching experiment was
somewhat different from the characteristic of the students in the preliminary
experiment. The students were not really active in the class discussion. Most of
the students were not brave to share their opinion or idea. In this teaching
experiment, the mathematics teacher of the fifth grade became the teacher of the
experiment.
Before describing the retrospective analysis of the teaching experiment, the
researcher would describe the coding process done during the analysis. At first,
the researcher defined the initial name of the data by using a letter. For the figures
of the students’ work, the researcher used initial ‘F’ as the code. Besides the codes
for figures, the researcher used initial ‘T’ for teacher, initial ‘R’ for researcher,
initial ‘S’ for students, and initial ‘C1, C2, …, C10’ for ten selected students.
After that, the researcher used numbers towards the letters to indicate in which
phase of the learning process the data is derived and to indicate the order of the
data. As the example, the researcher used the code ‘S-2-001’ to indicate that the
data is decribed what students said in the second phase and in the first order.

62
5.1 Pre test
This pre test was held on March 9th, 2011. The students have learned about
percentage in the school. Since the students have learned percentage, then the pre
test aimed to see the starting point of the students especially their prior
understanding of percentage. It involved investigating students’ sense of fullness
of percentage, the meaning of percent for the students, and the strategy they had to
solve percentage problems.
5.1.1 Exploring students’ sense of fullness of percentage
The first problem: The first problem aimed to see whether the students have sense
about percentage; whether they know that percentage close to 100 means almost
‘all’ and percentage close to 0 means almost ‘nothing’. The problem is about
shading the part of a drawing of a field. The Indonesian context about rice field is
chosen. The story is about the field of Pak Budi. Pak Budi has a patch of field.
90% of the field is used to plant rice. The figure below is the figure of the field of
Pak Budi.
The students were asked to shade the part of the field used to plant rice. There
were twelve students who were able to shade 90% of the field properly. These
students partitioned the field into some parts. They divided the field into ten,
The figure of the field of Pak Budi

63
twenty or a hundred parts and shaded one or two or ninety parts of it. The other
students could not give the correct drawing. Most of the students who could not
give the correct drawing used estimation strategy. They shade a third or a quarter
or a half or three quarter or the whole field to represent 90% of the field.
Analysis of the first problem: Looking back to the aim of the problem, we could
make conclusion that less than a half of the students could shade 90% of the field
properly. There were many students who struggled in estimating 90% of the field.
It seemed that the students did not perceive that 90% means almost the whole
area.
5.1.2 Exploring students’ prior knowledge of the meaning of percent
The second problem: The second problem aims to assess whether the students are
able to make an assumption in solving a problem, and whether they could
determine 10% of a certain amount. The problem is about making a drawing to
express the situation ‘10 percent of flowers are red’.
In making the drawing of the situation above, the students drew a number of
flowers and shaded some flowers representing red flowers. Only ten students
could make the drawing of the situation correctly. These students tended to
choose ten, twenty, or fifty as the total number of flowers so that they could
determine 10% of that amount. For students who were not able to come to the
correct answer, they shaded 10 flowers from the total amount of flowers that they
made.
Analysis of the second problem: Back to the aims of this problem, we can
conclude that the students were able to make an assumption about the reference of

64
the percentage in solving an open problem. However, only ten out of twenty five
students were able to solve the problem correctly. There were many students who
were struggling to figure out the situation. For students who shaded 10 flowers
from whatever the total amount, it seemed that they treated 10% as the whole
number. It indicated that they did not understand the meaning of 10%. This
finding showed that the students need a support especially in reconstructing the
meaning of percent since they have learned about it before.
The third problem: This problem aims to assess whether the students are able to
determine the amount of the part if the percentage and the amount of the whole
are given. The familiar context of a sale was chosen. In the end of the year,
Gemilang book store have a sale. The store offers 25% discount for all books.
Santi wants to buy book in the store with the original price is Rp 30.000,00. The
students are asked to determine how much money Santi should pay.
In solving the problem, most of the students used algorithm. They transformed
25% into fractional form 25/100 and then multiplied 25/100 with 30.000. Only
one student did not use the algorithm; he directly answered the question. It could
be either he used estimation or he just guessed the answer. From twenty five
students, only seven students could give the correct answer. There were seven
students who only answered the reduction price but did not come with the amount
of money that Santi should pay. It could be either the students forgot to continue
their work or they did not understand the task. The other students could not give
the correct answer although they know that they have to multiply 25/100 with
30.000.

65
Analysis of the third problem: From this result, we could conclude that most of
the students could interpret the problem into mathematical language and they
could transform percent into fractional notation. It could be either the students
were familiar with this kind of problem or they just multiplied both numbers
presented in the problem. The result showed that almost three fourth of the
students were struggling in solving this problem. Although they were able to
interpret the problem into mathematical language, they could not arrive to the
correct answer. It might happen because the students tended to do the algorithmic
computation and got difficulties in multiplying fraction with a big whole number
(multiplying 25/100 with 30.000). Some of the students also did not arrive to the
expected answer because they only determined the reduction price and not the
final price. The correct algorithm did not success in leading the student to come to
the expected conclusion because they might only see the numbers given and put it
in the algorithm and they might not pay attention to the context of this problem.
This finding indicated that the students tended to use procedural algorithm that
probably did not make sense for them instead of using their common sense in
solving the problem.
The fourth problem: This problem aims to assess whether students are able to
find the percentage of a proportion. The problem is about the proportion of
students joining music extracurricular in SD Harapan. The students were given
information that the number of students in SD Harapan is 200 students and 40
students join music extracurricular in the school. The students are asked to find
the percentage of the students in SD Harapan joining music extracurricular.

66
Most of the students were not able to solve the problem. Only four students
could answer the problem correctly. The students who could correctly answer the
problem used division strategy or used benchmark percentage to solve the
problem. The students who were not able to solve the problem had different
strategies. Six students subtracted 200 by 40, six students divided 200 by 40, two
students multiplied 40/100 by 200, four students directly stated the percentage,
one student divided 40 by 100, and one student did not give answer.
Some of the students’ work will be presented in the following part.
Figure 5.1 Some of students’ works in determining percentage
Analysis of the fourth problem: Looking back to the aim of this problem, we could
make some conclusions that only few students who were able to find the
percentage from a given proportion. Most of the students were not able to find the
percentage from a proportion. For students who were able to find the percentage,
one student seemed to have an idea about benchmark percentage, and three
students seemed to understand the relation between decimal and percentage. The
other students got confused in solving this problem. From the example of
students’ work, there is one case that showed how the students seemed to use the

67
algorithm in computing the part of a whole while the percentage is given in this
situation. The student seemed to only focus on both numbers and do some
computations with those numbers. Here, we saw that most of the students tended
to use procedural computation that did not make sense for them instead of using
their common sense.
5.1.3 Exploring students’ acquisition in working with percentage greater
than a hundred
The fifth problem: This problem aims to assess whether students are able to solve
problem involving percentage greater than 100. The problem is going about a
toothpaste Prodent that has weight 125% of the weight of the old product. The old
product of toothpaste Prodent has weight 200 gram. The students are asked to
draw the new product of Prodent and to determine the weight of the new product.
Here, the students were given the figure of the old product of toothpaste Prodent.
The result showed that most of the student got confused to solve this problem.
Only five students were able to give the correct answer by using algorithm.
However, only four of them were able to give the correct drawing. The other
students failed to arrive to the correct answer. In this problem, most of the
students could not draw the new product of toothpaste Fresh properly. In drawing
the new product of toothpaste Fresh, thirteen students drew it in bigger size (but
not in a proper way), three students drew it in smaller size, seven students drew in
The old product has
weight 200 gram.

68
the same size, and the other students did not make the drawing.
Analysis of the fifth problem: Back to the aim of this problem, we could conclude
that most of the students got confused in solving percentage problem involving
percentage greater than 100. Almost a half of the students did not have sense that
percentage greater than 100 indicates that something is increase. It might be that
either they have not learned about percentage greater than 100 in the school or
they have not enough knowledge about percentage greater than 100.
5.1.4 Exploring students’ acquisition in using their prior knowledge to solve
a problem
The sixth problem: Since, the students had learned percentage, this problem aims
to assess whether students are able to use percentage in solving proportional
comparison problem. The problem is about ordering the sweetness of drinks.
Sweet Orange and Fruitty are two kinds of orange drink. Those drinks have the
total volumes of drink and volumes of orange juice that are different. The students
were asked to determine which drink is the sweeter drink.
Drink Total Volume of Drink Volume of extract orange
Sweet Orange 500 ml 150 ml
Fruitty 400 ml 140 ml
In solving the problem, almost all students answered that Sweet Orange is the
sweeter drink. Those students had various strategies to solve this problem. Four
students divided the total volume of drink by the volume of extract orange. Two
students added the total volume of drink and the volume of extract orange. Five
students only looked at the volume of extract orange. Seven students only looked
at the total volume of drinks, and three students did not give reason. Besides those

69
strategies, there was one student who answered by using percentage. However, he
could not give the correct reasoning. He directly answered that the concentration
of extract orange in Sweet Orange is 15% and the concentration of extract orange
in Fruitty is 14%. Besides those answers, there was only one student answered
that Fruitty is the sweeter drink. The student who answered that Frutity is the
sweeter drink used percentage to answer the problem. His answered goes as
follows
Figure 5.2 Rio’s answer in the pre test in determining the sweeter drink
Analysis of the sixth problem: Looking back to the aim of this problem, we could
conclude that most of the students got confused in solving proportional
comparison problem. The result showed that most of the students did not realize
that the problem is about proportional comparison problem. It could be that either
they did not familiar with this kind of problem or they were not able to use their
previous knowledge about fraction or percentage to solve this proportional
comparison problem. However there were two students that seemed to have idea
about determining the concentration of extract orange by comparing the volume
of extract orange and the total volume of drink. Those students used percentage to
solve the problem, but they could not come to the correct answer. One student

70
who answered that the concentration of extract orange in Sweet Orange is 15%
seemed to get confused to find percentage from a proportion. It might happen
because he did not have fully understanding of percentage. One student who
answered that Fruitty is the sweeter drink seemed to have an idea to use bar model
to solve the problem. However, he failed to come to the correct answer. It could
be that either he was not used to using this strategy or he did not do it thoroughly.
5.1.5 Conclusion of the pre test
The pre test of the teaching experiment showed that the students in grade 5
in SD BOPKRI III Demangan Baru Yogyakarta already have had prior knowledge
about percentage. They were able to convert percentage into fraction and they
knew the algorithm to solve percentage problem although not all students did the
algorithm in proper way. However, it does not mean that they understand the
concept of percentage. Some students did not have sense of the fullness of
percentage. Many students struggled to find an amount if the percentage is given
or to find the percentage from a proportion. Most of the students also got confused
in solving a problem involving percentage greater than 100. Therefore, the
researcher could conclude that the students still needed support to help them to
acquire the concept of percentage as well as the strategies used to solve
percentage problem.

71
5.2 Retrospective Analysis of the HLT 3
5.2.1 Developing sense of fullness of percentage
At the beginning of the lesson, the application program of loading bar was
displayed in the front of the class so that the students could saw and observed how
loading process works in a computer program. The application program was
designed in interactive way so that the students could be engaged in class
discussion. When the application was displayed and when the percentage of
loading process was hidden, the students were invited to estimate the percentage
of loading process. The students contributed by giving opinion about their guess
of the percentage. The activity then continued with estimating the percentage of
some drawings of loading process and shading the part of loading bar that is fully
loaded. The students worked in group of four to estimate the percentage and to
shade the bar of loading process. The classroom mathematical practice that
emerged in these activities was recognizing the fullness of percentage.
In this activity, the students were engaged in a class discussion to discuss
about the characteristic of loading process and about the meaning of the
percentage showed in loading process. The researcher showed the application of
loading process in a computer, displayed the application of loading process, and
invited the students to be aware that percentages close to 0 means almost nothing
and percentages close to 100 almost everything.
R-1-001 : Where do you usually look loading (process)?
S-1-001 : in games
R-1-002 : in games...and then?
S-1-002 : in internet
R-1-003 : what else?
S-1-003 : in hand phone
R-1-004 : Are there percentages (in the loading)?

72
S-1-004 : Yes, there are
R-1-005 : The percentage is started from what number?
S-1-005 : zero
R-1-006 : zero until?
S-1-006 : zero until a hundred
R-1-007 : not until a thousand?
S-1-007 : no
R-1-008 : [Displaying the application program of loading process] There is a
loading (process) started from zero. We click ‘play’ and then it (the
percentage) runs until?
S-1-008 : a hundred
R-1-009 : We will check whether it runs until a hundred.
[After a few minutes]Yaa...then a game appears. Since we will not play
this game, then we will close this game. We just saw that the percentage
runs from zero until? [The application of loading process shows how
the percentage of loading process runs from zero until a hundred and
after that a game appears]
S-1-009 : a hundred
R-1-010 : We will do it again. We click play and we click pause. What is the
number? [The researcher displays again the application of loading
process. She pause the loading in 58%.]
S-1-010 : Fifty eight
R-1-011 : Fifty eight. How much approximately is the shaded part?
S-1-011 : a half [some students keep quite and wait their friends to answer the
question]
R-1-012 : a half.... Then we click ‘play’ again. If ninety? What does it mean if we
are playing a game?
S-1-012 : The game will start soon [some students keep quite and wait their
friends to answer the question]
R-1-013 : Does the shaded part is almost full?
S-1-013 : Yeah
R-1-014 : If the loading is 100%, how about the shaded part?
S-1-014 : full
R-1-015 : What does it mean if we are playing a game?
S-1-015 : The game starts.
The socio and socio mathematical norms held a big influence in this
activity. In the discussion, most of the students kept quiet and waited for the other
fellow to answer the question (S-1-011; S-1-012). From the conversation above,
the researcher saw that the researcher took a big role during the discussion by
always guiding the students to answer each question. There was no place for the
students to think about different answers and to do negotiation among them to
discuss acceptable answer and justification. Based on these findings, the

73
researcher could conclude that the students did not have enough experience in
exploring the fullness of percentage in loading process. Therefore the researcher
did not enough arguments to conclude whether the students have already
perceived the sense of fullness of percentage.
The activity then continued with estimating the percentages of some
drawings of loading process. In estimating the percentage, each student worked in
a given worksheet and they could discuss with their friends in group. There were
many strategies used by the students to estimate the percentage of loading process
such as measuring the length of loading bar, guessing, combining guessing and
measuring, and dividing the bar into ten parts.
Figure 5.3 Various students’ strategies to estimate the percentage of loading
process
F-1-01
F-1-02
F-1-03
Because this just a half of 50
1 bar is10 cm = 100%
The shaded part 1 cm = 10%

74
The Figure 5.3 above showed that the students were able to estimate the
percentage of loading process. For the students who only guessed the percentage
(F-1-01), there were two conjectures drawn out from this strategy. The first
possibility was that the students had strong imagination about how loading
process works and the second possibility was that the students did not consider the
need of precision in measurement. For the students who divided the bar into ten
parts (F-1-02), there was a conjecture drawn out from this strategy. The conjecture
was that the students could relate their previous experience in working with
shaded area to learn about fraction as part whole relationship. There was also a
conjecture drawn out from measuring strategy. For the students who measured the
length of the loading bar (F-1-03), the conjecture was that the students consider
the need of precision in measurement. Although the previous activity could not
show that the students have already perceived the sense of fullness of percentage,
in this activity the students seemed to have already perceived the sense of fullness
of percentage.
In the end of this activity, a conflict emerged when the students were asked
to estimate the percentage of loading bar that has different length; the length of
the loading bar is 20 cm and the shaded part has length 5 cm. Around a half of the
students were able to solved this problem. Other students could not give the
correct answer. Some students answered that since 1 cm represent 10% then the
percentage of the loading process is 50%. There were two conjectures drawn out
from this answer. The first possibility was that the students did not consider that
the length of the bar in this problem was different from the previous problems.

75
The second possibility was that the students did not completely consider that the
percentage of loading process can be represented by different drawings. The
following vignette showed how the teacher helped a student who wrote 50% as
the answer.
T-1-001 : How much approximately is the length of the shaded part?
C1-1-001 : 5 (cm)
T-1-002 : Ehmm... If the shaded area is as big as this? [Pointing to the middle of
the bar]
C1-1-002 : Fifty percent
T-1-003 : [Pointing to his answer] So...Is the shaded part as big as this (the middle
of the bar)?
C1-1-003 : No
T-1-004 : How much approximately is the shaded area?
C1-1-004 : Ehmm...this fifty [pointing to the middle of the bar]
T-1-005 : How much is the percentage of loading process from this (the beginning
of the bar) until this (the end of the bar)?
C1-1-005 : A hundred
T-1-006 : If the loading only end until this [pointing to the middle of the bar]?
C1-1-006 : Fifty percent
T-1-007 : Hmmm...so how much is it (the shaded part)?
C1-1-007 : Twenty five (percent)
T-1-008 : Give explanation for your answer on your worksheet
C1-1-008 : (He writes ‘loading = 25% because it close to 25%’)
From that answer it showed that the student (C1) corrected his previous
answer. It seemed that the student could estimate the percentage of loading
process although the length is different. At first he got confused because this
problem looks similar with the previous problems. It indicated that the students
need more experience in estimating percentage of loading bars with various
lengths.
The activity is continued with shading the part of loading bar that is fully
loaded. The teacher gave the empty bars to the students and the percentages of
loading process. In this activity, the students worked in the same group. After
finishing their work, all groups stuck their drawing in a poster paper.

76
Figure 5.4 Students’ work in shading the loading bar
From the figure above, it showed that almost all groups could shade the
loading bar properly. Most of them used measuring strategy; they divided the
length of the bar into ten or twenty parts so that they knew the length of the bar
representing 5% or 10%. Here, they started to consider the use of benchmark
percentage (10% and 5%).
The following vignette shows how the teacher engaged the students to conclude
what they have learned through investigating loading process.
T-1-009 : If you remember on what you have done, if the shaded area goes to the
right side, then it close to?
S-1-016 : close to 100
T-1-010 : What does it mean?
C2-1-001 : It will start soon
T-1-011 : How about the shaded part if it will close to 100?
C2-1-003 : Almost full
T-1-012 : Otherwise, if the shaded close to the left side?
S-1-017 : Close to 0
T-1-013 : What does it mean?
S-1-018 : It will be empty
T-1-014 : How about the shaded part?
C3-1-001 : Short
C2-1-004 : Small
1st group
2nd group
3rd group
4th group
5th group
6th group
Loading: 95% Loading: 20% Loading: 11%
F-1-04

77
T-1-015 : Can you conclude by yourself?
C4-1-001 : The shaded area close to the left side it will close to zero. The shaded
part close to the right side it will close to 100.
In the short vignette above, it appeared that the students preferred to say ‘zero’
instead of ‘zero percent’ or ‘a hundred’ instead of ‘a hundred percent’ (S-1-016; S-
1-017). It seemed that the symbol percent was not so meaningful for them. They
just paid attention to the number of the percentage. However, the visualization of
how loading process works was very important in stimulating students to see the
relation between the percentage and the shaded area representing part that is fully
loaded (C4-1-001).
From investigating loading process and the class discussion, the students
can imagine how the percentage runs along the scale as well as the shaded part
representing the fully loaded area. Students also commenced to explore the basic
concepts of percentage that is the meaning of percentage as part whole
relationship and also commenced to acquire the idea of benchmark percentage (F-
1-02; F-1-03). From these activities, most of the students seemed to consider the
need of precision in measuring (F-1-03; F-1-04). This is a good finding that can
be used to construct the meaning of percent in the next discussion. Overall, in this
activity most of the students had already perceived the sense of fullness of
percentage.
5.2.2 Constructing the meaning of percent
From the pre test result, it showed that the students tended to use algorithm
to solve percentage problem. It happened because they have learned about
percentage before. However, many students often got confused in using the
procedure to solve the problem. It indicated that the students did not completely

78
grasp the concept of percentage. The concept of percentage, that one has to grasp
in order to have understanding of percentage, is that that percentage indicates part
whole relationship in which there were one hundred parts within a whole. The
students did not necessarily have to explain in this manner. However, they have to
show an awareness of the fact that if one divides a whole into one hundred parts
then one small part represents 1% of the whole, or if one divides a whole into ten
parts then one small part represents 10% of the whole.
There were three tasks in this phase. First, the students were asked to
investigate two area problems by drawing a sketch in a grid paper. In the second
activity, they also were asked to investigate two area problems but in this activity
they have to make a sketch in a blank paper. Third, the students were given two
percentage problems dealing with discrete objects. On the first task, most of the
students could perform well. They could explore the idea of percent as ‘so many
out of 100’ and they started to develop bar model. In this activity, they used the
grid paper to estimate the percentage. However, the researcher made a highlight of
this accomplishment. Since in the first activity the students seemed to rely on the
grid paper, we were afraid that the students got difficulties when they have to
transfer to other contexts. In the second activity, the students used their previous
experience in working with grid paper to estimate the percentage. Here, some
students started to use bar model as a tool to solve the problem. In the third
activity, most of the students made an arrangement of the pieces of paper to
estimate the percentage. Here, most of them made groups of ten.

79
The first activity: investigating area problems using grid paper
There were two problems posed in this activity. The problems were given as
follows:
1. Pak Rahmat wants to build a house in the area of 100 m2. 10% of the area will
be used as fishpond, 75% will be used as the building of the house, and the rest
15% will be used as the yard. Make the sketches of the house and determine
the area used as fishpond, the building of the house, and the yard!
2. Pak Rahmat has a field with the area is 200 m2. Some parts of the field used to
plant chilli. The area of the field used to plant chilli is 150 m2. How much the
percentage of the field used to plant chilli!
In solving the first problem, most of the students argued that since there were one
hundred squares that represent 100%, then one square is 1%. However in
answering the area used as fishpond, the building of the house, or the yard the
students tended to use ‘square’ as the unit area instead of using ‘m2’. It might
happen maybe because the squares on the grid paper were more real in their mind
rather than using standard unit area. In the second problem, most of the students
argued that two squares represent 1%. They came to this idea maybe because they
realize that the second sketch is twice bigger than the first sketch. There was an
interesting finding in this second problem. There were five students that seemed
to develop their own model bar to solve the problem. The figure below is an
example of students’ work that started to develop bar model.

80
Figure 5.5 Bar model used to estimate percentage of the area used to plant chilli
From the Figure 5.5 above, it showed that the student used their drawing to solve
the problem. Since the student reasoned that two squares represent 1% then they
argued that two columns (consist of twenty squares) represent 10% although they
tended to write ‘10’ instead of ‘10%’. Since this drawing is the representation of
the field and they used the representation to solve the problem, then the researcher
might conclude that those students started to develop their own bar model to solve
the problem. These findings showed that the students seemed to perceive the
meaning of percent as ‘so many out of a hundred parts’.
Since in this activity the students made two sketches; the sketch of house
and the sketch of a field, then the teacher prepared two sketches in big size for
class discussion so that all students could see it clearly. The sketches were made
based on the students’ drawing.
F-2-01

81
Based on the drawings above, the teacher engaged the students to observe and
compare both sketches. The teacher stimulated the students to perceive the
meaning of percent.
T-2-001 : Now you see that this [pointing to the shaded part in F-2-03] is 75%
and this [pointing to the red shaded part in F-2-02] is 75%. This
[pointing to the red shaded part in F-2-02] is the sketch of the house of
Pak Rahmat and this [pointing to the shaded part in F-2-03] is the
sketch of his chilli field. What can you conclude from this?
S-2-001 : [the students keep quite]
T-2-002 : This [pointing to the shaded part in F-2-03] is 75% and this [pointing to
the red shaded part in F-2-02] is also 75%....but..... Come on...
C5-1-001 : The chilli field is larger because the number of squares is 200. The
number of squares in the first problem is 100.
T-2-003 : Ooo..yaa...
C4-1-001 : (Raising his hand)
T-2-004 : Come on Bayu
C4-1-002 : The larger area is the chilli field because the total area is 200 m2 and
that [pointing to F-2-02] the total area is 100 m2. In the book
(worksheet) for the area 100 m2, one square is one percent or 1 m2. For
the area 200 m2, two squares are 1m2 or one percent.
From the reasoning of two students C4 and C5, it seemed that they started to be
aware that the same percentage could represent different area because it depends
on the total area. The argument of the student in the vignette above showed that
the squares in the grid paper served as important tool to help students to estimate
The sketch of the first problem The sketch of the second problem
F-2-02 F-2-03

82
percentage (C4-1-002). However, this vignette showed that the students preferred
to count the squares rather than the unit measurement of area (C5-1-001; C4-1-002).
It might happen because the students were struggling with the concept of area.
The second activity: investigating area problems without grid paper
In the second activity the students were asked to solve the similar task about
making the sketch of field used to plant vegetables. Since the students were not
provided with grid paper, they had to determine the size of the drawing by
themselves in a blank paper. On making drawing of the field, first the students had
to know how to make a drawing with a certain area.
From the observation, it showed that the students had different drawings. In
drawing the field having area 100 m2, most of the students drew with size 10 cm x
10 cm and one student drew with size 10 cm x 5 cm. In drawing the field having
area 200 m2, most of the students drew with size 20 cm x 10 cm, one student drew
with size 10 cm x 10 cm, and one student drew with size 10 cm x 5 cm. Although
they had different sizes of drawing, they were able to make the sketch of the field
properly.
In estimating the percentage of the field used to plant vegetables, the
students had various strategies to solve the problems. Those strategies are dividing
the drawing in grid pattern, dividing the drawing into ten or twenty parts
horizontally, using benchmark percentages such as 1%, 5%, or 10%, and using
algorithm. Reflecting this result to the result of the first activity, it showed that the
students were able to develop strategies to solve this kind of problem. It seemed

83
that the grid paper in the previous activity was caught well by the students. Below
the examples of students’ strategies:
Figure 5.6 One of students’ strategies using 10% as the benchmark percentage
Figure 5.7 One of students’ strategies using grid pattern
The area of the field is 200 m2
The area used to plant corn is 180 m2
So 1% = 2 squares (If the area used to plant
corn is 180 m2) = 90%
F-2-04
F-2-05
90% to plant tomato

84
From the figures above, it seemed that the students could explore the meaning of
percent as ‘so many out of a hundred’ (F-2-04; F-2-05). Although they did not say
in this manner, they showed an awareness that when they divided a whole into ten
parts then one small part represent 10% or when they divided a whole into a
hundred parts then one small part represent 1%. The Figure 5.6 showed that the
students used bar model as a tool to solve the problem.
From these findings, it can be concluded that the students were proficient in
making a drawing with a certain area (F-2-01; F-2-04; F-2-05). The tool (grid
paper) used in the first activity served as good hold for students to explore the
meaning of percent and to develop bar model (F-2-01; F-2-04). Therefore, the
area context and grid paper could help the students to explore the meaning of
percent.
The third activity: investigating percentage problems dealing with discrete object
In this activity, the students were given two options either they want to use
some pieces of paper (in the rectangle form) as the representation of the candies or
chocolate as the discrete objects in the problems or not. These pieces of paper
were given as a tool to support the students on representing the situation and to
develop their own bar model. The students were asked to solve two problems.
Since both problems were similar, then in this analysis we only focus on the first
problem. The students were told that 10% of 120 candies were grape candies, and
they were asked to determine the amount of the grape candies.
In solving the problem, most of the students used the pieces of paper as a
tool to solve the problem. They arranged the pieces of paper into ten groups.

85
However, there was one group that did not use the pieces of paper. They directly
work with numbers. Those students divided one hundred and twenty with ten so
that they got twelve as the answer. The figure below is an example of the
students’ works that used the pieces of paper to solve the problem.
Figure 5.8 The work of Rani’s group
The following vignette showed how the teacher attempted to explore students’
reasoning in arranging the pieces of paper.
T-2-005 : How much percent is all of them [pointing to the pieces of paper]?
S-2-002 : one hundred percent
T-2-006 : There are ten equal parts...this is twelve.....and twelve...and twelve...and
each part consist of twelve. Which part represents 10%?
S-2-003 : this one [pointing to the left side that were twelve white pieces of paper]
T-2-007 : How do you know?
C6-2-001 : Because the total is ten
C2-2-001 : 120 divided by 10
T-2-008 : There are ten parts. All parts is 100%. So, how much percent is one
part?
S-2-004 : Ten percent
T-2-009 : Now if I take two parts, how much percent is it?
C2-2-002 : Twenty
T-2-010 : How much percent is it [pointing to two parts of the pieces of paper]
Agung?
C6-2-002 : one hundred
T-2-011 : How much percent is all of them?
C6-2-003 : one hundred
T-2-012 : Now, if I take the white part, how much percent is it?
C6-2-004 : ninety percent
C2-2-003 : The white part
C6-2-005 : oooo the white part is 10%
T-2-013 : If I take two parts, how much percent is it?
F-2-06

86
C6-2-006 : Twenty percent
T-2-014 : If I take three, how much percent is it?
C6-2-007 : Thirty percent
T-2-015 : If I take four, how much percent is it?
C6-2-008 : Fourty percent
T-2-016 : If I take nine parts
C6-2-009 : That’s ninety percent
To solve the problem the students arrange the pieces of paper in such a way
that it forms bar model (F-2-06). The vignette above showed that although the
students were able to use the pieces of paper to figure out the situation and solve
the problem, they were struggling to describe their idea (C6-2-002; C6-2-004).
However, the arrangement of the pieces of paper seemed to help them to
understand the problem, and it could bridge students’ thinking to their previous
experience in working with the area problem.
As the conclusion of these activities, the students could explore the meaning
of percent as so many out of a hundred through exploring the area problem with
the support of grid paper and discrete object problem with the support of pieces of
paper. However, the researcher made a highlight of this accomplishment. As the
reflection was that this instruction was not really challenge the students to really
think about the meaning of percent as so many out of a hundred. Although the
students could explore the meaning of percent, they were not challenged to
explore this idea. The researcher conjectured that it was caused by two things. The
first was that the students were too much assisted by patterns and structures that
were provided in the problems. The second was that the numbers involved in the
problems were beautiful numbers (multiple of a hundred) so that it was easy to
talk about percent.

87
In the observation, it seemed that in these activities the teacher tried to gave
students more opportunities to describe their ideas. By engaging the students to
explain their thinking in a group and in the class discussion showed that the
teacher established the norm on giving explanation of the answer. However, other
social norms also held a big influence in these activities. For example, when the
teacher asked them to give conclusion, instead of contributing to give ideas, many
students only wait for the other students to respond or when they worked in the
group, instead of sharing ideas together, some students only follows the ideas
from the clever students.
5.2.3 Constructing sense of percentage as a relative value
After constructing the meaning of percent, constructing the sense of
percentage as a relative value was the main issue in this activity. Discount
context was chosen as a rich context to bring the students to explore the idea of
percentage as a relative value. The teacher told to the students about an
advertisement in the newspaper that shows two shoe shops offer different
discounts for their product. Here, the students were asked to choose which shop
they prefer if they want to buy shoes. The picture of the advertisement is given as
follows.

88
The ways in which the two shops advertise their discount convey the suggestion
that the two shops might have different original prices. This clue is given on
purpose to alert the students to consider to what the percentages might refer.
Below the discussion in the beginning of the lesson:
T-3-001 : There were two shops, this is Istana shop and this is Sriwijaya shop. I
am interested because my shoes have broken.
Toko Istana offer 20% discount and toko Sriwijaya offer 25% discount.
Can you guess which shop I prefer to buy shoes?
S-3-001 : Sriwijaya… Sriwijaya… Sriwijaya
T-3-002 : What is the reason Rita?
C7-3-001 : Because the discount is bigger
T-3-003 : ooo…because the discount is bigger. What else?
S-3-002 : [keep quite]
T-3-004 : Do all of you prefer Sriwijaya?
(A few minutes later)
T-3-005 : Who prefer Sriwijaya shop?
S-3-003 : [most of the students raise their hand]
T-3-006 : I prefer Istana shop
S-3-004 : haahh??
C5-3-001 : The product is better
T-3-007 : Why?
C5-3-002 : because the product (the quality) is better
T-3-008 : What else?
C4-3-001 : In Sriwijaya the price is more expensive and the price in Istana is
cheaper. For example the price in Istana is Rp 100.000,00 and the price
in Sriwijaya is Rp 200.000,00. So 25% from Rp 200.000,00 is as much
as this, and 20% of Rp 100.000,00 is as much as this.
T-3-009 : Oooo yaaa…
From the vignette above it showed that at first all students preferred to buy shoes
in Sriwijaya shop (S-3-001). They choose Sriwijaya shop because the discount
offered is bigger than those in Istana shop. It seemed that the students only
compared both percentages absolutely. To provoke the students, the teacher made
a supposition and she said that she might prefer to buy shoes in Istana shop (T-3-
006). This supposition helped the students to think other aspects besides
percentage of discount that made the teacher prefers Istana shop. Dias’ opinion
about the quality of the product indicated that he use his common sense in

89
preferring something to buy (C5-3-001). Bayu’s opinion about the different
original prices indicated that he started aware that those percentages relate to the
original prices (C4-3-001). After this discussion, the teacher asked the students to
discuss the problem with their friend in pair and write their answer in the
worksheet containing the pictures of advertisement in Sriwijaya and Istana shop
and the problem.
From the students’ answer of the worksheet, it showed that the students had
different ideas. Some students prefer to buy shoes in Sriwijaya shop, and the other
students prefer to buy shoes in Istana shop. The amount of the discount, the
quality of the product and the availability of the product were the reasons behind
their answer. This finding was different from the first finding where all students
preferred to buy shoes in Sriwijaya because the discount is bigger. It might
happen because the teacher asked them to look the pictures of advertisement that
is showed in different manner. Almost a half of the students seemed to start aware
that they cannot compare those percentages absolutely but they have to relate it to
the original price. Therefore, to investigate this finding, the analysis was focused
on students’ reasoning when they answer the problem.
Students’ answer and reasoning in determining which shop they prefer are
described as follows:
a. Preferring to buy shoes in Sriwijaya shop.
Students who preferred Sriwijaya shop because the discount is bigger seemed
to treat the percentage of discount as a quantity rather than as a relation. Kiki
was one of the students who argued that he preferred Sriwijaya shop because

90
Sriwijaya shop offered 25% discount whereas Istana shop only offered 20%
discount. The fact that Kiki still only compared the percentage of discount
indicated that he did not consider that percentage in discount gives a relative
measure and not an absolute measure. However, there were five students who
preferred Sriwijaya shop gave assumption that the original prices in both shops
are the same. It is clear that these students knew that a percentage is related to
something. The students who gave an assumption of the original prices tended
to use beautiful numbers such as Rp 100.000,00 or Rp 200.000,00. The
students who chose those beautiful numbers were able to take 20% or 25% of
those amounts. However, there was a student (Deri) who chose Rp 150.000,00
as the original prices in both shops. Deri made mistake in taking 20% or 25%
of Rp 150.000,00. He answered that the new price in Sriwijaya shop is Rp
125.000,00 and in Istana shop is Rp 130.000,00. He came to this answer
because he argued that ‘25% of Rp 150.000,00 is Rp 25.000,00 and 20% of Rp
150.000,00 is Rp 20.000’. This fact showed that the student was struggling
over how to take 25% or 20% of an amount. Even though there were some
students who able to take 25% or 20% of an amount, it could not give enough
argument to say that the students were able to take a certain percent of an
amount, since they tended to use such beautiful numbers.
b. Preferring to buy shoes in Istana shop.
There were several reasons behind the choice of preferring Istana shop. The
original prices, the quality, and the availability of the product were the reasons
behind their choice. 7 out of 16 students who preferred Istana shop argued that
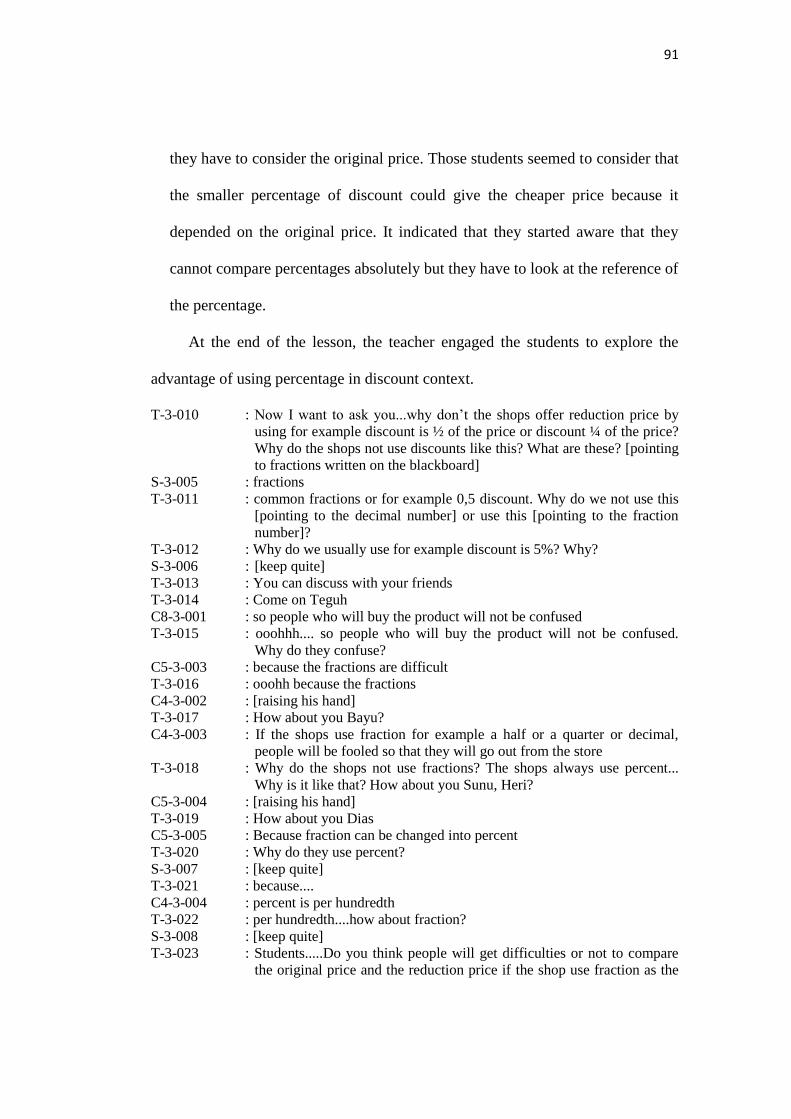
91
they have to consider the original price. Those students seemed to consider that
the smaller percentage of discount could give the cheaper price because it
depended on the original price. It indicated that they started aware that they
cannot compare percentages absolutely but they have to look at the reference of
the percentage.
At the end of the lesson, the teacher engaged the students to explore the
advantage of using percentage in discount context.
T-3-010 : Now I want to ask you...why don’t the shops offer reduction price by
using for example discount is ½ of the price or discount ¼ of the price?
Why do the shops not use discounts like this? What are these? [pointing
to fractions written on the blackboard]
S-3-005 : fractions
T-3-011 : common fractions or for example 0,5 discount. Why do we not use this
[pointing to the decimal number] or use this [pointing to the fraction
number]?
T-3-012 : Why do we usually use for example discount is 5%? Why?
S-3-006 : [keep quite]
T-3-013 : You can discuss with your friends
T-3-014 : Come on Teguh
C8-3-001 : so people who will buy the product will not be confused
T-3-015 : ooohhh.... so people who will buy the product will not be confused.
Why do they confuse?
C5-3-003 : because the fractions are difficult
T-3-016 : ooohh because the fractions
C4-3-002 : [raising his hand]
T-3-017 : How about you Bayu?
C4-3-003 : If the shops use fraction for example a half or a quarter or decimal,
people will be fooled so that they will go out from the store
T-3-018 : Why do the shops not use fractions? The shops always use percent...
Why is it like that? How about you Sunu, Heri?
C5-3-004 : [raising his hand]
T-3-019 : How about you Dias
C5-3-005 : Because fraction can be changed into percent
T-3-020 : Why do they use percent?
S-3-007 : [keep quite]
T-3-021 : because....
C4-3-004 : percent is per hundredth
T-3-022 : per hundredth....how about fraction?
S-3-008 : [keep quite]
T-3-023 : Students.....Do you think people will get difficulties or not to compare
the original price and the reduction price if the shop use fraction as the

92
discount. For example discount if 1/5, do you think people will get
difficulties?
S-3-009 : Yes....they will get difficulties
T-3-024 : Yeah....they will get difficulties to compare the original price and the
reduction price.
In the vignette above, the teacher attempted to provoke the students to think about
the uses of percentage in discount context (T-3-010; T-3-011; T-3-012). This
vignette showed how the students were struggling to communicate their idea. In
the observation, we showed that the teacher attempted to give more chance to the
students to share their idea but the students tended to be passive. The socio norm
also held big influence in this activity. Most of the students tended to wait their
fellow to share their idea rather than joined actively in the discussion and only
certain students were involved in the class discussion (S-3-006; S-3-007; S-3-008).
In computing the reduction price in both shops, most of the students directly
answer without doing any procedural computation and only few students uses
procedural algorithm. It might happen because both percentages (25% and 10%)
were easily converted into simple fraction and most of the students also choose
beautiful number such as Rp 100.000 as the original price so that they could
directly determine 20% or 25% of Rp 100.000. From this finding, it showed that
the students did not use their previous experience in working with benchmark
percentages or bar model to solve percentage problem. However, from the
activity, it showed that the students learned something new about the relativity of
percentage.
As the conclusion, based on students’ answer in the worksheet and their
reasoning during the activity, it is showed that almost a half of the students
seemed to start aware that in comparing discount they cannot only compare the

93
percentage of discount absolutely but they have to know the reference of the
percentage. This finding indicated that those students started to be aware that
percentages of discount give relative value and not absolute value so that one
could not compare it directly without taking into account to what they refer.
However, there were some students who were still struggling with this idea. The
students who compared the two percentages absolutely need more help. They
must learn that one cannot treat a percentage as an absolute number. At the end of
the class discussion the students started to be aware of the advantage of using
percentage in discount context. They started to realize that percentage in discount
context help people to compare the proportion of the reduction price and the
original price. Furthermore, the advantage of using percentage in comparing
proportion will be explored further in the next phase of learning.
As the reflection, there were some remarks on the problem. The first one
concerns the clarity of the problem. Asking for choosing which shop they prefer
can make students could be confused. The question is not clear whether it refer to
the cheapest price or the biggest amount of the reduction price and whether the
students could compare two different products. Another remark concerns on the
improvement of the problem. One cannot judge that the students who compared
the percentages absolutely really lack of understanding of the relativity of
percentage. Students who compared the percentages absolutely might understand
the relativity of percentages but they still need extra help in expressing this. To be
certain about this, the problem could be improved by extending it with an
additional question.

94
5.2.4 Using percentage in proportional comparison problem
From the result of the pre test, it showed that most of the students got
confused in solving proportional comparison problem. It was conjectured that
they were not used to solve this kind of proportional comparison problem or they
did not realize about the advantage of using percentage in solving this kind of
problem. In solving proportional comparison problem in the pre test, most of the
students seemed to only compare absolutely the part without comparing to the
whole. Consequently, the idea of percentage as a relative value of the part
compared to the whole became the main issue in this activity. Here, the students
were expected to be able to use their previous knowledge especially about
percentage in a situation in which they are needed; when different parts of
different wholes have to be compared.
The teacher started the activity by telling a story about making orange juice.
Then the teacher showed two orange drinks that consist of different volumes of
extract orange and different total volumes of drink. In this activity the students
were asked to determine whether both drinks have the same sweetness and if both
drinks did not have the same sweetness, they have to determine which drink is the
sweeter drink. This activity was continued by working with worksheets contained
two similar problems. The difference only on the numbers involved. From the
students’ answer, it showed that the students made an improvement in solving the
first and the second problem. On the first problem, most of the students got
confused in solving the problem. Almost a half of the students did not realize that
the problem is about proportional comparison problem. They only look at the

95
volume of extract syrup or the total volume of drink and compare it absolutely.
However, there were seven students who could answer the problem correctly.
Determining the concentration of extract orange by using fraction or percentage or
using doubling strategy became the strategies used by seven students to solve the
problem. On the second problem, only four students compared absolutely the
volume of extract orange. Most of them realized that the problem is about
proportional problem so that they could not compare the volume of extract orange
absolutely to determine the sweeter drink. However, only nine students were able
to solve the problem correctly. These findings indicated that there is a little
improvement achieved by the students. These findings also indicated that the
students were still struggling to apply their previous knowledge about percentage
or fraction or decimal to solve this proportional comparison problem. However,
from the correct answer it was difficult to conclude whether those correct
solutions reflected that they knew why they have to compare the volume of
extract orange and the total volume by using percentage, fraction or decimal and
whether the students knew the advantage of using percentage in solving this kind
of problem.
One of the strategies used by the students is using percentage. The
following excerpt is an example from Bayu who used this strategy.
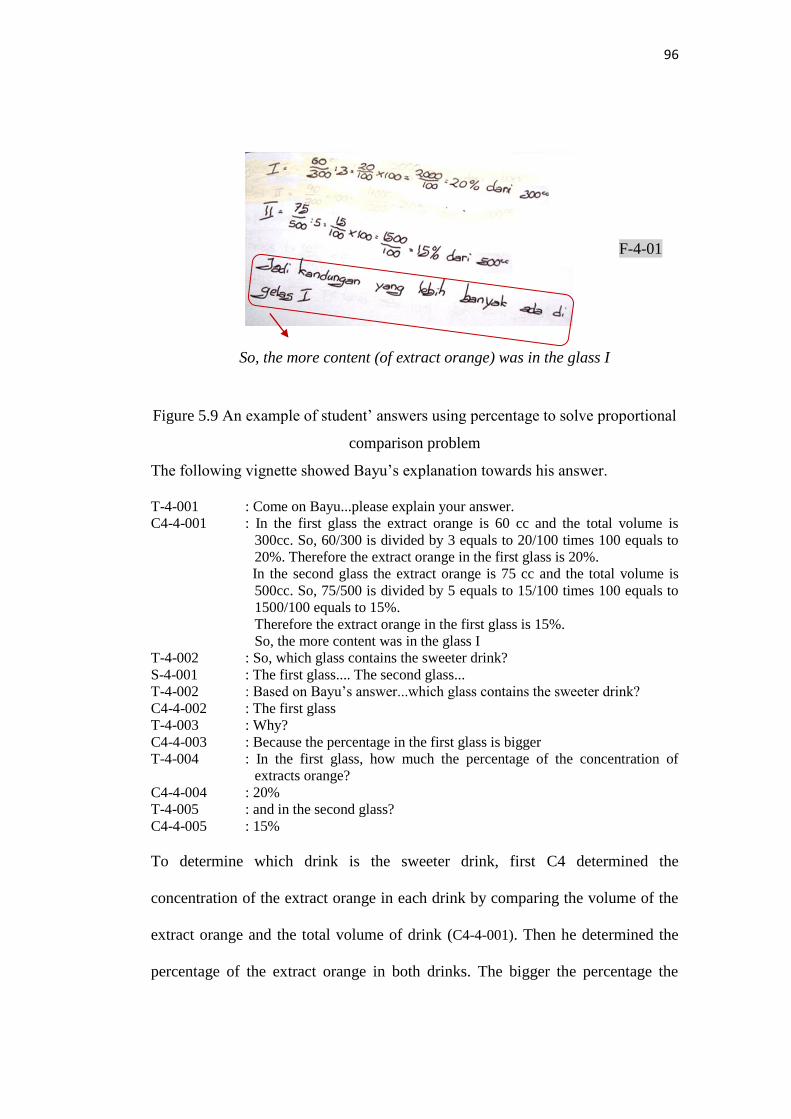
96
Figure 5.9 An example of student’ answers using percentage to solve proportional
comparison problem
The following vignette showed Bayu’s explanation towards his answer.
T-4-001 : Come on Bayu...please explain your answer.
C4-4-001 : In the first glass the extract orange is 60 cc and the total volume is
300cc. So, 60/300 is divided by 3 equals to 20/100 times 100 equals to
20%. Therefore the extract orange in the first glass is 20%.
In the second glass the extract orange is 75 cc and the total volume is
500cc. So, 75/500 is divided by 5 equals to 15/100 times 100 equals to
1500/100 equals to 15%.
Therefore the extract orange in the first glass is 15%.
So, the more content was in the glass I
T-4-002 : So, which glass contains the sweeter drink?
S-4-001 : The first glass.... The second glass...
T-4-002 : Based on Bayu’s answer...which glass contains the sweeter drink?
C4-4-002 : The first glass
T-4-003 : Why?
C4-4-003 : Because the percentage in the first glass is bigger
T-4-004 : In the first glass, how much the percentage of the concentration of
extracts orange?
C4-4-004 : 20%
T-4-005 : and in the second glass?
C4-4-005 : 15%
To determine which drink is the sweeter drink, first C4 determined the
concentration of the extract orange in each drink by comparing the volume of the
extract orange and the total volume of drink (C4-4-001). Then he determined the
percentage of the extract orange in both drinks. The bigger the percentage the
So, the more content (of extract orange) was in the glass I
F-4-01

97
sweeter the drink is. From his work and from the vignette above, it seemed that
the student could use his previous knowledge about percentages in a situation in
which percentages are needed. In determining the percentage of the concentration
of extract orange, he did the formal calculation (F-4-01). He used this formal
computation might be because he was proficient in working with the algorithm.
From the observation, there was an interesting finding. The students
compared absolutely the volume of extract orange to determine which drink is the
sweeter drink. Gandhang (C9) is one of the students who used this strategy.
However, at first he already tried to compare the volume of extract orange and the
total volume by using fraction.
Figure 5.10 Gandhang’s answer that compared absolutely the volume of extract
orange
T-4-006 : Please explain you answer Gandhang
C9-4-001 : The extract orange in the first glass is 60/300. It was simplified into
6/30, and it was simplified again into 1/5. Then 1/5 is multiplied by 300
and equals to 60.
The extract orange in the second glass is 75/500. It was simplified into
3/20. Then 3/20 is multiplied by 500 and equals to 25.
So, the glass that contains the sweeter drink is the first glass.
T-4-007 : Why?
C9-4-002 : because the extract orange in the first glass is bigger than in the second
glass [based on his answer; 60 and 25].
T-4-008 : If we multiply 3/20 by 500, how much the result?
S-4-002 : 75
F-4-02
So, the glass that contains the
sweeter drink is the glass I

98
T-4-009 : Now we look on Gandhang’s answer. He divided 60 by 300. 60 is the
volume of extract orange and 300 is the total volume of drink. Then he
simplified 60/300 into 1/5.
In the second glass, he divided 75 by 500. 75 is the volume of extract
orange and 500 is the total volume of drink. Then he simplified 75/500
into 3/20.
Here, Gandhang again multiplied1/5 by 300, and multiplied 3/20 by
500, and the result is 60 cc and 75 cc. So?
S-4-003 : It comes back to the problem
T-4-010 : Yeah...it comes back to the problem
T-4-011 : Could we only compare 60cc and 75cc?
C7-4-001 : It can be.
T-4-012 : Why?
C7-4-002 : because 75cc is greater than 60cc
From Gandhang’s work, it showed that he used his pre knowledge about
equivalent fraction (F4-02; C9-4-001). However, although he was able to carry out
the computation correctly, it seemed that the computation did not make sense for
him. From the vignette above, the reasoning of Gandhang and Rita showed that
they did not perceive the idea of comparing proportionally (C9-4-002; C7-4-002).
They tended to compare absolutely the volume of extract orange without
considering the total volume of drink.
Considering this fact, the teacher engaged the students in the class
discussion to explore the idea of comparing proportionally.
T-4-013 : So we only compare the extract orange? Does the total volume
influence the sweetness?
S-4-004 : Yes, it influence the sweetness
T-4-014 : For example, there is one drink with the extract orange is 100 cc, but the
total volume is greater than 500 cc. Does the total volume influence the
sweetness?
S-4-005 : Yeah
T-4-015 : So, could we only look at the volume of extract orange?
S-4-006 : No
T-4-016 : So, what must be considered to determine the sweetness of those
drinks?
S-4-007 : The volume of extract orange and the total volume of drinks.
T-4-017 : From this [referring to Gandhang’s answer], what should we compare?
S-4-008 : 1/5 and 3/20
T-4-018 : Yeah...1/5 and 3/20. Now, 1/5 and 3/20...which one is bigger?
S-4-009 : 3/20....... 1/5.....

99
T-4-019 : Who thinks that 1/5 is bigger than 3/20?
S-4-010 : [almost three fourth of the students raise their hand]
T-4-020 : Who knows the reason?
C5-4-001 : 1/5 is one is divided by five, 3/20 is three is divided by twenty
T-4-021 : Why 1/5 is bigger than 3/20?
C2-4-001 : because one cake divided by five person is bigger than if it is divided by
twenty person
T-4-022 : but there is three [pointing to the numerator of 3/20]
C4-4-006 : I know the reason
T-4-023 : come on Bayu (C4)
C4-4-007 : [he writes on the blackboard]
T-4-024 : Here Bayu (C4) uses decimal. Based on his answer, 1/5 equals to 0,2
and 3/20 equals to 0,15. Now, which one is bigger? 0,2 or 0,15?
C4-4-008 : 0,2
S-4-011 : 0,2...... 0,15...
C3-4-001 : I know mom
T-4-025 : come on Rio (C3)
C3-4-002 : [he writes on the blackboard]
T-4-026 : Here, Rio uses cross multiplication. Explain you strategy Rio!
C3-4-003 : 1 is multiplied by 20 and 3 is multiplied by 5
T-4-027 : So?
C3-4-004 : 1/5 is bigger than 3/20
T-4-028 : back to decimal....which one is bigger? 0,2 or 0,15?
S-4-012 : 0,2 [almost all students]....0,15 [only few students]
T-4-029 : how if we use percentage
S-4-013 : 0,2 is 20% and 0,15 is 15%
T-4-030 : 20% and 15%, which one is bigger?
S-4-014 : 20%
T-4-031 : So, which glass contains the sweeter drink?
S-4-015 : the first glass
In the beginning of the short vignette above, the students finally realized the idea
of comparing relatively (S-4-006; S-4-007). There were some interesting findings
F-4-03
F-4-04

100
from this discussion. The first finding was that the students were struggling to
compare common fractions or decimals (F-4-03). The second finding was that the
students were proficient in converting fraction into decimal and also in comparing
fractions by using cross multiplication (F-4-04; C3-4-003). Although they could
compare fractions by using cross multiplication, they could not give the logic
reasoning why 1/5 is bigger than 3/20. This cross multiplication strategy did not
seem to make sense for them in comparing fractions. However, the students could
easily compare percentages (S-4-014). It might happen because percentages were
notated in the similar manner with the notation of whole number.
At the end of the lesson, the teacher stimulated the students to conclude
what they have learned through investigating this kind of problem.
T-4-032 : What do you have learned today?
S-4-016 : Comparison
T-4-033 : If we faced comparison problem, what kind of strategy can be used to
solve the problem?
S-4-017 : Using percent.....decimals....common fractions...
T-4-034 : If we can use decimals or common fraction to solve the problem, why
most of you used percent?
S-4-018 : [keep quite]
T-4-035 : If we want to compare fractions, decimals, and percents. Which one is
easier to compare?
S-4-019 : percent
T-4-036 : Why?
C10-4-001 : because they were easier to be compared
C4-4-009 : more definite
The statement C10-4-001 and C4-4-009 showed that both students seemed to
consider the advantage of using percentage in comparing proportions.
As the conclusion, based on the students’ answer in the worksheet and
students’ reasoning during the class discussion, it seemed that around three fourth
from the total number of students still had difficulty in solving proportional

101
comparison problem. By the support given by the teacher, the students finally
realized that they could not compare directly the volumes of extract orange in
determining which drink is the sweeter drink. They finally realized that they
should compare the volume of extract orange with the total volume of drink (S-4-
006; S-4-007). However, although the students realized the idea of comparing
relatively, they still struggled to use their previous knowledge, especially about
percentages, in solving this problem. They got difficulties in using their
knowledge about percentage in a situation in which they are needed when
different parts of different wholes have to be compared. It might happen because
the students tended to use formal algorithm instead of using their common sense
or using their previous experience in working with benchmark percentage or bar
model (F-4-02; F-4-03; F-4-04).
5.2.5 Expanding knowledge to percentage greater than 100
In this phase, the attention of the students moved from working with
percentage less than 100 to working with percentage greater than 100. This phase
was considered important because percentage greater than a hundred was widely
used in daily life. Looking back to the result of the pre test, the result showed that
most of the students got difficulties in solving percentage problem involving
percentage greater than 100 and almost a half of the students did not have sense
that percentages greater than 100 indicate that something is increase. Considering
this facts, this phase focus to help the students to perceive the idea that
percentages greater than a hundred indicate that something is increase and to help
the students to do the flexible computation. The teacher started the activity by

102
telling a story about 50% extra free on a product of tea and asking them about
other examples involving extra free. Then the teacher told that there is a new
product of Choco chocolate having 50% extra free. The teacher asked the students
to make the drawing of the old and the new product of Choco chocolate and to
determine the weight of the new product of Choco chocolate if the weight of the
old product is given. Only four students had difficulties to solve the problem.
Most of the students could give the correct drawing and answer. Below the
example of student’ reasoning in solving free extra problem:
Figure 5.11 Rio’s answer in drawing chocolate having 50% extra free
T-5-001 : Rio, could you explain the answer?
C3-5-001 : This is the old product [pointing to the first drawing]. The old product is
100%...100 gram. If the new product [pointing to the second drawing]
has free extra 50% so.... 100% is 100 gram plus 50% is 50gram.
Therefore the new product has weight 150 gram.
This finding showed that the students knew the extra free context and realized the
reference of the percentage on the extra free (F-5-01; C3-5-001). This activity was
expected could bridge the students to explore the idea of percentage greater than a
hundred.
The activity then continued by making drawings of the old and the new
product of toothpaste Fresh in which the new product having weight 150% of the
weight of the old product. Here the students also determined the weight of the
F-5-01

103
new product of toothpaste if the weight of the old product is given. Most of the
students could give the correct drawings. This finding indicated that that the
students started to realize that percentage greater than a hundred indicated that
something is increase. However, only ten students could give the correct answer.
Most of the students who gave the correct answer use splitting strategy; they split
150% into 100% plus 50%. It indicated that free extra context help the students to
see that percentage greater than a hundred (for example 150%) indicated that
something have 50% addition, like in the free extra context, so that it caused
something is increase. On the other hand, the other students still got confused in
solving this problem. The following picture is an example from Gandhang’s work
that failed to arrive to the correct answer.
Figure 5.12 An example of incorrect answer in working with percentage greater
than a hundred
From the Figure 5.12 above, it showed that the students used formal
algorithm to solve the problem. However, it seemed that his computation did not
So, 150 gram
So the weight of the new product
of the toothpaste is 150 gr.
F-5-02
Increase

104
match with his drawing. From Gandhang’s drawing we could see that he realized
that 150% indicates that something is increase (although he did not draw it
properly) but in contrast his computation arrived to the different result. It might
happen because Gandhang put the wrong number on the computation. In this case
Gandhang could not synchronise his drawing with his result of computation (F-5-
02). It seemed that his procedural algorithm did not make sense for him.
Next, in attempt to strengthen the idea of percentage greater than a hundred,
the students were given opportunity to solve a problem involving another
benchmark percentage that is 135%. From the students’ worksheet, it showed that
only a third of the students could solve the problem. There was an interesting
finding in this activity. Only three out of eight of the students who could give the
correct answer used splitting strategy, they split 135% into 100% plus 35% to help
them to ease the calculation. Following are the examples of the students’ work
using splitting strategy.
Figure 5.13 Rio’s answer using bar model and benchmark percentages
F-5-03
So, the area of the new field of Pak
Budi is 405 m2.

105
Figure 5.14 Rani’s answer using benchmark percentages
To solve the problem, Rio and Rani used 10% and 5% as the benchmark
percentage to solve the problem. They split 135% into 100% plus 35%. Both
students’ works showed that the students realized that percentage greater than a
hundred (for example 135%) indicate that something have 35% addition (F-5-03;
F-5-04). In Rio’s answer, he made a drawing of bar that is applied to solve the
problem. Here he seemed to use his knowledge about bar model in the previous
activities to solve this problem (F-05-03).
Besides using splitting strategy, some students used algorithm to solve the
problem. They tended to do formal algorithm because it was their prior
knowledge and they were proficient to use this algorithm. Therefore, it was
difficult to conclude whether the contexts in this phase help those students to
work with percentage greater than a hundred.
As the conclusion of this phase, most of the students started to realize that
percentages greater than a hundred indicate that something is increase. From the
result of pre test, most of the students had difficulties to do the computation
involving percentage greater than a hundred. It might happen because the
computation involved big numbers. By using the context of free extra, the
researcher expected that the students will be flexible to handle the calculation
F-5-04
10% of 300 m2 = 30 x 3 = 90 +
5% dari 300 m2 = 15 = 105
35% = 105 m2
So, the area of the field of Pak
Budi is 405 m2

106
involving percentage greater than a hundred. However, only few of the students
could do the flexible calculation by using splitting strategy. Many students still
had difficulties to do the computation. Therefore, it is conjectured that the
students still need more practices in investigating this kind of problem.
5.3 Post test
At the end of the lesson, the students completed a post test with seven
problems. Those seven problems represented all mathematical ideas that they
have learned during the learning process. This post test aimed to find the evidence
of their learning process, particularly in investigating to what extent students
learned through the learning process. The the critical issues and several remarks
will be described in this section.
The first critical issue is about the improvement of students’ achievement in
estimating percentage. On the first problem, the students were asked to shade
80% of the field drawn in rectangular form. Most of the students could shade it
properly. There were two different strategies used to shade 80% of the field. Some
students divided the drawing into ten parts and shaded 8 parts of it. These students
seemed to use 10% as the benchmark percentage to estimate how much 80% is.
The other students directly shade the part without partitioning the drawing. This
result indicated that the students have sense of the fullness of percentage.
The second critical issue is about the meaning of percent as so many out of a
hundred. In the post test, there were three different tasks that assess whether the
students already perceived the meaning of percent. The result showed that almost
a half of the students were able to make visual representation of the situation

107
‘20% of the apples was green’ and were able to compute a part of a whole item
when the percentage of that part is given. Another result of post test also showed
that only 4 out of 24 students were able to determine the percentage of the part if
the proportion is given. Of those whose answers were incorrect and whose
strategies were obvious in computing a part of a whole item when the percentage
of that part is given, almost 70% of the students used formal computation which
probably did not make sense to them. This kind of problem, computing a part of a
whole item when the percentage of that part is given, could not give the evidence
of students’ learning process since the students tended to solve it by using formal
algorithm. In contrast, of those whose answers were correct and whose strategies
were obvious in determining the percentage of the part if the proportion is given,
3 out of 4 students used a rather informal strategy. In the informal strategy, they
tried to find 10% or 1% of the whole. For these students, it seemed that they
perceive the meaning of the percentage.
The third critical issue is about student’s awareness of percentages as
relative value. Based on students’ answer, only a third of the students understood
that one cannot compare percentages without taking into account to what they
refer. Five of the students answered that it depends on the quality of the product,
three students did not gave the answer, and a third of the students compared
absolutely. Of those who made an assumption of the original prices, most of those
students used formal computation to find the reduction price; they transformed the
percentage into fraction and then multiplied the fraction with the original price.

108
The fourth critical issue is about students’ acquisition in applying the
percentages in a situation in which they are needed, when they have to compare
different parts of different wholes. Only six students arrived at the correct answer.
Of those whose answers were correct, two students just estimated, three students
used percentages and one student used decimal. For students who used percentage
to solve the problem, one student used formal algorithm and two students used
rather informal strategy. In total almost a three fourth of the students failed
entirely; they compared the parts absolutely without comparing the part with the
whole. Of those whose answers were incorrect, seven students tended to do
formal computations with the numbers involved in the problem. One of those
computations was given as follows:
Figure 5.15 One of student’s works using formal computation
From the Figure 5.15 above, it showed that the student confused in using the
procedural computation to solve the problem. It seemed that the computation did
not make sense for him. As the conclusion, it seemed that most of the students did
not realize that the problem is about comparing proportional problem and for the
students who compare the part with the whole, most of those students tended to
use formal algorithm that probably did not make sense for them. Although in the
I think SD Mulia is more
enthusiastic in supporting
their team. There were 35
students.

109
learning process the students had experienced in solving this kind of problem and
they realized that they cannot compare the parts absolutely, it seemed that the
students cannot relate their previous experience in solving this problem. It
indicated that the students could not transfer to different situations.
The fifth critical issue is about students’ acquisition in working with
percentage greater than a hundred. In the post test, they worked with
‘175%’.From the students’ answer, it showed that only five students could arrive
to the correct answer, seven students only could make the visual representation
that showed how something increase into 175% and the other students failed
entirely. Of those whose answers were correct, two students used benchmark
percentages and three students used formal algorithm. The low improvement of
students’ achievement in working with percentage greater than a hundred could
indicate that most of the students were not ready yet to expand their knowledge
into percentage greater than a hundred or they need more practices.
5.4 Discussion
In this design research, the characteristics of Realistic Mathematics
Education underlay the activities in this research. The implementation of the
characteristics of RME will be elaborated on the contextual situation, the
classroom culture and the role of the teacher, and the intertwinement of
mathematical topics.

110
5.4.1 Contextual Situation
The first characteristic of RME that is the phenomenological exploration
served as the base of the sequence of instructional activities. A rich and
meaningful context or phenomenon, concrete or abstract, should be explored to
develop intuitive notions that can be the basis for concept formation (Bakker,
2004). In this research, the students were confronted with some daily life
situations in which percentages play role. Since the students have learned about
percentage in the school, the students knew the procedural algorithm to solve
percentage problem, especially when they have to compute part of a whole while
the percentage is given. Therefore, the researcher should adjust some activities so
that they could not directly use their procedural algorithm.
5.4.2 Intertwinement of mathematical topics
According to the fifth characteristic of RME that is intertwinement, it is
important to consider an instructional sequence in its relation to other domains. In
this research, percentage is intertwined with area, estimation, fraction, and
decimal.
- Intertwine percentage with area
In this research, bar model was expected to emerge through investigating area
problem. In investigating the percentage of an area, the students could draw a
square or rectangle with a certain area and used the drawing to estimate the
percentage. Therefore, drawing a certain area can be used to intertwine
percentage with area.
111
- Intertwine percentage with estimation
In this research, the learning of percentage was started from estimating the
percentage of loading process. Therefore, through the learning process, the
students were not merely learned about percentage but also they learned about
estimation.
- Intertwine percentage with fraction and decimal
The relationship of percentage with fraction and decimal provide many
possibilities to do arithmetic in a flexible way. In estimating with percentage,
simple fractions play an important role as reference point. For example when
estimating the percentage of loading process, students said that the loading is
50% because the bar that is fully loaded is a half of the whole bar. Another
example is derived from estimating the concentration of syrup activity. Some
students used fractions or decimal to find the percentage of the concentration of
syrup.

112
CHAPTER VI
CONCLUSIONS
6 CONCLUSIONS
This chapter consists of four sections. The first section is about the answer
of the research question. The second section is about the local instructional theory
of learning percentage. The third section is about the weakness of the research.
The last section is about the recommendation for further research. The research
question will be answered by summarizing the analysis of the whole learning
process and also by analyzing the result of the pre test and post test.
6.1 Answer to the research question
In order to investigate how the students extend their understanding of
percentage, there were some aspects that have to be considered. The first aspect is
about the actual understanding of the students. Since the students have already
learned about percentage, therefore they have actual understanding that later was
extended. The second aspect is about the support given during the learning
process, and the third aspect is to what extent the understanding of the students.
The summary of the result and analysis of students’ learning process as elaborated
in the previous chapter will be used to answer this research question. The
students’ learning process of percentage was elaborated in five phases as follows.
1. Developing sense of fullness of percentage
The pre test result showed that around a half of the students did not have sense
about percentage. They did not perceive that percentage close to 100 means
almost ‘all’ [see Subchapter 5.1.1.1]. To support students’ sense of fullness of

113
percentage, the familiar context about loading process was chosen. In the learning
process, by observing how loading process works, the students could see how
percentage runs along the scale from 0 to 100 as well as the shaded part
representing the part that is fully loaded (S-1-011; S-1-013; S-1-014). A conflict
emerged when the students were asked to estimate the percentage of loading bar
that has different length. To support the students, the teacher posed some
questions to provoke them to see that the percentage of loading process can be
represented by different drawings (T-1-001; T-1-002; T-1-004). As the conclusion,
the loading context helped the students to see how the percentage runs along the
scale as well as the shaded part representing the fully loaded area (F-1-01; F-1-02;
F-1-03; F-1-04). Students also commenced to acquire the idea of benchmark
percentages (F-1-04). In general, in this activity most of the students perceived the
sense of fullness of percentage; they knew that percentage close to zero means
almost ‘nothing’ and percentage close to a hundred means almost ‘all’.
2. Constructing the meaning of percent
Although the students were able to recite that percent means per hundredth, the
pre test result showed that the students need a support in reconstructing the
meaning of percent. The findings also showed that most of the students tended to
use procedural computation that probably did not make sense for them instead of
using their common sense [see Subchapter 5.1.1.2].
After perceiving the sense of fullness of percentage, the students explored the
meaning of percentage as part whole relationship in which there were one hundred
parts within a whole. The problems about area and also about discrete objects

114
were chosen to support the students to explore this idea. The grid paper provided
in area problems was a tool to support the students to explore the idea of
percentage as so many out of a hundred parts (F-2-01; F-2-04; F-2-04). The small
pieces of paper in solving discrete objects problems were also a tool to support the
students to explore this idea (F-2-06). The grid paper used in the activity not only
served as a good hold for students to explore the meaning of percent but also
served as a good hold to develop bar model (F-2-06).
3. Constructing sense of percentage as a relative value
In attempt to support the students to explore the idea of percentage as part whole
relationship that describes relative value, the familiar situation about discount was
chosen to provoke students to explore this idea. According to Van den Heuvel-
Panhuizen (1994), students do not have to explain this idea in this manner but
they have to show an awareness of the fact that percentages are always related to
something. Students’ tendency to compare percentages absolutely without
considering the reference of the percentages led to the emergence of a conflict (S-
3-001). During the class discussion, the teacher gave some guidance, such as
giving a supposition, to stimulate the students to come up with the idea of
relativity of the percentage (T-3-006; T-3-008). As the conclusion, almost a half of
the students seemed to be aware that percentages of discount give relative value
and not absolute value so that one could not compare it directly without taking
into account to what they refer.

115
4. Using percentage in solving proportional comparison problem
Although most of the students knew the procedural algorithm to solve percentage
problems, it does not mean that they are able to use their knowledge about
percentage in a situation in which percentages are needed. The pre test result
showed that almost all students got difficulties in solving a problem in which
percentages are needed [see Subchapter 5.1.1.4]. In the learning process, the
students were given opportunities to solve problems in which they have to
compare different parts of different wholes. The idea of percentage as a relative
value of the part compared to the whole became the main issue in this phase.
Here, the students were challenged to use their knowledge about percentage in
ordering the sweetness of orange drinks. A conflict emerged when there were
some students who compared the volumes of extract orange absolutely (F-4-02;
C9-4-002; C7-4-001; C7-4-002). By posing questions by the teacher, the teacher
helped the students to come up with the idea of comparing relatively (T-4-009; T-
4-013; T-4-015; T-4-016). However, based on the students’ answer in the worksheet
and students’ reasoning during the class discussion and also the result of the pre
test, around three fourth of the students still had difficulty in solving proportional
comparison problem. They were still struggling to use their previous knowledge,
especially about percentages, in a situation in which percentages are needed when
different parts of different wholes have to be compared.

116
5. Expanding knowledge to percentage greater than a hundred
Based on pre test result, almost a half of the students did not have sense that
percentage greater than 100 indicates that something is increase and most of the
students got confused in solving percentage problems involving percentage
greater than 100 [see Subchapter 5.1.1.3]. Using the fact that an extra context
indicates that there is addition; the students were stimulated to start perceiving the
idea of percentage greater than a hundred. By using the context of free extra, the
students were expected to be flexible to handle the calculation involving
percentage greater than a hundred and not merely used difficult procedural
computation that involves big numbers. In fact, only few students could do the
flexible calculation by using splitting strategy (F-5-03; F-5-04). Many students
tended to use algorithm to solve the problem and there were many students who
still had difficulties to do the computation (F-5-02). However, in general the
students started to realize that percentages greater than a hundred indicate that
something is increase.
Summary
Students’ learning process in extending their understanding was started from
developing sense of fullness of percentage, which afterwards continued to
constructing the meaning of percent itself. Based on this basic knowledge, they
were given opportunities to construct sense of percentage as a relative value and
also to apply this knowledge in a situation in which the percentages are needed.
Furthermore, the students expanded their knowledge to percentage greater than a
hundred. As the conclusion, the instructional activities could support students to

117
extend their understanding. However, not all students could achieve the complete
understanding of percentage. There were many students who were not able to
apply their their knowledge in a new situation or to extend their understanding to
percentage greater than a hundred.
6.2 Local Instructional Theory
As described in chapter 3, design research is a type of research methods aimed to
develop theories about both the process of learning and the means that are
designed to support that learning (Gravemeijer & Cobb, 2006). The local
instructional theory with respect to the intended activities and conceptual
development of the students was summarized in the Table 6.1. Doorman used
such a table for describing local instructional theory on modeling motion
(Doorman, 2005). The classroom culture and the role of the teacher were essential
in this learning process. Therefore those aspects will be briefly discussed in this
section.
Table 6.1 Local instructional theory for learning percentage in grade 5
Tool /
Contextual
situation
Activity Imagery
Potential
mathematical
discourse
Loading process
(the application
program of
loading process)
Estimating the
percentage of
loading process
Signifies that
percentage close to
100 means ‘almost
all’ and percentage
close to 0 means
‘almost nothing’
The fullness of
percentage

118
Tool /
Contextual
situation
Activity Imagery
Potential
mathematical
discourse
Area (Grid
paper)
Drawing the
sketches of
house or field
Signifies that if one
divides a whole
into one hundred
parts then one
small part
represents 1% of
the whole, or if one
divides a whole
into ten parts then
one small part
represents 10% of
the whole
Percent means ‘so
many out of 100’
Pieces of square
paper
Determining the
amount of the
part of discrete
objects from a
whole
Signifies the need
of benchmark
percentages such as
5% or 10% derived
from dividing an
object into some
equal parts
Percent means ‘so
many out of 100’
Discount (the
picture of
advertisement)
Comparing
different
discounts
Signifies that one
could not compare
the percentages of
discount absolutely
in determining the
cheaper price
Percentage as
relative value
Concentration of
extract orange
(some glasses of
orange juice)
Ordering the
sweetness of
drinks
Signifies that using
percentage made
one could compare
proportions easily
Percentage as
relative value
Extra weight Drawing the
product having
extra and
determining the
weight of the
product
Signifies that
percentage greater
than 100 indicate
that something is
increase
Percentage greater
than 100
Weight and area Solving problem
involving
percentage
greater than a
hundred
Signifies the
flexible way in
computing
percentage greater
than a hundred
Percentage greater
than 100

119
The classroom culture and the role of the teacher
The means of support encompass potentially productive instructional
activities and tools as well as an envisioned classroom culture and the proactive
role of the teacher (Gravemeijer & Cobb, 2006). Since classroom norms can differ
from one classroom to another, and that they can make a big difference in the
nature and the quality of the students’ mathematical learning, then one has to
consider the characteristic of the envisioned classroom culture (Gravemeijer &
Cobb, 2006). Classroom culture would be established through the negotiation
between the teacher and the students. Therefore one of the tasks of the teacher is
to establish the desired classroom culture.
In the class experiment, the observation showed that the classroom culture
had a big influence on students’ learning process. In the discussion, sometimes
most of the students kept quiet and waited for the other fellow to share their idea.
It might happen because the teacher tended to take big role during the discussion.
However, sometimes the teacher attempted to give more chance to the students to
share their idea but the students still tended to be passive and only certain students
were actively involved in the class discussion.
In the class discussion, the teacher did some tasks in order to establish the
classroom culture. The first is in providing the students an opportunity to present
their idea. According to the third characteristic of RME that is students’ own
construction and production, it is important to give opportunity for the students to
explore their own construction and strategy. The questions such as ‘How do you
know that is is 10%?’ or ‘What kind of strategy can be used to solve this

120
problem?’ or ‘What does it mean?’ are some examples of questions that were
used by the teacher to stimulate the students to express their idea. The second task
is in stimulating social interaction. According to the fourth characteristic of RME
that is interactivity, it is important to stimulate students’ interaction to shorten
their learning path. The question or statement such as ‘What else?’ or ‘You can
discuss with your friends’ are some attempts done by the teacher to stimulate
students’ social interaction.
6.3 The Weaknesses of the Research
In the learning process, sometimes the students could not achieve the
intended learning goal. This might happen because they already knew the
procedural algorithm to solve percentage problem. Sometimes the students
seemed to think that it was enough that they could solve percentage problem by
using the procedural algorithm without trying to make sense of the algorithm.
Therefore, the condition of the students in which they have learned about
percentage could become the weakness of this research.
The researcher also thought that the instructional activities were too dense.
There were many mathematical goals that the students should achieve only in six
meetings. This condition was also considered as the weakness of this research.
Besides those conditions, the researcher considered that in designing the
instructional activities, the researcher did not consider the learning of the students.
In fact, the learning style of the students influenced their learning process.
Therefore, this condition might be one of the weaknesses of this research.

121
6.4 Recommendation
The recommendation in this section will focus on the reflection of the
researcher, the revision of some activities, and the recommendation for further
research.
6.4.1 Reflection
In this research, the students were students who have learned percentage in
the school. They had pre knowledge about percentage that should be considered.
Based on observation, the students accustomed to work in formal way; they
tended to use procedural algorithm in solving percentage problem. Since they
tended to use the algorithm in solving percentage problem, it seemed that some of
the the contextual situations did not function as the situations that needed to be
mathematized by some students. Therefore, the researcher needs to really know
about how far the students’ pre knowledge is and how to relate their pre
knowledge with the learning process.
After having conducted this experiment, it was considered that the sequence
of activities was too dense. There were too many mathematical ideas that have to
be achieved only in six meetings. It caused the students did not have enough
chance to construct their understanding by having discussion among students so
that it influenced the socio-mathematical norm in the classroom.
Besides the weaknesses described above, it was also considered that this
learning design could support students to extend their understanding of
percentage. In their previous learning, the students seemed to only focus on the
computational ability. Through this learning process, the students explored the

122
understanding of percentage that is not much explored in the previous learning.
Through this learning process, they explored the meaning of percentage as relative
value that describes relationships based on a one-hundred-part whole, they learned
the use of percentage in a situation in which the percentages are needed, and also
learned about percentage greater than a hundred.
6.4.2 Revision
a. Without grid paper (number complexity)
As the reflection of the making sketches activity witout grid paper, the
problems does not really challenge the students to really think about the meaning
of percent. It might happen because the numbers involved in the problems were
beautiful numbers (multiple of a hundred) so that it was easy to talk about percent.
To improve this problem, the researcher thinks that the problem can involve more
complex numbers such as ‘320’ or ‘240’.
b. Comparing different discounts activity
In the experiment, the students were given information about two shops that
offer different discounts and they were asked to determine which shop they will
prefer. Here, the researcher made some remarks. The first is that asking for
determining which shop they prefer can make students be confused. The question
is not clear whether it refer to the cheaper price or the bigger amount of the
reduction price and whether the students could compare two different products. It
seems unfair if one compares the cheaper price from different products. To refine
this problem, the researcher proposes that both shops only have one same product
be on sale and then students are asked to determine which shop gives the cheaper

123
price. The second remark is that the uncertainty in the openness of the problem.
We cannot judge that the students who compared the percentages absolutely really
lack of understanding of the relativity of percentage. To refine this problem, the
researcher thinks that teacher should give additional question in order to give
extra help for students in expressing their idea of relativity of percentage. The
additional question could be ‘Is there any possibility that you will get the cheaper
price in Istana shop? If yes, could you give an example?’.
6.4.3 Recommendation for further research
This section will describe general recommendation that is addressed to both
the practice of teaching and learning of percentage and to further research in
mathematics education. The recommendation will focus on two issues, namely
students’ pre knowledge and the learning style of students.
a. Students’ pre knowledge
Students’ pre knowledge should be well-considered when designing
instructional activities. When students come into a classroom, they come with a
wide range of experiences. They have their own ideas, knowledge and concepts
that are already formed. Some of this pre knowledge may be correct or may be
incorrect but needs to be expanded.
In this experiment, the students had already had pre knowledge about
percentage. Based on the observation, it showed that they were get used to work
in formal level in solving percentage problem by doing such procedural
computation that probably did not make sense for them. The findings of this
research showed that only few students were flexible to handle computation that
124
seems meaningful for them and the other students still tended to work in formal
level. By using this finding, it was difficult to find the evidence of their learning
process. It might happen because students’ pre knowledge was not well
considered. Therefore the learning design should be built upon students’ pre
knowledge. Building upon pre knowledge is an important part of teaching and
learning. This pre knowledge is very important to be acknowledged in order to
motivate students’ learning process.
b. The learning style of students
Every student learns using a different styles or a combination of learning
styles. McNicholas (2008) describes that there are four major categories of
learning style. The four major categories are visual/verbal, visual/nonverbal,
tactile/kinaesthetic, and auditory/verbal learning style. The visual/verbal learner
learns best when information is presented visually and in a written language
format. The visual/nonverbal learner learns best when information is presented
visually and in a picture or design format. The tactile/kinaesthetic learner learns
best when physically engaged in an activity. The auditory/verbal learner learns
best when information is presented auditory in an oral language format.
In this research the researcher did not consider this aspect. The findings of
this result showed that in certain activity, in comparing two different discounts for
example, in which the information is presented auditory in an oral language
format, some students did not engage in the discussion. It could happen because
those students were not the auditory/verbal learning style learners, so that they
might not understand the problem or they were not motivated to discuss the

125
problem. Therefore, besides the pre knowledge, the researcher recommends that
for further research the learning style of students have to be considered as well.
As the last part of the recommendation section, the researcher emphasized
that the idea of Realistic Mathematics Education was the answer to the need of
reforming the teaching and learning of mathematics. One significant characteristic
of RME is the focus on the growth of the students’ knowledge and understanding
of mathematics.
126
REFERENCES
Armanto, D. (2002). Teaching Multiplication and Division Realistically in
Indonesian Primary Schools: A Prototype of Local Instructional Theory.
Enschede: PrintPartners Ipskamp.
Bakker, A. (2004). Design Research in Statistics Education: On Symbolizing and
Computer tools. Utrecht: Freudenthal Institute.
Baroody, A. J., and Ronald T. C. (1998). Fostering Children's Mathematical
Power. London: Lawrence Erlbaum Associates Publishers
Doorman, L.M. (2005). Modelling motion: from trace graphs to instantaneous
change. Amersfoort: Wilco Press
Freudenthal, H. (1991). Revisiting Mathematics Education: China Lectures.
Dordrecht, The Netherlands: Kluwer Academics Publisher
Fosnot, T.F. & Dolk, M. (2002). Young Mathematicians at Work: Constructing
Fractions, Decimals, and Percents. Portsmouth: Heinemann
Gravemeijer, K. (1994). Developing Realistic Mathematics Education. Utrecht:
CD Beta Press
Gravemeijer, K., Cobb, P. (2006). Design Research from a Learning Design
Perspective. Educational Research, 17-51.
Lee, K. P. (1998). The Knowledge of Percent of Pre-Service Teachers. The
Mathematics Educator, 3(2), 54-69.
Lembke, L.O. (1991). The development of concepts and strategies used in solving
percent problems (Doctoral dissertation, University of Missouri-Columbia,
1991). Dissertation Abstracts International, 52(06), 2057A.

127
McNicholas, Michael. (2008). Maritime Security: An Introduction. USA: Elsevier
Inc.
Parker, Melanie and Gaea Leinhardt. (1995). Percent: A Privileged Proportion.
Review of Educational Research, 65(4), 421-481.
Reys, R. E., et al. (2007). Helping Children Learn Mathematics. USA: John
Wiley & Sons, Inc.
Schwartz, J. E., C. A. Riedesel. (1994). Essential of Classroom Teaching
Elementary Mathematics. USA: Allyn and Bacon.
Simon, MA and Ron Tzur (2004). Explicating the Role of Mathematical Tasks in
Conceptual Learning: An Elaboration of the Hypothetical Learning
Trajectory. Mathematical Thinking and Learning.
Skemp, Richard R. (1987). The Psychology of learning mathematics. USA:
Lawrence Erlbaum Associates, Inc., Pubsilhers.
TAL Team. (2008). Fraction, Percentage, Decimal and Proportions. Utrecht:
Sense Publishers
Treffers, A. (1987). Three Dimensions. A Model of Goal and Theory Description
in Mathematics Instruction – The Wiskobas Project. Dordrecht, The
Netherlands: Reidel Publishing Company
Van den Heuvel-Panhuizen, M. (1994). Improvement of didactical assessment by
improvement of the problems: An attempt with respect to percentage.
Educational Studies in Mathematics, 27, 341-372.

128
Van den Heuvel-Panhuizen, M. (2003). The didactical use of models in realistic
mathematics education: An example from a longitudinal trajectory on
percentage. Educational Studies in Mathematics, 54(1), 9-35.

129
VISUALIZATION OF THE LEARNING TRAJECTOR
Investigating 50% extra free problem, and increasing
problem
Estimating the percentage of loading
process, drawing loading process
Comparing different discounts
Estimating area, working with discrete
objects
Determining the sweeter drink
Constructing sense of
fullness of percentage
Constructing the
meaning of percent
Constructing sense of
percentage as a relative
value
Using percentage in
comparison problem
Investigating percentage
greater than 100
Percentage close to 100 means almost
‘all’ and percentage close to 0 means
almost ‘nothing’
- Percentage describes part whole
relationship; it describes relative value
of part compared to the whole.
- Percentages are always related to
something (prices).
- Percentage describes part
whole relationship
- Percent means ‘so many out of
100 parts’
- Percentage describes relative value of part
compared to the whole.
- Percentages indicate the proportion of a specific
total that is set to 100
- Percentage can be used to standardize different
quantities so they can be compared directly.
Percentages are not always
less than 100, but it can be
greater than 100
: Phase of learning : Mathematical idea
: Activity

A-130