Embed Size (px)
Citation preview

S1
Supporting Information
Hierarchically templated beads with tailored pore structure for
phosphopeptide capture and phosphoproteomics
Celina Wierzbickaa, Silje B. Torsetnesb, Ole N. Jensenb, Sudhirkumar Shindea and Börje
Sellergrena
a Department of Biomedical Sciences, Faculty of Health and Society, Malmö University, SE 205
06 Malmö, Sweden
b Department of Biochemistry and Molecular Biology and VILLUM Center for Bioanalytical
Sciences, University of Southern Denmark, DK-5230 Odense M, Denmark
Electronic Supplementary Material (ESI) for RSC Advances.This journal is © The Royal Society of Chemistry 2017

S2
Figure S1. Template immobilization on silica surface, (a) PyBOP, HOBt, DIEA, Fmoc-Tyr(PO(NMe₂)₂)-OH, DMF, room temperature,
24 h; (b) Ac2O, DMF, 2 h; (c) TFA/H2O 9/1 (v/v), room temperature, overnight. See experimental part for details.

S3
Figure S2. Binding isotherms of Fmoc-pTyr-OH (concentration range 0.05 mM-1.5 mM) for
surface imprinted polymers and corresponding non-imprinted polymers. (A) MIP-HA/NIP-HA,
(B) MIP-HB/NIP-HB, (C) MIP-HC/NIP-HC, (D) MIP-HD/NIP-HD, (E) MIP-HE/NIP-HE. Points
show an average of three replicas with the error bars representing standard deviation.
S4
Figure S3. SEM images of (A) MIP-B, (B) NIP-B, (C) MIP-M, (D) NIP-M, (E) MIP-HE, and (F)
NIP-HE at different magnifications.
S5
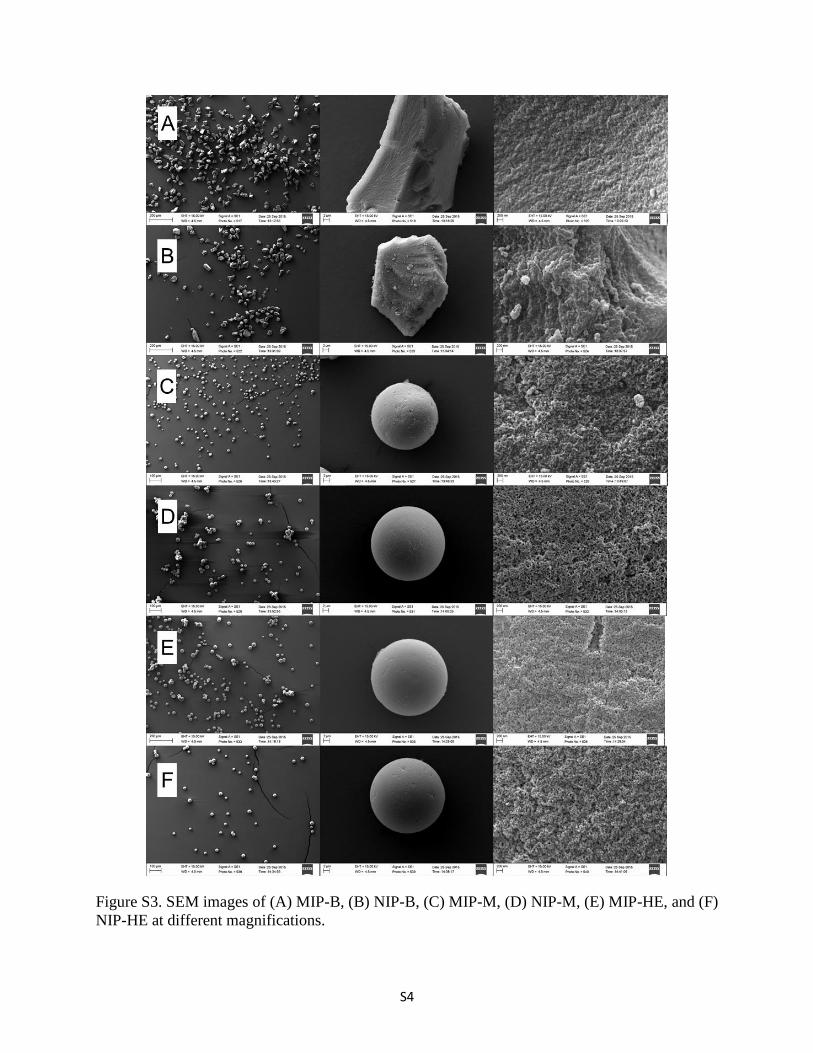
Figure S4. Optical micrographs of synthesized polymers and silica microparticles.

S6
Figure S5. The BJH differential pore volume (dV/dlog(w)) distribution plots against pore width
for (A) MIP-B, MIP-M, MIP-HE and (B) NIP-B, NIP-M, NIP-HE.

S7

S8
S9

S10
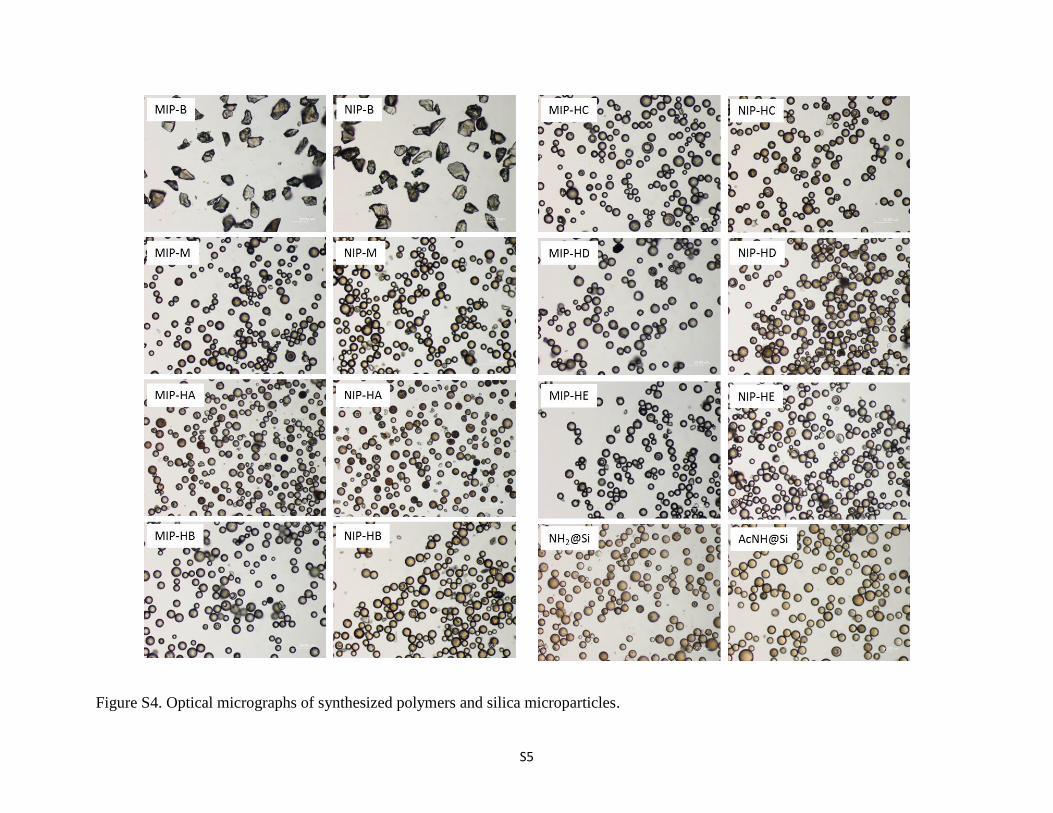
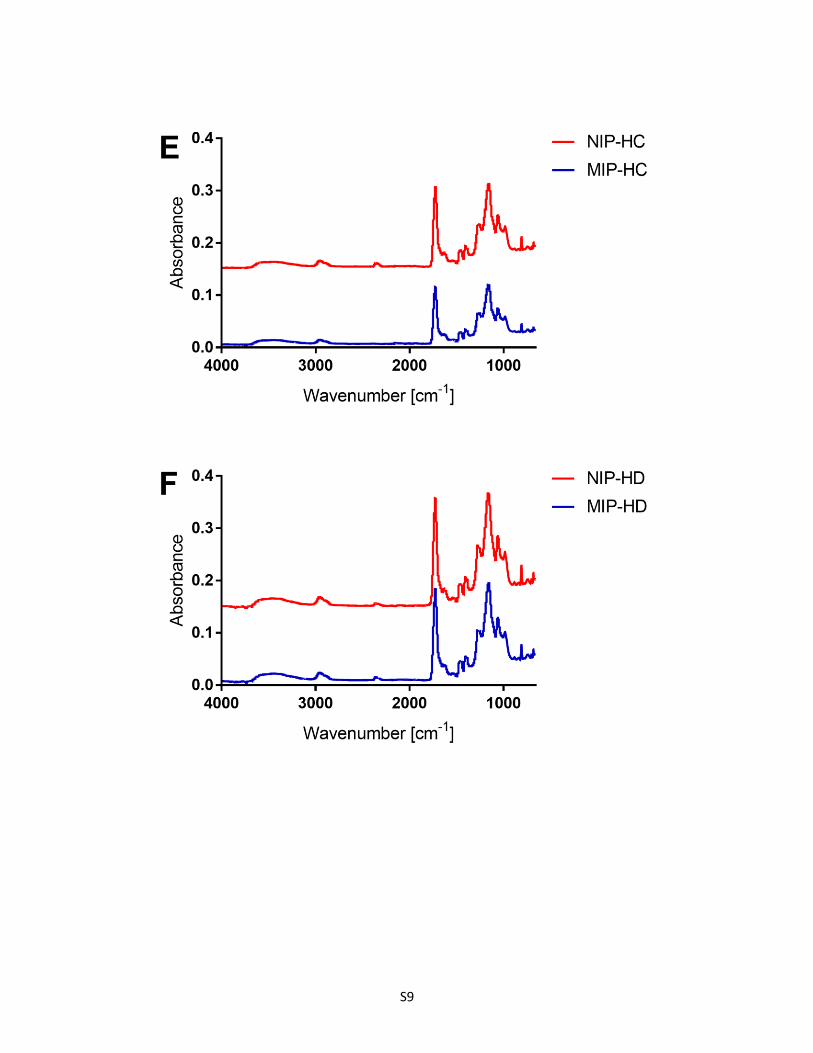
Figure S6. ATR-FTIR spectra of imprinted and non-imprinted polymers (A) MIP-B/NIP-B, (B)
MIP-M/NIP-M, (C) MIP-HA/NIP-HA, (D) MIP-HB/NIP-HB, (E) MIP-HC/NIP-HC, (F) MIP-
HD/NIP-HD, (G) MIP-HE/NIP-HE.

S11
Figure S7. SPE test results Fmoc-pTyr-OH (A), and Fmoc-pSer-OH (B) and Fmoc-Tyr-OH (C, D)
showing % of each analyte in flow through (FT), washing (W) and elution (E) fractions. The
following conditions were applied: loading 95% ACN + 0.1% FA, washing 80% ACN + 0.1% FA,
elution 80% MeOH + 1% TFA. The bars show the average of three replicas and the error bars
represent standard deviation.

S12
Figure S8. MALDI mass spectra obtained for combined flow through and washing fraction (FTW)
from (A) MIP-B, (B) MIP-M and (C) MIP-HE. Marked are spiked phosphotyrosine peptides
(asterisk), phosphoserine peptides (square) and spiked phosphoserine and non-phosphorylated
peptides (circle).

S13
Table S1. Characterization of silica with immobilized template.
Sample Nominal template coverage Real template coveragea Mass loss
[%]b [µmol/m2] [µmol/g] [µmol/m2] [µmol/g]
Fmoc-pTyr@Si-A 0.44 20 0.23 10 3.1
Fmoc-pTyr@Si-B 0.60 2 0.40 18 3.5
Fmoc-pTyr@Si-C 0.76 34 0.73 33 3.8
Fmoc-pTyr@Si-D 0.90 40 0.86 39 4.1
Fmoc-pTyr@Si-E 1.20 54 1.22 55 4.5
a Calculated by Fmoc-cleavage test; b Determined by thermogravimetric analysis.
Table S2. Characterization of polymeric materials.a
Sample Silica used for polymerization Mass loss [%]a
MIP-B - 94.3
NIP-B - 94.4
MIP-M AcNH@Si 93.9
NIP-M AcNH@Si 93.1
MIP-HA Fmoc-pTyr@Si-A 94.9
NIP-HA AcNH@Si 94.7
MIP-HB Fmoc-pTyr@Si-B 94.2
NIP-HB AcNH@Si 94.9
MIP-HC Fmoc-pTyr@Si-C 93.2
NIP-HC AcNH@Si 94.4
MIP-HD Fmoc-pTyr@Si-D 93.5
NIP-HD AcNH@Si 95.6
MIP-HE Fmoc-pTyr@Si-E 95.2
NIP-HE AcNH@Si 97.3 a The mass loss was determined by thermogravimetric analysis (TGA). The mass loss of the
composites before etching was roughly 30%.

S14
Table S3. Elemental composition of imprinted and non-imprinted polymers.a
Polymer Theoretical Experimental
%C %H %N % C % H % N
MIP-B 56.30 5.91 1.06 56.36 5.80 0.98
NIP-B 56.30 5.91 1.06 55.88 6.94 0.96
MIP-M 56.30 5.91 1.06 56.28 6.89 0.99
NIP-M 56.30 5.91 1.06 55.78 6.28 0.92
MIP-HA 56.42 6.09 0.62 56.24 6.94 0.50
NIP-HA 56.42 6.09 0.62 56.08 6.82 0.49
MIP-HB 56.39 6.04 0.74 56.16 6.13 0.65
NIP-HB 56.39 6.04 0.74 56.05 5.81 0.69
MIP-HC 56.33 5.95 0.95 56.22 6.88 0.92
NIP-HC 56.33 5.95 0.95 56.08 6.80 0.82
MIP-HD 56.31 5.92 1.03 56.14 5.75 0.96
NIP-HD 56.31 5.92 1.03 55.78 5.77 0.96
MIP-HE 56.25 5.84 1.24 56.13 5.69 1.16
NIP-HE 56.25 5.84 1.24 56.20 5.53 1.14 a The theoretical nitrogen content for polymers prepared in absence of urea monomer 1 was 0.47%.
Table S4. Binding constants (Ka) maximum binding capacity (Bmax) and imprinting efficiency (IE)
for MIPs and NIPs.
Polymer Ka x 10 3 [M-1] Bmax [µmol/g] IE (%)
MIP-B 16.5 ± 2.6 25.0 ± 1.0 23
MIP-M 16.7 ± 2.3 36.9 ± 1.3 33
MIP-HA 5.9 ± 2.6 11.4 ± 1.4 36
MIP-HB 3.0 ± 0.9 18.7 ± 2.0 33
MIP-HC 7.8 ± 1.9 23.8 ± 1.6 23
MIP-HD 5.5 ± 1.4 27.3 ± 2.2 22
MIP-HE 4.8 ± 1.3 31.2 ± 2.8 18
NIP-B 2.1 ± 0.5 7.8 ± 0.7 -
NIP-M 1.8 ± 0.5 6.5 ± 0.7 -
NIP-HA 1.2 ± 0.3 4.2 ± 0.6 -
NIP-HB 17.4 ± 49 1.4 ± 0.8 -
NIP-HC 2.2 ± 0.5 3.2 ± 0.2 -
NIP-HD 13.7 ± 4.7 1.8 ± 0.1 -
NIP-HE 8.2 ± 6.9 2.3 ± 0.5 -

S15
Table S5. Phosphotyrosine (pY), phosphoserine (pS) and spiked tyrosine (Y) peptides found in the sample before enrichment and in
combined flow through and washing (FTW) and elution (E) fractions.a
Peptide sequence [M+H]+
(Da) Origin Sample
MIP-B MIP-M MIP-HE
FTW E FTW E FTW E
DRVYIHPF 1046.54 Spiked + + + + + + +
DRVpSIHPF 1050.48 Spiked + - + - + - +
GADDSYYTAR 1118.48 Spiked + + +/- + + + +
DRVpYIHPF 1126.51 Spiked + + + + + + +
GADDSYpYTAR 1198.44 Spiked - - + - + - +
GADDSpYpYTAR 1278.41 Spiked - - +/- - + - +
GSTAENAEpYLR 1290.54 Spiked - - + - + - +
TVDMEpSTEVFTK 1466.61 CASA2b + + + + + + +
MHLPSPTDSNFpYR 1644.69 Spiked + + + + + + +
VPQLEIVPNpSAEER 1660.79 CASA1c + + + + + + +
DIGpSEpSTEDQAMEDIK 1927.69 CASA1c - - + - + - +
YKVPQLEIVPNpSAEER 1951.95 CASA1c + + + + + +/- +
FQpSEEQQQTEDELQDK 2061.83 CASBd + + + + + +/- +
GSHQISLDNPDpYQQDFFPK 2315.99 Spiked + +/- + +/- + + +
RPAGSVQNPVpYHNQPLNPAPSRD 2594.22 Spiked + - + - + - +
YSSDPTGALTEDSIDDTFLPVPEpYINQSVPKe 3478.58 Spiked + - + - + +/- + a + = peptide signal found in the sample; - = peptide signal not found in the sample; +/- = peptide signal intensity below 9000 a. u.
threshold limit; b α-S2-Casein; c α-S1-Casein; d β-Casein; e intensity threshold was 3000 a. u.

S16
Table S6. Peak intensity analysis for samples before and after MIP enrichment.
Peptide sequence [M+H]+ (Da) Origin Intensity (a. u.)
Sample MIP-B MIP-M MIP-HE
DRVYIHPF 1046.54 Spiked 363213 43437 35139 31570
DRVpSIHPF 1050.48 Spiked 144086 43153 100226 95112
GADDSYYTAR 1118.48 Spiked 42264 5691 11240 13426
DRVpYIHPF 1126.51 Spiked 224855 99533 213266 223734
GADDSYpYTAR 1198.44 Spiked 0 11759 371113 54946
GADDSpYpYTAR 1278.41 Spiked 0 7799 21441 21148
GSTAENAEpYLR 1290.54 Spiked 0 24775 79378 97943
TVDMEpSTEVFTK 1466.61 CASA2a 125076 12472 19664 29531
MHLPSPTDSNFpYR 1644.69 Spiked 207047 137941 281338 199752
VPQLEIVPNpSAEER 1660.79 CASA1b 66293 47317 114561 124710
DIGpSEpSTEDQAMEDIK 1927.69 CASA1b 0 9353 24299 24762
YKVPQLEIVPNpSAEER 1951.95 CASA1b 169969 109210 267326 202206
FQpSEEQQQTEDELQDK 2061.83 CASBc 71904 60667 167517 123085
GSHQISLDNPDpYQQDFFPK 2315.99 Spiked 51887 34352 110974 65043
RPAGSVQNPVpYHNQPLNPAPSRD 2594.22 Spiked 35786 27254 99005 60164
YSSDPTGALTEDSIDDTFLPVPEpYINQSVPK 3478.58 Spiked 3982 3078 8240 3641
Total intensity of all peptides 1506362 677791 1924727 1370773
Total intensity of pY peptides 523557 346491 1184755 726371
Total intensity of pS peptides 577328 282172 693593 599406
Total intensity of Y peptides 405477 49128 46379 44996
% of pY peptides intensity 34.76 51.12 61.55 52.99
% of pS peptides intensity 38.33 41.63 36.04 43.73
% of Y peptides intensity 26.92 7.25 2.41 3.28
Normalized pY/pS ratio 0.91 1.35 1.88 1.34
Normalized pY/Y ratio 1.29 5.46 19.78 12.50 a α-S2-Casein; b α-S1-Casein; c β-Casein.