Embed Size (px)
Citation preview

www.sciencemag.org/cgi/content/full/317/5836/372/DC1
Supporting Online Material for
Patched1 Regulates Hedgehog Signaling at the Primary Cilium
Rajat Rohatgi, Ljiljana Milenkovic, Matthew P. Scott*
*To whom correspondence should be addressed. E-mail: [email protected]
Published 20 July 2007, Science 317, 372 (2007)
DOI: 10.1126/science.1139740
This PDF file includes: Materials and Methods
Figs. S1 to S14
References

Page 1
SUPPLEMENTARY ONLINE MATERIAL
Materials and Methods
Cell Lines
NIH3T3 cells were obtained from ATCC. Mouse embryonic fibroblasts were derived from
littermate ptc1-/- and ptc1+/- embryos (stage E8.5) as previously described (S1,S2). The ptc1-/-
;Ptc1-YFP and ptc1-/-;vector cell lines were generated by infection of ptc1-/- cells with a
retrovirus carrying either Ptc1-YFP cloned into pMSCVpac or the empty pMSCVpac vector,
respectively, followed by selection in 2μg/ml Puromycin (S2, S3). We would like to thank Phil
Beachy for the smo-/- fibroblasts (S4-S6).
Constructs and Retroviruses
All constructs use mouse sequences. The vector encoding Ptc1-YFP was constructed by cloning
the entire coding region for mouse Ptc1 into the NheI and HindIII sites of pEYFPN1
(Clonetech). The NPC1-YFP construct has been described previously (S7). Ptc1-YFP was sub-
cloned from pEYFPN1 into the vector pMSCV-pac and retroviral supernatants produced after
transient transfection of Bosc23 cells (S3). The construct encoding Inversin-CFP was generated
from an Inversin-GFP construct in the vector pBosEX (kindly provided by Dr. Hiroshi Hamada,
Osaka University, Japan) by replacing the coding sequence of GFP with that of CFP.
Antibodies
Polyclonal rabbit antisera against mouse Ptc1 and Smo were generated by Josman labs LLC.
Rabbits were immunized with a Ptc1 protein fragment extending from aa. 1238-1413 or to a Smo
protein fragment extending from aa. 544-793. Both fragments were insoluble. Antibodies were

Page 2
affinity purified from antisera on a column with the antigen covalently immobilized to Sepharose
beads (Aminolink Sepharose, Pierce). The mouse anti-acetylated tubulin antibody was from
Sigma, the mouse anti-actin antibody from Chemicon, the rabbit anti-Pericentrin antibody from
Covance, and the goat Anti-rabbit or goat Anti-mouse secondary antibodies coupled to Alexa594
or Alexa488 were from Molecular Probes.
Recombinant Proteins and Small Molecules
Conditioned medium made from 293T cells expressing full-length Shh was used as the source of
Shh as published previously (S8). Briefly, 293T cells carrying Ecdysone-responsive, full length
Shh were grown to 70% confluence and production of Shh was induced by the addition of 1 μM
Muristerone A. This Shh-containing conditioned medium was used at 1:4 dilution in all assays
unless otherwise noted.
For fluorescently labeled Shh (ShhN-A594), the N-terminal signaling domain of Shh
(ShhN, aa. 25-198) was produced in E.Coli and purified to homogeneity as described previously
(S9). For labeling, 25μM ShhN and 1mM Alexa594-Maleimide (Molecular Probes) were
dissolved in 5mM Sodium Phosphate pH 5.5, 150mM NaCl, and 0.5mM DTT and incubated at 4
degrees C overnight. The labeled protein was separated from free, uncoupled dye by gel
filtration chromatography followed by extensive dialysis. The acidic pH used in this coupling
reaction has been shown to favor the reaction of the Cysteine 25 in ShhN with maleimides (S10).
ShhN-A594 retained the ability to induce Hh target gene activation in MEFs (Fig. S6)
Cyclopamine was purchased from Toronto Research Chemicals, oxysterols from Sigma,
and SAG was kindly provided by Dr. James Chen, Stanford University.

Page 3
Assays for Hedgehog pathway activation in fibroblasts
For all experiments in which the Hedgehog pathway was activated, fibroblasts were grown to
confluence in medium (High Glucose DMEM, 0.05 mg/ml Penicillin, 0.05 mg/ml streptomycin,
2mM Glutamax, 1mM Sodium Pyruvate, 0.1mM MEM Non-essential amino acid supplement)
containing 10% FBS (Hyclone, defined grade) and then switched to medium containing 0.5%
FBS with a pathway agonist or vehicle control for the indicated periods of time.
Immunoblotting
Cells were scraped in to ice-cold PBS, sedimented at 500xg for 5 minutes and lysed in a
modified RIPA buffer (50mM Na-Tris pH7.4, 150mM NaCl, 1% v/v NP-40, 0.25% w/v Sodium
Deoxycholate, 1mM DTT, 10mM NaF, 1mM activated Sodium Vanadate, 1mM PMSF, and the
Roche Complete protease inhibitor cocktail) for 1 hour at 4 degrees. The lysate was clarified by
centrifugation for 1 hour at 20,000xg. Protein concentrations of the supernatants were
determined using the detergent-insensitive BCA kit (Pierce). Equal amounts of total protein
from the samples were supplemented with SDS-buffer (final composition: 50mM Na-Tris pH6.8,
2% SDS, 6% Glycerol, 1% Beta-Mercaptoethanol), incubated at room temperature for 15
minutes, resolved by SDS-PAGE, and then processed for immunoblotting. To avoid
precipitation of Ptc1 and Smo, samples were not boiled prior to electrophoresis. Anti-Ptc1 and
anti-Smo were both used at 1:500 and anti-actin at 1:10000.
Immunofluorescence
In all the fixed cell images shown in manuscript, cilia have been detected by
immunofluorescence using an antibody against anti-acetylated tubulin. Acetylated tubulin is a

Page 4
well established marker used to identify and mark cilia in fixed samples (S11). Since anti-
acetylated tubulin stains a subset of cytoplasmic microtubules in addition to cilia, we have used
two independent markers to confirm that the structures to which Ptc1 and Smo localize indeed
represent cilia. First, Inversin, a protein not involved in Hh signaling, is an established marker
for primary cilia, and a Cyan Fluorescent Protein (CFP) fusion of Inversin (Inversin-CFP)
localizes to the same structure (Fig. 3A) (S12). Second, we have confirmed that Pericentrin, a
protein localized around the basal body found at the base of primary cilia, is also localized at the
expected position at the base of these structures (Fig.S14).
Unless indicated, Ptc1 and Smo were detected in fixed samples by immunofluorescence
using anti-Ptc1 and anti-Smo and nuclei have been stained with DAPI (blue in all pictures).
Cultured cells were fixed with 4% Paraformaldehyde (PFA) in PBS for 15 minutes and
washed 3 times with Phosphate Buffered Saline (PBS). Fixed cells were then placed in blocking
solution (PBS with 1% v/v Normal Goat Serum and 0.1% v/v Triton X-100) for 30 minutes.
Primary antibodies (1:500 for anti-Ptc1 and anti-Smo and 1:1000 for anti-acetylated tubulin)
were diluted in block and used to stain cells for 1 hour at room temperature. After washing 3
times in PBS, Alexa-coupled secondary antibodies were added in block at 1:500 for 1 hour at
room temperature. DAPI was included in the final washes before the samples were mounted in
Fluoromount G (Southern Biotech) for microscopy.
Day 9.5 embryos from a ptc1+/- cross were fixed in 4% PFA in PBS for 3 hours at 4
degrees C, extensively washed in PBS, frozen in OCT and sectioned with a 14 micrometer slice
thickness. Sections were stained as described above for cultured cells except that sections were
incubated with primary antibody overnight at 4 degrees C.
Page 5
Microscopy
Both live and fixed cell microscopy was performed on an inverted Leica DMIRE2 laser
scanning confocal microscope. Unless otherwise noted, images were taken with a 63X objective
and 4X zoom.
Image Analysis
All analysis was performed in the program Image J. To quantitate the fluorescence signal
of Ptc1 and Smo in primary cilia, a mask was constructed by manually outlining cilia in the
image taken in the acetylated-tubulin channel. This mask was then applied to the image taken in
the Ptc1 or Smo channel and the fluorescence at cilia measured. Local background correction
was performed by moving the mask to measure fluorescence at a representative nearby region
and this value was subtracted from that of ciliary fluorescence.

Page 6
Supplementary Figure Legends
Fig. S1. The anti-Ptc1 and anti-Smo antibodies are specific. Immunoblots showing extracts
from Mouse Embryonic Fibroblasts (MEFs) of various genotypes probed with anti-Smo (A and
C) and or anti-Ptc1 (B and D). Arrows indicate Ptc1 or Smo and asterisks indicate cross-reacting
bands. (A) Anti-Smo detects a doublet at the expected size for mouse Smo specifically in
extracts of smo+/+ cells but not in extracts of smo-/- cells (S4-6). Smo is known to run as a
doublet on SDS-polyacrylamide gels because of differential glycosylation (S13). The top band
of the doublet is EndoH resistant, indicative of a post-ER glycosylation pattern, while the bottom
band is EndoH sensitive, indicative of an ER glycosylation pattern (data not shown). (B) Anti-
Ptc1 detects a band at the expected size in ptc1+/+ but not ptc1-/- cells and this band is markedly
induced by addition of Shh, confirming that it is indeed Ptc1, which is known to be encoded by a
Shh target gene. When Ptc1 is induced to high levels, a fraction of the protein migrates as a
higher molecular weight species. The biochemical identity of these high molecular weight forms
has not been determined but may represent SDS-resistant aggregates or post-translationally
modified forms. (C) and (D) Immunoblots using anti-Smo and anti-Ptc1 showing detection of
Smo and Ptc1 in extracts of NIH3T3 cells treated with the indicated agents. This blot shows that
no cross-reacting band selectively increases in intensity after activation of the pathway with Shh,
SAG or 20-hydroxy cholesterol, the three agonists used in this study. The cross-reacting bands
(asterisks) seen in the immunoblots cannot be the source of the ciliary staining described for Ptc1
and Smo because the antibodies do not detect any ciliary signal in smo-/- cells (data not shown),
ptc1-/- cells (Fig.2B), or ptc1-/- embryos (Fig.2C).

Page 7
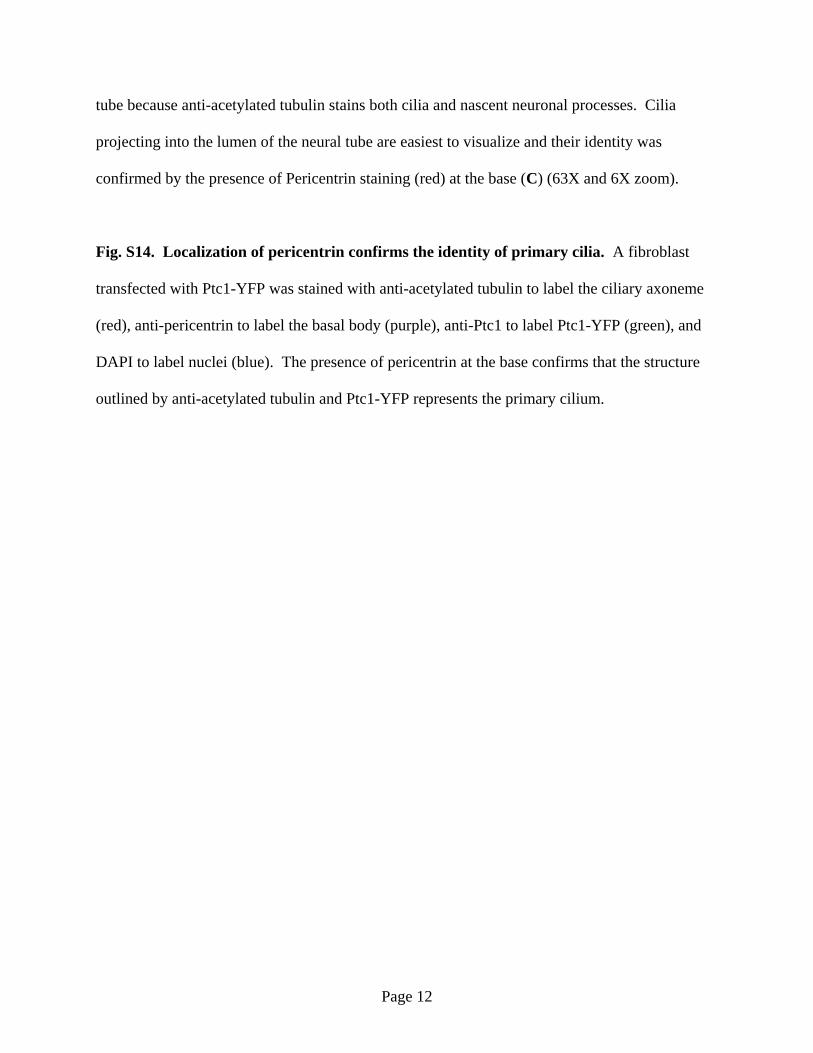
Fig. S2. Smo localization at the primary cilium 1 hour (A) and 4 hours (B) after
stimulation with Shh or 100nM SAG. In all micrographs, cilia (red) were detected with anti-
acetylated tubulin staining, Smo (green) with anti-Smo staining and nuclei (blue) with DAPI
staining. These micrographs demonstrate that Smo is enriched in the cilia of NIH3T3 cells as
early as 1 hour after stimulation with Shh or SAG. The amount of Smo fluorescence at cilia was
measured from micrographs such as these, subtracted from local background and used to
construct the graph shown in Fig.1C. The 24 hour timepoint from this experiment is shown in
Fig.1B.
Fig. S3. Ptc1-YFP is a functional protein and rescues ptc1-/- cells. The enzymatic activity of
β-galactosidase can be used to assay Hh target gene transcription in ptc1-/- cells since the ptc1
knock-out allele was constructed by introducing a bacterial lacZ gene (encoding β-galactosidase)
into the ptc1 locus so that it is regulated by endogenous control elements (S1). Target gene
transcription is high in ptc1-/- cells, indicative of constitutive pathway activation (left set of
bars). As expected, since Ptc1 is the receptor for Shh, ptc1-/- cells do not respond to Shh
(3μg/ml) but importantly remain sensitive to inhibition by 5μM cyclopamine, a downstream
inhibitor of Smo. Infection of ptc1-/- cells with a retrovirus carrying the mouse ptc1 gene fused
at its carboxyl-terminus to Yellow Fluorescent Protein (Ptc1-YFP) restores inhibition of target
gene transcription and Shh responsiveness (right set of bars). This proves that the Ptc1-YFP
construct is functional because it can rescue Shh-induced target gene transcription in ptc1-/-
cells. The Shh used in these experiments was recombinant ShhN, the N-terminal signaling
domain of Shh, expressed in E.Coli and purified to homogeneity (S9).

Page 8
Fig. S4. Ptc1 localization in mouse embryos. In all micrographs, cilia (red) were detected with
anti-acetylated tubulin staining, Ptc1 (green) with anti-Ptc1 staining and nuclei (blue) with DAPI
staining. A cross section of an E9.5 mouse embryo (image taken with a 63X objective and no
zoom) is shown in (B) and schematically diagrammed in (A) with relevant anatomical structures
marked. The notochord (nc) and gut endoderm (ge) produce Shh that activates signaling in the
neural tube (nt), paraxial mesoderm (m1) and splanchnic mesoderm (m2). (C) A region
including the gut endoderm and splanchnic mesoderm boxed in yellow in (B) is shown at higher
magnification. One cell each from the gut endoderm (ge cell) and splanchnic mesoderm (m2 cell)
is boxed in white and further magnified below. The Shh-responsive m2 cell shows strikingly
asymmetric distribution of Ptc1 at the base and in particles along the shaft of the cilium. In
contrast, the Shh non-responsive ge cell shows no specific Ptc1 staining.
Fig. S5. Serial Z-plane sections of paraxial mesoderm tissue showing the localization of
Ptc1 in two cells. In order to give a more complete picture of the distribution of Ptc1 in cilia, we
present here a series of optical sections (step size 0.4μm) that together show the full depth of a
group of cells. In all micrographs, cilia (red) were detected with anti-acetylated tubulin staining,
Ptc1 (green) with anti-Ptc1 staining and nuclei (blue) with DAPI staining. The two cells of
interest are labeled 1 and 2 in the middle column and their cilia are marked with arrows in the
left column. Higher magnification views of select anti-Ptc1 stained cells boxed in the middle
panel are shown in the right-most column. Cell 1 shows Ptc1 in a domain encircling the base of
the cilium and in particles along the cilium. Cell 2 has a cilium oriented in the plane of the page
with Ptc1 around the base and along the shaft.

Page 9
Fig. S6. ShhN covalently labeled at cysteine residues with Alexa 594-maleimide (ShhN-
A594) can activate the Hh signal transduction pathway and induce target gene
transcription. The enzymatic activity of β-galactosidase can be used to assay Hh target gene
transcription in ptc1+/- MEFs since the since the ptc1 knock-out allele was constructed by
introducing a bacterial lacZ gene (encoding β-galactosidase) into the ptc1 locus under control of
the endogenous control elements (S2). Untreated ptc1+/- cells or ptc1+/- cells treated for 48
hours with the indicated concentrations of bacterially produced ShhN (prior to labeling) or
ShhN-A594 (after labeling) were lysed and assayed for β-galactosidase activity using a
luminescent substrate (Applied Biosystems Galacto-Light substrate). The ShhN-A594 is
approximately three-fold less potent than the parent ShhN from which it is derived.
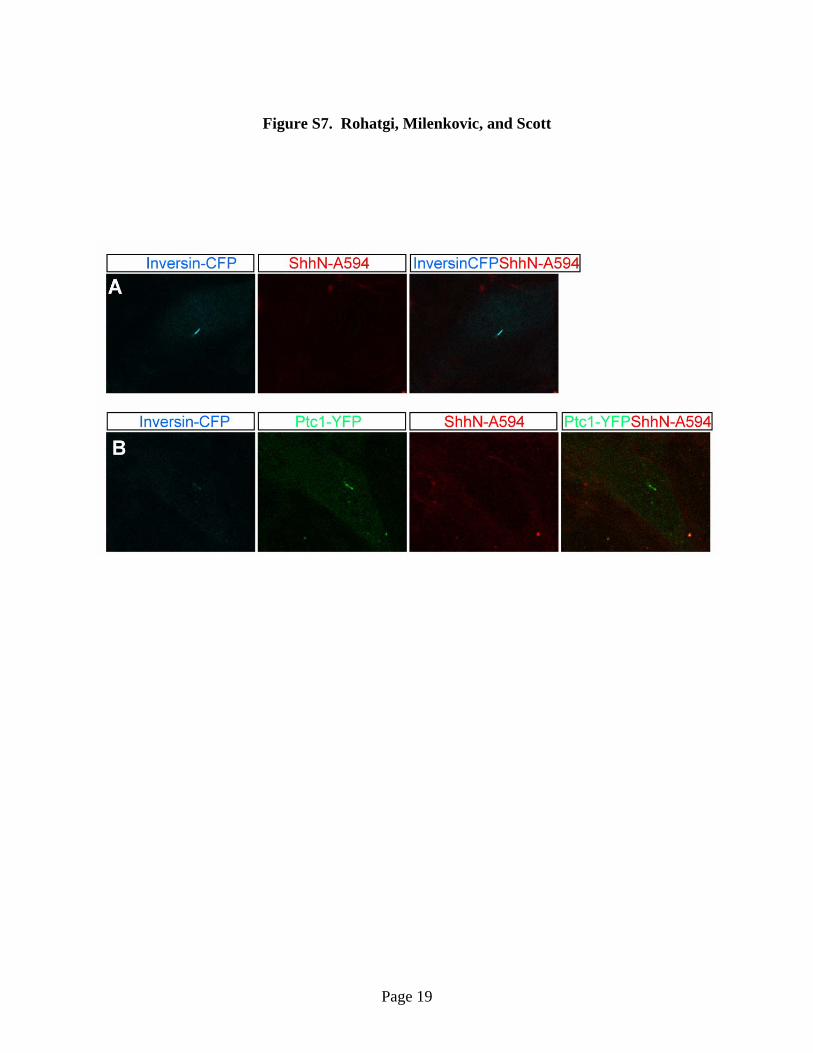
Fig. S7. Controls for Figure 3A showing that ShhN-A594 does not bind to cilia in the
absence of over-produced Ptc1-YFP in ptc1-/- cells or in the presence of unlabeled
competitor. In all micrographs, live ptc1-/- cells were imaged. Cyan denotes the fluorescence
of Inversin-CFP used to mark cilia, green indicates Ptc1-YFP and red indicates ShhN-A594
added to cells for 45 minutes. (A) This control shows that ShhN-594 does not bind to the cilia of
ptc1-/- cells transfected with Inversin-CFP alone. (B) Pre-incubation with an excess of
unlabelled ShhN (20μg/ml) can prevent the binding of ShhN-A594 (300ng/ml) to Ptc1-YFP at
the primary cilium, showing that addition of the A594 label does not cause a non-specific
interaction of ShhN with cilia.
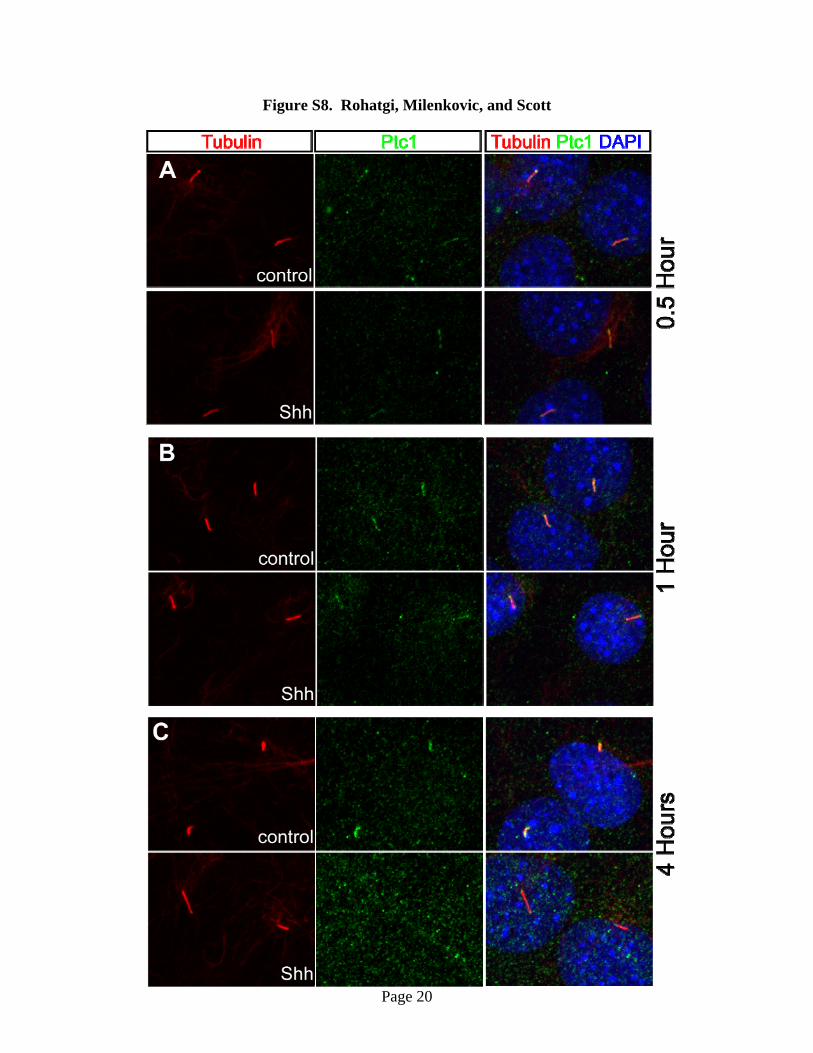
Fig. S8. Shh accelerates the removal of Ptc1 from the primary cilium. In all micrographs,
cilia (red) were detected with anti-acetylated tubulin staining, Ptc1 (green) with anti-Ptc1

Page 10
staining and nuclei (blue) with DAPI staining. Micrographs show the localization of Ptc1 at the
primary cilium in NIH 3T3 cells pulsed with SAG for 24 hours and then chased with Shh-
containing conditioned medium or regular medium (control) for 0.5 hour (A), 1 hour (B) and 4
hours (C).
Fig. S9. Activation of the Hh pathway in NIH3T3 cells by 20α-hydroxy cholesterol.
Immunoblots with anti-Ptc1, anti-Smo, and anti-actin were used to assess levels of endogenous
Ptc1, Smo, and actin (loading control) protein in extracts from NIH3T3 cells treated with 20α-
hydroxy cholesterol (10μM) or the control 7α-hydroxy cholesterol (10μM) for the indicated
periods of time. Ptc1 is a Hh target gene and the marked rise in Ptc1 protein levels induced by
20α-hydroxy cholesterol is indicative of pathway activation.
Fig. S10. Transfected Ptc1-YFP but not NPC1-YFP localizes in primary cilia. Niemann-
Pick type C1 protein (NPC1), a 13-pass transmembrane protein, is related to Ptc1 in sequence
but has functions in cholesterol trafficking and has mouse and human phenotypes completely
distinct from those of ptc1 mutants (S14). In all micrographs, cilia (red) were detected with anti-
acetylated tubulin staining, NPC1-YFP or Ptc1-YFP (green) with YFP fluorescence and nuclei
with DAPI staining. (A) NPC1-YFP over-produced by transfection in ptc1-/- cells does not
localize to primary cilia. The NPC1-YFP construct used here encodes an active protein because
it can rescue npc1-/- cells (data not shown). (B) Ptc1-YFP overproduced in these same cells by
transfection shows punctate localization in primary cilia.

Page 11
Fig. S11. Shh treatment does not lead to a decline in Ptc1 protein levels. As described for
Fig.3, NIH3T3 cells pre-incubated with SAG (100nM) for 24 hours to induce Ptc1 protein (Lane
2) were switched to control medium (Lanes 3-5) or into Shh-containing medium (Lanes 6-8).
Comparison of this blot to Fig.3 demonstrates that Shh treatment causes the disappearance of
Ptc1 from primary cilia over a timescale (1-4 hours) during which total Ptc1 protein levels are
completely stable.
Fig. S12. Localization of Ptc1-YFP. Ptc1-YFP transduced into ptc1-/- cells with a retrovirus
localizes in a domain around the base of the cilium and in a particulate pattern along the shaft of
the cilium. Cilia (red) were detected with anti-acetylated tubulin staining, Ptc1-YFP (green) with
anti-Ptc1 staining and nuclei (blue) with DAPI staining. The inset in the right panel shows a
high magnification view of the primary cilium. Note that the Ptc1-YFP levels are so low that the
endogenous fluorescence of YFP is not visible and immunofluorescence must be used to detect
the protein.
Fig. S13. Localization of Smo (A) and Ptc1 (B) in high magnification views of the ventral
neural tube. Cross-sections of E9.5 embryos were stained with anti-acetylated tubulin to detect
cilia (green), anti-Smo or anti-Ptc1 (red) and DAPI to mark nuclei (blue). In this region of the
embryo, Shh released from Notochord (nc) activates Hh signaling in the Floor Plate and ventral
neural tube. As expected for cells with high-level activation of Hh signaling, Smo is strongly
localized to cilia (A) projecting into the central canal of the neural tube (63X and 6X zoom).
Conversely, Ptc1 levels in cilia are generally quite low but a few cilia (arrows in (B)) have
detectable punctate Ptc1 staining (63X and 4X zom). Cilia are difficult to visualize in the neural
Page 12
tube because anti-acetylated tubulin stains both cilia and nascent neuronal processes. Cilia
projecting into the lumen of the neural tube are easiest to visualize and their identity was
confirmed by the presence of Pericentrin staining (red) at the base (C) (63X and 6X zoom).
Fig. S14. Localization of pericentrin confirms the identity of primary cilia. A fibroblast
transfected with Ptc1-YFP was stained with anti-acetylated tubulin to label the ciliary axoneme
(red), anti-pericentrin to label the basal body (purple), anti-Ptc1 to label Ptc1-YFP (green), and
DAPI to label nuclei (blue). The presence of pericentrin at the base confirms that the structure
outlined by anti-acetylated tubulin and Ptc1-YFP represents the primary cilium.

Page 13
Figure S1. Rohatgi, Milenkovic, and Scott
Page 14
Figure S2. Rohatgi, Milenkovic, and Scott

Page 15
Figure S3. Rohatgi, Milenkovic, and Scott

Page 16
Figure S4. Rohatgi, Milenkovic, and Scott

Page 17
Figure S5. Rohatgi, Milenkovic, and Scott

Page 18
Figure S6. Rohatgi, Milenkovic, and Scott
Page 19
Figure S7. Rohatgi, Milenkovic, and Scott
Page 20
Figure S8. Rohatgi, Milenkovic, and Scott

Page 21
Figure S9. Rohatgi, Milenkovic, and Scott

Page 22
Figure S10. Rohatgi, Milenkovic, and Scott

Page 23
Figure S11. Rohatgi, Milenkovic, and Scott

Page 24
Figure S12. Rohatgi, Milenkovic, and Scott

Page 25
Figure S13. Rohatgi, Milenkovic, and Scott

Page 26
Figure S14. Rohatgi, Milenkovic, and Scott

Page 27
Supplementary References
S1. L. V. Goodrich, L. Milenkovic, K. M. Higgins, M. P. Scott, Science 277, 1109 (Aug 22,
1997).
S2. E. C. Bailey, L. Milenkovic, M. P. Scott, J. F. Collawn, R. L. Johnson, J Biol Chem 277,
33632 (Sep 13, 2002).
S3. W. S. Pear, G. P. Nolan, M. L. Scott, D. Baltimore, Proc Natl Acad Sci U S A 90, 8392
(Sep 15, 1993).
S4. S. Sinha, J. K. Chen, Nat Chem Biol 2, 29 (Jan, 2006).
S5. M. Varjosalo, S. P. Li, J. Taipale, Dev Cell 10, 177 (Feb, 2006).
S6. J. R. Dwyer et al., J Biol Chem 282, 8959 (Mar 23, 2007).
S7. D. C. Ko, M. D. Gordon, J. Y. Jin, M. P. Scott, Mol Biol Cell 12, 601 (Mar, 2001).
S8. J. Taipale et al., Nature 406, 1005 (Aug 31, 2000).
S9. H. Roelink et al., Cell 81, 445 (May 5, 1995).
S10. F. R. Taylor et al., Biochemistry 40, 4359 (Apr 10, 2001).
S11. D. N. Wheatley, Pathobiology 63, 222 (1995).
S12. D. Watanabe et al., Development 130, 1725 (May, 2003).
S13. J. K. Chen, J. Taipale, M. K. Cooper, P. A. Beachy, Genes Dev 16, 2743 (Nov 1, 2002).
S14. J. P. Incardona, Dev Cell 8, 798 (Jun, 2005).