Embed Size (px)
Citation preview
www.sciencemag.org/cgi/content/full/1135875/DC1
Supporting Online Material for
Homoploid Hybrid Speciation in an Extreme Habitat Zachariah Gompert,* James A. Fordyce, Matthew L. Forister,
Arthur M. Shapiro, Chris C. Nice
*To whom correspondence should be addressed. E-mail: [email protected]
Published 30 November 2006 on Science Express
DOI: 10.1126/science.1135875
This PDF file includes:
Materials and Methods SOM Text Figs. S1 to S10 Tables S1 to S4 References

Supporting Online Material 1 Materials and Methods 2 Collection and DNA Extraction. Male and female Lycaeides were collected from eight 3 populations in California and Nevada between 2001 and 2004. Collection localities were: 4 Carson Pass, California (38°42’ 47.48” N, 120°01’ 17.44” W), Mt. Rose, Nevada (39°19’ 5 20.71” N, 119°55’ 48.36” W), Trap Creek, California (39°22’ 43.17” N, 120°40’ 27.42” 6 W), Yuba Gap, California (39°19’ 23.75” N, 120°35’ 39.15” W), Leek Springs, 7 California (38°37’ 55.88” N, 120°14’ 23.64” W), Verdi, Nevada (39°03’ 01.08” N, 8 119°55’ 48.36” W), Sierraville, California (39°37’ 47.61” N, 120°21’ 40.14” W), and 9 Gardnerville, Nevada (38°48’ 54.44” N, 119°46’ 44.27” W) (Fig. 1). Individuals were 10 stored at -80°C prior to DNA extraction. DNA was isolated from approximately 0.5 g of 11 thoracic tissue following the methods of Hillis et al. (S1) and Brookes et al. (S2). 12 13 Mitochondrial DNA Amplification and Genealogy Construction. We sequenced 14 portions of the mitochondrial genes cytochrome oxidase c subunit I (COI; 408 bp) and 15 cytochrome oxidase c subunit II (COII; 507 bp) for 9-11 individuals from each of the 16 eight populations. PCR and sequencing were performed using the primer pairs C1-J- 17 1751/C1-N-2191 (S3) and Pierre/Eva (S4) for COI and COII respectively. Labeled 18 amplicons were separated and visualized using a Beckman 8800 automated sequencer 19 (Beckman Coulter Inc., Fullerton, CA). Sequences were aligned using Sequencher 4.2.2. 20 or by eye. Fourteen unique haplotypes were identified (Table S1) (GenBank Accessions 21 EF090312-EF090347). Phylogenetic hypotheses for the relationship among the sampled 22 haplotypes were constructed using both Bayesian maximum likelihood methods and 23 maximum parsimony. Plebejus icarioides, P. shasta, and P. saepiolus were used as the 24 outgroup. For the Bayesian maximum likelihood analysis the sequence data was 25 partitioned by gene region and codon position. Sequence evolution models for each 26 partition were selected using Modeltest 3.7 based on AIC (S5). The models selected were 27 HKY, F81, TrN+I, K81uf+I, TrN, and TIM+γ for COI 1st codon position, COI 2nd 28 codon position, COI 3rd codon position, COII 1st codon position, COII 2nd codon 29 position, and COII 3rd codon position, respectively. Bayesian analysis was conducted 30 using MrBayes ver 3.1.2 (S6) with one cold chain and three hot chains run for 2 x 10⁶ 31 generations with a burn-in of 5 x 10⁵ generations. Maximum parsimony tree construction 32 was implemented using PAUP* version 4.0b10 (S7) using the heuristic search option 33 with TBR branch swapping. Statistical support for bifurcations was assessed via 1000 34 bootstrap replicates (Fig. S1). 35 36 Amplified Fragment Length Polymorphism (AFLP) Data. AFLP marker profiles were 37 produced for 208 individuals (Table S1) sampled from each of the eight populations 38 using three selective primer pairs: EcoRI-ACA and MseI-CTTG, EcoRI-ACA and MseI- 39 CTTA, EcoRI-AGT and MseI-CTTA. Amplicons were separated and visualized on 6% 40 denaturing polyacrylamide gels, using an ABIPRISM 377 DNA sequencer (Applied 41 BioSystems Inc., Foster City, CA). GeneScan (Applied BioSystems Inc., Foster City, 42 CA) was used to visualize AFLP bands, which were sized by comparison to a standard 43 ladder (ROX standard, Applied Biosystems Inc., Foster City, CA) added to each lane. 44 Band selection and quality control was performed following previously described 45

methods (S8), which were shown to yield highly reproducible results. 128 polymorphic 46 AFLP markers were generated. 47 48 Co-dominant Nuclear Loci. Non-coding nuclear genes were amplified using the 49 following primer pair combinations: Nuc1 (nuc1f 5’ACGCGTGATAAGGAACTTCG 3’ 50 and nuc1r 5’CTCTGCTTGCAATTCATTTTTG 3’) and Nuc3 (nuc3f 51 5’TTTTCCATAGCTTGACAAGAGC 3’ and nuc3r 52 5’TTGAATGTACTGTAACTTCTTGGTG 3’). Primers for non-coding nuclear genes 53 were designed following methods modified from Jennings & Edwards (S9). A portion of 54 the coding gene elongation factor 1 subunit alpha (Ef1α) was amplified using the 55 following primer pair: (E234f 5’ GTCACCATCATYGACGC 3’ and LEf1ar 5’ 56 ACTTGCCCTCGGCCTTAC 3’). Sequencing was performed as described for mtDNA 57 methods. Ambiguous heterozygous individuals were confirmed by cloning. The 58 sequenced products for Nuc1, Nuc3, and Ef1α were 364 bp, 291 bp, and 308 bp in length 59 respectively (GenBank Accessions EF090348-EF090397). Microsatellites Msat201, 60 Msat4, and MsatZ12-1 were amplified with primers from Anthony et al. (S10). The 61 distribution of genetic variation for all six of these loci is given in Fig. S6, Table S1. A 62 maximum-parsimony haplotype network was constructed to visualize the genealogical 63 relationships among the sampled alleles for each of the sequence loci using TCS 1.2.1 64 (S11), which employs the statistical algorithms of Templeton et al. (S12) (Figs. S2-S3, 65 S7). 66 67 Bayesian Assignment Analyses Using Structure. The Bayesian assignment analysis of 68 Pritchard et al. (S13) was performed using STRUCTURE 2.1 with a burn-in of 50,000 69 generations and a markov chain of 500,000 generations. Two clusters were assumed to 70 test the hypothesis that the alpine populations possessed a mosaic genome; three clusters 71 were assumed to determine if the alpine populations were genetically differentiated from 72 L. melissa and L. idas (Fig. 1, Table S1). We determined the number of clusters that best 73 describe the data based on the methods of Pritchard et al. (S13) and Evanno et al. (S14). 74 Two and three clusters best explained the data when we ran these analyses with the 75 number of clusters set from one to nine. When more than three clusters were assumed, 76 individual populations began to be assigned to their own clusters (Fig. S8). The alpine 77 populations at Carson Pass and Mt. Rose were assigned to their own clusters at K=4 78 because they are clearly more differentiated from each other than are populations within 79 L. idas or L. melissa. However, at no K do either of the alpine populations cluster with 80 other populations. Beyond K=4, individual L. melissa populations were also assigned to 81 their own clusters (Fig S9). 82 83 Tests of Hardy-Weinberg and Linkage Equilibrium. Gene flow among populations 84 will cause excess heterozygosity and deviations from linkage equilibrium if the 85 populations are differentiated at the loci being examined. To determine if the eight 86 Lycaeides populations differed at the co-dominant loci we examined, we computed 87 pairwise FST values for all pairs of populations based on all six co-dominant loci using 88 the software Arlequin ver. 2.000 (S15). Significance of FST was assessed via 1000 89 permutations of alleles between populations. We also performed the test of population 90 differentiation for all pairs of populations for all six co-dominant loci using Popgene ver. 91

3.4, which employs the methods of Raymond and Rousset (S16). Values of α followed 92 the suggestion of Moran (S17). The degree of population differentiation varied among 93 loci (Table S2). Overall, populations were sufficiently differentiated to make tests of 94 excess heterozygosity and linkage equilibrium meaningful. 95
Tests for excess heterozygosity were performed with the software FSTAT ver. 96 2.9.3.2 (S18); the significance of FIS was assessed via a permutation test (1000 97 permutations were performed). Tests of linkage equilibrium were performed with the 98 software POPGENE ver. 1.31 (S19) following the methods of Weir (S20). All six co- 99 dominant loci (Msat201, Msat4, MsatZ12-1, Nuc1, Nuc3, and Ef1α) were included in 100 these analyses. We did not detect a significant (at α=0.05) excess of heterozygostiy for 101 any of the loci in any of the eight populations. No significant (at α=0.05) deviations from 102 linkage equilibrium were detected for any of the eight populations. 103 104 Assignment Analysis to Identify F1 Individuals. The Bayesian assignment analysis of 105 Anderson and Thompson (NewHybrids) (S21) was used to classify Lycaeides individuals 106 based on their genotypes at all six co-dominant loci (Msat201, Msat4, MsatZ12-1, Nuc1, 107 Nuc3, and Ef1α). Two separate analyses were performed. For one analysis L. melissa and 108 alpine individuals were classified as pure L. melissa, pure alpine, or F1’s between L. 109 melissa and the alpine populations. For the other analysis L. idas and alpine individuals 110 were classified as pure L. idas, pure alpine, or F1’s between L. idas and the alpine 111 populations. For both analyses the markov chain was run for 106 generations with a burn-112 in of 500,000 generations. Half of the individuals were used to set priors for the allele 113 frequencies for L. melissa, L. idas, and the alpine populations, but these individuals were 114 excluded from the estimation of the mixing proportions. The results of these analyses are 115 shown in Figure S4. We did not attempt to classify individuals as F2’s and backcrosses as 116 these categories cannot be distinguished from the hybrid species. 117 118 Estimation of the Time to the Most Recent Common Ancestor (TMRCA). The 119 TMRCAs for L. melissa, L. idas, and the alpine populations were estimated based on 120 genetic variation at the mitochondrial loci COI and COII using the program Genetree 121 (S22). Estimates of TMRCA do not directly estimate the date of speciation, they provide 122 the timing of coalescence of alleles within a taxon. Thus, TMRCA estimates could post-123 date or pre-date the speciation event, but can provide a rough estimate of the hybrid 124 speciation event in Lycaeides. The maximum likelihood estimates of θ necessary for 125 estimating TMRCAs were obtained using the program Fluctuate ver. 1.4 (S23) (Table 126 S3). A single rare haplotype was pruned from L. idas to make the data set compatible 127 with the infinite sites model, which is required by Genetree. Coalescent time (T) was 128 converted into years (t) using t=2NefTg, where Nef is the female effective population size 129 based on θ and g is the generation time in years. The arthropod mutation rate proposed by 130 Brower (S24) was assumed to calculate Nef from estimates of θ. While this mutation rate 131 may not be accurate for Lycaeides, this does not affect the relative ages of L. melissa, L. 132 idas, and the alpine populations. Thus, the choice of this mutation rate does not affect the 133 interpretation of our results. Dates were also calculated using the slower Papilio mutation 134 rate (S25) for comparison. Lycaeides melissa is generally bivoltine, while L. idas and the 135 alpine populations are univoltine, thus generation times of 0.5 years, 1 year, and 1 year 136

were used for L. melissa, L. idas, and the alpine populations, respectively. Coalescent 137 times and times in years are given in Table S3. 138 139 Estimation of species divergence times (τ). We conducted a Bayesian based coalescent 140 analysis of sequence data for COI/COII, Nuc1, Nuc3, and Ef1α using the software 141 MCMCcoal (S26) to estimate pairwise τ (divergence time x mutation rate) for L. melissa, 142 L. idas, and the alpine populations. τ was estimated using three separate pairwise 143 analyses instead of a single analysis with all three species because MCMCcoal requires a 144 known bifurcating species phylogeny for all species that are included in a single analysis 145 (S26). MCMCcoal requires user specified gamma priors for θ and τ. Identical gamma 146 priors (α=4, β=2000) for θ were used for all three species. The same gamma prior 147 (α=4.5, β=600) for τ was used for all species pairs. While the prior used for τ affected the 148 magnitude of estimates of τ, the order of these estimates remained constant. The prior 149 selected was relatively broad, and thus was chosen to minimize the influence of the prior 150 on the posterior probability estimates. MCMCcoal analyses were conducted using a burn-151 in of 10,000 generations and a Markov chain of 100,000 generations. Multiple runs with 152 different random seeds were conducted to assess convergence. 153 154 Host plant preference. While Lycaeides populations all use perennial legumes as larval 155 hosts, there is variation among populations in the specific host plant species used. The 156 natal host plant of each population is given in Table S1. To assess female host plant 157 fidelity individual females were caught and caged with a single male (individual caged 158 females do not lay eggs; interaction among individuals is required to stimulate 159 oviposition). Caged females were presented with the four host plants used by the eight 160 populations in this study: Astragalus whitneyi, Lotus nevadensis, Lupinus polyphyllus, 161 and Medicago sativa. After 48 hours the number of eggs a female had laid on each of the 162 host plants was recorded. Host plant fidelity was measured as the proportion of eggs a 163 female laid on her population’s natal host plant. This experiment was performed from 164 July 23-August 1 2006. Sample sizes for each population were as follows: Carson Pass (n 165 = 17), Mt. Rose (n = 7), Verdi (n = 13), Gardnerville (n = 8), Trap Creek (n = 8), Yuba 166 Gap (n = 11), Leek Springs (n = 14). A recent change in the ownership of the property in 167 Sierraville where the M. sativa field exists prohibited us from assessing oviposition 168 preference at that locality. 169
The rank-based Kruskal Wallis test was used to detect differences among 170 populations in fidelity for the natal host plant. Implementation of the Kruskal Wallis test 171 followed Conover (S27) using the test statistic T. Post-hoc comparisons among 172 populations used the procedure described in Conover (S27). Natal host plant preference 173 was significantly greater for both alpine populations (Carson Pass and Mt. Rose) than for 174 any other populations (Fig. 3). We also examined overall host preference with the same 175 experiments. In this case, each arena was considered a block and the number of eggs laid 176 on each available plant per arena was analyzed using the Quade test, a rank-based 177 randomized blocked ANOVA (S27-S28). While L. melissa and L. idas populations laid 178 eggs on Astragalus whitneyi, only the alpine populations prefer Astragalus whitneyi to 179 the exclusion of all other host plants (Table S4). 180
181 Supporting Text 182

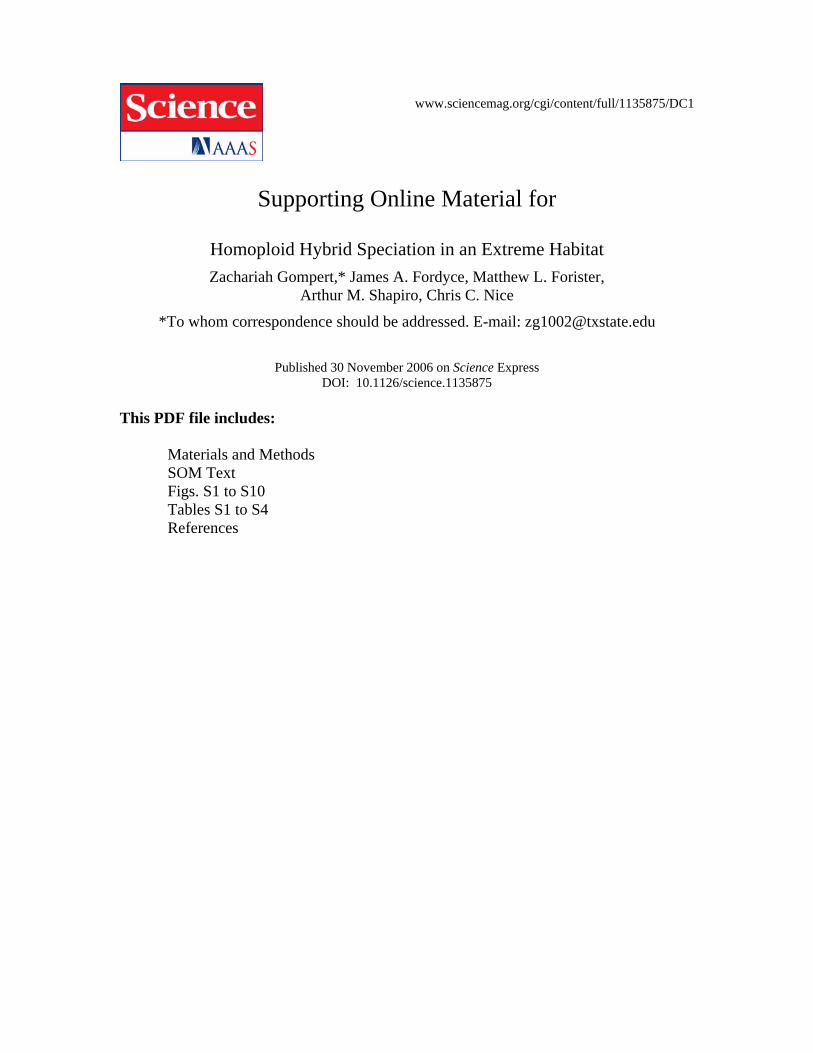
There is considerable evidence that the alpine populations have the same chromosome 183 number as their putative parental species. None of the loci examined show evidence of 184 duplication in the alpine populations, as would be expected if hybridization occurred via 185 allopolyploidy. If the hybrid species is polyploid, we would expect to observe a 186 significantly larger number of AFLP bands for alpine individuals. While the mean 187 number of bands differed among populations within species (F5,200 = 2.86, P = 0.016) and 188 among species (F2,5 = 3.37, P = 0.036), the alpine populations (mean = 38.8 ± 0.96) have 189 an intermediate number of AFLP bands per individual compared to L, idas (mean = 37.4 190 ± 0.72) and L. melissa (mean = 40.1 ± 0.74) (Fig. S10). Further support for the hypothesis 191 that the alpine populations constitute a homoploid hybrid species, as opposed to a 192 polyploidy species, comes from laboratory crosses between alpine females (Carson Pass) 193 and L.idas males (Yuba Gap), which produced viable offspring. 194 195 Figure Legends 196 197 Figure S1. Genealogical relationships among mitochondrial haplotypes for COI and 198 COII. Maximum parsimony cladogram, numbers correspond to bootstrap support (A). 199 Bayesian maximum likelihood phylogram, numbers correspond to Bayesian posterior 200 probabilities (B). Population allele frequencies are given in Table S1. 201 202 Figure S2. Maximum parsimony network for Nuc1. Each haplotype is represented by a 203 circle and the area of each circle is approximately proportional to the frequency of the 204 haplotype. Each haplotype is shaded yellow, blue, and green according to the proportion 205 of the individuals that belong to L. idas, L. melissa, and alpine Lycaeides respectively. 206 207 Figure S3. Maximum parsimony network for Nuc3. Each haplotype is represented by a 208 circle and the size of each circle is approximately proportional to the frequency of the 209 haplotype. Each haplotype is shaded yellow, blue, and green according to the proportion 210 of the individuals that belong to L. idas, L. melissa, and alpine Lycaeides respectively. 211 212 Figure S4. Barplots showing Bayesian assignment probabilities from the software 213 NewHybrids (21) for L. melissa and the alpine populations (A) and L. idas and the alpine 214 populations (B). Each vertical bar represents an individual and the proportion of each bar 215 represents an individual’s assignment probability as pure L. melissa (blue), pure L. idas 216 (yellow), pure alpine Lycaeides (green), and F1 (white). 217 218 Figure S5. Posterior probability distribution for τ (divergence time x mutation rate) for 219 three comparisons: L. melissa-L. idas (purple), L. melissa-alpine (red), and L. idas-alpine 220 (black). Mean (95% CI) estimates of τ for L. melissa-L. idas, L. melissa-alpine, and L. 221 idas-alpine were 0.006576 (0.002823-0.009855), 0.001318 (0.000638-0.002233), and 222 0.001468 (0.000763-0.002454) respectively. 223 224 Figure S6. Distribution of allelic variation of co-dominant markers among L. idas, L. 225 melissa, and the putative hybrid alpine populations. The proportion of each circle that is 226 colored denotes the proportion of individuals with alleles that are unique to L. idas or L. 227 idas and the alpine (yellow), unique to L. melissa or L. melissa and the alpine (blue), 228

unique to the alpine populations (green), or shared between the parental species or the 229 parental species and the alpine (white). These loci demonstrate three general patterns. For 230 Nuc1 considerable allelic variation is shared between the alpine populations and the 231 parental species. For Nuc3 all three entities possess private alleles, while for Ef1α, 232 Msat201, Msat4, and MsatZ12-1 most of the allelic variation is shared among L. idas, L. 233 melissa, and the alpine populations. Haplotype frequencies and sample sizes are given in 234 Table S1. 235 236 Figure S7. Maximum parsimony network for Ef1α. Each haplotype is represented by a 237 circle and the size of each circle is approximately proportional to the frequency of the 238 haplotype. Each haplotype is shaded yellow, blue, and green according to the proportion 239 of the individuals that belong to L. idas, L. melissa, and alpine Lycaeides respectively. 240 241 Figure S8. Assessment of k (number of clusters) that best explains the structure of the 242 AFLP data. The number of clusters (k) vs. the second order rate of change in k (Δk) (A). 243 The number clusters vs. the negative natural log of the likelihood (-ln (Likelihood)) of the 244 data given the assumed number of clusters (k). 245 246 Figure S9. Barplots showing Bayesian assignment probabilities from the software 247 STRUCTURE 2.1 (13) for four (A), five (B), six (C), seven (D) and eight (E) clusters. 248 Each vertical bar corresponds to one individual. The proportion of each bar that is a 249 different color represents an individuals assignment probability to the different specific 250 clusters. (CP = Carson Pass, MR = Mt. Rose, VE = Verdi, GV = Gardnerville, SV = 251 Sierraville, TC = Trap Creek, YG = Yuba Gap, LS = Leek Springs) 252 253 Figure S10. Mean number (± SE) of AFLP bands per individual per species. Different 254 letters indicate significantly different numbers of bands in multiple comparisons (α = 255 0.05) with Tukey’s HSD. 256 257
258

Figure S1 258
259 260

Fig. S2 260
261 262
263

Fig. S3 263
264 265
266

Fig. S4 266
267 268

Fig. S5 268
269 270
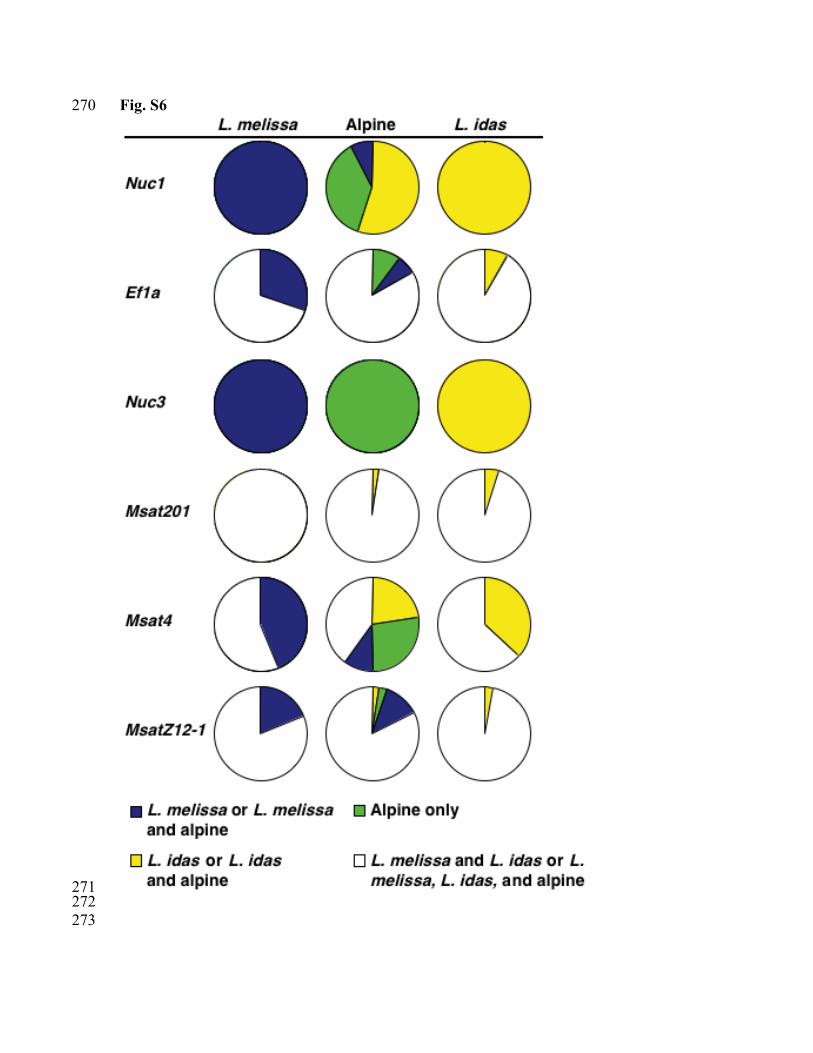
Fig. S6 270
271 272
273

Fig. S7 273
274 275
276

Fig. S8 276 277 278
279 280

Fig. S9 280 281
Fig. S10 281
282 283

Table S1. Summary data for all populations. Sample size and assignment probabilities 283 are for the AFLP data. Sample sizes and allele frequencies are also given for all co-284 dominant markers and COI/COII. 285 Population (abbrev):
Trap Creek (TC)
Yuba Gap (YG)
Leek Springs (LS)
Carson Pass (CP)
Mt. Rose (MR)
Verdi (VE)
Sierra-ville (SV)
Gardner-ville (GV)
Nominal Taxonomic Designation
L. idas L. idas L. idas Alpine Alpine L. melissa
L. melissa
L. melissa
Natal Host Plant
Lotus nevadensis
Lotus nevadensis
Lupinus Polyphyllus
Astragalus whitneyi
Astragalus whitneyi
Medicago sativa
Medicago sativa
Medicago sativa
Elevation (m)
1687 1719 2298 2817 2914 1247 1500 1537
Sample size 24 28 29 32 18 23 27 27 AFLP k=2 Cluster 1 0.965 0.976 0.978 0.691 0.814 0.029 0.045 0.051 Cluster 2 0.020 0.024 0.022 0.309 0.186 0.971 0.955 0.949 AFLP k=3 Cluster 1 0.944 0.916 0.895 0.141 0.058 0.010 0.019 0.017 Cluster 2 0.036 0.071 0.094 0.779 0.931 0.016 0.015 0.037 Cluster 3 0.020 0.013 0.011 0.080 0.011 0.974 0.965 0.946 Nuc1 10 10 10 10 10 11 10 10 A 0.20 0.15 0.05 0.05 0.70 0 0 0 B 0.65 0.85 0.90 0.20 0.05 0 0 0 C 0 0 0 0.05 0 0.59 0.25 0.75 D 0 0 0 0.05 0 0.36 0.50 0.10 E 0 0 0 0 0 0 0.10 0 F 0.15 0 0 0.05 0 0 0 0 G 0 0 0 0 0.25 0 0 0 H 0 0 0.05 0 0 0 0 0 I 0 0 0 0 0 0 0 0.10 K 0 0 0 0.15 0 0 0 0 N 0 0 0 0 0 0 0.05 0 P 0 0 0 0 0 0.05 0 0 Q 0 0 0 0.10 0 0 0 0 R 0 0 0 0.05 0 0 0 0.05 S 0 0 0 0 0 0 0.05 0 V 0 0 0 0 0 0 0.05 0 * 0 0 0 0.30 0 0 0 0 Hobs 0.30 0.10 0.20 0.90 0.60 0.66 0.50 0.40 Hexp 0.55 0.36 0.28 0.95 0.47 0.54 0.78 0.43 Ef1α 10 10 10 10 10 11 10 10 A 0.20 0.45 0.70 0.50 0.95 0.32 0 0.15 B 0.15 0.10 0 0 0 0 0 0 C 0.65 0.45 0.30 0.25 0.05 0.55 0.70 0.40 D 0 0 0 0.10 0 0.09 0.25 0.40 E 0 0 0 0.10 0 0 0 0 F 0 0 0 0 0 0.05 0 0 G 0 0 0 0.05 0 0 0 0 H 0 0 0 0 0 0 0.05 0 I 0 0 0 0 0 0 0 0.05

Hobs 0.50 0.50 0.40 0.80 0.10 0.55 0.60 0.50 Hexp 0.54 0.69 0.68 0.70 0.57 0.66 0.68 0.70 Nuc3 10 10 10 10 10 11 10 10 A 0 0 0 0.65 1.00 0 0 0 B 0 0 0 0 0 0.77 0.15 0 C 0.70 0.70 0.95 0 0 0 0 0 D 0 0 0 0 0 0.14 0.40 0.60 E 0 0 0.05 0 0 0 0 0 F 0 0 0 0.20 0 0 0 0 G 0.15 0.10 0 0 0 0 0 0 H 0 0 0 0 0 0.09 0.40 0.20 I 0 0 0 0.05 0 0 0 0 J 0.10 0 0 0 0 0 0 0 K 0 0 0 0 0 0 0 0.05 L 0.05 0 0 0 0 0 0 0 M 0 0 0 0 0 0 0.05 0 N 0 0 0 0.10 0 0 0 0 O 0 0 0 0 0 0 0 0.10 P 0 0.05 0 0 0 0 0 0 Q 0 0 0 0 0 0 0 0.05 R 0 0.15 0 0 0 0 0 0 Hobs 0.20 0.60 0.10 0.30 0.00 0.09 0.40 0.40 Hexp 0.58 0.50 0.19 0.63 0.00 0.48 0.74 0.62 Msat201 10 10 10 10 10 11 10 10 109 0.05 0.20 0.10 0.20 0 0.14 0.45 0.35 113 0.85 0.80 0.80 0.80 0.95 0.86 0.55 0.65 123 0.05 0 0 0 0.05 0 0 0 137 0 0 0.10 0 0 0 0 0 Hobs 0.20 0.50 0.40 0.20 0.10 0.27 0.30 0.30 Hexp 0.36 0.42 0.36 0.42 0.19 0.25 0.62 0.54 Msat4 10 10 10 10 10 11 10 10 204 0 0 0 0.05 0 0 0 0 210 0 0 0 0 0 0 0.05 0 212 0 0.05 0.05 0 0 0 0 0 214 0 0 0 0 0 0.05 0 0 218 0.15 0 0.15 0 0 0 0 0 220 0.45 0.45 0.10 0.15 0 0 0.05 0.20 222 0.05 0.05 0.10 0.15 0.40 0.14 0.20 0.65 224 0 0 0.05 0 0 0.05 0.20 0 226 0 0 0 0.15 0.10 0 0 0 228 0 0 0.05 0 0.40 0 0 0 230 0 0.10 0 0 0 0 0 0 232 0 0.05 0.05 0 0 0.05 0 0 234 0.05 0.10 0.25 0 0.10 0.09 0.15 0 236 0.05 0 0 0 0 0 0 0 238 0 0 0.05 0 0 0.05 0.10 0 240 0 0 0 0.15 0 0.05 0 0 242 0 0 0 0 0 0.05 0 0 244 0 0 0.05 0 0 0.18 0 0 246 0 0 0 0 0 0 0.10 0 248 0 0 0 0.05 0 0.32 0.15 0 250 0.05 0 0.05 0 0 0 0 0 252 0 0.05 0 0 0 0 0 0

256 0 0 0 0 0 0 0 0.15 258 0 0 0 0.10 0 0 0 0 260 0 0.15 0 0 0 0 0 0 262 0.05 0 0 0 0 0 0 0 264 0.05 0 0 0.05 0 0 0 0 268 0.05 0 0 0 0 0 0 0 270 0 0 0 0.15 0 0 0 0 292 0.05 0 0 0 0 0 0 0 Hobs 0.50 0.70 0.90 0.40 0.50 0.73 0.60 0.20 Hexp 0.84 0.83 0.89 0.93 0.70 0.89 0.92 0.61 MsatZ12-1 9 10 10 10 10 11 10 10 163 0.06 0 0 0 0 0 0 0 195 0 0 0 0 0 0.05 0 0 197 0.61 0.85 0.70 0.30 0.20 0.50 0.40 0.45 199 0.22 0.10 0.25 0.30 0.70 0 0.10 0 201 0.11 0 0 0.15 0 0.18 0.25 0.35 203 0 0 0 0.10 0.10 0.14 0.15 0.10 205 0 0 0.05 0 0 0.09 0 0.10 207 0 0 0 0.05 0 0 0 0 211 0 0.05 0 0.05 0 0 0 0 213 0 0 0 0.05 0 0.05 0 0 215 0 0 0 0 0 0 0.05 0 219 0 0 0 0 0 0 0.05 0 Hobs 0.78 0.30 0.40 0.70 0.20 0.45 0.60 0.50 Hexp 0.66 0.28 0.54 0.85 0.57 0.78 0.78 0.73 COI/COII 10 9 10 10 9 11 10 10 A 0 0 0 0.80 0.11 0 0 0 B 0 0 0 0.10 0 0 0 0 C 0 0 0 0.10 0 0 0 0 D 0 0 0 0 0 0.91 0 0.70 E 0 0 0 0 0 0 1.00 0.30 F 0 0 0.20 0 0 0 0 0 G 0 0 0.80 0 0 0 0 0 H 0 0 0 0 0.89 0 0 0 I 0.10 0 0 0 0 0 0 0 J 0.10 0 0 0 0 0 0 0 K 0.60 0.89 0 0 0 0 0 0 L 0.20 0 0 0 0 0 0 0 M 0 0 0 0 0 0.09 0 0 N 0 0.11 0 0 0 0 0 0 *This includes six alleles unique to Carson Pass each at a frequency of 0.05 286 287
288

Table S2. Pair-wise test of population differentiation and FST. P-values for Raymond and 288 Rousset (S16) test of population differentiation are above the diagonal, pair-wise FST 289 values are below the diagonal. Significant values at α=0.05 are in bold. 290 Nuc1 TC YG LS CP MR VE SV GV TC - 0.22456 0.07251 0.00618 <0.00001 <0.00001 <0.00001 <0.00001 YG 0.02931 - 0.60596 0.00020 <0.00001 <0.00001 <0.00001 <0.00001 LS 0.09032 -0.01793 - <0.00001 <0.00001 <0.00001 <0.00001 <0.00001 CP 0.12641 0.26092 0.30146 - <0.00001 <0.00001 <0.00001 <0.00001 MR 0.38941 0.56783 0.63959 0.25875 - <0.00001 <0.00001 <0.00001 VE 0.45840 0.59094 0.62634 0.22159 0.49424 - 0.05561 0.05256 SV 0.37632 0.51316 0.55000 0.14149 0.41316 0.07146 - 0.00138 GV 0.51579 0.65263 0.68947 0.28079 0.55263 0.03622 0.23283 - 291 292 Nuc3 TC YG LS CP MR VE SV GV TC - 0.020289 0.03484 <0.00001 <0.00001 <0.00001 <0.00001 <0.00001 YG -0.01010 - 0.02746 <0.00001 <0.00001 <0.00001 <0.00001 <0.00001 LS 0.10448 0.10448 - <0.00001 <0.00001 <0.00001 <0.00001 <0.00001 CP 0.47368 0.47368 0.67368 - 0.00816 <0.00001 <0.00001 <0.00001 MR 0.75000 0.75000 0.95000 0.21053 - <0.00001 <0.00001 <0.00001 VE 0.55461 0.55461 0.74737 0.52899 0.79501 - 0.00028 <0.00001 SV 0.40526 0.40526 0.60526 0.37895 0.65526 0.32062 - <0.00001 GV 0.44211 0.44211 0.64211 0.41579 0.69211 0.44208 0.04025 - 293 294 Ef1α TC YG LS CP MR VE SV GV TC - 0.24160 0.00231 0.00399 <0.00001 0.14808 0.00236 0.00255 YG 0.03909 - 0.17858 0.12737 0.00159 0.26437 0.00001 0.00245 LS 0.25999 0.03828 - 0.27392 0.09139 0.03767 <0.00001 0.00024 CP 0.15789 0.00695 0.00686 - 0.01565 0.15265 <0.00001 0.01557 MR 0.58707 0.34928 0.15296 0.21951 - 0.00002 <0.00001 <0.00001 VE 0.00182 -0.00992 0.13381 0.05207 0.45399 - 0.01268 0.05490 SV 0.07291 0.20861 0.42372 0.26974 0.70548 0.08578 - 0.07005 GV 0.13269 0.13272 0.26995 0.11498 0.52867 0.06268 0.06621 - 295 296 Msat201 TC YG LS CP MR VE SV GV TC - 0.82543 0.53568 0.66360 0.73908 0.82373 0.03077 0.12565 YG -0.02167 - 0.42147 1.00000 0.10617 0.53702 0.17417 0.48288 LS -0.02716 -0.01801 - 0.41839 0.10647 0.39461 0.01851 0.07532 CP -0.02632 -0.04532 -0.02167 - 0.10596 0.69037 0.18162 0.48201 MR 0.00277 0.09511 0.04605 0.08991 - 0.23309 0.00110 0.00810 VE -0.04175 -0.01830 -0.02257 -0.03492 0.03186 - 0.03841 0.15246 SV 0.17949 0.05845 0.14665 0.08735 0.34968 0.17571 - 0.74608 GV 0.08134 -0.01100 0.05973 0.00513 0.24321 0.07416 -0.03093 - 297 298 Msat4 TC YG LS CP MR VE SV GV TC - 0.15654 0.05449 0.00195 <0.00001 <0.00001 0.00010 <0.00001 YG 0.00067 - 0.01393 0.00066 <0.00001 0.00010 0.00010 <0.00001 LS 0.07172 0.08254 - 0.00094 0.00106 0.01482 0.10634 <0.00001 CP 0.07289 0.08108 0.06674 - 0.00018 0.00036 0.00183 0.00004 MR 0.23617 0.23766 0.12666 0.12945 - 0.00033 0.00027 0.00002 VE 0.15976 0.15922 0.06682 0.06921 0.16559 - 0.13941 <0.00001 SV 0.12007 0.11866 0.02215 0.05208 0.12184 0.01954 - 0.00003

GV 0.23827 0.24426 0.21484 0.16453 0.16430 0.22494 0.16463 - 299 MsatZ12-1
TC YG LS CP MR VE SV GV
TC - 0.13973 0.46605 0.23548 0.00287 0.04488 0.17546 0.01700 YG 0.04967 - 0.31887 0.00234 <0.00001 0.00206 0.00251 0.00026 LS -0.02837 0.01662 - 0.03174 0.00185 0.00407 0.00828 0.00056 CP 0.03711 0.23445 0.10195 - 0.05649 0.10489 0.34756 0.00186 MR 0.25442 0.49792 0.30465 0.09722 - <0.00001 0.00039 <0.00001 VE 0.02486 0.12855 0.07887 0.04683 0.31895 - 0.50392 0.80120 SV 0.02932 0.19028 0.10640 0.00346 0.24677 -0.01628 - 0.47623 GV 0.06350 0.21585 0.14861 0.06214 0.34795 -0.02245 -0.01962 - 300
301

Table S3. Coalescent-based estimates of the TMRCA for sampled mitochondrial 301 haplotypes from L. melissa, L. idas, and the alpine populations. Coalescent time was 302 converted into years before present (YBP) using Nef estimates from θ, a generation time 303 of six months for L. melissa and one year for both L. idas and the alpine populations, and 304 a mutation rate of a) 1.1 x 10⁻⁸(S24) or b) 7.8 x 10⁻⁹ (S25) substitutions per site per year. 305 L. melissa L. idas Alpine Coalescent Time 6.6949 3.7107 2.7406 SD 4.7257 1.4893 1.1751 θ 0.003127 0.001879 0.0008882 YBP a 1,902,995 1,267,885 442,579 YBP b 2,683,710 1,788,044 624,149
306

Table S4. Results of oviposition preference tests. Numbers indicate the median 306 proportion of eggs laid on each plant species. Different letters indicate significantly 307 different proportion of eggs laid on each plants in multiple comparisons (α = 0.05) using 308 the Quade test (S27). Natal host plant information is provided in Table S1. 309 310 HOST PLANT POPULATION T P A. whitneyi L. nevadensis L. polyphyllus M. sativa
Alpine CP 19.16 < 0.001 1A 0B 0B 0B
MR 8.11 0.001 0.78A 0B 0B 0B
L. Melissa
VE 6.09 0.002 0.35A 0.12BC 0.05C 0.29AB
GV 0.36 0.780 0.18 0.23 0.13 0.24
L. idas TC 1.45 0.256 0.08 0.24 0.03 0.27 YG 3.10 0.042 0.40A 0.20A 0.15B 0.09B
LS 3.69 0.020 0.43A 0.13A 0.14B 0.21A
311 312

References 312 S1. D. M. Hillis, B. K. Mable, A. Larson, S. K. Davis, E. A. Zimmer, in Molecular 313
Systematics. D. M. Hillis, C. Moritz, B. K. Mable, Eds. (Sinauer, Sunderland, 314 MA, 1996) pp. 321-381. 315
S2. M. I. Brookes et al., Conservation Biology 11, 648-661 (1997). 316 S3. C. Simon et al., Annals of the Entomological Society of America 87, 651-701. (1994). 317 S4. M. S. Caterino, F. A. H. Sperling, Molecular Phylogenetics and Evolution 11, 122-318
137. (1999). 319 S5. D. Posada K. A. Crandall, Bioinformatics 14, 817-818 (1998). 320 S6. J. P. Huelsenbeck, F. Ronquist, Bioinformatics 17, 754-755 (Aug, 2001). 321 S7. D. L. Swofford. (Sinauer, Sunderland, MA., 2002). 322 S8. Z. Gompert, C. C. Nice, J. A. Fordyce, M. L. Forister, A. M. Shapiro, Molecular 323
Ecology 15, 1759-1768 (Jun, 2006). 324 S9. W. B. Jennings, S. V. Edwards, Evolution 59, 2033-2047 (Sep, 2005). 325 S10. N. Anthony, G. Gelembiuk, D. Raterman, C. Nice, R. ffrench-Constant, Hereditas 326
134, 271-273 (2001). 327 S11. M. Clement, D. Posada, K. A. Crandall, Molecular Ecology 9, 1657-1660 (2000). 328 S12. A. R. Templeton, K. A. Crandall, C. F. Sing, Genetics 132, 619-633 (1992). 329 S13. J. K. Pritchard, M. Stephens, P. Donnelly, Genetics 155, 945-959 (Jun, 2000). 330 S14. G. Evanno, S. Regnaut, J. Goudet, Molecular Ecology 14, 2611-2620 (Jul, 2005). 331 S15. S. Schneider, J. M. Kueffer, D. Roessli, L. Excoffier. (Genetics and Biometry 332
Laboratory, Dept. of Anthropology and Ecology, Univ. Geneva, Geneva, 2000). 333 S16. M. Raymond, F. Rousset, Evolution 49, 1280-1283. (1995). 334 S17. M. D. Moran, Oikos 100, 403-405 (Feb, 2003). 335 S18. J. Goudet, Journal of Heredity 86, 485-486 (Nov-Dec, 1995). 336 S19. F. C. Yeh, T. J. B. Boyle, Belgian Journal of Botany 129, 157 (1997). 337 S20. B. S. Weir, Biometrics 35, 235-254 (1979). 338 S21. E. C. Anderson, E. A. Thompson, Genetics 160, 1217-1229 (Mar, 2002). 339 S22. R. C. Griffiths, S. Tavare, Theoretical Population Biology 46, 131-159 (Oct, 1994). 340 S23. M. K. Kuhner, J. Yamato, J. Felsenstein, Genetics 140, 1421-1430 (Aug, 1995). 341 S24. A. V. Z. Brower, Proceedings of the National Academy of Sciences of the United 342
States of America 91, 6491-6495 (Jul 5, 1994). 343 S25. E. V. Zakharov, M. S. Caterino, F. A. H. Sperling, Systematic Biology 53, 193-215 344
(Apr, 2004). 345 S26. B. Rannala, Z. H. Yang, Genetics 164, 1645-1656 (Aug, 2003). 346 S27. W. J. Conover, Practical nonparametric statistics (John Wiley and Sons, New York, 347
1999). 348 S28. C. Potvin, D. A. Roff, Ecology (Washington D C) 74, 1617-1628. (1993). 349 350