Embed Size (px)
Citation preview

www.sciencemag.org/cgi/content/full/331/6020/1081/DC1
Supporting Online Material for
Translation-Independent Localization of mRNA in E. coli
Keren Nevo-Dinur, Anat Nussbaum-Shochat, Sigal Ben-Yehuda, Orna Amster-Choder*
*To whom correspondence should be addressed. E-mail: [email protected]
Published 25 February 2011, Science 331, 1081 (2011)
DOI: 10.1126/science.1195691
This PDF file includes:
Materials and Methods Figs. S1 to S18 Table S1 References

Translation-independent localization of mRNA in E. coli Keren Nevo-Dinur, Anat Nussbaum-Shochat, Sigal Ben-Yehuda and Orna Amster-Choder
Supporting online material: Materials and Methods Bacterial strains and growth media
The following E. coli K12 strains were used: MA110, a Δbgl strain (1), was used for cell
fractionation and the detection of mRNA transcripts in the different fractions using RT-PCR.
MG1655 was used for fluorescence microscopy. BL21(DE3), obtained from Novagen, and K38
(HfrC trpR thi λ+), obtained from C. Richardson, were used for metabolic labelling of proteins
with [35S]methionine. MA152, a Δbgl strain that carries a bgl-lacZ fusion (1), and HB101 (lacY-
lacZ+) (2), were used for complementation analyses. KD1, an MA10 (1) derivative, carries the cat
gene preceded by 6xbs instead of the chromosomal bglF gene. ANS1, another MA10 (1)
derivative, has the 6xbs at the 5' UTR of chromosomal bglF gene. The two last strains were
constructed using phage lambda Red recombinase, as described by Wanner & Datsenko (3).
Briefly, MA10 was transformed with pKD46, which encodes lambda Red recombinase. For KD1,
cat6xbs was amplified by PCR from pZE12-cat6xbs, using primers that contained homology to the
end of the bglG gene and the junction between bglF and bglB. To construct ANS1, which contains
the 6xbs in the 5'UTR of bglF, the 6xbs-cat region was amplified with primers that contained
homology to end of the bglF gene and the beginning of the bglB gene. The resulting fragments
were introduced into the pKD46-containing MA10 strain by electroporation, and chloramphenicol-
resistant colonies were isolated. Colonies not containing PKD46 were isolated after growth at an
elevated temperature (3) . LB medium and M63 salts minimal media were prepared essentially as
described by Miller (2). MacConkey plates supplemented with different carbon sources were
prepared from MacConkey agar (Difco).
Plasmids
All plasmids used in this study and the proteins they encode are listed in Table S1.
Plasmids used for the fluorescence microscopy: pZE126xbs was constructed by cleaving pSL-
MS2 6 with EcoRI and PmlI and ligating the fragment that contains the 6xbs into pZE12luc (4),
which was cleaved with EcoRI and HincII. pZE12-lacY6xbs was constructed by amplifying lacY
from pT7-5/lacy (5), with primers that introduced BglII and NsiI sites. The PCR fragment was
ligated to pZE126xbs, which was cleaved with the same enzymes.
pZE12-catx6 was constructed by cleaving pZA31-luc (4) with AseI and MslI and ligating the
fragment containing the cat gene to pZE126xbs which was cleaved with HpaI and NdeI .
pKD255F6xbs was constructed in four steps. First, pKD18F was constructed by amplifying a
1014 bp fragment, which initiates from the AflII site in bglG and ends at the StuI site in bglF, by
PCR from the plasmid pAR18 (1) with primers that introduced a SmaI site between the terminator
that precedes bglF and the ribosome-binding site (RBS) of bglF. The fragment was ligated to

pAR18, which was cleaved with AflII and StuI. Second, pLF255 was constructed by amplifying a
2473 bp fragment from pSAL6 (1), which contains 'bglG from the HindIII site, blgF and blgB'
until the ClaI site (Liat fux and Amster-Choder, unpublished). The fragment was ligated to pMN25
(1) which was cleaved by HindIII and ClaI. Third, pKD255 was constructed by exchanging the
AflII-StuI fragment in pLF255 with the equivalent fragment, which contains the SmaI site from
pKD18F. Finally, pKD255F6xbs was constructed by amplifying a 400 bp fragment, which contains
six MS2 binding sites (6xbs) from pSL-MS2 6 (6), with primers that introduced EcoRV sites on
both ends of the fragment. The fragment was ligated to pKD255, which was cleavage with SmaI.
pKD56xbs was constructed by exchanging the smaller HindIII-StuI fragment in pMN5 (1)
with the equivalent fragment, which contains the 6xbs from pKD255Fx6. pKD1F6xbs was
constructed by exchanging the smaller BamHI-StuI fragment in p1H (1) with the equivalent
fragment, which contains the 6xbs from pKD56xbs.
pZE12B6xbs was constructed by amplifying bglB with its RBS from pAR7 (1) with primers
that introduced a BglII site at the beginning. The fragment was ligated to pZE126xbs which was
cleaved by BglII and NruI.
pZE12FB6xbs was constructed by amplifying bglF with its RBS from ANS1 with primers that
introduced a EcoRI site and PspOM1. The fragment was ligated to pZE12B6xbs which was cleaved
by the same enzymes.
pKD255G6xbs and pKD256xbs were constructed in four steps. First, pNG184 was constructed
by cleaving pACYC184 (7) by HincII and ligating the 3179 bp fragment. Second, pNG185 was
constructed by amplifying a fragment of 370 bp from pAR7 with primer that introduced XbaI
instead of HinfI and HindIII instead of AflII and added a PmlI site before the terminator that
precedes bglG. The PCR fragment was ligated to pNG184, which was cleaved with the same
enzymes, to form pNG185. Third, a fragment of 397 bp, which contains the 6xbs, was amplified
by PCR from pSL-MS2 6 (6) with primers that replaced the EcoRI cleavage site with EcoRV
cleavage site. The PCR fragment was ligated to pNG185, which was cleaved with PmlI to form
pKD185G'6xbs. Finally, a fragment of 1067 bp, which includes part of the Pbgl and part of bglG, was
amplified from pKD185G'6xbs, and was cleaved by BssHII. The PCR fragment was ligated to either
pLF255 or pMN25 (1), which were cleaved with the same enzyme, to form pKD255G6xbs or
pKD256xbs, respectively.
pKD255leu6xbs was constructed by PCR amplification of a 700 pb fragment from pKD56xbs,
which contains the 6xbs and part of bglF, using primers that introducing 12 consecutive CUA
leucine codons instead of residues 15-23. The fragment was cleaved with PspOMI and StuI and
ligated to pKD255F6xbs, which was cleaved with the same enzymes. pKDGIIB6xbs and pKDGIIC6xbs were constructed amplifying two truncated bglF alleles that
express the IIBbgl or the IICbgl domain, respectively, each preceded by an RBS and an initiation

codon and ending with a stop codon, from pTQD-F3 and pTQD-F4 (9), respectively. The
fragments were amplified with primers that introduced BglII and EcoRI sites and were ligated to
pKD255F6xbs, which was cleaved with BglII and EcoRI., thus replacing the bglF gene with the
IIBbgl or the IICbgl domain-encoding sequences.
pKD5B226xbs was constructed by amplifying a 260 bp fragment, which initiates from the StuI
site in bglF and ends at the SacII site in bglF, by PCR from pT7GM-B22, which was obtained in
the genetic screen described in (10) and encodes the N-terminal 67 residues of BglF, and ligating
the amplified fragment to pKD56xbs. pKDGB226xbs was constructed by cleaving pKD5B226xbs with
BglII and EcoRI and ligating the 2000 bp fragment into pKD255F6xbs which was cleaved by BglII
and EcoRI.
pZE12F6xbs was constructed in two steps: First, pKD186xbs was constructed by replacing the
1,019 bp AflII-StuI in pAR18 with the 1,419 bp AflII-StuI fragment from pKD255F6xbs which
contains the 6xbp sequence. Second, a 2,300 bp BamHI fragment from pKD186xbs was ligated to
pZE126xbs which was cleaved with BamHI and BglII to form pZE12F6xbs.
pZE12F6xbsG160R was constructed by replacing the StuI-EcoRI bglF fragment in pZE12F6xbs
with the equivalent fragment from pT7GM-G160R (10).
pZE12F6xbsTMI-II was constructed by two steps. First, a 350 bp fragment that initiates at the
StuI site in bglF was amplified with primers that introduced a TAA stop codon, instead of codon
161 (Y161Stop), and an EcoRI site at the end. The fragment was ligated to pKD255F6xbs that was
cleaved with StuI and EcoRI. Second, the PspOMI-StuI from the plasmid that was generated in the
first step was ligated to pZE12F6xbs, which was cleaved with the same enzymes.
pANS25cat6xbs was constructed by amplifying a 2,000 bp AflII-PvuII fragment from KD1
and ligating it to pMN25 which was cleaved with AflII and ScaI.
pKD255FM1I6xbs was constructed by amplifying a 1,600 bp AflII-StuI fragment from
pKD255F6xbx with primer that replaced the ATG (first Methionine) by ATC (Isoleucine) and
ligating it to pKD255F6xbx which was cleaved with AflII and StuI.
pZE12rho16xbs WAS constructed by amplifying a fragment of 750 bp from pACYC728 Dm-
Rho1 (a gift from E. Bibi), which encodes six out of the seven transmembrane helices of
Rhomboid 1 protein from Drosophila melanogaster. The amplified fragment was cleaved by BglII
and NotI and ligated to pZE126xbs which was cleaved with the same enzymes, thus generating a
plasmid that encodes Rhomboid 1 transcripts that are tagged with the 6xbs.
pKD255F6xbs-mCherry was constructed in four steps: First, to construct pZLF, which
expresses bglF under the control of the PLtetO-1 promoter, a 1656 bp HpaI-BamHI fragment from
pT7OAC-F was ligated to the 4511 bp HpaI-BamHI fragment of pZS*-2tet-Ffh (11), Second,
pZLFS1, a pZLF derivate that lacks the stop-codon of bglF, was constructed by amplifying bglF
by PCR from pZLF using primers that interduced an MluI site instead of the stop codon of bglF.

The 1000 bp PCR fragment was cleaved with BglI and MluI. The resulting 878 bp fragment was
ligated to pZLF, which was cleaved with BglI and MluI to form pZLFS1. Third, the mCherry gene
was amplified from pRSET-B-mCherry (obtained from Roger Y. Tsien) with primers that
introduced a linker encoding three alanines at the 3' end of the mCherry gene and MluI sites at
both ends of the fragment. The MluI-cleaved fragment was ligated to pZLFS1, which was cleaved
by MluI, to form pZLFS1-mCherry. Finally, to construct a bglF6xbs -mCherry fusion, a 2000 bp
fragment, which contains the end of the bglF gene and mCherry was amplified by PCR from
pZLFS1-mCherry with primers that introduced an EcoRI site at the 5' end. After cleaving the
fragment with EcoRI and SacII, it was ligated to pKD255F6xbs that was cleaved with the same
enzymes to form pKD255F6xbs-mCherry.
pZE12IIB6xbs-mCherry was constructed in two steps: First, pANS255IIB6xbs-mCherry was
constructed by amplifying a 550 bp fragment from pKD255F6xbs, which includes the six binding
sites and the sequence encoding the B domain of BglF (IIB); the primer at the end of IIB
introduced an MluI site. The fragment was cleaved with PspOMI and MluI and was cloned instead
of the 2,300 bp PspOMI-MluI in pKD255F6xbs-mCherry. Second, a 650 bp PspOMI-ZraI fragment
from pANS255IIB6xbs-mCherry was ligated to pZE126xbs, which was cleaved with PspOMI and
StuI to form pZE12IIB6xbs-mCherry.
pANS25mCherry6xbs was constructed by amplifying a 720 bp fragment encoding mCherry
from pRSET-B-mCherry with primers that introduced BglII and EcoRI sites, and ligated to
pKD255F6xbs-mCherry which was cleaved with the same enzymes.
Construction of a plasmid pZA25-GFP, which encodes the coat protein of phage MS2 fused
to GFP (MS2-GFP) was carried out in a three steps: First, pBAD18 (12), was cleaved with EcoRI
and EcoRV. A fragment containing the ara promoter was ligated to pZA24 (4), which was cleaved
by EcorI and ZraI, to yield the plasmid pZA25. Second, pKD31GFP was constructed by cleaving
pIG-K133 (13), with AatII and XbaI and cloning the 1700 bp fragment into pZA31-luc (4).
Finally, pZA25-GFP was constructed by cleaving a 1200 bp fragment from pKD31GFP with AvrII
and KpnI and ligating it into pZA25, which was cleaved with the same enzymes.
Plasmids used for the detection of transcripts by RT-PCR following cell fractionation: p1H,
pMN5, pAR7 (1), pZGM-B (10), pT7-5/lacY and pT7-5/cat (5), pLF255, pKDGIIB6xbs,
pKDGB226xbs, and pKD5B226xbs
Plasmids used for metabolic labeling of proteins with [35S]methionine: pT7CQ-F3 (9),
pT7OAC-F (14), and pT7GM-K93R (10), pANSH-PRD1 (22), pKDM1I and pKD7leu. pKDM1I
was constructed by amplifying a 800 bp HindIII-StuI fragment from pT7OAC-F with primers that
replaced the ATG (first Methionine) by ATC (Isoleucine) and ligating it to pT7OAC-F which was
cleaved with HindIII and StuI.

pKD7leu was constructed by PCR amplification of the 225 pb NheI-StuI bglF segment from
pET15F (8), using primers that introducing 12 consecutive CUA leucine codons instead of residues
15-23. The fragment was cleaved with. The fragment was cleaved with NheI and StuI and was
ligated to pET15F.
pET15F (8) was used for western blot analysis.
Functionality of the 6xbs-tagged plasmid-encoded proteins was tested as following.
Production of LacY was confirmed by growth of red colonies when HB101, transformed with
pZE12-lacY6xbs, was plated on MacConkey-lactose plates. Production of chloramphenicol
acetyltransferase, expressed by the cat gene cloned in pZE12catx6, was confirmed by resistance to
chloramphenicol. The activity of the different plasmid-encoded BglF6xbs variants as sugar
phosphotransferases was indicated by their ability to complement MA110 Δbgl cells, which were
transformed with the respective plasmids, and enable growth of red-brown colonies on
MacConkey-arbutin plates. In the case of pKD1F6xbs and pZE12FB6xbs, which code for both BglF
and BglB, the ability to form red colonies on MacConkey-salicin plates was also tested. The ability
of the plasmid-encoded BglF variants to regulate BglG was tested by their ability to complement
MA200, which is ΔbglF and carries a chromosomal bgl-lacZ fusion (1). This was indicated by the
formation of red or white colonies on MacConkey-lactose plates containing or lacking a β-
glucoside inducer, respectively. The activity of the plasmid-encoded BglG proteins was indicated
by the generation of red colonies when plating MA152 transformed with the bglG-containing
plasmids on MacConkey-lactose plates. Production of functional BglB, expressed from pZE12Bx6,
was confirmed by the formation of red colonies when growing MA110 transformed with this
plasmid and with pZLF on MacConkey-salicin plates.
Fluorescence microscopy of live cells
MG1655, KD1 and ANS1 were transformed with the indicated plasmids. Cells were grown
to early log phase at 30OC in either LB or M63 minimal medium containing 0.4% succinate as a
carbon source and the appropriate antibiotics. Expression of the 6xbs-containing transcripts from
Plac in pZE12 derivatives was not induced, except for expression of bglB from pZE12B6xbs and
from pZE12FB6xbs, which was induced by IPTG that has been added to a final concentration of 5
mM or 1 mM, respectively, for 1.5 h. Expression of the 6xbs-containing transcripts from Pbgl was
induced by adding 0.4% arbutin, only when intact bglG and bglF were present. In all other cases,
expression from Pbgl was not induced. The MS2-GFP protein was induced by adding 0.05-0.4%
arabinose for 0.5h-2h. Translation and transcription were inhibited by the addition of kasugamycin,
chloramphenicol and/or rifampicin for the last 10 minutes of growth to a final concentration of 10
mg/ml, 250 μg/ml and 2 mg/ml, respectively.
Fluorescence microscopy was carried out as described previously (15). In brief, samples (0.5
ml) of culture were removed, gently centrifuged, and resuspended in 5 μl of PBS X1 (Phosphate-

Buffered Saline). When indicated, samples were supplemented with the fluorescent membrane
stain FM4-64 at 1 μg/ml or with the DNA stain 4,6-Diamidino-2-phenylindole (DAPI) at 2 μg/ml.
Cells were visualized and photographed using an Axioplan2 microscope (Zeiss) equipped with a
CoolSnap HQ camera (Photometrics, Roper Scientific). System control and image processing were
performed using MetaMorph software (Molecular Devices). The fluorescent signals were two-
dimensionally deconvolved.
Fluorescence in situ hybridization (FISH)
The following protocol was used to detect transcripts by FISH: 5 ml of ANS1, KD1 or
MA110 (Δbgl) cells were grown to early log phase at 30OC in LB containing 0.4% arbiutin. The
cells were crosslinked by incubating them with formaldehyde, at a final concentration of 3.7%-4%,
for 15 min at RT followed by additional 15 min incubation on ice. The samples were spun down at
4,000 rpm for 7 min, resuspended in 0.5 ml of 1xPBS. The PBS and all solutions used henceforth
were prepared with diethyl pyrocarbonate (DEPC)-treated water. Cells were incubated for 5 min at
RT and spun down at 4,000 rpm for 7 min. The washing procedure was repeated three times, and
then the cell pellets were resuspended in 100μl of 1xPBS. Lysozyme, at a final concentration of
20μg/ml was added to the cells suspension. The mixture was immediately placed onto poly-l-
lysine-coated multi-well slides, and incubated for 1min at RT. The cells were washed three times
with 20 μl of 1xPBS for 5 min at RT. The slides were then washed with 80% methanol for 5 min
and subsequently with −20 °C-cold acetone for 30 sec. Excess of liquid was removed and the
slides were air dried for 5 min at 37 °C. The slides were washed with 50% cold ethanol for 2 min.
Once again, excess of liquid was removed and the slides were left to dry for 5 min at 37 °C. Pre-
hybridization was carried out as following: The slides were washed twice with 2xSSCT (0.03 M
sodium citrate, 0.03 M NaCl and 0.1% triton X-100) for 5 min at RT, and once with 2xSSCT
containing 50% formamide for 30 min at 37 ºC. For the hybridization step, 1.5 µl of Alexa488-
labeled probe and 15 µl hybridization buffer (3xSSC, 50% fromamide, 10% dextran sulphate and
40 U RNase inhibitor) were added to each well. The slides were incubated at 94ºC for 2 min,
followed by an overnight .incubation at 55 ºC in the dark. Slides were washed twice with 2xSSCT
containing 50% formamide for 15 min at 37 ºC, once with 2xSSCT containing 25% formamide for
10 min at RT, and once with PBS at RT. A second crosslinking step was carried out by the
addition of 20μl of 3.7% formaldehyde in 1xPBS. Following 30 min incubation at RT, the cells
were washed once with PBS and once with 80% methanol for 1 min at RT. The slides were then
washed three times with PBS for 5min at RT and air dried at RT. Finally, 15 μl of 1xPBS, 1 μl
DAPI (1.5 μg/ml, Invitrogen) were added to each well and the slides were covered. Cells were
visualized shortly after preparing the slides and photographed as described above.
Preparation of labeled RNA probes for FISH
Step 1: DNA templates, to be used in the subsequent transcription step, were prepared by
PCR amplification of the 6xbs region from KD1 chromosome, using the Dream taq green master
mix (Fermentas) according to manufacture's instructions. The following pair of primers, the first
containing the T7 promoter at its 5' end, were used to amplify a sequence that codes for the 6xbs
transcript:
TCTGAGTAATACGACTCACTATAGGGTGTCCACCATGGATCGATCGCGCGCAGATCTA
and ATGGGACGTCGACCTGAGGT
Another pair of primers, the first containing the T7 promoter, were used to amplify the
sequence that codes for the antisense 6xbs mRNA (to be used for the FISH negative control):
TCTGAGTAATACGACTCACTATAGGGTGTCCACCATGGATGGGACGTCGACCTGAGGT
and ATCGATCGCGCGCAGATCTA
After an initial denaturation step of 5 min at 94°C, the thermal cycling parameters were 94°C
for 30 sec, 55°C for 30 sec and 72°C for 1 min. A total of 32 amplification cycles were used to
generate the T7 promoter-containing amplicons. The PCR products were purified using the Qiagen
gel extraction kit.
Step 2: Fluorescently-labeled polyribonucleotide probes were generated by transcribing the
PCR amplicons, which contain the T7 RNA polymerase promoter at their 5' end, using the
following protocol that has been modified from Chee et al. (16). DEPC-treated water and
precautions for eliminating potential RNase contaminations were used throughout the procedure.
To generate fluorescein-containing transcripts, transcription reaction mixtures (15 µl total volume)
that contained T7 RNA polymerase (Invitrogen) were prepared according to manufacturer's
instructions, except for the following changes: 2/3 mM ATP, 2/3 mM GTP, 0. 5 mM UTP, 2/3 mM
CTP, 1 mM ChromaTide UTP (Alexa-488-labeled; Molecular probes), 2 µl of DNA template (T7
promoter-containing amplicons, see above) and 0.5 µl of RR1 RNase inhibitor (Takara).
Transcription products were treated with 1ug/µl RQI DNase (Promega) for 15 min, and the
reaction was ended by the addition of 2 µl RQI stop solution. The fluorescent probes were purified
using Centri-Sep columns (Princeton Separations) according to the manufacturer's instructions.
Cell Fractionation, RNA purification and RT-PCR
MA110 cells containing the indicated plasmids were grown in M63 minimal medium
containing 200 μg/ml ampicillin at 37°C. When the cells reached optical density of 0.2 at 600 nm,
either Isopropyl-β-D-thiogalactopyranoside (IPTG) was added to a final concentration of 0.5 mM
to induce expression of lacY from pT7-5/lacY, or 100 ng anhydrotetracycline hydrochloride were
added to induce expression of bglB from pZGM-B, or arbutin was added to a final concentration of
0.4% induce expression of bgl transcript from plasmids pLF255 and pAR7. Expression of bgl and

cat transcripts from p1H, pMN5, pT7-5/cat, pKDGIICx6, pKDGIIBx6 and pKDGB22x6 was not
induced. Growth was continued till an optical density of 0.6 at 600 nm.
Cell fractionation and membrane floatation were carried out essentially as described before
(11), except for the following changes. Pelleted cells were resuspended in PBS buffer (80 mM
disodium phosphate Na2HPO4, 20 mM NaH2PO4, 100mM NaCl), supplemented with 10 μg/ml
DNase and 2.5 µl/ml RNasine. Cells were broken by passing the suspension three times through a
French pressure cell at 12,000 lb/in2. Aliquates were placed on a sucrose gradient that contained
2.5µl/ml RNasine. To verify the success of the fractionation, we analyzed the separated fractions
by Western blotting (17), using either anti-His antiserum (New England Biolabs) for the detection
of His-tagged BglF or antibodies against SSB (single-stranded DNA-binding), as shown in Fig. S7.
RNA was extracted from the different fractions using the Tri-Reagent kit (Sigma) according
to manufacturer's instructions. To optimize the yield of RNA, 5 μl of 35mg/ml glycogen (Sigma)
were added before isopropanol precipitation. Each RNA preparation was dissolved in 20 μl RNase-
free water. The concentration and purity of the RNA from the different samples was determined
using the NanoDrop ND-1000 spectrophotometer. The RNA samples were treated with the RQ1
RNase-free DNase according to the manufacturer's instructions (Promega). To check for DNA
contamination, 2 μl of RNA from each preparation were amplified by PCR with Qiagen Taq DNA
polymerase, using two primer sets for each gene in separate reactions. RT-PCR was carried out
with the 1 step RT-PCR kit (Qiagen) according to manufacturer's instructions. The thermocycle
format used for the RT-PCR was as follows: One cycle of reverse transcription at 50ºC for 40min,
followed by activation of the HotStarTaq DNA polymerase at 95ºC for 15 min; 24-32
amplification cycles with denaturation for 1 min at 94ºC, annealing for 30sec at 50ºC, and
extension for 2 min at 72ºC; and a final cycle of incubation at 72ºC for 10 min. The amplification
products were analyzed by electrophoresis in 1.8% agarose gels and visualized under UV
illumination after staining with ethidium bromide.
Isolation of RNA and Real time PCR
MG1655 cells containing pKD255F6xbs were grown in LB with 0.4% arbutin to an optical
density of 0.18 at 600 nm. Rifampicin (400 μg/ml) was then added without or with
chloramphenicol (250 µg/ml) for 12 min. Samples of 40ml were removed every 3 minutes after the
addition of rifampicin. RNA was purified from each sample by the Tri-Reagent kit (Sigma). Each
RNA preparation was dissolved in 22 μl RNase-free water. The concentration and purity of the
RNA from the different samples were determined using a NanoDrop machine (NanoDrop
Technologies). DNA was removed by DNase treatment according to the manufacturer's instructions
(RQ1 RNase free DNase, Promega). To check for DNA contamination, 2 μl from each RNA
preparation were amplified by PCR with Qiagen Taq DNA polymerase, using bglF primers. About
600ng DNA-free total RNA was used for cDNA synthesis using Verso cDNA kit (Thermo

Scientific), according to the manufacturer's protocol. Quantification of cDNA was performed by
real-time PCR using SYBR-green mix (Absolute blue SYBR ROX MIX, Thermo scientific) with
Rotor gene 3000 A (Corbett) according to manufacturer's instructions. Specific primer pairs were
designed according to the Guidelines for Amplicon and Primer Design
(http://www.tamar.co.il/site/index.php?ln=en&main_id=1). The level of 16S rRNA (rrsA) was used
to normalize the expression data for each target gene. The relative amount of cDNA was calculated
using the standard curve method. A standard curve was obtained from PCR on serially diluted
cDNA as templates and was analyzed using Rotor-gene analysis software 6.0. The corrected values
were plotted as percent of the initial value versus time and fitted using an exponential function:
I = I0 exp(−kt ), where I0 is the initial percent of mRNA concentration (100%), and k is the decay
coefficient. The calculated decay coefficients k for blgGF6xbs mRNA extracted from cells treated or
not treated with chloramphenicol were 0.453 and 0.527, respectively, with R-squared values of
0.962 and 0.987. The half-lives calculated using these decay coefficients in the following equation
t1/2 = ln(2)/k were 1.3 min and 1.5 min, respectively.
[35S]Methionine-labeling of BglF derivative and SDS-PAGE.
E. coli K38 cells containing pGP1-2, which encodes the heat-inducible T7 RNA polymerase
gene, and a second plasmid carrying the bglF gene or its derivatives under the control of the phage
T7 promoter (pT7OAC-F, pT7CQ-F3, pT7GM-B22) were grown in minimal medium. Expression
of the T7 RNA polymerase, and hence of the BglF derivatives, was induced and the newly made
proteins were labeled with [35S]methionine in the presence of rifampicin (Sigma) as described
previously (14). Chlromphenicol (250μg/ml) or Kasugamycin (10 mg/ml) were added 8 minutes
before labeling with [35S] methionine. E. coli BL21(DE3) containing either pKD7leu or pANSH-
PRDI were grown in minimal medium at 37°C to OD600=0.3. Expression of the T7 RNA
polymerase, and hence of the proteins cloned downstream to the T7 promoter, was induced by the
addition of 50 mM IPTG, and the newly made proteins were labeled with 5 µl [35S]methionine in
the presence of rifampicin (Sigma) for 30 min. The labeled proteins were separated on 7.5% SDS-
polyacrylamide gels or on tricine−SDS−polyacrylamide gels (18). After electrophoresis, gels were
dried and exposed to Kodak XAR-5 X-ray film.
Western blot analysis
Proteins were separated by SDS-PAGE with the following concentration polyacrylamide:
7.5% to detect His-BglF, and 12.5% to detect SSB or MS2-GFP. Purified GFP (prepared in S. Ben
Yehuda’s lab) was used to estimate the amount of MS2-GFP. Purified SSB was obtained from Z.
Livne. Samples were fractionated next to Precision plus protein standards marker (Bio Rad). Gels
were subjected to Western analysis essentially as previously described (19). The following specific
antibodies were used: anti-GFP monoclonal antibodies (BAbCO Inc.) and anti-His monoclonal
antibodies (GE Healthcare) were used under the conditions described previously (20). Anti-SSB

polyclonal antibodies from rabbit (a gift from Z. Livneh) was used as previously described (21)
and detected by goat anti rabbit antibodies. The antibodies-bound proteins were detected by the
enhanced chemiluminescence (ECL) light-based detection procedure (Amersham Pharmacia) and
visualized by the LAS 3000 Luminescent Image Analyzer (FUJI). The intensity of the bands was
quantified using the MetaMorph software (Molecular Devices).

Fig. S1 Production of MS2-GFP protein in E. coli cells
Fig. S1. Detection of the MS2-GFP protein in ANS1 cells. ANS1 cells, which express the MS2-GFP protein from pZA25-GFP and bglF6xbs from their chromosome (lanes 4-5) and the same cells that do not express MS2-GFP (lane 6), were grown till early logarithmic phase under the same conditions as those applied to observe these cells by fluorescence microscopy. Total proteins were extracted, separated by SDS-PAGE and blotted onto a membrane. The membrane was probed with monoclonal anti-GFP antibodies and then with goat anti-mouse antibodies. For details, see Supplementary Material and Methods. Different amounts of purified GFP protein were analyzed alongside. Lanes 1, 2, 3: 0.07 μg , 0.14 μg and 0.007 μg purified GFP, respectively. Lanes 4 and 5: total proteins extracted from 5 ml and 10 ml of cells that express MS2-GFP, respectively. Lane 6: total proteins extracted from 10 ml of cells that do not express MS2-GFP. The results demonstrate that the GFP-tagged MS2 coat protein is stable as a dimer and that the tag is not liberated. The amount of the MS2-GFP protein in the bands was quantified by comparing their intensity to the intensity of the purified GFP bands, the latter containing known amounts of protein, using the MetaMorph software. The values were normalized to the intensity in an area in the gel that lacks detectable bands. After taking into consideration the molecular weight of the tagged protein and the number of molecules per mole, we estimated that there are approx. 100-200 MS2-GFP molecules per cell. Of note, due to the documented all-or-none nature of the arabinose-induced expression from the PBAD promoter in pZA25-GFP (Khlebnikov et al., 2002, J Ind Microbiol Biotechnol 29:34) many cells contain a lower number of molecules, while others have an elevated number.
1 2 3 4 5 6
GFP
MS2-GFP100
7550
37
Translation-independent localization of mRNA in E. coliKeren Nevo-Dinur, Anat Nussbaum-Shochat, Sigal Ben-Yehuda and
Orna Amster-ChoderSupporting online material: Figures

Fig. S2 Subcellular localization of cat transcripts
ba c d
a
a
cb d
b c d
Fig. S2. Fluorescence microscopy images of cells expressing the MS2-GFP protein (green) and cat6xbs transcripts, which were stained with the DNA stain DAPI (blue). (a) phase; (b) GFP fluorescence; (c) DAPI staining; (d) merge of b&c.
a
c
e
b
d
f
Fig. S3 Subcellular localization of 6xbs transcripts
Fig. S3. Fluorescence microscopy images of cells expressing the MS2-GFP protein (green) and pZE126xbs encoding the 6xbs transcripts.
a
c
e
b
d
f

Fig. S4 The cat and lacY transcripts are preferentially present in the cytosolicand membrane cell fractions, respectively
Fig. S4. MA110 cells were grown and fractionated as described in Supplemental Materials and Methods. RNA was purified from the different fractions, followed by cDNA synthesis. The amounts of cat or lacY cDNAs were determined by quantitative real time PCR.
0
20
40
60
80
100
cat
membranecytoplasem
0
20
40
60
80
100
lacy
membranecytoplasem
cat lacYR
elat
ive
% la
cYtr
ansc
ript
s
Rel
ativ
e %
cat
tran
scri
pts
Fig. S5 Validation of the FISH method for the determination of subcellular localization of mRNA
Fig. S5. A. Images of KD1 (a-d) and ANS1 (e-h). The cat6xbs (b) or bglF6xbs (f) transcripts were detected by FISH, as described in Supplemental Data, and DNA was stained with DAPI (c and g). A merge of the two signals is also shown (d and h).B. Visualization of MA110 (Δbgl; a&b) and ANS1 (bgl+; c&d) cells. Phase images are shown in (a) and (c); A FISH image of cells detected after hybridization with Alexa-488-labeled probe that is complementary to the 6xbs mRNA sequence is shown in (b). A FISH image of cells detected after hybridization with Alexa-488-labeled oligonucleotide that is identical in sequence to the 6xbs mRNA sequence is shown in (d).
d
a
c
bba c d
e gf h
A B

Fig. S6 Subcellular localization of the mCherry protein correlates with localization of the transcripts encoding it
a b c
Fig. S6. Images of cells expressing the MS2-GFP protein (green) and bglG-mCherry6xbs bi-cistronictranscripts. Cells were observed with phase microscopy (a); the MS2-GFP and the mCherry proteins were observed by fluorescence microscopy (b and c, respectively). Scale bar corresponds to 1 µm.
Fig. S7 Subcellular localization of bglG-cat6xbx and bglG’6xbx transcripts
Fig. S7. Images of cells expressing the MS2-GFP protein (green) and bglG-cat6xbs bi-cistronictranscripts (a-c) or 6xbs-tagged bglG’ transcripts, which encode the RNA-binding domain of BglG (d-f). The cells shown in d-f were supplemented with the fluorescent membrane stain FM4-64 (red). Shown are: (a and d) phase; (b and e) fluorescence microscopy images; (c and f) overlays of (a) and (b) and of (e) and the FM4-64 staining of the cells, respectively.
a b c
d e f
bglG-cat6xbs
bglG’6xbs
mRNA detected

Fig. S8. Kasugamycin and chloramphenicol completely inhibit translation of bglF transcripts
Fig. S8 Expression of wild-type BglF was induced from pOAC-F in cells that were untreated (lane 1) or treated with either kasugamycin (lane 2) or chlroamphenicol (lane 3) and labeled for 2 min with [35S]methionine, as described in Supporting Materials and Methods. Kasugamycin and chloramphenicolwere added eight minuets before labeling with [35S]methionine at a 10 fold concentration over the routinely used ones. Aliquots were analyzed on 7.5% SDS-polyacrylamide gel. Autoradiograms of the gels are shown. M, Molecular weight markers, shown on the left in kilodaltons.
Fig. S9. Chloramphenicol has no significant effect on the stability of bglF transcripts
Fig. S9. Decay fits of bglF6xbs transcripts after inhibition of transcription in cells treated or not treated with chloramphenicol (CM). Cells expressing bglF6xbs were grown at 30°C to OD600=0.18. Rifampicin (400µg/ml) was then added with (pink) or without (blue) chloramphenicol (250 µg/ml). Samples were collected in 3 min intervals following the addition rifampicin and cDNA was prepared by reverse transcription. The decay fits of the transcripts were obtained by real time PCR and mRNA half lives were calculated as described in Supporting Materials and Methods. The half life of bglF transcripts in the treated and untreated cells were 1.8 nin and 1.6 min, respectively. Notably, the half life of most E. coli mRNAs is between 3-8 min (ref), shorter than the duration of treatment with both antibiotics.
time after rifampicin addition (min)
% b
glF
6xbs
mR
NA
rem
aini
ng
50
75
21 3
BglF
M

dcba
Fig. S10 Localization of bglF transcripts in cells that were treated with an antibiotic that inhibits transcription or with antibiotics that inhibit both
transcription and translation
Fig. S10. Fluorescence microscopy images of cells expressing the MS2-GFP protein (green) and bglG-bglF transcripts not tagged (a) or tagged (b-d) with the 6xbs. The cells were treated with rifampicin (b), with rifampicin and kasugamycin (c) or with rifampicin and chloramphenicol (b) prior to microscopy, as described in Supporting Materials and Methods..
Fig. S11. Polar localization of bglG transcripts is not affected by rigorous treatment with antibiotics that inhibit translation
Fig. S11. (A) Images of cells expressing the MS2-GFP protein (green) and bglG6xbs transcripts (a-h) or cat6xbs transcripts (i-j). The cells were treated for 10 minutes with 250 µg/ml chloramphenicol (a-d) or with 10mg/ml kasugamycin (e-h) prior to microscopy. Before microscopy, cells were supplemented with the fluorescent membrane stain FM4-64 (red) or the DNA stain DAPI (blue). Images shown: phase (a, e and i; grey); GFP fluorescence (b, f and j; green); FM4-64 staining (c and g; red); DAPI staining (k; blue); overlays of (b), (f) and (j) with (c), (g) and (k), respectively (d, h and l).
ba c d
fe g h
ji k l
bglG6xbs
bglG6xbs
cat6xbs
mRNA detected antibiotic
chloramphenicol
kasugamycin
kasugamycin
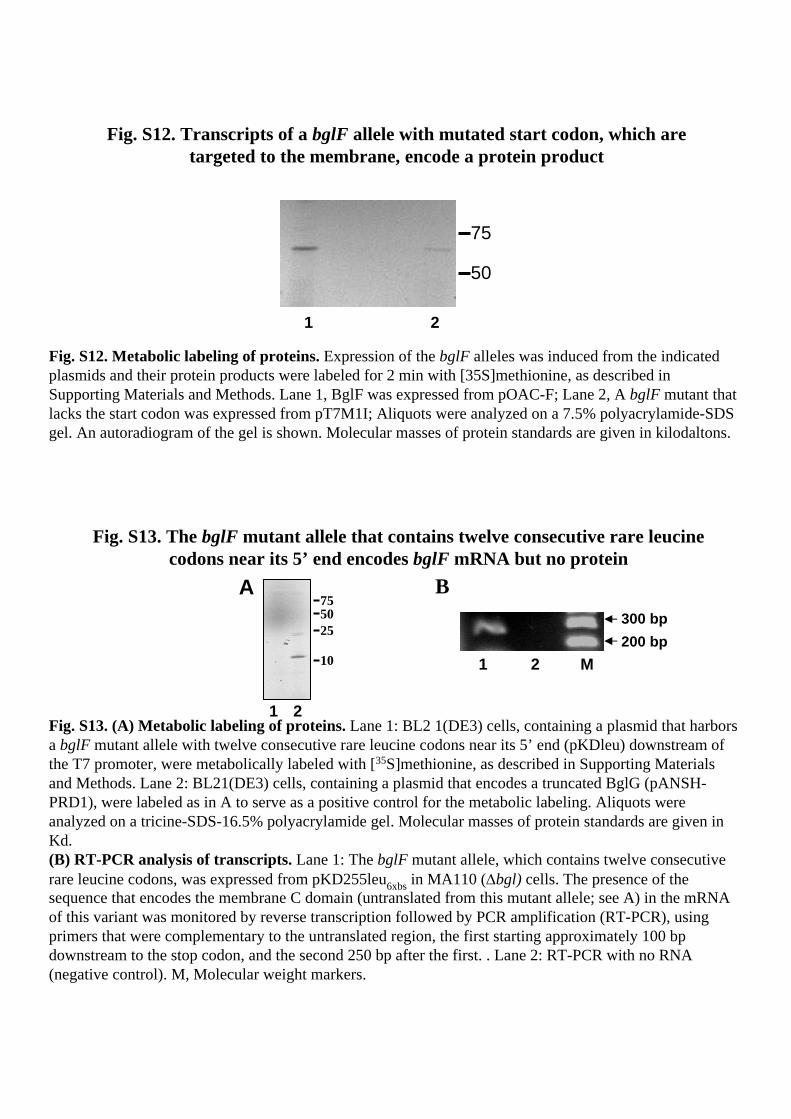
Fig. S13. The bglF mutant allele that contains twelve consecutive rare leucinecodons near its 5’ end encodes bglF mRNA but no protein
1 2
755025
10
A300 bp200 bp
21 M
B
Fig. S13. (A) Metabolic labeling of proteins. Lane 1: BL2 1(DE3) cells, containing a plasmid that harbors a bglF mutant allele with twelve consecutive rare leucine codons near its 5’ end (pKDleu) downstream of the T7 promoter, were metabolically labeled with [35S]methionine, as described in Supporting Materials and Methods. Lane 2: BL21(DE3) cells, containing a plasmid that encodes a truncated BglG (pANSH-PRD1), were labeled as in A to serve as a positive control for the metabolic labeling. Aliquots were analyzed on a tricine-SDS-16.5% polyacrylamide gel. Molecular masses of protein standards are given in Kd. (B) RT-PCR analysis of transcripts. Lane 1: The bglF mutant allele, which contains twelve consecutive rare leucine codons, was expressed from pKD255leu6xbs in MA110 (Δbgl) cells. The presence of the sequence that encodes the membrane C domain (untranslated from this mutant allele; see A) in the mRNA of this variant was monitored by reverse transcription followed by PCR amplification (RT-PCR), using primers that were complementary to the untranslated region, the first starting approximately 100 bpdownstream to the stop codon, and the second 250 bp after the first. . Lane 2: RT-PCR with no RNA (negative control). M, Molecular weight markers.
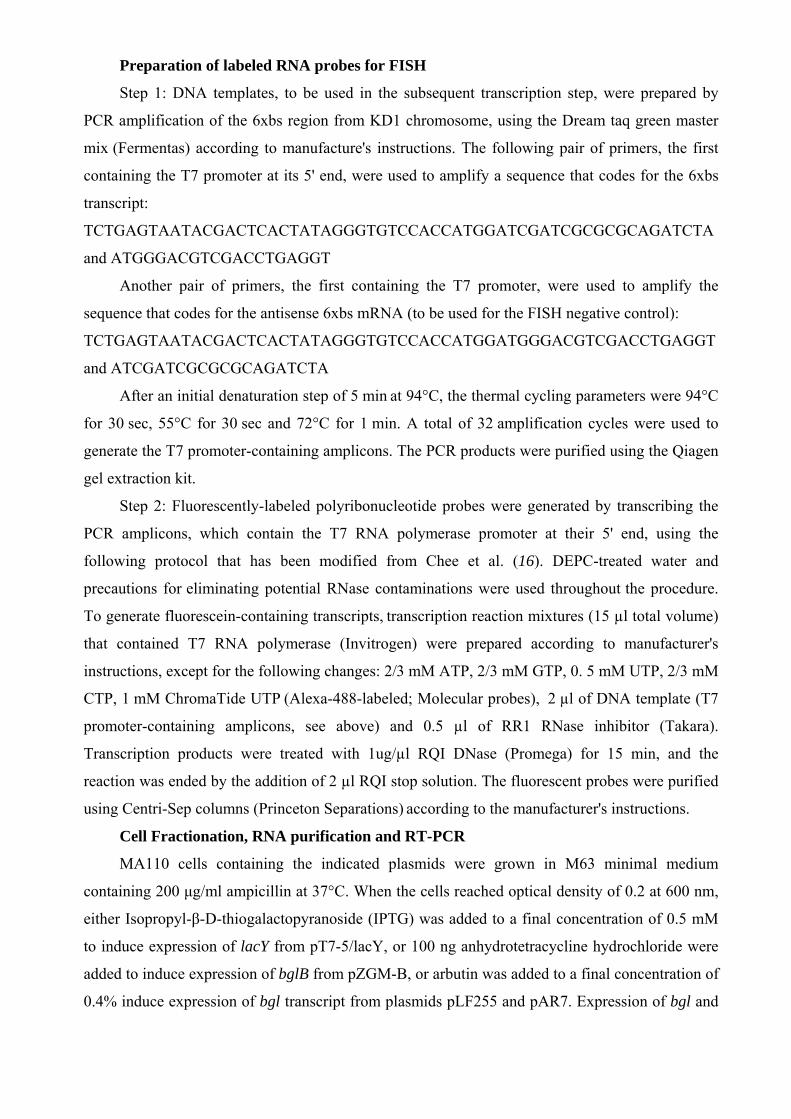
Fig. S12. Transcripts of a bglF allele with mutated start codon, which are targeted to the membrane, encode a protein product
50
75
21
Fig. S12. Metabolic labeling of proteins. Expression of the bglF alleles was induced from the indicated plasmids and their protein products were labeled for 2 min with [35S]methionine, as described in Supporting Materials and Methods. Lane 1, BglF was expressed from pOAC-F; Lane 2, A bglF mutant that lacks the start codon was expressed from pT7M1I; Aliquots were analyzed on a 7.5% polyacrylamide-SDS gel. An autoradiogram of the gel is shown. Molecular masses of protein standards are given in kilodaltons.

Fig. S14. The bglF mutant allele B22 encodes only a truncated B domain of BglF but a full-length bglF transcript
A B
Fig. S14. (A) Metabolic labeling of the translation products of bglF variants with [35S]methionine.Expression of the bglF alleles was induced from the indicated plasmids and their protein products were labeled for 2 min with [35S]methionine, as described in Supporting Materials and Methods. Lane 1, the N-terminal B domain of BglF (77 amino acids) was expressed from pT7CQ-F3; Lane 2, B22, a truncated BglF variant, which contains a stop codon after amino acid 67, was expressed from pT7GM-B22; SDS-PAGE was as in Fig. S12A. Autoradiograms of the gels are shown. Molecular masses of protein standards are given in kilodaltons. (B) RT-PCR analysis of the B22 bglF allele. Lane 1: The bglF mutant allele B22, which harbors a stop codon after codon 67, that is, before the region encoding the hydrophobic C domain, was expressed in MA110 cells that are deleted for the bgl operon. The presence of the sequence that encodes the membrane C domain (untranslated in this variant) in B22 mRNA was monitored by reverse transcription followed by PCR amplification (RT-PCR), as described in Supplemental Materials and Methods, using the primers described in Fig. S12B. Lane 2: RT-PCR with no RNA (negative control). M, Molecular weight markers.
300 bp200 bp
21 M10
15
21
B
B22
a b c
Fig. S15. Subcellular localization of transcripts of Rhomboid 1 from Drosophila melanogaster expressed in E. coli cells
Fig. S15. Phase (a), fluorescence microscopy (b), and an overlay (c) images of E. coli cells expressing the MS2-GFP protein (green) and 6xbs-tagged transcripts, which encode six of the seven transmembrane helices of Rhomboid 1 from Drosophila melanogaster.
Fig. S16 Subcellular localization of bglF(G160R) transcriptsa b
Fig. S16. Phase (a) and fluorescence microscopy images (b) of cells expressing the MS2-GFP protein (green) and 6xbs-tagged bglF(G160R) allele.,
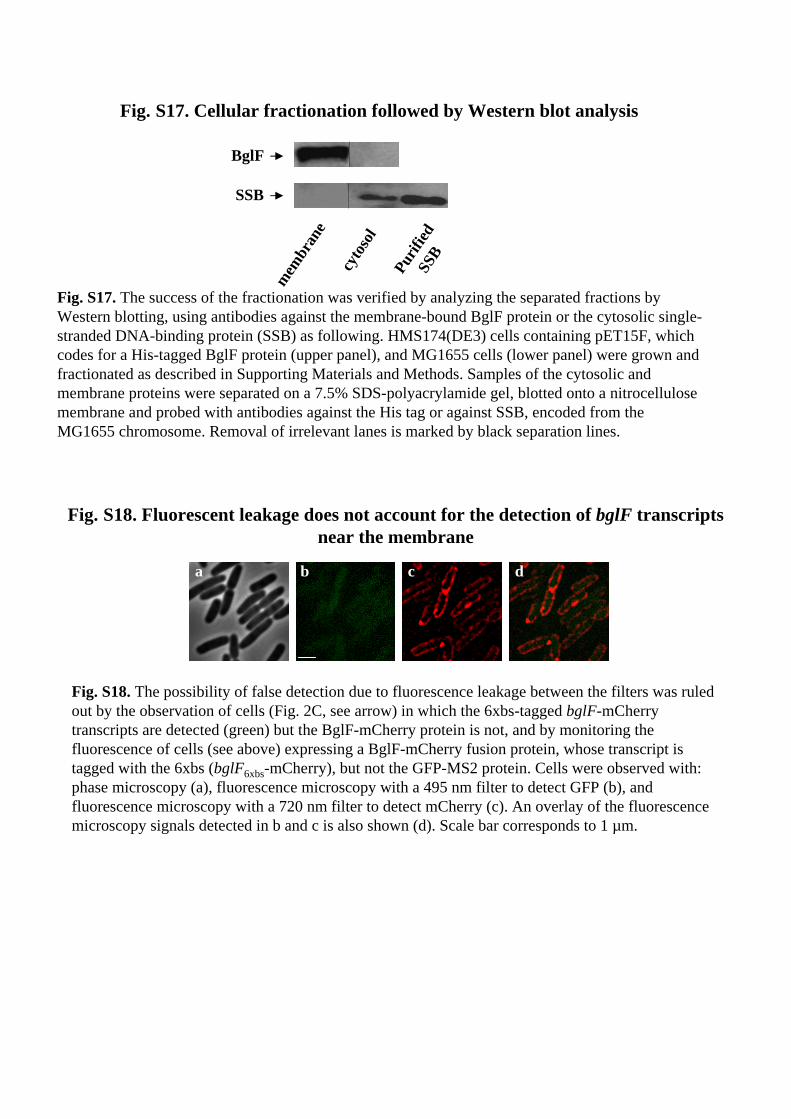
Fig. S17. Cellular fractionation followed by Western blot analysis
mem
bran
e
cyto
sol
BglF
Purif
ied
SSB
SSB
Fig. S17. The success of the fractionation was verified by analyzing the separated fractions by Western blotting, using antibodies against the membrane-bound BglF protein or the cytosolic single-stranded DNA-binding protein (SSB) as following. HMS174(DE3) cells containing pET15F, which codes for a His-tagged BglF protein (upper panel), and MG1655 cells (lower panel) were grown and fractionated as described in Supporting Materials and Methods. Samples of the cytosolic and membrane proteins were separated on a 7.5% SDS-polyacrylamide gel, blotted onto a nitrocellulose membrane and probed with antibodies against the His tag or against SSB, encoded from the MG1655 chromosome. Removal of irrelevant lanes is marked by black separation lines.
ba c d
Fig. S18. Fluorescent leakage does not account for the detection of bglF transcripts near the membrane
Fig. S18. The possibility of false detection due to fluorescence leakage between the filters was ruled out by the observation of cells (Fig. 2C, see arrow) in which the 6xbs-tagged bglF-mCherrytranscripts are detected (green) but the BglF-mCherry protein is not, and by monitoring the fluorescence of cells (see above) expressing a BglF-mCherry fusion protein, whose transcript is tagged with the 6xbs (bglF6xbs-mCherry), but not the GFP-MS2 protein. Cells were observed with: phase microscopy (a), fluorescence microscopy with a 495 nm filter to detect GFP (b), and fluorescence microscopy with a 720 nm filter to detect mCherry (c). An overlay of the fluorescence microscopy signals detected in b and c is also shown (d). Scale bar corresponds to 1 µm.

Table S1. Plasmids used in this study and the proteins they encode
Plasmid Plasmid-encoded relevant transcripts and cis elements2 Source / ref.1
pZE12-luc Plac luciferase (4)
pZE126xbs Plac 6xbs
pT7-5/lacY PT7 lacY (5)
pZE12lacY6xbs Plac lacY6xbs
pT7-5/cat PT7 cat (5)
pZE12cat6xbs Plac cat6xbs
pAR18 Pbgl bglG-bglF (1)
pKD18F Pbgl bglG-bglF
pSAL6 Pbgl bglG-bglF-bglB (1)
pLF255 Pbgl bglG-bglF L. Fux & O.Amster-Choderunpublished
pKD255 Pbgl bglG-bglF
pKD255F6xbs Pbgl bglG-bglF6xbs
pSL-MS2 6 6xbs (6)
pMN5 bglF (1)
pKD56xbs bglF6xbs
p1H bglF-bglB (1)
pKD1F6xbs bglF6xbs -bglB
pAR7 Pbgl bglG-bglF-bglB
pZE12B6xbs Plac bglB6xbs
pZE12FB6xbs Plac bglF- bglB6xbs
pACYC184 vector (7)
pNG184 vector
pNG185 Pbgl bglG'
pKD185G'6xbs Pbgl bglG'6xbs
pKD255Gxbs Pbgl bglG6xbs -bglF
pMN25 Pbgl bglG (1)
pKD256xbs Pbgl bglG6xbs
pKD255leu6xbs Pbgl bglG-bglF6xbs(12 rare leucine codons)
pTQD-F3 PT7 IIBbgl (9)
pTQD-F4 PT7 IICbgl (9)
pKDGIIC6xbs Pbgl bglG- 'bglF'6xbs (IICbgl)
pKDGIIB6xbs Pbgl bglG- bglF'6xbs (IIBbgl)
pT7GM-B22 PT7 bglF' (B22) G. Monderer-Rothkoff & O.Amster-Choder, unpublished
pKDGB226xbs Pbgl bglG- bglF'6xbs (K93R)

Table S1 (cont.)
Plasmid Plasmid-encoded relevant transcripts and cis elements2 Source / ref.1
pKD5B226xbs 'bglG- bglF'6xbs (K93R)
pKD186xbs Pbgl bglG-bglF6xbs
pZE12F6xbs Plac bglF6xbs
pZE12F6xbsTMI-II Plac bglF’6xbs (Y161stop)
pT7GM-G160R PT7 bglF (G160R) (10)
pZE12F6xbsG160R Plac bglF6xbs(G160R)
pANS25cat6xbs Pbgl bglG- cat6xbs
pKD255FM1I6xbs Pbgl bglG- bglF6xbs (AUG to AUC)
pACYC728 Dm-Rho1 Rho1'(truncated Rhomboid 1) E. Bibi
pZE12rho16xbs Plac Rho1'6xbs
pZS*-2tet-Ffh vector (11)
pZLF Ptet bglF
pZLFS1 Ptet bglF' no stop codon
pZLFS1-mCherry Ptet bglF-mCherry
pKD255F6xbs-mCherry Pbgl bglG- bglF 6xbs-mCherry
pANS255IIB6xbs-mCherry Pbgl bglG- IIB6xbs-mCherry
pZE12IIB6xbs-mCherry Plac IIB6xbs-mCherry
pANS25mCherry6xbs Pbgl bglG- mCherry 6xbs
pBAD18 Para MCS2 (12)
pZA24 Plac/ara luciferase (4)
pZA25 Para luciferase
pIG-K133 Ptet MS2-GFP (13)
pZA31-luc Ptet luciferase (4)
pKD31GFP Ptet MS2-GFP
pZA25-GFP Para MS2-GFP
pZGM-B Ptet bglB
pT7OAC-F PT7 bglF (14)
pT7CQ-F3 PT7 bglF'(IIBbgl) (9)
pANSH-PRD1 PT7 bglG' (22)
pKD7M1I PT7 bglF (AUG to AUC)
pKD7leu PT7 bglF (12 rare leucine codons)
pET15F PT7 bglF (8) 1 Plasmids for which no reference has been cited were constructed as part of this work. 2 MCS = Multi Cloning Site.

References 1. S. Mahadevan, A. E. Reynolds, A. Wright, J Bacteriol 169, 2570 (Jun, 1987). 2. J. H. Miller, Experiments in molecular genetics. (Cold Spring Harbor
Laboratory Press, Cold Spring Harbor New York, 1972). 3. K. A. Datsenko, B. L. Wanner, Proc Natl Acad Sci U S A 97, 6640 (Jun 6,
2000). 4. R. Lutz, H. Bujard, Nucleic Acids Res 25, 1203 (Mar 15, 1997). 5. E. Bibi, H. R. Kaback, Proc Natl Acad Sci U S A 87, 4325 (Jun, 1990). 6. E. Bertrand et al., Mol Cell 2, 437 (Oct, 1998). 7. A. C. Chang, S. N. Cohen, J Bacteriol 134, 1141 (Jun, 1978). 8. S. Yagur-Kroll, O. Amster-Choder, J Biol Chem 280, 19306 (May 13, 2005). 9. Q. Chen, O. Amster-Choder, Biochemistry 37, 8714 (Jun 16, 1998). 10. G. Monderer-Rothkoff, O. Amster-Choder, J Bacteriol 189, 8601 (Dec, 2007). 11. A. A. Herskovits, E. Bibi, Proc Natl Acad Sci U S A 97, 4621 (Apr 25, 2000). 12. L. M. Guzman, D. Belin, M. J. Carson, J. Beckwith, J Bacteriol 177, 4121
(Jul, 1995). 13. I. Golding, E. C. Cox, Proc Natl Acad Sci U S A 101, 11310 (Aug 3, 2004). 14. O. Amster-Choder, F. Houman, A. Wright, Cell 58, 847 (Sep 8, 1989). 15. S. Garti-Levi, R. Hazan, J. Kain, M. Fujita, S. Ben-Yehuda, Mol Microbiol 69,
1018 (Aug, 2008). 16. M. Chee et al., Science 274, 610 (Oct 25, 1996). 17. H. Towbin, T. Staehelin, J. Gordon, Proc Natl Acad Sci U S A 76, 4350 (Sep,
1979). 18. H. Schagger, G. von Jagow, Anal Biochem 166, 368 (Nov 1, 1987). 19. A. Nussbaum-Shochat, O. Amster-Choder, Proc Natl Acad Sci U S A 96, 4336
(Apr 13, 1999). 20. L. Lopian, Y. Elisha, A. Nussbaum-Shochat, O. Amster-Choder, EMBO J,
(Oct 5, 2010). 21. G. Arad, A. Hendel, C. Urbanke, U. Curth, Z. Livneh, J Biol Chem 283, 8274
(Mar 28, 2008). 22. L. Fux, A. Nussbaum-Shochat, O. Amster-Choder, J Biol Chem 278, 46203
(Nov 21, 2003).


![The -Glucoside (bgl) Operon of Escherichia coli Is ... · MA200 F lacX174 thi bglR1(bglR::IS1) srl::Tn10 recA56 dbglR7 bglG= lacZ lacY (Bgl lac) (Bgl ) 15 MA200-1 MA200 bglF201 [BglG(Con)]](https://img.dokumen.tips/doc/110x75/601abb4c82611216fb7d038c/the-glucoside-bgl-operon-of-escherichia-coli-is-ma200-f-lacx174-thi-bglr1bglris1.jpg)


