Embed Size (px)
Citation preview
M.V. Gudheti et al.
SUPPORTING MATERIAL
for
“Actin Mediates the Nanoscale Membrane Organization of the Clustered Membrane
Protein Influenza Hemagglutinin”
Manasa V. Gudheti,1,2* Nikki M. Curthoys,1* Travis J. Gould,1,3 Dahan Kim,1 Mudalige S. Gunewardene,1 Kristin A. Gabor,1,4,5 Julie A. Gosse,4,5 Carol H. Kim,4,5 Joshua
Zimmerberg,6 and Samuel T. Hess1,5†
1 Department of Physics and Astronomy, 120 Bennett Hall, University of Maine, Orono, ME 04469, USA
2 Current address: Department of Biology, University of Utah; and Vutara, Inc., 615
Arapeen #304, Salt Lake City, UT 84108, USA
3 Current address: Department of Cell Biology, Yale University School of Medicine, New Haven, 333 Cedar Street, CT 06510, USA
4 Department of Molecular and Biomedical Sciences, 5735 Hitchner Hall, University of
Maine, Orono, ME 04469, USA
5 Graduate School of Biomedical Sciences, 263 ESRB/Barrows Hall, University of Maine, Orono, ME 04469, USA
6 Program in Physical Biology, Eunice Kennedy Shriver National Institute of Child Health
and Human Development, National Institutes of Health, Bethesda, MD 20892, USA
* these authors contributed equally
Running Title: Actin and Membrane Organization of HA † Corresponding author. Present address: 313 Bennett Hall, Department of Physics and Astronomy, University of Maine, Orono, ME 04469. Phone: 207 581-1036. Fax: 207 581-3410. Email: [email protected]
1

M.V. Gudheti et al.
Preparation for Imaging. NIH3T3-HAb2 cells were grown in DMEM (with serum but without phenol red or antibiotics) to ~80% confluence in eight-well coverglass chambers (#1.5, Nalge Nunc) for room temperature (RT) imaging. NIH3T3-HAb2 cells were grown in 35 mm glass bottom dishes (P35G-1.5-20-C, MatTek Corporation, Ashland, MA) to ~80% confluence for 37°C live cell imaging. Using Lipofectamine 2000 (Lipo) (Invitrogen) according to the manufacturer’s procedures, cells in eight-well coverglass chambers were transfected with ~1 μg DNA per well of Dendra2-HA (1) and/or PAmCherry-actin (2) or PAmCherry-cofilin in reduced-serum media (Opti-MEM, Gibco/Invitrogen) without antibiotics. When transfecting cells plated in 35 mm dishes, ~5 μg of DNA of each construct was used. Cells were then grown for an additional 24–30 h in the presence of serum supplemented media without phenol red. For fixation, cells were rinsed three times in PBS, incubated for ~20 - 30 min in 4% paraformaldehyde (PFA, USB Corporation, Cleveland, OH) in PBS at RT, and rinsed three more times with UV-bleached PBS to reduce background from fluorescent contaminants (1, 3). For two-color live cell imaging, the following DNA/Lipo ratios were used for transfecting: Dendra2-HA (0.52 µg DNA/µL Lipo), PAmCherry-actin (0.4-0.5 µg DNA/µL Lipo), and PAmCherry-cofilin (0.5 μg DNA/μL Lipo) were found to be optimal. For a single transfection in 35 mm dishes, 5 µL of Lipo and the appropriate amount of DNA were added to separate aliquots (250 µL) of Opti-MEM. The manufacturer's protocol was followed and thereafter the transfection media was replaced after ~5 h of transfection with growth media containing antibiotics but no phenol red. Cells were rinsed three times and imaged with low background Dulbecco's phosphate-buffered saline (DPBS) containing calcium and magnesium (BioWhittaker Lonza, Walkersville, MD) supplemented with 10 mM glucose 30 hours post-transfection. The low background level of the buffer rendered it suitable for FPALM imaging without the need for UV bleaching. Actin Cytoskeleton Disruption. For disrupting the actin cytoskeleton, plated NIH3T3- HAb2 cells were grown to ~40-50% confluence in DMEM with serum, without phenol red and with antibiotics and then transfected as above. Approximately 30 hours post-transfection the cells were incubated with actin disrupters at 37°C and 5% CO2. Stock solutions of latrunculin A (LatA) (Sigma–Aldrich, St. Louis, MO), cytochalasin D (CytoD) (Sigma–Aldrich) and jasplakinolide (Jas) (Sigma–Aldrich) were made in DMSO (Fluka). The initial master stocks (dissolved in DMSO) were diluted in sterile PBS to achieve a working stock of 1 mM. DMSO diluted in sterile PBS was added to the control sample to mimic the volume percent (0.01%) of DMSO present in each of the drug treatments. NIH3T3-HAb2 cells were incubated with full growth media supplemented with 1 μM LatA for 10 minutes, 1 μM CytoD for 60 minutes, 1 μM Jas for 30 minutes and 0.01% DMSO (Control) for 60 minutes. Subsequently the cells were rinsed 3 times with UV-bleached PBS and fixed in 4% PFA in PBS at RT for 20 minutes before being rinsed a further 3 times and imaged in UV-bleached PBS. Alexa 488 Phalloidin Staining to Visualize F-actin Expression. Alexa Fluor 488 phalloidin (referred to as Alexa 488 phalloidin throughout) (Life Technologies, Invitrogen) was used to investigate the effects of LatA, CytoD, and Jas on F-actin in NIH3T3-HAb2 cells. Cells were plated onto eight-well coverglass chambers (#1.5, Nalge Nunc) in DMEM, with serum, without phenol red and with antibiotics to ~80% confluence. After subjecting NIH3T3-HAb2 cells to the corresponding treatments the cells were rinsed twice with PBS, fixed at RT for 10 minutes with 4% PFA, rinsed twice again with PBS and permeabilized at RT with 0.01% Triton X-100
2

M.V. Gudheti et al.
(Sigma-Aldrich) in PBS for 4 minutes. The cells were again rinsed twice with PBS and incubated with 1% bovine serum albumin (BSA, Sigma-Aldrich) in PBS for 20 minutes at RT to block non-specific labeling. Thereafter, Alexa 488 phalloidin (Life Technologies, Invitrogen) diluted 1 in 200 into PBS with 0.5% BSA was added to the cells for 20 minutes at RT. PBS was then used to rinse the cells three times and was subsequently used as the imaging media. Alexa Fluor 680 phalloidin (Life Technologies, Invitrogen) was used to compare the distributions of endogenous filamentous actin and transiently transfected Dendra2-HA in NIH3T3-HAb2 cells. The above protocol was used, except that Alexa 680 phalloidin was diluted 1 in 100 in PBS only. Single-Color FPALM Imaging and Analysis Single-color FPALM imaging and analysis was performed as described earlier (3-5). A 405 nm diode laser (BCL-405-15, Crystalaser, Reno, NV) was used to activate photoactivatable molecules in the sample, while either a 556 nm (LRS-556-NM-100-10, Laserglow, Toronto, Canada) or a 555 nm (GCL-100-555-M, Crystalaser) diode laser was used to readout active molecules. Both beams were focused at the back aperture of a 60X / 1.2 NA water-immersion objective lens (UPLAPO60XW, Olympus, Melville, NY) to produce widefield illumination at the sample. Fluorescence from the sample was collected by the same objective, separated from laser light by a dichroic mirror (T565LP, Chroma Technology, Rockingham, VT), bandpass filtered (ET605/70M, Chroma Technology), and imaged by an EMCCD camera (iXon+ DU897DCS-BV, Andor Scientific, Belfast, Ireland) operated at EM gain of 200 and frame rates of either ~31.5, 46.0, 59.7, or 69.8 Hz. The camera was controlled using Solis software (Andor). Additional achromatic lenses (f=+60 mm and f=+200 mm, Newport Corporation, Irvine, CA) arranged as a telescope were mounted in the detection path to provide additional magnification and produce an effective camera pixel size of ~83 nm.
Similar to previously published methods, (3) readout laser intensities ranged from ~103–104 W/cm2. For activation, continuous low-intensity 405 nm illumination was used with intensities ranging from 0–102 W/cm2. A motorized filter wheel (FW102, Thorlabs, Newton, NJ) containing neutral density filters provided manual incrementing of the activation intensity in steps of 100.5 to maintain a density of visible molecules of ~1/μm2.
Cells were selected for FPALM imaging by exciting the sample with a mercury lamp (excitation filter 475/40x, Chroma) and viewing, searching for green fluorescence (bandpass-filtered, HQ535/50M, Chroma) to locate cells transfected with Dendra2-HA. During post acquisition analysis, each frame of an image series (typically 5,000 – 20,000 frames total) was background subtracted and positive intensity peaks with at least one pixel above a minimum threshold were fitted to a two-dimensional Gaussian to determine the x and y coordinates, amplitude (I0), e
-2 radius (r0), and an offset. Fitted values of I0 and r0 were then used to calculate the number of detected photons ( 2/rIN 2
00 ). Fits that yielded N and r0 consistent with that
expected for a single molecule were recorded for further analysis. For each localized molecule the localization precision was calculated using the standard analytical equation from the literature, plus an additional 30% (6). Lateral drift of the sample stage was characterized previously (< 7 nm in x or y over ~20 min) (5) and was assumed to be negligible over the duration of these experiments, compared to the estimated lateral resolution of ~10-30 nm. All analysis was performed using custom software written in MATLAB (Mathworks, Natick, MA). Transmitted light images were also obtained post-acquisition using either a Quantifire (Optronics, Goleta, CA) or a Photometrics Cascade 512B (Roper Scientific, GmbH, Germany) camera mounted at an additional camera port of the microscope stand.
3

M.V. Gudheti et al.
The high densities of HA measured by FPALM place a lower bound on the detection efficiency of labeled molecules. HA density observed in X-31 viral membranes is ~7000 HA
trimers/μm2, (7) or ~21x103 HA monomers/μm2. Our observed densities in some NIH3T3-HAb2 cell clusters of ~ 6-7x10³ trimers/μm2 or 20x103 monomers/μm2 suggest we have a high labeling and localization efficiency.
The three-dimensional membrane within the ±0.5 μm depth of field is imaged as a two-dimensional projection, which could introduce distortions in observed clusters. Based on electron microscopy serial sections of membrane sheets from NIH3T3-HAb2 cells (8), the three-dimensional topography of the membrane (maximum ~200 nm displacement in the axial direction) is calculated to affect molecular intensities and point spread function area by ~9% for a 200 nm axial displacement, which is not expected to affect FPALM localization efficiency, and is expected to affect localization precision by ~5%. Local sloping of the membrane could, however, influence (and generally increase) apparent molecular density, the effects of which we neglect. Single-Color Live-cell FPALM Temperature Control. For live-cell imaging, cells were maintained at 37 ±0.2 °C using a TC-202A temperature controller and PDMI-2 micro incubator stage (Harvard Apparatus, Holliston, MA) mounted to the stage of an inverted microscope (IX71, Olympus). The FPALM setup is the same as that used for single-color fixed-cell imaging. Diffusion Analysis. To determine the mobility of HA, localized molecules in consecutive frames were tracked using a nearest-neighbor (NN) algorithm. For each molecule in the ith frame, the NN in the same frame and the two NNs in the (i+1)th frame were calculated. The first NN in the (i+1)th frame was linked to the molecule in the ith frame if the following criteria was satisfied. 1) the distance from the first NN in the (i+1)th frame was less than Rmax (typically 300 nm), 2) the distance from second NN in the (i+1)th frame was greater than 2Rmax, and 3) the distance from the NN in the same frame was also greater than 2Rmax. Criteria 2) and 3) served to minimize errors in assignment of molecules. A trajectory was terminated when any criterion was not satisfied. From identified trajectories, histograms of diffusion steps sizes were generated and fitted to a two-component model of diffusion. The probability that a diffusing molecule starting at the origin will be found within a circle of radius r at a later time ∆t is described by the cumulative distribution function P(r,∆t). A two-component system in which fractions α and (1-α) of molecules are characterized by diffusion coefficients D1 and D2, respectively, is described by (9):
)e1)(1()e1()t,r(P22
221
2 r/rr/r (1)
where 2ir are the mean-square displacements (MSDs), i.e. tD4r i
2i for free 2D diffusion. The
probability of a diffusion step of length r is given by r/)t,r(P)t,r(p :
2
222
12 r/r
22
r/r2
1
er
r)1(e
r
r2)t,r(p . (2)
Alternatively, particle image correlation spectroscopy (PICS) (10) was used to characterize diffusion using software obtained from the Schmidt lab. Briefly, the number of molecules localized in the (i+k)th frame within a distance r of a given molecule localized in the ith frame were tabulated to determine the cumulative correlation function, C(r,∆t):
4

M.V. Gudheti et al.
2rc)t,r(P)t,r(C (3) where P(r,∆t) is again the cumulative distribution function and the second terms accounts for the proximity to molecules on average. Values of C(r,∆t) at longer distances were used to determine the average concentration (c) such that the second term could be subtracted from Eq. 4 to provide P(r,∆t) which was again taken to be of the form of Eq. 2. Data was also corrected for undercounting due to diffraction and photobleaching (10). The frame delay, k, translates to a time- lag, ∆t=k ´ τF, where τF is the time per frame. Eq. 2 was then used to determine the fraction α and the MSDs of each population as a function of time-lag. For free 2D diffusion we expect the MSD to increase linearly with time-lag: tD4r i
2i +2σ2 (4)
where the finite localization precision (σ) results in a constant offset to the MSDs . MSDs which exhibited asymptotic behavior at longer time-lags were fit to a confined diffusion model. Confined diffusion within a square area L2 with impermeable, reflecting boundaries is modeled by (11):
20 L/tD12
222 e1
3
L)t(r (5)
where D0 is the short length scale diffusion coefficient. Turn Angle and Mobility Measurements. HA single molecule trajectories were analyzed to determine turn angle and mobility variations with respect to neighboring actin densities. The collected two-color FPALM data were initially sorted to identify each type of molecule (Dendra2-HA or PAmCherry-actin) based upon relative intensity ratios measured in each channel (transmitted (T), reflected (R)). A square grid spanning each imaged cell was defined with a grid box size of 0.2 x 0.2 µm2. The number of actin molecules falling within each grid box was counted and actin density determined. For any two single molecule hops belonging to a given trajectory, the angle spanned from initial step direction towards the direction of subsequent step was defined as the turn angle. Based on the location of the origin on the density map of such an initial step in a HA trajectory, the corresponding local actin density was recorded along with the determined turn angle. The turn angles were next sorted with respect to local actin density (above or below median). Histograms of sorted turn angles were generated with turn angles spanning -180º to 180º with a 10º bin size. Turn angle histograms were further normalized with respect to the total turn angles measured to depict relative frequency of occurrence of a given turn angle in a high or low actin density region. In a strategically similar fashion the HA trajectory steps were used to determine the squared displacements for each step and keeping a record of neighboring actin density. Such squared displacements were binned with respect to actin density and for each bin the square displacements were averaged and divided by the time per step (31.75 ms at 31.5 Hz frame rate) to determine mobility. These measurements were used to generate HA mobility versus actin density plots. Two-Color FPALM Two-Color FPALM: Acquisition. These methods are described in detail in (12). In brief, two-color imaging on fixed NIH3T3-HAb2 cells was performed using the same setup as for single-color FPALM with the exception that a dichroic mirror and emission filters were mounted in the detection path between the telescope and the EMCCD camera, similar to a detection scheme used previously for multi color imaging (13). Although Dendra2 (peak emission 573 nm) and PAmCherry (peak emission 595 nm) have overlapping emission spectra, each probe can be
5

M.V. Gudheti et al.
identified by the ratio of emission in each detection channel as has been previously demonstrated with photoswitchable rhodamine derivatives (13). For two-color live-cell FPALM, cells were maintained at 37±0.2 °C using the same procedures as for single-color live-cell FPALM (see above). A 561 nm diode (Sapphire 561-100CW CDRH, Coherent, GmbH, Germany) readout laser and 405 nm diode (BCL-405-15, Crystalaser) activation laser were circularly polarized using a mounted achromatic quarter-wave plate (AQWP05M-600 Thorlabs, Newton, NJ) which is effective over the wavelength range of 400 - 800 nm. A custom-built 3X beam expander was used in front of the activation laser to further spread the beam. Widefield illumination at the sample was achieved by focusing both laser beams at the back aperture of a 60X / 1.2NA water-immersion objective lens (UPLAPO60XW, Olympus). Fluorescence from the sample was collected by the same objective, separated from the laser light by a dichroic mirror (T565LP, Chroma Technology), and long-pass filtered (LP02-561-RU-25, Semrock Inc., Rochester, NY), with both located in the same filter cube of the microscope. Fluorescence was then sent through a 405 nm notch filter (NF03-405E-25, Semrock Inc.) to cut off any activation laser bleed-through. Two additional lenses (f=+100 mm and f=+300 mm) (Thorlabs) were placed in the detection path to yield a roughly 3x magnification of the image formed on the sensor of an EMCCD camera (iXon+DU897DCS-BV, Andor Technology). After the last telescope lens and before the camera the detected light was split by a dichroic mirror (Z568RDC, Chroma Technology) such that reflected light was sent through one emission filter (ET605/70M, Chroma Technology) and transmitted light through another emission filter (FF01-630-92-25, Semrock Inc., Rochester, NY) with additional broadband dielectric mirrors placed to make split beam path lengths equal before forming separate images on two distinct regions of camera EMCCD. Images were acquired at EM gain of 200 and frame rates of ~31.5 Hz for 8000 frames. The readout laser power was ~5-10 kW/cm2 and the activation power ranged from 0-102 W/cm2 at the sample. Before the start of each day of experiments (fixed and live cell two-color), images of fluorescent beads (TetraSpeck, Invitrogen) were obtained to correlate the two detection channels; with correlation done during post-acquisition analysis. Cells confirmed to express Dendra2-HA were then positioned to image the coverslip proximal membrane. Only cells which were later confirmed to express PAmCherry-actin (fixed- or live-cell) or PAmCherry-cofilin (fixed-cell only) by post-acquisition analysis were considered for further interpretation. Two-Color FPALM: Analysis. This was an extension of the basic FPALM analysis described above and was used for both fixed and live cell imaging. As in other localization based techniques employing a split detection path (1, 13, 14), the raw frames now contained two spatially separated images (here representing the emission wavelengths transmitted and reflected by the dichroic mirror) which were correlated using transformation parameters (including translation, linear stretching, and rotation) obtained from the images of fluorescent beads (TetraSpeck, Invitrogen) and then superimposed for the standard localization routine. For each localized molecule the intensity in each detection channel was calculated as the sum of the pixel intensities in a 5x5 pixel box centered about the pixel containing the localized coordinates of the molecule. Intensity ratio of transmitted to the sum of the transmitted and reflected light was then calculated to produce a histogram of these values (α-values) between 0 and 1 from which the identity of the probe was identified (see 12 for more detail). Each localized molecule was assigned as either a Dendra2-tagged (HA) or PAmCherry-tagged (cofilin or actin, depending on the experiment) if its calculated ratio lied within the respective range of α-values chosen such that the error in assignment to either species was < 5%. For trajectory analysis of two-color live-
6

M.V. Gudheti et al.
7
cell imaging: after identification, each species (color) was analyzed separately using the same procedure used for the single-color diffusion analysis. Statistical Analysis of Clustering Pair Correlation. Coordinates of individual molecules obtained from FPALM imaging were used to calculate pair correlation functions. Localizations of the same molecules in consecutive frames were removed from the data set by linking molecules in the ith frame to molecules in the (i+1)th frame that were separated by less than 3 times the median localization precision. The positions of linked molecules were then averaged for use in pair correlation calculations. The correlation, g(r), of species A with species B was calculated from:
An
1iBriB
A
)A()r(nn
1)r(g (6)
where nB(ri) is the number of molecules of species B that within a 10 nm-thick shell of radius r from the ith molecule of species A; Ar is the area of the shell; nA is total number of species A used in the summation, and ρB is the average density (number per unit area) of species B. So that edge correction was not required, the summation was only performed for molecules of species A that were less than the maximum distance used in the calculation (typically 1 μm) from the edge of a cell. Values of g(r) > 1 indicate correlation between species while g(r) < 1 indicates anti-correlation. For uniform distribution of molecules, g(r) = 1 is expected. Calculated values of g(r) were fitted to the analytical correlation function (15): rCe)r(g 0r/r (7) including a constant offset, where A is the amplitude, r0 is the correlation length, η and is a number. Bleed-Through Correction of Pair Correlation For calculation of cross pair-correlation values, localized molecules within a chosen mask of a two-color FPALM image were identified for their probe species by their α-values, by selecting α-value ranges for Dendra2 (channel A) and PAmCherry (channel B) and discarding molecules in the range of α with a high overlap between Dendra2 and PAmCherry distributions. For each probe species, these selected, localized molecules were then projected onto a grid to obtain two density plots, one for each probe, whose pixel values equal the number of molecules localized within each respective grid element. These density plots were then corrected for the bleed-through according to the bleed-through rates determined from α-value histograms of single-species samples for the defined α-value ranges for Dendra2 and PAmCherry, using
BAAB
measBBA
measABA
measAcorr
A kk1
nknknn
(8)
and
BAAB
measBAB
measAAB
measBcorr
B kk1
nknknn
(9)

M.V. Gudheti et al.
where corrAn and corr
Bn are the corrected A and B channel pixel values, respectively, measAn and
measBn are the measured A and B pixel values, respectively, kAB is the per-molecule bleed-through
rate of channel A (Dendra2) into channel B (PAmCherry), and kBA is the per-molecule bleed-through rate of channel B into channel A. For each non-zero pixel in the Dendra2 density plot after the bleed-through correction, the sum of PAmCherry density-plot pixel values was calculated for all the pixels whose centers were at a radius r ± ∆r/2, then normalized:
i
corrB
jcorrB
icorrA
jcorrA
AB ))r(A()2/rr(nnN
1)r(g (10)
where i is an index running over all pixels, j is an index running over all pixels at a radius r±∆r/2
from the ith pixel, corrAN is the total number of species A corrected for bleed-through, A(r) is the
sum of areas of all pixels that have centers within r±∆r/2 of the ith pixel, icorrAn is the number of
species A in the ith pixel, jcorrBn is the number of species B in the jth pixel, corrected for bleed-
through, and corrB is the average density of species B (number per unit area) corrected for bleed-
through. The average density was obtained using a mask drawn manually around the given cell being analyzed. The value of gAB is computed for values of r ranging from 0 to a maximum r in steps of ∆r. This radial distribution of PAmCherry with respect to a single Dendra2 density-plot pixel is then weighted by the value of the Dendra2 density-plot pixel for which the radial distribution is calculated, and was computed only for Dendra2 density-plot pixels that were at a minimum distance r inward from the region of interest mask to avoid edge effects. The average of this distribution for all non-zero Dendra2 density-plot pixels was reported as the radial distribution, or the pair-correlation, between Dendra2 and PAmCherry, after another normalization by the average density of PAmCherry molecules over the masked area. This method of pair-correlation calculation is identical to the calculation using the standard definition for pair-correlation, but is done on the basis of grid elements that allow correction of bleed-through. For our calculations, we used 0.2-0.58 for the range of α-values of Dendra2, 0.65-1.0 for the range of α-values of PAmCherry, kAB=0.0463, kBA=0.0496, grid pixel size of 0.01μm, ∆r = 0.01μm, and maximum r of 1.00μm.
8

M.V. Gudheti et al.
9
Table S1. Effects of Actin Disrupting Drugs on HA Cluster Area and Density in Fixed NIH3T3-HAb2 Cells
Control (n = 25 cells)*
LatA (n = 34 cells)*
CytoD (n = 17 cells)*
Jas (n = 23 cells)*
Area (m2)† 0.151±0.006 0.154±0.006 0.274±0.015 0.213±0.012
Difference to control‡
p > 0.05 p < 0.0001 p <0.05
Density (# of HA/m2)†
3670±120 3260±60 2720±80 3910±230
Difference to control‡
p < 0.05 p < 0.0001 p > 0.05
* Clusters analyzed contained at least 200 HA proteins † Means±SEM of HA cluster areas and densities from the stated number of cells measured on at least two different days (typically three), with an average of ~14.8 clusters analyzed per cell ‡ Statistical significance was determined with Prism (Graphpad, San Diego, CA, USA) as determined by one-way ANOVA with a Tukey’s post test.

M.V. Gudheti et al.
10
Figure S1. Comparison of HA turn angle histograms with and without PAmCherry-Actin. We imaged Dendra2-HA with FPALM in live cells expressing Dendra2-HA only (black dots), and compared with HA dynamics in live cells expressing both Dendra2-HA and PAmCherry actin (blue triangles), in regions where the PAmCherry-actin was present at low (below median) levels. Since our other results show that HA mobility is strongly affected by actin (Fig. 2), we expect to find that cell regions with high levels of PAmCherry-actin will show different mobility compared to cell regions with low levels of PAmCherry-actin (Fig. 2). Rather, to test for non-specific effects of the expression of PAmCherry-actin, we consider regions with below median levels of PAmCherry-actin, but in cells which have both Dendra2-HA and PAmCherry-actin, and compare with cells which have only Dendra2-HA. Note that the histograms are both normalized to a total area of 1.
M.V. Gudheti et al.
11
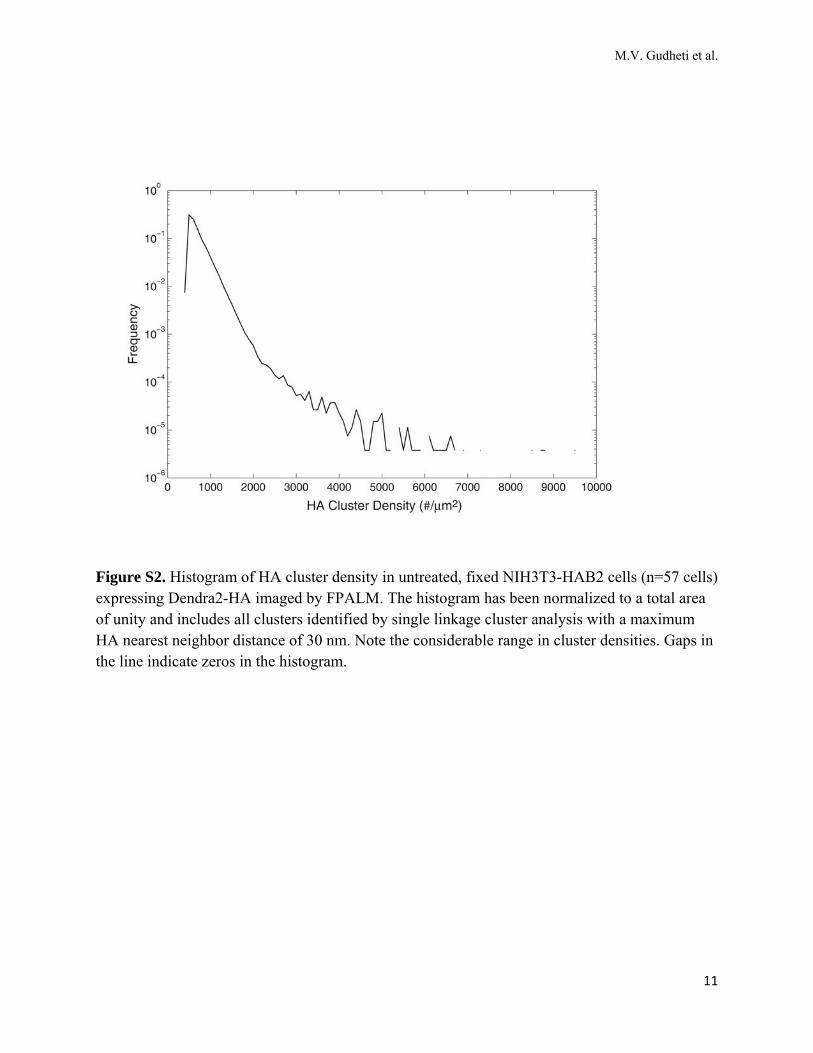
Figure S2. Histogram of HA cluster density in untreated, fixed NIH3T3-HAB2 cells (n=57 cells) expressing Dendra2-HA imaged by FPALM. The histogram has been normalized to a total area of unity and includes all clusters identified by single linkage cluster analysis with a maximum HA nearest neighbor distance of 30 nm. Note the considerable range in cluster densities. Gaps in the line indicate zeros in the histogram.

M.V. Gudheti et al.
12
Figure S3. Histogram of HA cluster area in untreated, fixed NIH3T3-HAB2 cells (n=57 cells) expressing Dendra2-HA imaged by FPALM. The histogram has been normalized to a total area of unity and includes all clusters identified by single linkage cluster analysis with a maximum HA nearest neighbor distance of 30 nm. Note the dramatic range (more than 50-fold) in cluster areas. Gaps in the line indicate zeros in the histogram.

M.V. Gudheti et al.
13
Figure S4. Actin disrupting drugs differentially affect actin structures in NIH3T3-HAb2 cells imaged by confocal microscopy. NIH3T3-HAb2 cells were incubated with actin disrupting drugs, fixed, stained with Alexa 488 phalloidin, and imaged by confocal microscopy. Actin disruption: (A) 0.01 % DMSO (vehicle control for actin disrupting drugs) for 60 min, (B) 1 μM latrunculin A (LatA) for 10 min, (C) 1 μM cytochalasin D (CytoD) for 60 min, and (D) 1 μM jasplakinolide (Jas) for 30 min. Note the substantial disruption of actin and cell rounding caused by LatA and CytoD. Jas-treated cells contained prominent and numerous intact actin stress fibers and showed very little cell rounding. Scale bar = 20μm.
M.V. Gudheti et al.
14
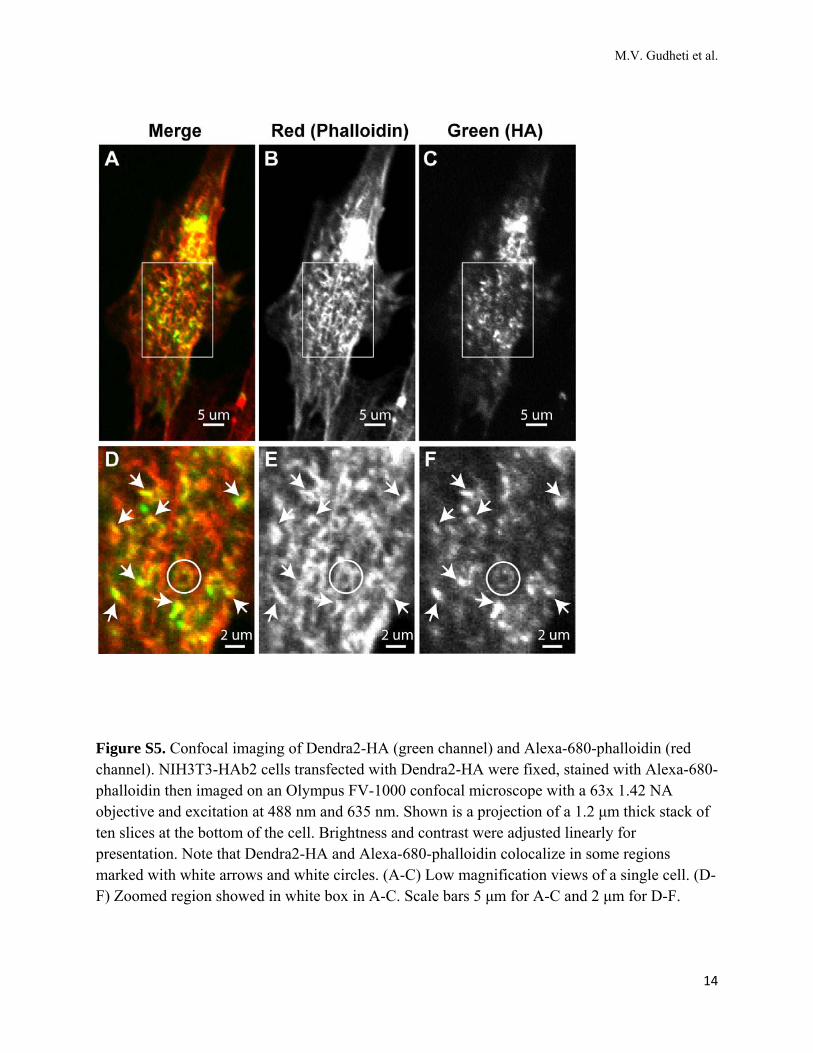
Figure S5. Confocal imaging of Dendra2-HA (green channel) and Alexa-680-phalloidin (red channel). NIH3T3-HAb2 cells transfected with Dendra2-HA were fixed, stained with Alexa-680-phalloidin then imaged on an Olympus FV-1000 confocal microscope with a 63x 1.42 NA objective and excitation at 488 nm and 635 nm. Shown is a projection of a 1.2 μm thick stack of ten slices at the bottom of the cell. Brightness and contrast were adjusted linearly for presentation. Note that Dendra2-HA and Alexa-680-phalloidin colocalize in some regions marked with white arrows and white circles. (A-C) Low magnification views of a single cell. (D-F) Zoomed region showed in white box in A-C. Scale bars 5 μm for A-C and 2 μm for D-F.

M.V. Gudheti et al.
15
Figure S6. Actin disruption. Models of LatA, CytoD and Jas treatments on HA cluster areas and densities in NIH3T3-HAb2 cells. (A) All effects are described with reference to the control (untreated, “Control”) HA and actin distributions. (B) Treatment with CytoD induces a lateral dispersion of clustered HA proteins. We propose that the loss of the underlying actin filaments and so loss of the structure maintaining the HA cluster disperses, allowing HA proteins to move laterally from the original cluster; and the average HA-HA nearest neighbor distance increases. However, intermolecular distances are still small enough for many of these proteins to be defined as within the same cluster and so the area of the clusters increases dramatically, but as the total number of molecules per cluster does not change, the cluster density reduces (“CytoD”). (C) Treatment with LatA caused a significant decrease in cluster density, and no change in cluster area. LatA could be expected to cause a more stringent assault than CytoD, as CytoD does not inhibit the nucleation of actin filaments de novo. After treatment, some proteins still retain nearest neighbor distances small enough to define them as being in a cluster. Unlike the CytoD treatment, intermolecular distances of many of these proteins now exceed that required to be defined as within the cluster. The number of proteins per cluster has reduced, the density has reduced, and the area covered by these now dispersed proteins has not changed (“LatA”). (D) Treatment with Jas inhibits depolymerization, so resulting in larger total amounts of filamentous actin. Before treatment, actin and HA clusters colocalized (e.g. Fig. 1). Jas treatment stabilizes and elongates filaments throughout the cell; as a greater concentration of these are adjacent to HA clusters the periphery of these actin meshworks is stabilized, and the structural basis for the cluster advances laterally. HA proteins which were non-cluster now associate, and cluster area increases, although cluster density remains unchanged (“Jas”).

M.V. Gudheti et al.
SUPPORTING REFERENCES
1. Gould, T. J., M. S. Gunewardene, M. V. Gudheti, V. V. Verkhusha, S. R. Yin, J. A. Gosse, and S. T. Hess. 2008. Nanoscale imaging of molecular positions and anisotropies. Nature Methods 5:1027-1030.
2. Subach, F. V., G. H. Patterson, S. Manley, J. M. Gillette, J. Lippincott-Schwartz, and V. V. Verkhusha. 2009. Photoactivatable mCherry for high-resolution two-color fluorescence microscopy. Nature Methods 6:153-159.
3. Gould, T. J., V. V. Verkhusha, and S. T. Hess. 2009. Imaging biological structures with fluorescence photoactivation localization microscopy. Nature Protocols 4:291-308.
4. Hess, S. T., T. P. K. Girirajan, and M. D. Mason. 2006. Ultra-high resolution imaging by fluorescence photoactivation localization microscopy. Biophysical Journal 91:4258-4272.
5. Hess, S. T., T. J. Gould, M. V. Gudheti, S. A. Maas, K. D. Mills, and J. Zimmerberg. 2007. Dynamic clustered distribution of hemagglutinin resolved at 40 nm in living cell membranes discriminates between raft theories. Proceedings of the National Academy of Sciences of the United States of America 104:17370-17375.
6. Thompson, R. E., D. R. Larson, and W. W. Webb. 2002. Precise nanometer localization analysis for individual fluorescent probes. Biophysical Journal 82:2775-2783.
7. Harris, A., G. Cardone, D. C. Winkler, J. B. Heymann, M. Brecher, J. M. White, and A. C. Steven. 2006. Influenza virus pleiomorphy characterized by cryoelectron tomography. Proceedings of the National Academy of Sciences of the United States of America 103:19123-19127.
8. Hess, S. T., M. Kumar, A. Verma, J. Farrington, A. Kenworthy, and J. Zimmerberg. 2005. Quantitative electron microscopy and fluorescence spectroscopy of the membrane distribution of influenza hemagglutinin. Journal of Cell Biology 169:965-976.
9. Schutz, G. J., H. Schindler, and T. Schmidt. 1997. Single-molecule microscopy on model membranes reveals anomalous diffusion. Biophysical Journal 73:1073-1080.
10. Semrau, S., and T. Schmidt. 2007. Particle image correlation spectroscopy (PICS): Retrieving nanometer-scale correlations from high-density single-molecule position data. Biophysical Journal 92:613-621.
11. Kusumi, A., Y. Sako, and M. Yamamoto. 1993. Confined lateral diffusion of membrane-receptors as studied by single-particle tracking (Nanovid Microscopy) - effects of calcium-induced differentiation in cultured epithelial-cells. Biophysical Journal 65:2021-2040.
12. Gunewardene, M. S., F. V. Subach, T. J. Gould, G. P. Penoncello, M. V. Gudheti, V. V. Verkhusha, and S. T. Hess. 2011. Super-resolution imaging of multiple fluorescent proteins with highly overlapping emission spectra in living cells. Biophysical Journal 101:1522-1528.
13. Bossi, M., J. Folling, V. N. Belov, V. P. Boyarskiy, R. Medda, A. Egner, C. Eggeling, A. Schonle, and S. W. Hell. 2008. Multicolor far-field fluorescence nanoscopy through isolated detection of distinct molecular species. Nano Letters 8:2463-2468.
14. Juette, M. F., T. J. Gould, M. D. Lessard, M. J. Mlodzianoski, B. S. Nagpure, B. T. Bennett, S. T. Hess, and J. Bewersdorf. 2008. Three-dimensional sub-100 nm resolution fluorescence microscopy of thick samples. Nature Methods 5:527-529.
15. Yeomans, J. M. 2002. Statistical mechanics of phase transitions. Oxford University Press, Oxford
16