Embed Size (px)
Citation preview
Supporting Information
Regenerative Nanobots Based on Magnetic Layered Double Hydroxide for Azo Dye Removal and Degradation
Zhi Shana,b, Mingsheng Luc, Dennis E. Currya, Stefanie Bealed, Stephen Campbelle, Kristin M. Poduskae, J. Craig Bennettd, Ken D. Oakesa, f and Xu Zhanga,g* aVerschuren Centre for Sustainability in Energy & the Environment, fDepartment of Biology, gDepartment of Chemistry, Cape Breton University, 1250 Grand Lake Rd, Sydney, NS, B1P 6L2, Canada. [email protected] of life Science, Sichuan Agriculture University, Yaan 625014, PR ChinacMarine School, Huaihai Institute of Technology, Lianyungang, 222005, China. dDepartment of Physics, Acadia University, Wolfville, NS, B4P 2R6, CanadaeDepartment of Physics and Physical Oceanography, Memorial University of Newfoundland, St. John's, NL, A1B 3X7, Canada
Experimental1. Chemicals. Anhydrous FeCl3, MgCl2, NaOH, trisodium citrate dihydrate, tetraethylorthosilicate (TEOS), concentrated ammonia solution (28 wt %) and HClO4 (70%), all analytical grade, were purchased from Sigma-Aldrich. Methyl orange, brilliant blue R250, coomassie bromophenol blue, methyl blue, and diclofenac sodium were purchased from Alfa Aesar. All other chemicals were used as received. Nanopure water (18 MΩ) prepared with a Barnstead NANO-pure system (Thermo Scientific) was used in all experiments.
2. Methods 2.1. Synthesis of MgFe-LDH
Highly stable suspensions of MgFe-LDH nanocrystals with different Mg-to-Fe ratios were prepared by a facile co-precipitation method. To prepare Mg2Fe-LDH, 0.8 mL 10 M NaOH solution was added within 3 s into 50 mL of mixed salt solution containing 42 mM MgCl2 and 20 mM FeCl3 under vigorous stirring, followed by 15 min stirring with the reactor purged with nitrogen. LDH slurry was obtained via centrifugal separation and washed 3 times with nanopure water. The final product was then dispersed in 50 mL nanopure water under sonication for 2 min, resulting in a stable homogeneous suspension, which was stored under an inert gas to avoid reacting with carbon dioxide. Adjusting the amounts of Mg2+, Fe3+, and NaOH can prepare MgFe-LDHs with variable Mg/Fe molar ratios, as illustrated in Table S1 and Figs. S3, S5-7.
2.2. Synthesis of Fe3O4 Particles
Monodispersed Single-Crystal Fe3O4 particles were synthesized according to the method reported previously.1 Briefly, FeCl3 anhydrate (16 mmol), trisodium citrate dihydrate (3.4 mmol), and sodium acetate anhydrate (NaAc) (48.8 mmol) were dissolved in ethylene glycol (80 mL) with magnetic stirring. The yellow solution obtained was then transferred and sealed into a 200 mL Teflon-lined stainless-steel autoclave. The autoclave was heated at 200 °C for 10 h and then allowed to cool to room temperature. The black products were washed with ethanol and nanopure
Electronic Supplementary Material (ESI) for ChemComm.This journal is © The Royal Society of Chemistry 2017
water 3 times before being dispersed in 50 mL nanopure water. The concentration of Fe3O4 was determined to be 15 mg/ml.
2.3. Synthesis of Fe3O4@SiO2 Microspheres
An aqueous dispersion of the magnetite microspheres (6 mL) was added to a three-neck round-bottom flask filled with absolute ethanol (80 mL), nanopure water (14 mL) and concentrated ammonia solution (1.0 mL, 28 wt %) and was mechanically stirred for 5 min at room temperature. Afterward, 60 μg (about 65 μL) TEOS dissolved in 1 mL ethanol was added drop-wise over 2 min, and the reaction was allowed to proceed for 7 h. After washing with ethanol and nanopure water 3 times, the final product was dispersed to a concentration of 8 mg/ml in nanopure water (about 12 mL).
2.4. Synthesis of Fe3O4@SiO2@MgFe-LDH nanobots
Fe3O4@SiO2@MgFe-LDH nanobots were prepared by direct adsorption of LDH on the surface of Fe3O4@SiO2 through charge interaction. Briefly, 2.5 mL of as-prepared Fe3O4@SiO2 was added drop-wise to 25 mL of 2:1 MgFe-LDH in 5 min under sonication with the reactor purged with nitrogen. After sonicating for another 5 min, the mixture was subjected to magnetic separation using a permanent magnet. The obtained Fe3O4@SiO2@MgFe-LDH nanobots were rinsed and then dispersed in 10 mL nanopure water (~ 1.8 mg/ml) in an airtight container filled with Ar gas for storage. The nanobots had a MgFe-LDH-to- Fe3O4@SiO2 mass ratio of 48 ± 3%.
2.5. Adsorption of organic dyes
Room temperature batch adsorption studies of methyl orange and other dyes onto MgFe-LDHs and Fe3O4@SiO2@MgFe-LDH nanobots were carried out in 10 mL vials. The mixture solution was placed on a Horizontal Shaker (IKA, Germany) for continuous stirring at 700 rpm in the dark for varying time intervals to study adsorption kinetics. The particles were separated by centrifugation (@12,700 rpm/15 min for MgFe-LDHs) or by a magnet (for nanobots). The supernatant solutions were analyzed with UV–Vis spectroscopy using a M1000 Pro plate reader (TECAN, USA) to determine the remaining concentrations of dyes in the solution; a linear calibration curve over 5–100 mg/L at the maximum absorbance for each dye was used. The adsorbed dye concentration was calculated as the difference in dye absorbance before and after adsorption and separation. To evaluate the adsorption capacity of MgFe-LDHs and nanobots for methyl orange, the initial concentrations of methyl orange were varied in the range of 0–3000 mg/L with MgFe-LDHs kept at ~160 mg/L and Fe3O4@SiO2@MgFe-LDH at 112 mg/L with an incubation time of 24 h. To evaluate the adsorption capacity of nanobots for diclofenac sodium, the initial concentrations of diclofenac sodium were varied from 0–2000 mg/L with nanobots at 45 mg/L and incubation time of 24 h. Adsorption kinetics of methyl orange on nanobots were obtained by monitoring the concentration changes of methyl orange (initial concentration 0.3 g/L) over various time intervals. All dyes were quantified using UV-Vis in a 96-well microplate, while the concentration change of diclofenac sodium was monitored by UPLC-MS/MS calibrated with an external calibration curve.
2.6. Degradation of dyes using Fenton Chemistry
The degradation of organic dyes using Fenton Chemistry (Equations S1 and S2) was performed as follows: in a typical procedure, the as-prepared Fe3O4@SiO2@MgFe-LDH nanobots were added into 1000 mg/L methyl orange under stirring at 700 rpm for 120 min. The nanobots with adsorbed methyl orange were separated with a magnet and the supernatant was discarded. The precipitates were then washed with HOCl4 twice (5 mM, 10 min each time) to dissolve and completely remove the adsorbed MgFe-LDHs. After magnetic separation, the supernatant with methyl orange and dissolved LDH was collected and transferred to a new vial for Fenton reaction. To initiate a reaction, 30 mM H2O2 was added to the above obtained supernatant containing

Mg2+/Fe2+/Fe3+ ions and the target pollutant. The resulting suspensions were then stirred in the dark for 12 h with the pH maintained at 3 to allow complete de-colorization of dye solution. H2O2 solutions were added over time to maintain the constant level of 30 mM during Fenton reaction. To confirm the effectiveness of dye degradation by Fenton Chemistry, a control experiment without involvement of H2O2 was performed simultaneously.
Fe2+ +H2O2→ Fe3+ + HO• + OH−
(S1)
Fe3+ +H2O2 → Fe2+ + HOO• + H+ (S2)
2.7. Recycling of Fe3O4@SiO2 nanoparticles
Evaluation of the recycling of Fe3O4@SiO2 nanoparticles was performed as follows. After removal of as-mentioned supernatant for Fenton reaction, the precipitate (i.e. Fe3O4@SiO2 nanoparticles) was washed three times using nanopure water with the help of a magnet. After dispersing into nanopure water under sonication, Fe3O4@SiO2 nanoparticles were then subject to conjugation with MgFe-LDH to form the renewed Fe3O4@SiO2@MgFe-LDH nanobots for recycling. Based on the methods described above, this same recycling and adsorption/degradation procedures were repeated 24 times. To evaluate the acid stability of Fe3O4@SiO2 nanoparticles, the particles were treated in 2 mM HClO4 for 50 h, with HClO4 solution refreshed every five hours. The size and morphology of Fe3O4@SiO2 nanoparticles were obtained by transmission electron microscopy (TEM).
2.8. Regeneration of MgFe-LDHs
After degradation of dyes by Fenton Chemistry, the iron and magnesium ion-concentration in the Fenton reaction solution was monitored by ICP-MS. Their concentration was adjusted to 20 mM (Fe3+), and 42 mM (Mg2+) by adding FeCl3 and MgCl2 stock solution, respectively. The ion mixture was used for preparation of MgFe-LDH by adding NaOH according to the procedure as described in section 2.1. The resulting product was characterized by TEM and Fourier transform infrared spectroscopy (FTIR). The dye adsorption capacity was compared with the pristine MgFe-LDH (Mg:Fe=2:1).
Characterization of nanomaterialsX-ray diffraction (XRD)
Powder X-ray diffraction (XRD) patterns were recorded with a Bruker AXS model D8 Advance diffractometer using Cu-Kα radiation (λ = 1.542 Å), with the Bragg angle ranging from 5 ~ 90°. The accelerating voltage was set at 40 kV with 40 mA current.
Elemental analysis
MgFe-LDHs with different metal ratios were analyzed using inductively coupled plasma mass spectrometry (ICP-MS) (NexION 300D, PerkinElmer, USA).
Fourier transform infrared (FTIR) spectra of nanomaterials were collected with a Thermo Nicolet Nexus 470 spectrometer at 4 cm-1 resolution. The powder samples were dried and grinded with KBr to form a ~1 mm thick KBr pellet under high pressure. Pure KBr acted as blank.
Transmission electron microscopy (TEM)
The size and morphology of nanocomposites were characterized by TEM using a Phillips CM30 microscope operated with an accelerating voltage of 250 kV. The size distribution was determined by measuring at least 50 microspheres from TEM images followed by a statistical treatment.
Zeta potential and size analysis
The hydrodynamic size and zeta potential of the microspheres were measured using a SZ-100 Nano Particle analyzer (Horiba Scientific).
Quantification of the adsorption of diclofenac with UPLC-MS/MS The adsorption efficiency of diclofenac in Fe3O4@SiO2@MgFe-LDH nanobots was
quantitatively monitored with a UPLC coupled to a Xevo G2 QTof Mass Spectrometer (Waters Limited Co., Ontario, Canada) where an Acquity UPLC BEH Phenyl C18 1.7 µm, 2.1 x 50 mm column was coupled with VanGuardTM Pre-column for separation.2 Two mobile phases, A (acetonitrile with 0.1% glacial acetic acid) and B (HPLC water with glacial acetic acid, pH 3.5) were pumped through the column in a ratio of 75:25 in isocratic mode at a flow rate of 0.2 mL/min. Diclofenac was quantified under positive ionization mode (The m/z: 296 > 249). The main MS parameters were given as follows: capillary voltage (kV) 3.9, source temperature 150°C, desolvation temperature 350°C, dissolvation gas 600 L/H, cone gas 0.1 mass resolution 15, collision energy (V) 14, and collision gas 0.2 mL/min. The external calibration curve method was employed for quantification.
Supporting data and extended discussion
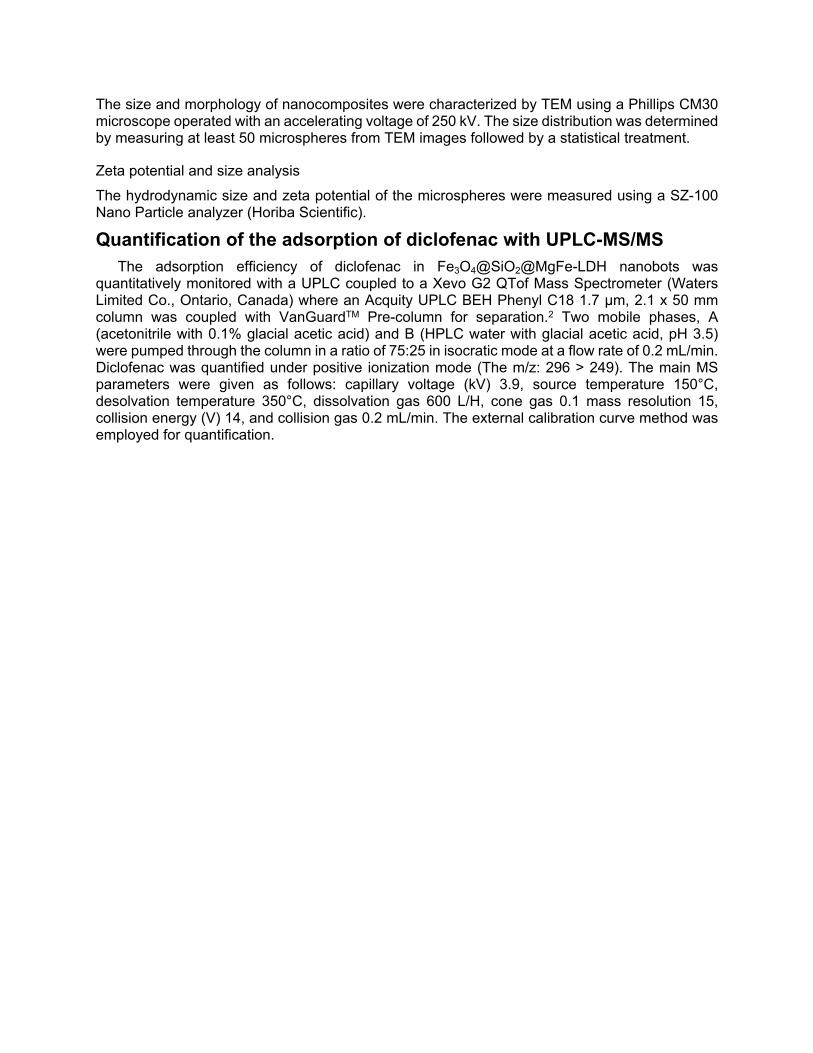
Fig. S1 The size distributions measured by dynamic light scattering (DLS) for Fe3O4, Fe3O4@SiO2, and Fe3O4@SiO2@Mg/Fe-LDH nanoparticles.
Dynamic light scattering (DLS) analysis indicated that the size of MgFe-LDH is 50±6 nm (Mg/Fe=2:1), 61±4 nm (Mg/Fe=2.5:1), 89±7 nm (Mg/Fe=3:1), and 86±4 nm (Mg/Fe=4:1), respectively. The size increased with increasing Mg/Fe ratios from 2 to 4, due to different crystallization thermodynamics, as observed in previous MgAl-LDH synthesis.3 It is worth mentioning that the sizes measured using DLS are larger than those measured using TEM, since DLS provides the hydrodynamic size (the nanoparticles in addition to the hydration layer) while TEM measures only the size of the nanoparticles.
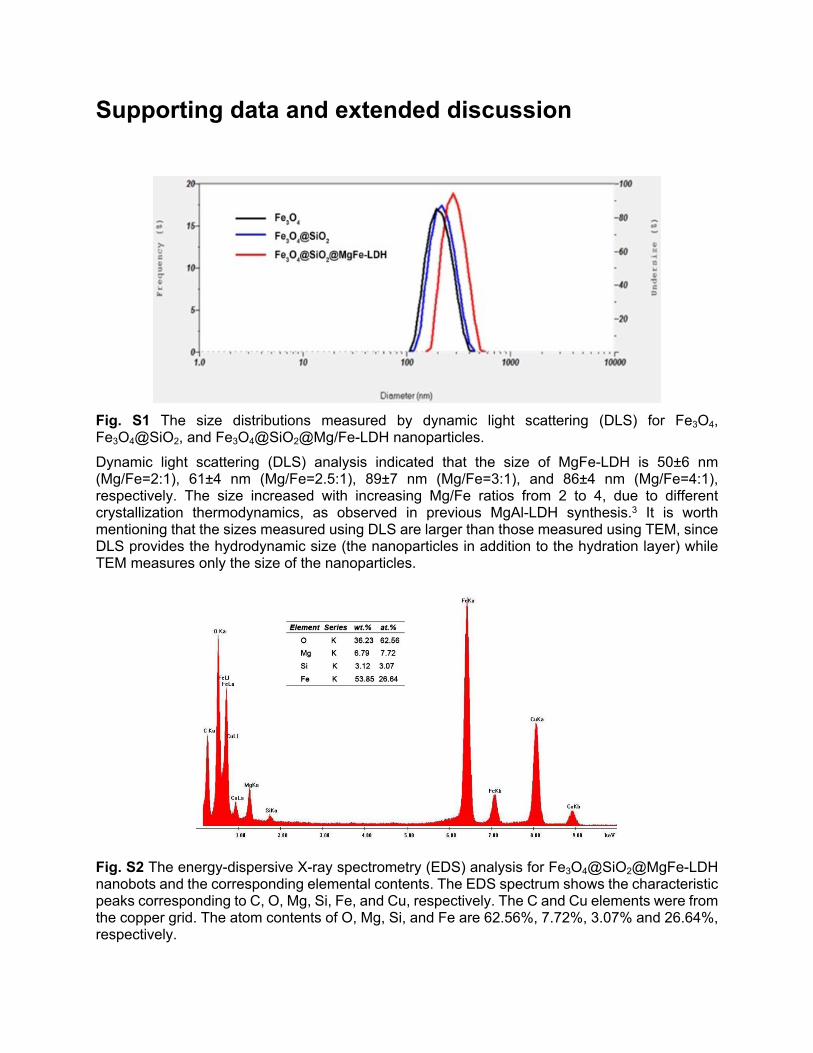
Fig. S2 The energy-dispersive X-ray spectrometry (EDS) analysis for Fe3O4@SiO2@MgFe-LDH nanobots and the corresponding elemental contents. The EDS spectrum shows the characteristic peaks corresponding to C, O, Mg, Si, Fe, and Cu, respectively. The C and Cu elements were from the copper grid. The atom contents of O, Mg, Si, and Fe are 62.56%, 7.72%, 3.07% and 26.64%, respectively.

Table S1 Rapid and controllable synthesis of LDH NPs with different Mg-Fe ratios.
Sample Mg2+ (mM) Fe3+ (mM) NaOH (mM) ICP-MS Mg/Fe ratio
DLS-Size
(nm)ζ-potential
(mV)2:1 42 20 160 1.95±0.13 50±6 65.2±2.2
2.5:1 42 15 120 2.51±0.06 61±4 61.0±1.13:1 52 15 160 3.10±0.15 89±7 63.7±2.54:1 70 15 200 4.06±0.09 86±5 59.9±1.8
Fig. S3 (A) Images of MgFe-LDH solutions with different Mg/Fe ratios and (B) corresponding characteristic Tyndall effect when irradiated with a laser beam, showing the light scattering effect of the nanoparticles. The color of the nanoparticles is determined by the content of the Fe3+ ions in the LDH crystal lattices.
The size (Table S1) and color (Fig. S3) of the LDH NPs can be tuned by varying the initial Mg/Fe ratio during synthesis. To prepare LDH with the exact molar ratio as indicated in Table 1, the Mg/Fe ratios are slightly higher in the precursor solution, which is likely due to more Mg2+ leaching from the hydroxide layers compared to Fe3+, similar to that observed in MgAl LDH.4
Fig. S4 The adsorption capacity of LDHs with different Mg/Fe ratios for methyl orange dye.
The adsorption capacity of the four LDH NPs was measured as follows. After mixing LDHs with methyl orange (2 g/L) in 30 mL water solution (~pH 8.0), the mixture was incubated in the dark at room temperature for 24 hr to reach saturation adsorption. Then the supernatant, after centrifugation at 12,700 rpm for 15 min, was used for quantification of adsorption. The LDH with Mg/Fe ratio of 2:1 was selected to conjugate with Fe3O4@SiO2 NPs to form the nanobots for dye
removal and degradation due to their 1) highest Fe content (high efficiency for Fenton degradation), 2) highest adsorption capacity towards MO, 3) lowest consumption of Mg to minimize the chemical cost, and 4) smaller size facilitating acid digestion.
The adsorption mechanism of the MO dye to LDH might be attributed to both ion exchange and Fe-O coordination.5 The adsorption capacity of our MgFe-LDH NPs is lower than MgAl LDH NPs, but much higher (5-15 times) than other LDH nanoparticles.6
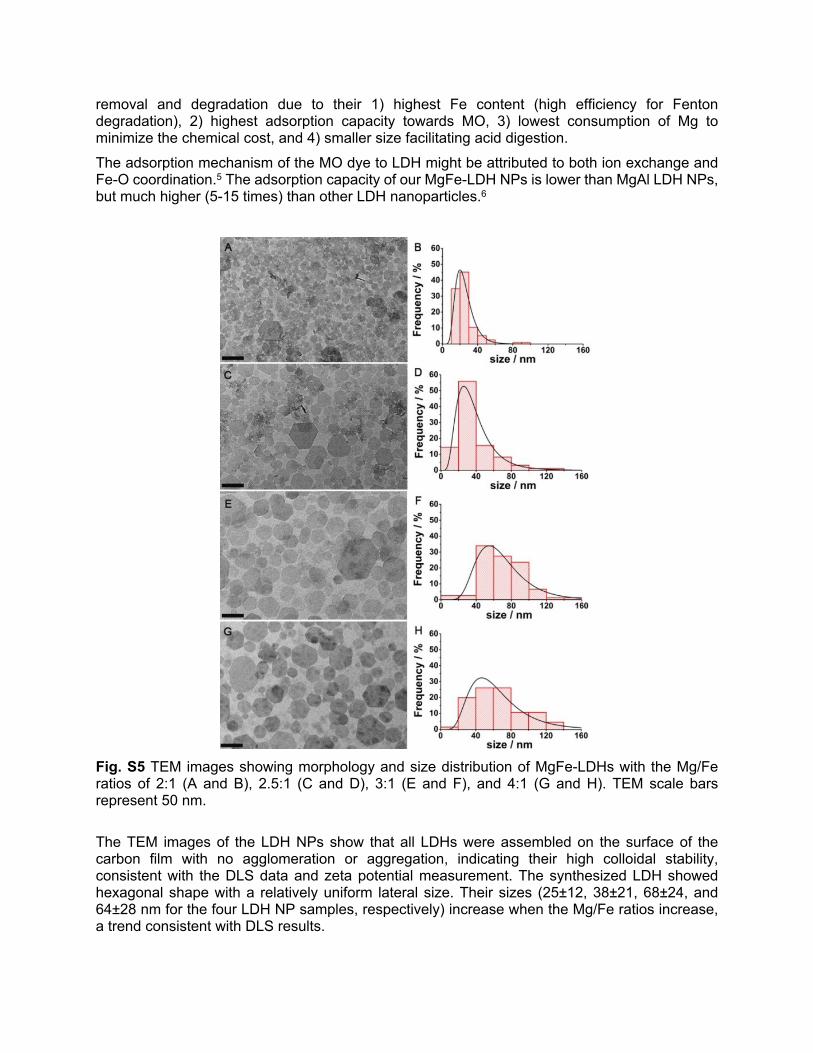
Fig. S5 TEM images showing morphology and size distribution of MgFe-LDHs with the Mg/Fe ratios of 2:1 (A and B), 2.5:1 (C and D), 3:1 (E and F), and 4:1 (G and H). TEM scale bars represent 50 nm.
The TEM images of the LDH NPs show that all LDHs were assembled on the surface of the carbon film with no agglomeration or aggregation, indicating their high colloidal stability, consistent with the DLS data and zeta potential measurement. The synthesized LDH showed hexagonal shape with a relatively uniform lateral size. Their sizes (25±12, 38±21, 68±24, and 64±28 nm for the four LDH NP samples, respectively) increase when the Mg/Fe ratios increase, a trend consistent with DLS results.
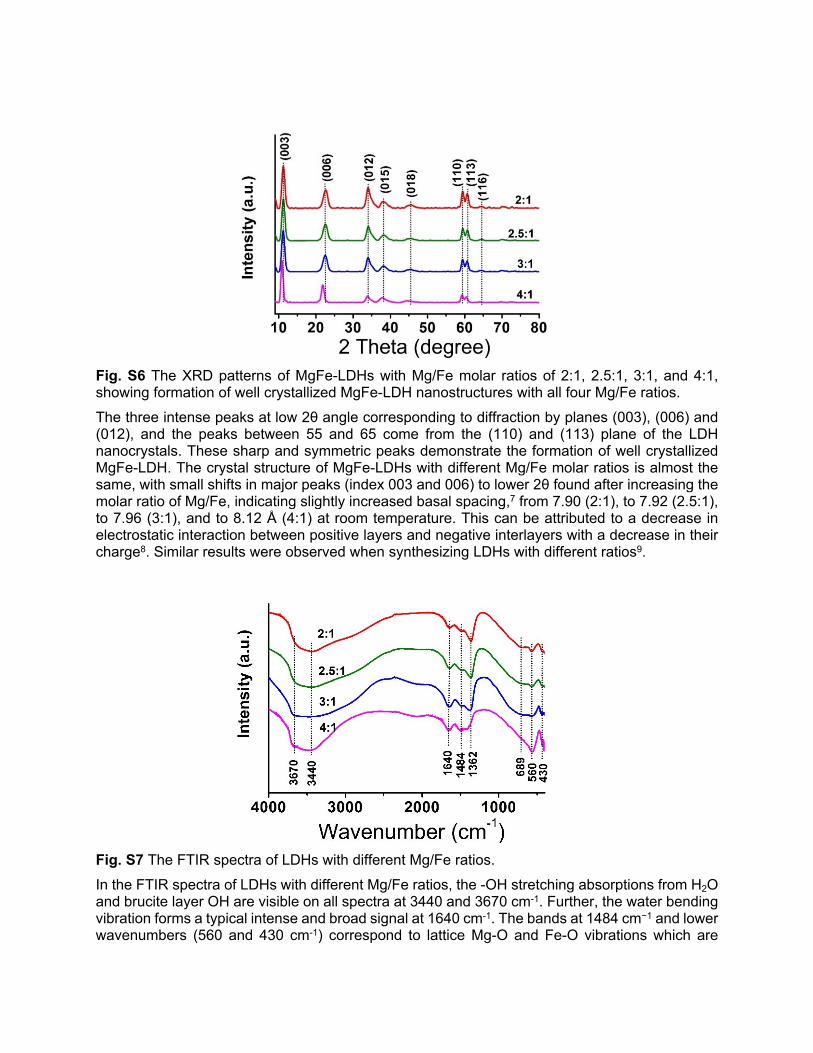
Fig. S6 The XRD patterns of MgFe-LDHs with Mg/Fe molar ratios of 2:1, 2.5:1, 3:1, and 4:1, showing formation of well crystallized MgFe-LDH nanostructures with all four Mg/Fe ratios.
The three intense peaks at low 2θ angle corresponding to diffraction by planes (003), (006) and (012), and the peaks between 55 and 65 come from the (110) and (113) plane of the LDH nanocrystals. These sharp and symmetric peaks demonstrate the formation of well crystallized MgFe-LDH. The crystal structure of MgFe-LDHs with different Mg/Fe molar ratios is almost the same, with small shifts in major peaks (index 003 and 006) to lower 2θ found after increasing the molar ratio of Mg/Fe, indicating slightly increased basal spacing,7 from 7.90 (2:1), to 7.92 (2.5:1), to 7.96 (3:1), and to 8.12 Å (4:1) at room temperature. This can be attributed to a decrease in electrostatic interaction between positive layers and negative interlayers with a decrease in their charge8. Similar results were observed when synthesizing LDHs with different ratios9.
Fig. S7 The FTIR spectra of LDHs with different Mg/Fe ratios.
In the FTIR spectra of LDHs with different Mg/Fe ratios, the -OH stretching absorptions from H2O and brucite layer OH are visible on all spectra at 3440 and 3670 cm-1. Further, the water bending vibration forms a typical intense and broad signal at 1640 cm-1. The bands at 1484 cm−1 and lower wavenumbers (560 and 430 cm-1) correspond to lattice Mg-O and Fe-O vibrations which are

typical for LDHs.10 In addition to these bands, an absorption peak at 1362 cm−1 appeared, which is attributed to the stretching modes of CO3
2−. The band at 689 cm-1 is attributed to the overlap of the asymmetric bending vibration of C–O. The LDH NPs may adsorb CO2 from the atmosphere during handling including washing, drying and preparation of KBr discs for FTIR measurement.
Fig. S8 The XRD patterns of MgFe-LDH (2:1), Fe3O4, Fe3O4@SiO2, and Fe3O4@SiO2@MgFe-LDH.
In the XRD patterns of the four nanomaterials (MgFe-LDH (2:1), Fe3O4, Fe3O4@SiO2, and Fe3O4@SiO2@MgFe-LDH), the diffraction peaks of Fe3O4 can be well indexed as a face-centered cubic (fcc) phase (JCPDS card 19-629). For Fe3O4@SiO2, the amorphous SiO2 characteristics generally found around 25 2θ, is distinctive, indicating the SiO2 coating was thin, which was further evidenced by TEM images (inset, Fig. 1B) and FTIR characteristics (Fig. S9). In the FTIR spectra of the Fe3O4@SiO2, the peak at 1078 cm-1 was assigned to the Si–O–Si asymmetric stretching vibration, which confirmed the formation of the silica shell on Fe3O4 surfaces. In the Fe3O4@SiO2@MgFe-LDH nanocomposite, all the characteristic diffraction peaks of both Fe3O4 (220, 311, 400, 511, and 440) and MgFe-LDH (003, 006, 012, and 110) can be clearly seen, demonstrating the successful assembly of the LDH NPs on the surface of Fe3O4@SiO2 NPs.
The TEM image (Fig. 1A-D, main text) shows that the Fe3O4 nanoparticles are spherical with a mean diameter of ∼186±29 nm (Fig. 1A). The crystalline was imaged with high resolution transmission electron microscopy (HR-TEM) (inset in Fig. 1A). Through hydrolysis and condensation of tetraethylorthosilicate in the ethanol–ammonia mixture, an amorphous silica thin layer of ∼10 nm in thickness (inset, Fig. 1B) was formed around each Fe3O4@SiO2 NP, leading to a core-shell structure (Fig. 1B) of 205±28 nm. The size change after silica coating was also shown by dynamic light scattering (DLS) from 194 nm (Fe3O4) to 212 nm (Fe3O4@SiO2), as shown in Fig. S1. The silica coating provides excellent dispersibility and re-dispersibility of the nanoparticles due to their abundant HO groups and negative surface charges. The negative charges not only provide high colloidal stability, but also guide the self-assembly of the LDH on the surfaces of the Fe3O4@SiO2 NPs. From the enlarged picture of Fig. 1D, the thickness of the LDH coating is generally around 30-50 nm; the final hydrodynamic diameter of each nanobot is ~278 nm as measured by DLS analysis (Fig. S1). The EDS spectrum of the Fe3O4@SiO2@MgFe-LDH (Fig. S2) showed the presence of Mg, Fe, and Si, consistent with the XRD results (Fig. S8), further confirming the successful preparation of the Fe3O4@SiO2@MgFe-LDH nanobots using the charge-induced self-assembly approach.
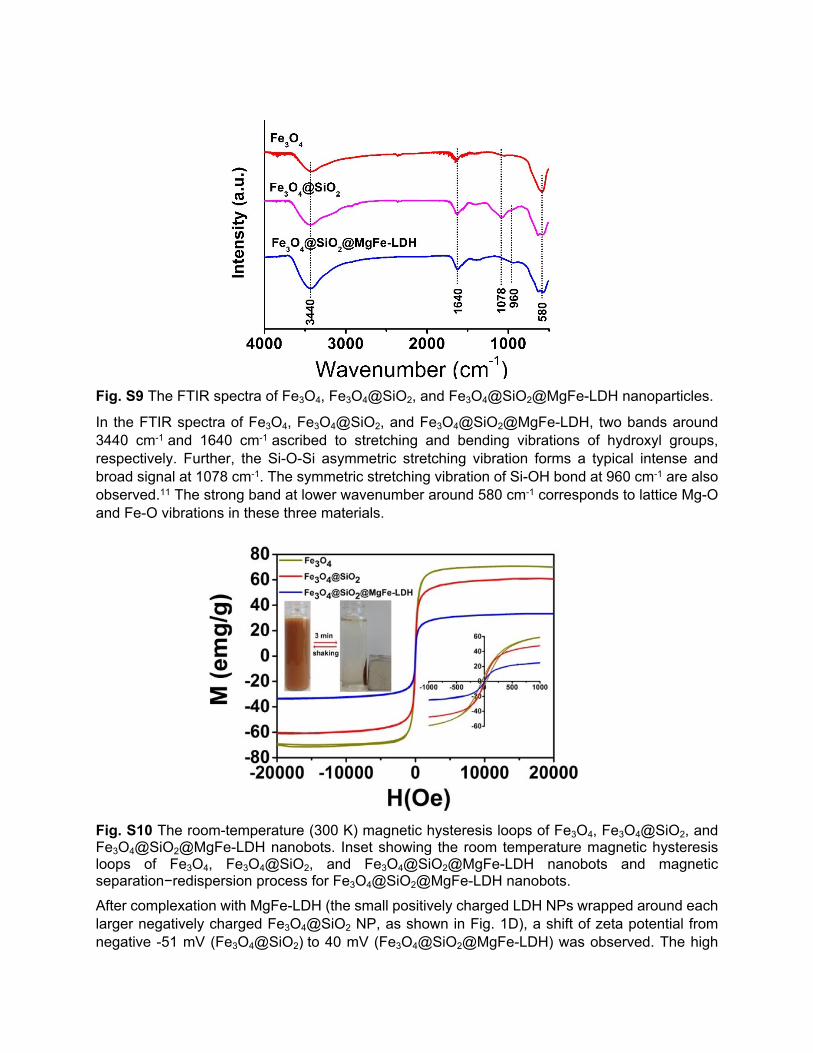
Fig. S9 The FTIR spectra of Fe3O4, Fe3O4@SiO2, and Fe3O4@SiO2@MgFe-LDH nanoparticles.
In the FTIR spectra of Fe3O4, Fe3O4@SiO2, and Fe3O4@SiO2@MgFe-LDH, two bands around 3440 cm-1 and 1640 cm-1 ascribed to stretching and bending vibrations of hydroxyl groups, respectively. Further, the Si-O-Si asymmetric stretching vibration forms a typical intense and broad signal at 1078 cm-1. The symmetric stretching vibration of Si-OH bond at 960 cm-1 are also observed.11 The strong band at lower wavenumber around 580 cm-1 corresponds to lattice Mg-O and Fe-O vibrations in these three materials.
Fig. S10 The room-temperature (300 K) magnetic hysteresis loops of Fe3O4, Fe3O4@SiO2, and Fe3O4@SiO2@MgFe-LDH nanobots. Inset showing the room temperature magnetic hysteresis loops of Fe3O4, Fe3O4@SiO2, and Fe3O4@SiO2@MgFe-LDH nanobots and magnetic separation−redispersion process for Fe3O4@SiO2@MgFe-LDH nanobots.
After complexation with MgFe-LDH (the small positively charged LDH NPs wrapped around each larger negatively charged Fe3O4@SiO2 NP, as shown in Fig. 1D), a shift of zeta potential from negative -51 mV (Fe3O4@SiO2) to 40 mV (Fe3O4@SiO2@MgFe-LDH) was observed. The high
positive zeta potential is an indication of colloidal stability. The saturation magnetization of the Fe3O4@SiO2@MgFe-LDH nanobots was measured using a vibrating sample magnetometer (VSM) at room temperature and was found to be 33.75 emu/g, notably lower than 71.5 emu/g of Fe3O4 and 60.7 emu/g of Fe3O4@SiO2 NPs, due to the non-magnetic MgFe-LDH coating on the surface. Hysteresis loops (inset, Fig. S10) confirmed the ferrimagnetic response of the bare Fe3O4 particles (non-zero remanent magnetization), and the superparamagnetism of Fe3O4@SiO2@MgFe-LDH nanobots (zero remanent magnetization). The paramagnetism of the loaded particles make them easy to separate from aqueous solution in the presence of an external magnetic field. Particles can be re-dispersed by vigorous shaking or sonication in the absence of a magnetic field, resulting in a brown-colored suspension (inset, Fig. S10). The ability to either collect or disperse the particles make them useful for practical applications.
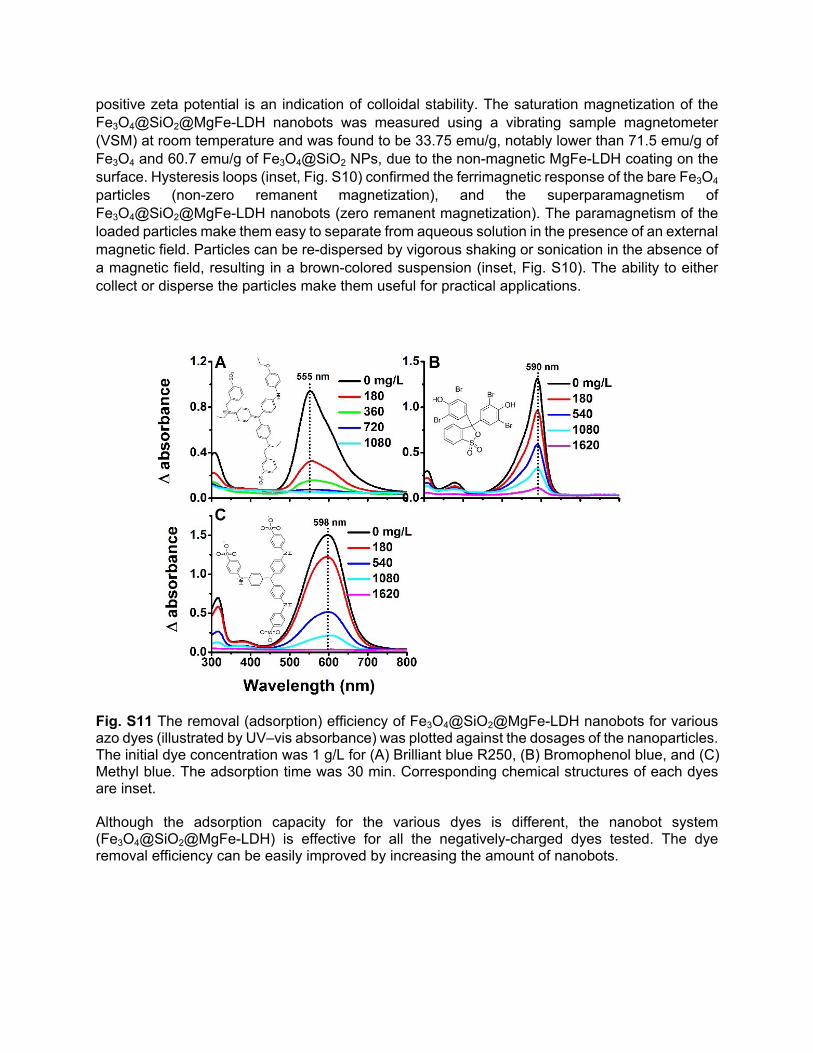
Fig. S11 The removal (adsorption) efficiency of Fe3O4@SiO2@MgFe-LDH nanobots for various azo dyes (illustrated by UV–vis absorbance) was plotted against the dosages of the nanoparticles. The initial dye concentration was 1 g/L for (A) Brilliant blue R250, (B) Bromophenol blue, and (C) Methyl blue. The adsorption time was 30 min. Corresponding chemical structures of each dyes are inset.
Although the adsorption capacity for the various dyes is different, the nanobot system (Fe3O4@SiO2@MgFe-LDH) is effective for all the negatively-charged dyes tested. The dye removal efficiency can be easily improved by increasing the amount of nanobots.
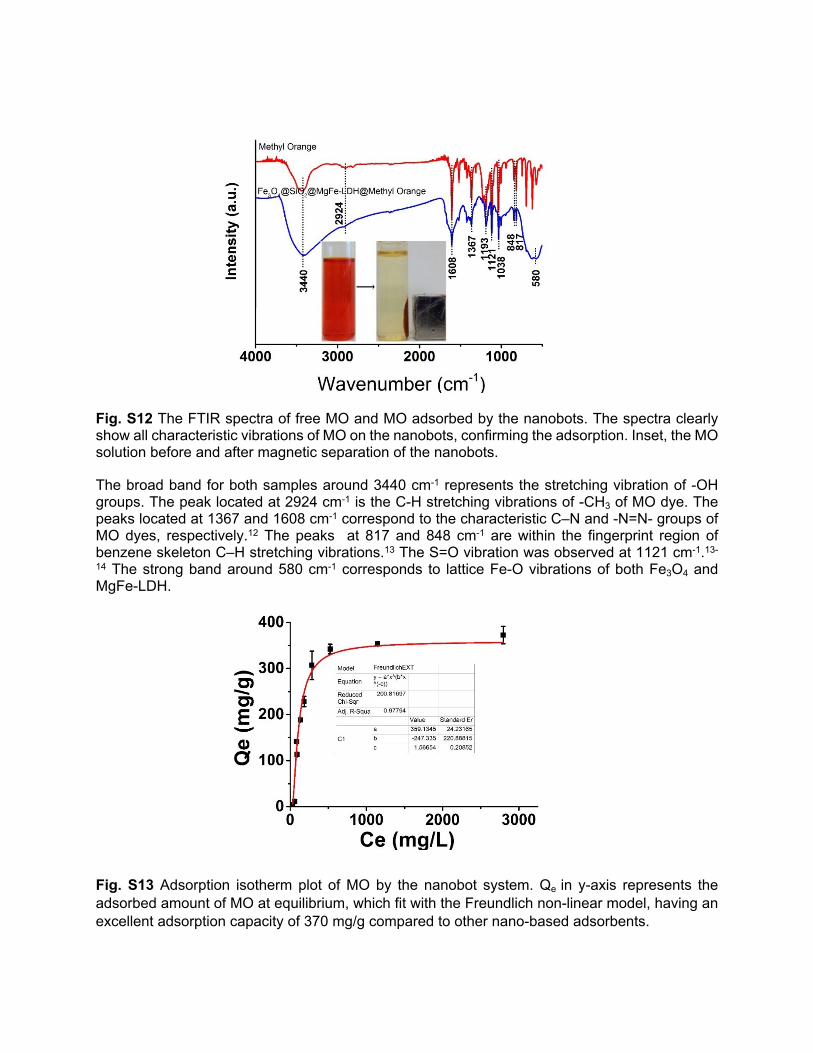
Fig. S12 The FTIR spectra of free MO and MO adsorbed by the nanobots. The spectra clearly show all characteristic vibrations of MO on the nanobots, confirming the adsorption. Inset, the MO solution before and after magnetic separation of the nanobots.
The broad band for both samples around 3440 cm-1 represents the stretching vibration of -OH groups. The peak located at 2924 cm-1 is the C-H stretching vibrations of -CH3 of MO dye. The peaks located at 1367 and 1608 cm-1 correspond to the characteristic C–N and -N=N- groups of MO dyes, respectively.12 The peaks at 817 and 848 cm-1 are within the fingerprint region of benzene skeleton C–H stretching vibrations.13 The S=O vibration was observed at 1121 cm-1.13-
14 The strong band around 580 cm-1 corresponds to lattice Fe-O vibrations of both Fe3O4 and MgFe-LDH.
Fig. S13 Adsorption isotherm plot of MO by the nanobot system. Qe in y-axis represents the adsorbed amount of MO at equilibrium, which fit with the Freundlich non-linear model, having an excellent adsorption capacity of 370 mg/g compared to other nano-based adsorbents.
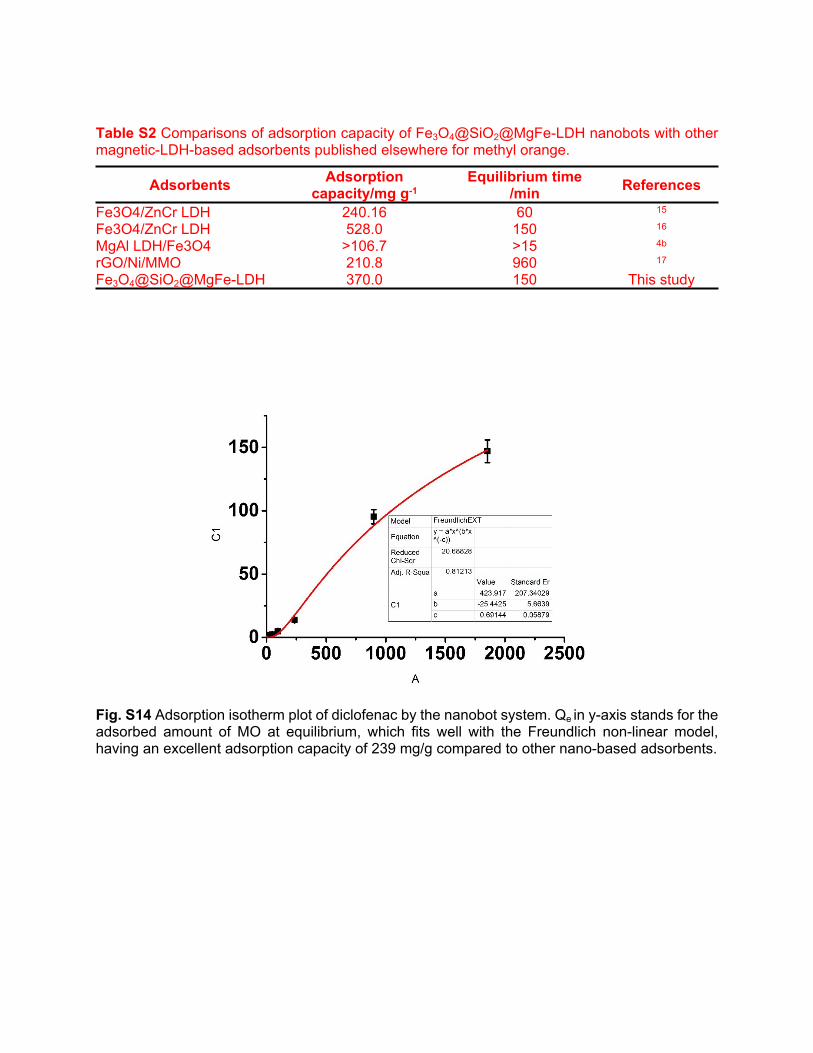
Table S2 Comparisons of adsorption capacity of Fe3O4@SiO2@MgFe-LDH nanobots with other magnetic-LDH-based adsorbents published elsewhere for methyl orange.
Adsorbents Adsorptioncapacity/mg g-1
Equilibrium time /min References
Fe3O4/ZnCr LDH 240.16 60 15
Fe3O4/ZnCr LDH 528.0 150 16
MgAl LDH/Fe3O4 >106.7 >15 4b
rGO/Ni/MMO 210.8 960 17
Fe3O4@SiO2@MgFe-LDH 370.0 150 This study
Fig. S14 Adsorption isotherm plot of diclofenac by the nanobot system. Qe in y-axis stands for the adsorbed amount of MO at equilibrium, which fits well with the Freundlich non-linear model, having an excellent adsorption capacity of 239 mg/g compared to other nano-based adsorbents.
0 10 20 30 40 50 60 700
20
40
60
80
Time (min)
% D
egra
datio
n
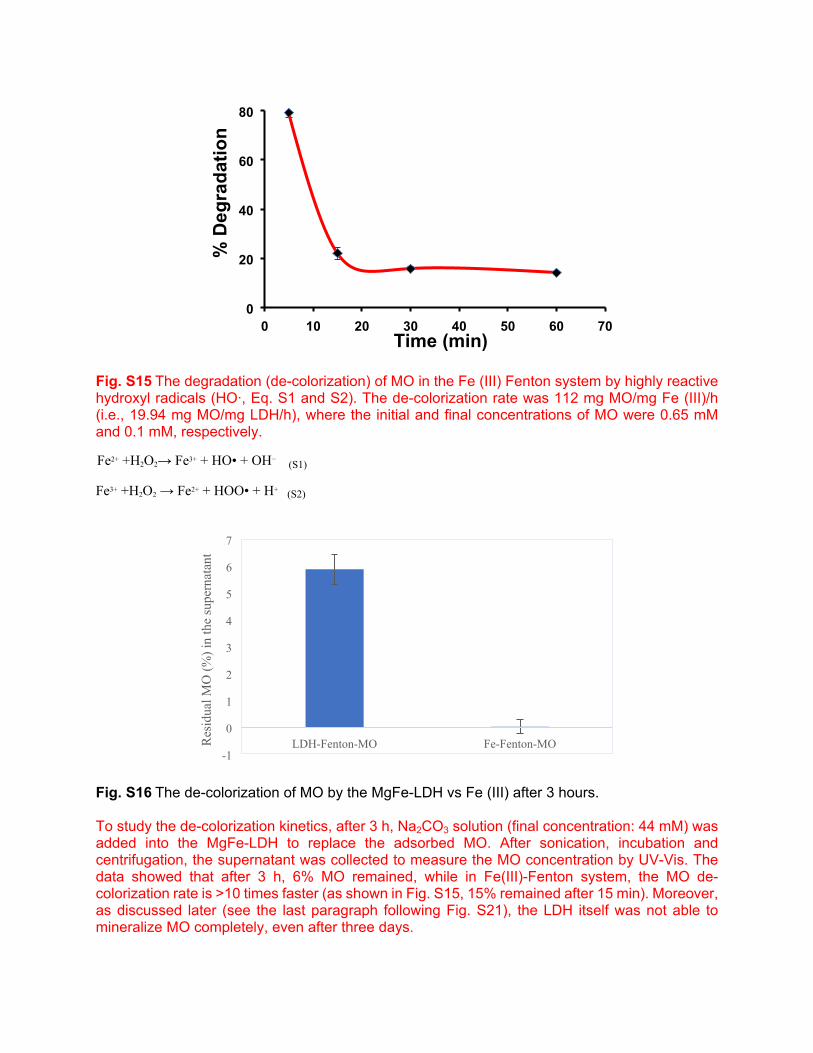
Fig. S15 The degradation (de-colorization) of MO in the Fe (III) Fenton system by highly reactive hydroxyl radicals (HO∙, Eq. S1 and S2). The de-colorization rate was 112 mg MO/mg Fe (III)/h (i.e., 19.94 mg MO/mg LDH/h), where the initial and final concentrations of MO were 0.65 mM and 0.1 mM, respectively.
Fe2+ +H2O2→ Fe3+ + HO• + OH−
(S1)
Fe3+ +H2O2 → Fe2+ + HOO• + H+ (S2)
LDH-Fenton-MO Fe-Fenton-MO-1
0
1
2
3
4
5
6
7
Res
idua
l MO
(%) i
n th
e su
pern
atan
t
Fig. S16 The de-colorization of MO by the MgFe-LDH vs Fe (III) after 3 hours.
To study the de-colorization kinetics, after 3 h, Na2CO3 solution (final concentration: 44 mM) was added into the MgFe-LDH to replace the adsorbed MO. After sonication, incubation and centrifugation, the supernatant was collected to measure the MO concentration by UV-Vis. The data showed that after 3 h, 6% MO remained, while in Fe(III)-Fenton system, the MO de-colorization rate is >10 times faster (as shown in Fig. S15, 15% remained after 15 min). Moreover, as discussed later (see the last paragraph following Fig. S21), the LDH itself was not able to mineralize MO completely, even after three days.
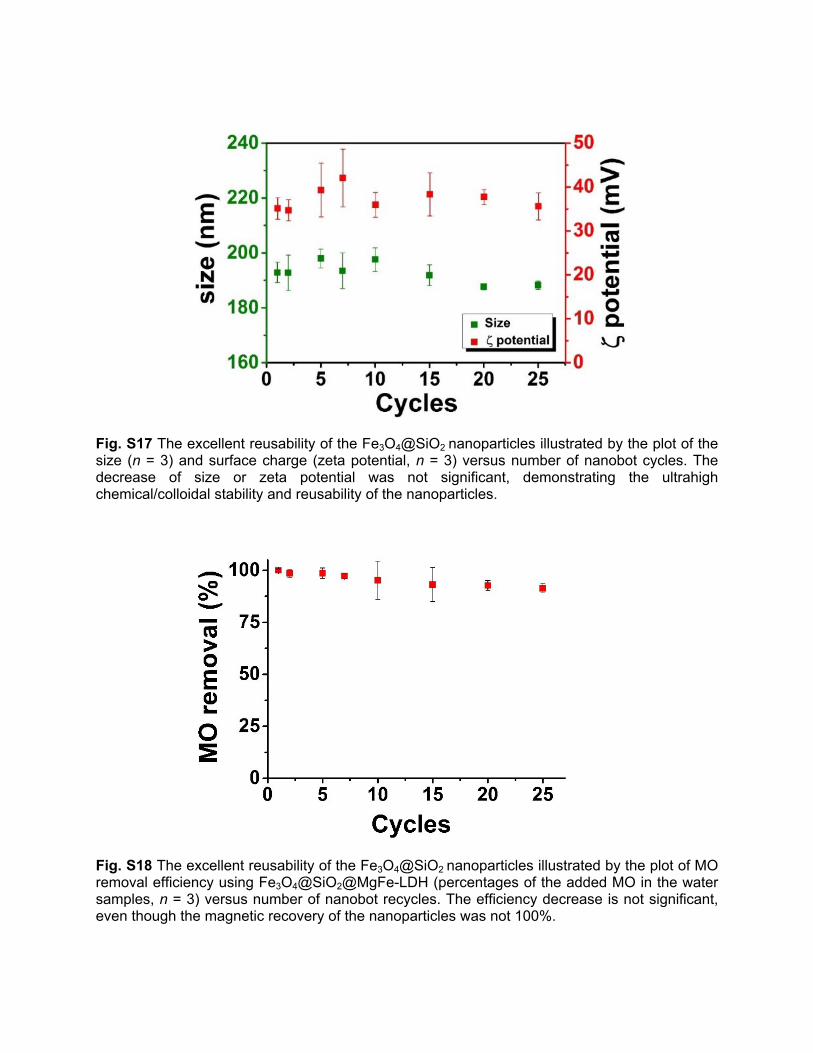
Fig. S17 The excellent reusability of the Fe3O4@SiO2 nanoparticles illustrated by the plot of the size (n = 3) and surface charge (zeta potential, n = 3) versus number of nanobot cycles. The decrease of size or zeta potential was not significant, demonstrating the ultrahigh chemical/colloidal stability and reusability of the nanoparticles.
Fig. S18 The excellent reusability of the Fe3O4@SiO2 nanoparticles illustrated by the plot of MO removal efficiency using Fe3O4@SiO2@MgFe-LDH (percentages of the added MO in the water samples, n = 3) versus number of nanobot recycles. The efficiency decrease is not significant, even though the magnetic recovery of the nanoparticles was not 100%.
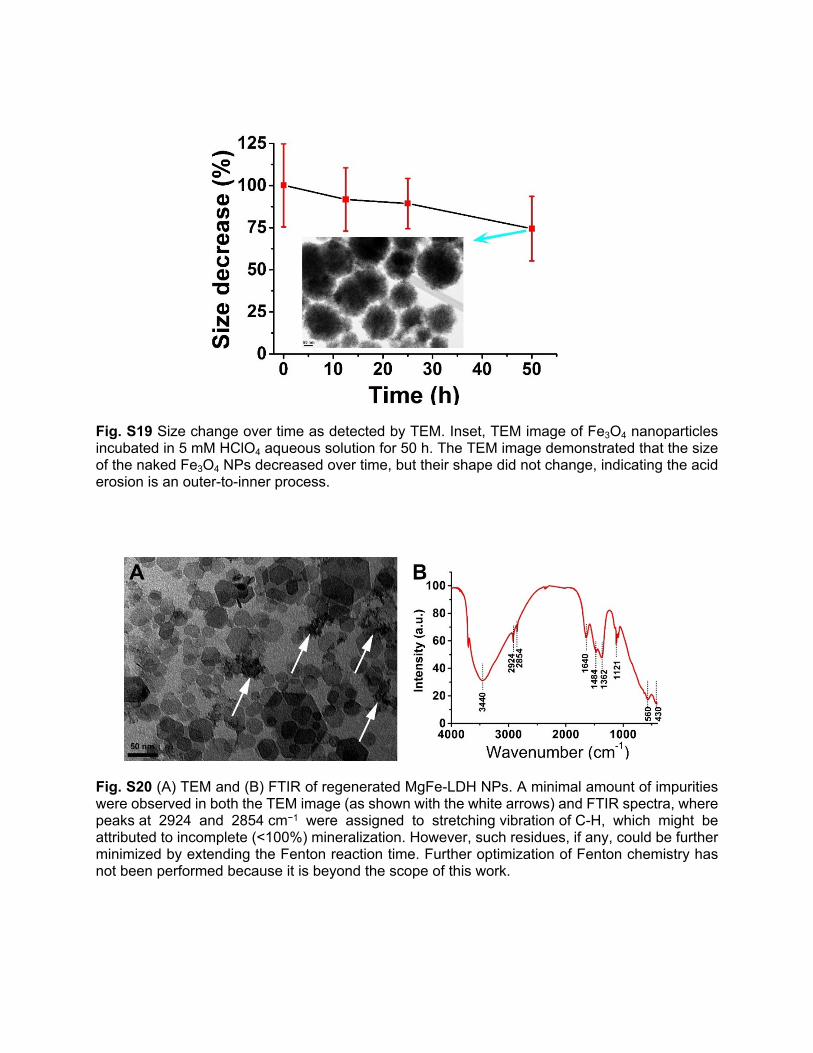
Fig. S19 Size change over time as detected by TEM. Inset, TEM image of Fe3O4 nanoparticles incubated in 5 mM HClO4 aqueous solution for 50 h. The TEM image demonstrated that the size of the naked Fe3O4 NPs decreased over time, but their shape did not change, indicating the acid erosion is an outer-to-inner process.
Fig. S20 (A) TEM and (B) FTIR of regenerated MgFe-LDH NPs. A minimal amount of impurities were observed in both the TEM image (as shown with the white arrows) and FTIR spectra, where peaks at 2924 and 2854 cm−1 were assigned to stretching vibration of C-H, which might be attributed to incomplete (<100%) mineralization. However, such residues, if any, could be further minimized by extending the Fenton reaction time. Further optimization of Fenton chemistry has not been performed because it is beyond the scope of this work.
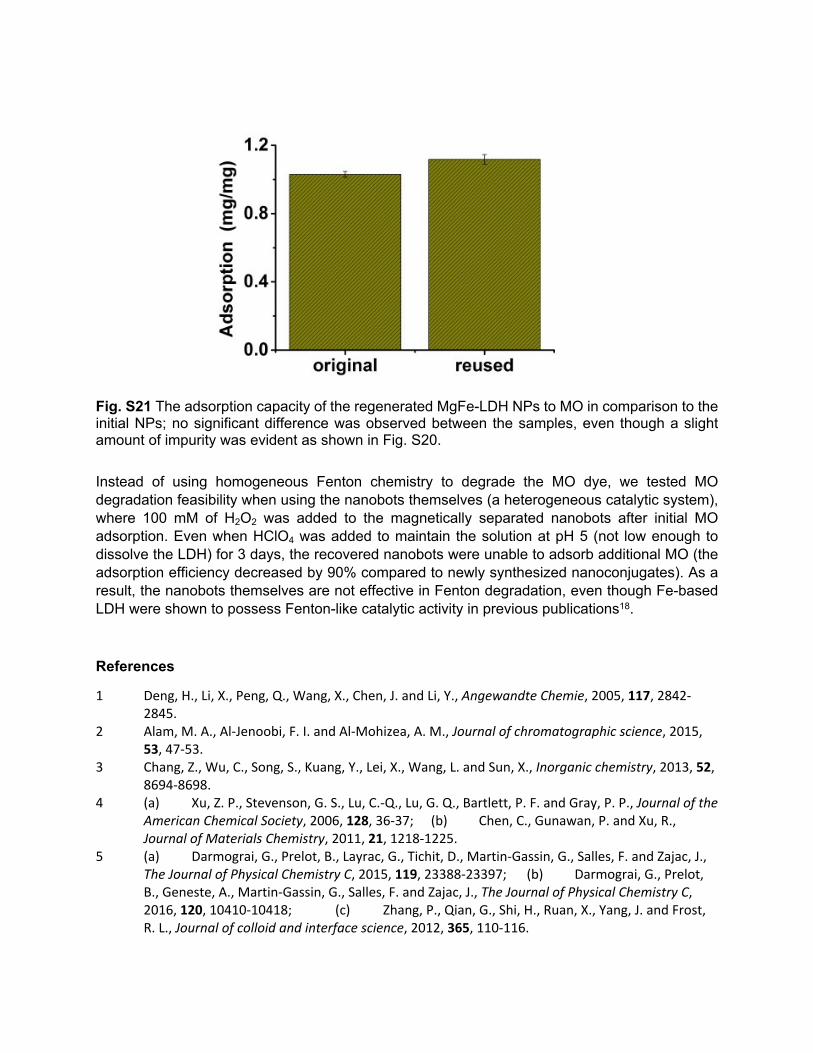
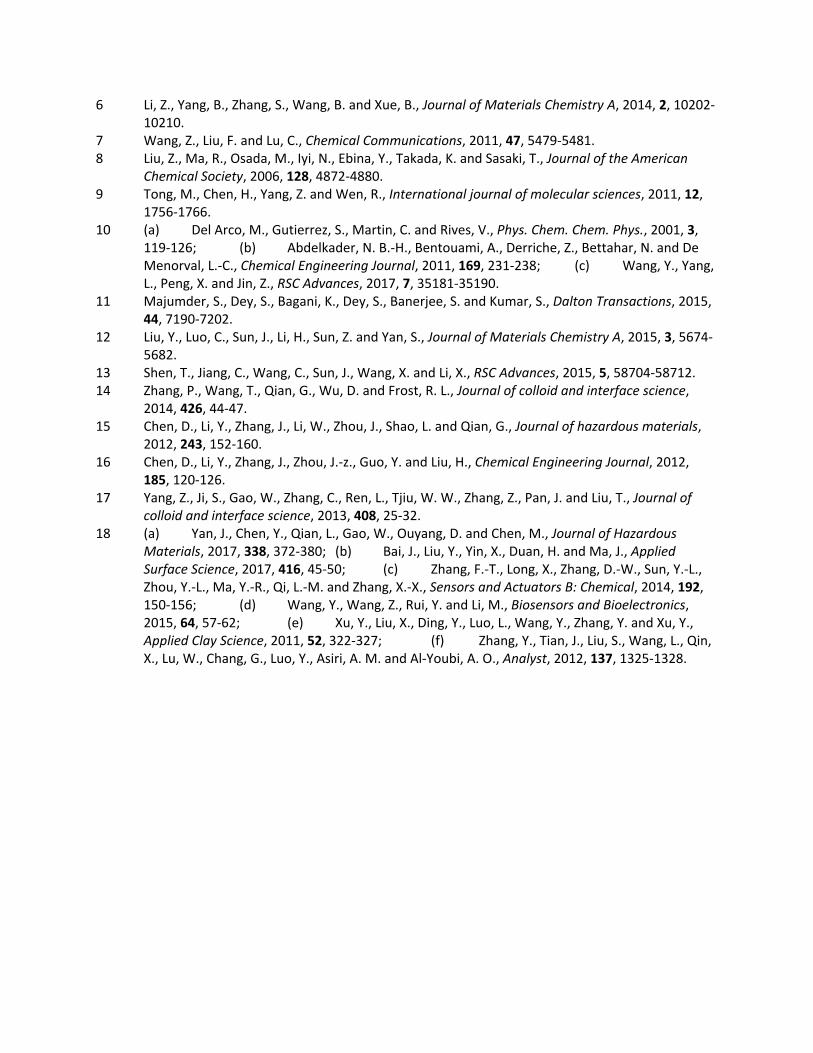
Fig. S21 The adsorption capacity of the regenerated MgFe-LDH NPs to MO in comparison to the initial NPs; no significant difference was observed between the samples, even though a slight amount of impurity was evident as shown in Fig. S20.
Instead of using homogeneous Fenton chemistry to degrade the MO dye, we tested MO degradation feasibility when using the nanobots themselves (a heterogeneous catalytic system), where 100 mM of H2O2 was added to the magnetically separated nanobots after initial MO adsorption. Even when HClO4 was added to maintain the solution at pH 5 (not low enough to dissolve the LDH) for 3 days, the recovered nanobots were unable to adsorb additional MO (the adsorption efficiency decreased by 90% compared to newly synthesized nanoconjugates). As a result, the nanobots themselves are not effective in Fenton degradation, even though Fe-based LDH were shown to possess Fenton-like catalytic activity in previous publications18.
References
1 Deng, H., Li, X., Peng, Q., Wang, X., Chen, J. and Li, Y., Angewandte Chemie, 2005, 117, 2842-2845.
2 Alam, M. A., Al-Jenoobi, F. I. and Al-Mohizea, A. M., Journal of chromatographic science, 2015, 53, 47-53.
3 Chang, Z., Wu, C., Song, S., Kuang, Y., Lei, X., Wang, L. and Sun, X., Inorganic chemistry, 2013, 52, 8694-8698.
4 (a) Xu, Z. P., Stevenson, G. S., Lu, C.-Q., Lu, G. Q., Bartlett, P. F. and Gray, P. P., Journal of the American Chemical Society, 2006, 128, 36-37; (b) Chen, C., Gunawan, P. and Xu, R., Journal of Materials Chemistry, 2011, 21, 1218-1225.
5 (a) Darmograi, G., Prelot, B., Layrac, G., Tichit, D., Martin-Gassin, G., Salles, F. and Zajac, J., The Journal of Physical Chemistry C, 2015, 119, 23388-23397; (b) Darmograi, G., Prelot, B., Geneste, A., Martin-Gassin, G., Salles, F. and Zajac, J., The Journal of Physical Chemistry C, 2016, 120, 10410-10418; (c) Zhang, P., Qian, G., Shi, H., Ruan, X., Yang, J. and Frost, R. L., Journal of colloid and interface science, 2012, 365, 110-116.
6 Li, Z., Yang, B., Zhang, S., Wang, B. and Xue, B., Journal of Materials Chemistry A, 2014, 2, 10202-10210.
7 Wang, Z., Liu, F. and Lu, C., Chemical Communications, 2011, 47, 5479-5481.8 Liu, Z., Ma, R., Osada, M., Iyi, N., Ebina, Y., Takada, K. and Sasaki, T., Journal of the American
Chemical Society, 2006, 128, 4872-4880.9 Tong, M., Chen, H., Yang, Z. and Wen, R., International journal of molecular sciences, 2011, 12,
1756-1766.10 (a) Del Arco, M., Gutierrez, S., Martin, C. and Rives, V., Phys. Chem. Chem. Phys., 2001, 3,
119-126; (b) Abdelkader, N. B.-H., Bentouami, A., Derriche, Z., Bettahar, N. and De Menorval, L.-C., Chemical Engineering Journal, 2011, 169, 231-238; (c) Wang, Y., Yang, L., Peng, X. and Jin, Z., RSC Advances, 2017, 7, 35181-35190.
11 Majumder, S., Dey, S., Bagani, K., Dey, S., Banerjee, S. and Kumar, S., Dalton Transactions, 2015, 44, 7190-7202.
12 Liu, Y., Luo, C., Sun, J., Li, H., Sun, Z. and Yan, S., Journal of Materials Chemistry A, 2015, 3, 5674-5682.
13 Shen, T., Jiang, C., Wang, C., Sun, J., Wang, X. and Li, X., RSC Advances, 2015, 5, 58704-58712.14 Zhang, P., Wang, T., Qian, G., Wu, D. and Frost, R. L., Journal of colloid and interface science,
2014, 426, 44-47.15 Chen, D., Li, Y., Zhang, J., Li, W., Zhou, J., Shao, L. and Qian, G., Journal of hazardous materials,
2012, 243, 152-160.16 Chen, D., Li, Y., Zhang, J., Zhou, J.-z., Guo, Y. and Liu, H., Chemical Engineering Journal, 2012,
185, 120-126.17 Yang, Z., Ji, S., Gao, W., Zhang, C., Ren, L., Tjiu, W. W., Zhang, Z., Pan, J. and Liu, T., Journal of
colloid and interface science, 2013, 408, 25-32.18 (a) Yan, J., Chen, Y., Qian, L., Gao, W., Ouyang, D. and Chen, M., Journal of Hazardous
Materials, 2017, 338, 372-380; (b) Bai, J., Liu, Y., Yin, X., Duan, H. and Ma, J., Applied Surface Science, 2017, 416, 45-50; (c) Zhang, F.-T., Long, X., Zhang, D.-W., Sun, Y.-L., Zhou, Y.-L., Ma, Y.-R., Qi, L.-M. and Zhang, X.-X., Sensors and Actuators B: Chemical, 2014, 192, 150-156; (d) Wang, Y., Wang, Z., Rui, Y. and Li, M., Biosensors and Bioelectronics, 2015, 64, 57-62; (e) Xu, Y., Liu, X., Ding, Y., Luo, L., Wang, Y., Zhang, Y. and Xu, Y., Applied Clay Science, 2011, 52, 322-327; (f) Zhang, Y., Tian, J., Liu, S., Wang, L., Qin, X., Lu, W., Chang, G., Luo, Y., Asiri, A. M. and Al-Youbi, A. O., Analyst, 2012, 137, 1325-1328.