Embed Size (px)
Citation preview

Supporting information for:
DFTB Parameters for the Periodic Table, Part
2: Energies and Energy Gradients from
Hydrogen to Calcium
Augusto F. Oliveira,† Pier Philipsen,‡ and Thomas Heine∗,¶,†
Dept. of Physics & Earth Sciences, Jacobs University Bremen, Campus Ring 1,
28759 Bremen, Germany , Scientific Computing & Modelling NV, Theoretical Chemistry,
Vrije Universiteit, De Boelelaan 1083, 1081HV Amsterdam, The Netherlands , and
Wilhelm-Ostwald-Institut für Physikalische und Theoretische Chemie, Universität Leipzig,
Linnéstr. 2, 04103 Leipzig, Germany
E-mail: [email protected]
1 Benchmark test details
Here we present the results of the validation calculations for the QUASINANO2015
parameterization of DFTB. The benchmark tests are organized in 6 groups:
Allotropes finite and periodic elementary species;∗To whom correspondence should be addressed†Jacobs University Bremen‡Scientific Computing & Modelling¶Universität Leipzig
S1

G2/97∪G3/05 MP2(full)/6-31G* geometries of closed-shell species from the G2/97S1,S2
and G3/05S3 test sets (these geometries have been used as obtained from the original
publications);
G1G17 crystal structures and diatomic molecules of alkali metal halides, as well as diatomic
molecules of hydrogen halides and alkali metal hydrides;
G2G16 periodic and finite species of alkaline earth oxides and sulfides;
BN boron nitride systems;
SiO silicon oxide systems.
Except for the G2/97∪G3/05 set, all benchmarks tests consist of PBE/TZP geome-
tries calculated with either ADF2014S4–S6 (finite structures) or BAND2014S7–S11 (periodic
systems).
For each test structure, the mean absolute percent deviations (MAPDs) and the mean
signed percent deviations (MSPD) of bond lengths and bond angles have been calculated
according to
MAPD =1
N
N∑i
∣∣∣∣Xcalci −Xref
i
Xrefi
∣∣∣∣ , (1)
and
MSPD =1
N
N∑i
Xcalci −Xref
i
Xrefi
, (2)
where Xcalci and Xref
i are the calculated and reference values, respectively, of the N bond
lengths (or bond angles, depending on the case) in the test system.
The DFTB geometry optimizations have been performed with ADFDFTB2014S12 using
the reference structure as initial guess (PBE/TZP, or MP2(full)/6-31G*, depending on the
test set). Geometries not converged within 150 optimization cycles have been counted as
failed cases; in this situation, the MAPDs and MSPDs are not calculated.
In addition to matsci-0-3, mio-1-1, and QUASINANO2015 (this work) parameters,
the results for non-optimized parameters are provided for reference. In the non-optimized
S2

set, the confinement potentials of the QUASINANO2013.1S13 electronic terms are used for
both the electronic and repulsion energy contributions.
The PM7S14 geometry optimizations have been conducted witih the MOPACS14,S15 pro-
gram, using the default settings.
Notes:
• MAPDs and MSPDs have not been calculated for geometries that did not converge
within the procedure described above and, thus, are not shown in the graphs.
• The BN and SiO test sets are too small and therefore their error distributions have
not been plotted.
S3
lengths lengths lengths lengths lengthsangles angles angles angles angles
0
10
20
30
40
MA
PD/
%
N=62 N=38 N=40 N=28 N=30 N=23 N=68 N=44 N=68 N=44
Allotropes
PM7 matsci-0-3 mio-1-1 Non-Optd. QN15
lengths lengths lengths lengths lengthsangles angles angles angles angles
−40
−20
0
20
40
MSP
D/
%
N=62 N=38 N=40 N=28 N=30 N=23 N=68 N=44 N=68 N=44
Allotropes
PM7 matsci-0-3 mio-1-1 Non-Optd. QN15
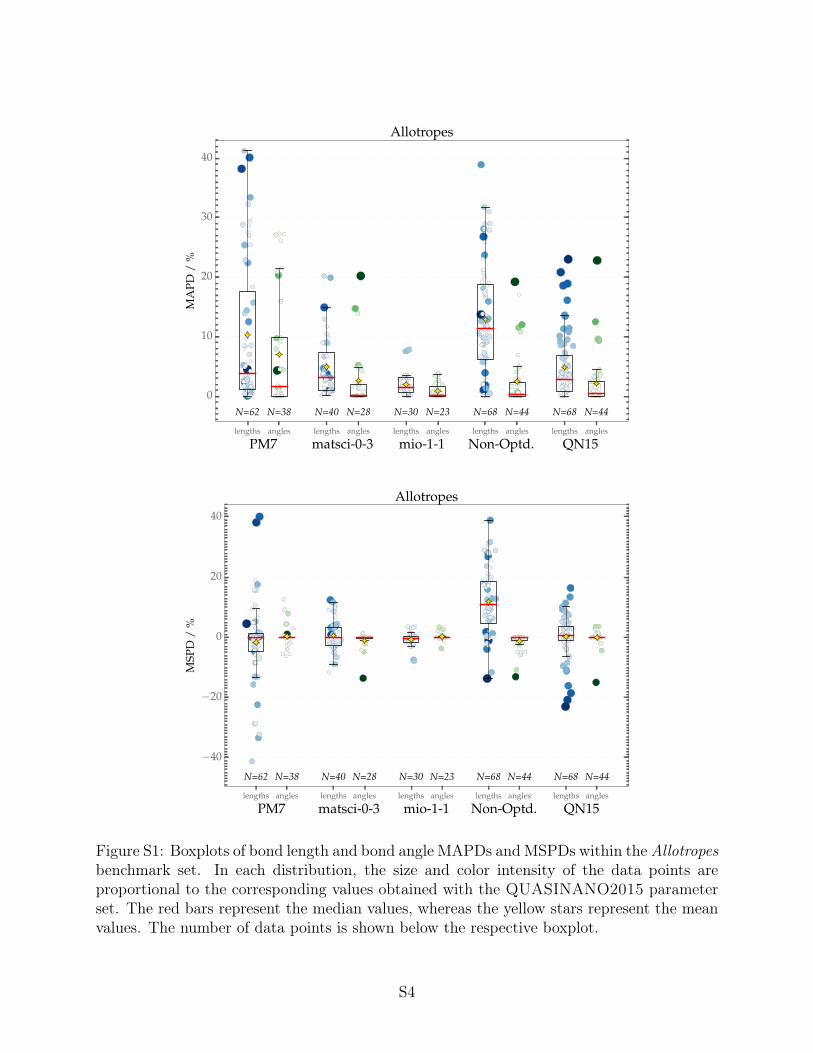
Figure S1: Boxplots of bond length and bond angle MAPDs and MSPDs within theAllotropesbenchmark set. In each distribution, the size and color intensity of the data points areproportional to the corresponding values obtained with the QUASINANO2015 parameterset. The red bars represent the median values, whereas the yellow stars represent the meanvalues. The number of data points is shown below the respective boxplot.
S4

lengths lengths lengths lengths lengthsangles angles angles angles angles
0
10
20
30
40
50
MA
PD/
%
N=225 N=187 N=122 N=112 N=127 N=117 N=225 N=187 N=225 N=187
G2/97∪G3/05
PM7 matsci-0-3 mio-1-1 Non-Optd. QN15
lengths lengths lengths lengths lengthsangles angles angles angles angles
−40
−20
0
20
40
MSP
D/
%
N=225 N=187 N=122 N=112 N=127 N=117 N=225 N=187 N=225 N=187
G2/97∪G3/05
PM7 matsci-0-3 mio-1-1 Non-Optd. QN15
Figure S2: Boxplots of bond length and bond angle MAPDs and MSPDs within theG2/97∪G3/05 benchmark set. In each distribution, the size and color intensity of the datapoints are proportional to the corresponding values obtained with the QUASINANO2015parameter set. The red bars represent the median values, whereas the yellow stars representthe mean values. The number of data points is shown below the respective boxplot. Datanot shown: 94% MAPD and MSPD for SiH2 (silylene) bond angles with PM7; 121% MAPDand 87% MSPD for O3 (ozone) bond lengths with matsci-0-3.
S5

lengths lengths lengthsangles angles angles
0
10
20
30
40
MA
PD/
%
N=24 N=9 N=25 N=10 N=25 N=10
G1G17
PM7 Non-Optd. QN15
lengths lengths lengthsangles angles angles
−40
−30
−20
−10
0
10
20
30
MSP
D/
%
N=24 N=9 N=25 N=10 N=25 N=10
G1G17
PM7 Non-Optd. QN15
Figure S3: Boxplots of bond length and bond angle MAPDs and MSPDs within the G1G17benchmark set. In each distribution, the size and color intensity of the data points areproportional to the corresponding values obtained with the QUASINANO2015 parameterset. The red bars represent the median values, whereas the yellow stars represent the meanvalues. The number of data points is shown below the respective boxplot.
S6
lengths lengths lengthsangles angles angles
0
10
20
30
40
MA
PD/
%
N=11 N=5 N=12 N=6 N=12 N=6
G2G16
PM7 Non-Optd. QN15
lengths lengths lengthsangles angles angles
−10
0
10
20
30
40
MSP
D/
%
N=11 N=5 N=12 N=6 N=12 N=6
G2G16
PM7 Non-Optd. QN15
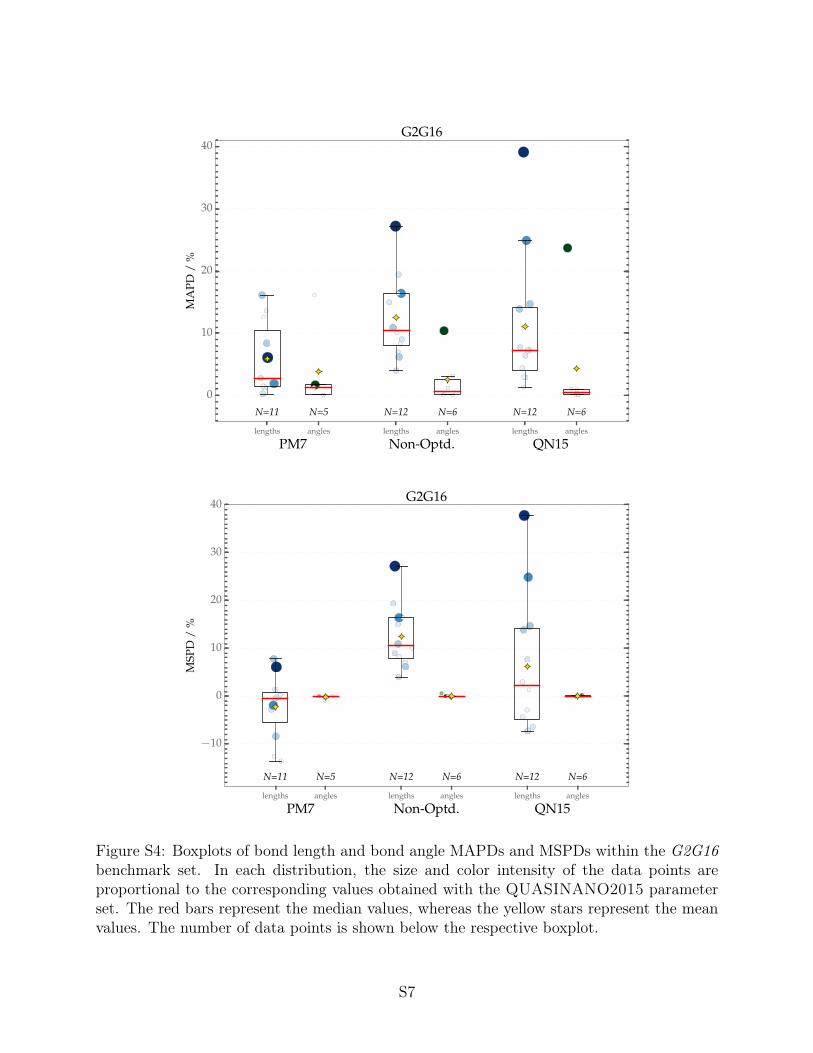
Figure S4: Boxplots of bond length and bond angle MAPDs and MSPDs within the G2G16benchmark set. In each distribution, the size and color intensity of the data points areproportional to the corresponding values obtained with the QUASINANO2015 parameterset. The red bars represent the median values, whereas the yellow stars represent the meanvalues. The number of data points is shown below the respective boxplot.
S7

References
(S1) Curtiss, L. A.; Raghavachari, K.; Redfern, P. C.; Pople, J. A. J. Chem. Phys. 1997,
106, 1063–1079.
(S2) Curtiss, L. A.; Redfern, P. C.; Raghavachari, K.; Pople, J. A. J. Chem. Phys. 1998,
109, 42–55.
(S3) Curtiss, L. A.; Redfern, P. C.; Raghavachari, K. J. Chem. Phys. 2005, 123, 124107.
(S4) Baerends, E. J.; Ziegler, T.; Autschbach, J.; Bashford, D.; Bérces, A.; Bickel-
haupt, F. M.; Bo, C.; Boerrigter, P. M.; Cavallo, L.; Chong, D. P.; Deng, L.; Dick-
son, R. M.; Ellis, D. E.; van Faassen, M.; Fan, L.; Fischer, T. H.; Fonseca Guerra, C.;
Franchini, M.; Ghysels, A.; Giammona, A.; van Gisbergen, S. J. A.; Götz, A. W.;
Groeneveld, J. A.; Gritsenko, O. V.; Grüning, M.; Gusarov, S.; Harris, F. E.; van den
Hoek, P.; Jacob, C. R.; Jacobsen, H.; Jensen, L.; Kaminski, J. W.; van Kessel, G.;
Kootstra, F.; Kovalenko, A.; Krykunov, M. V.; van Lenthe, E.; McCormack, D. A.;
Michalak, A.; Mitoraj, M.; Morton, S. M.; Neugebauer, J.; Nicu, V. P.; Noodleman, L.;
Osinga, V. P.; Patchkovskii, S.; Pavanello, M.; Philipsen, P. H. T.; Post, D.; Pye, C. C.;
Ravenek, W.; Rodr ’i guez, J. I.; Ros, P.; Schipper, P. R. T.; van Schoot, H.; Schreck-
enbach, G.; Seldenthuis, J. S.; Seth, M.; Snijders, J. G.; Solà, M.; Swart, M.; Swer-
hone, D.; te Velde, G.; Vernooijs, P.; Versluis, L.; Visscher, L.; Visser, O.; Wang, F.;
Wesolowski, T. A.; van Wezenbeek, E. M.; Wiesenekker, G.; Wolff, S. K.; Woo, T. K.;
Yakovlev, A. L. ADF2014 ; SCM, Theoretical Chemistry, Vrije Universiteit, Amster-
dam, The Netherlands, 2014.
(S5) Guerra, C. F.; Snijders, J. G.; te Velde, G. Theor. Chem. Acc. 1998, 99, 391–403.
(S6) te Velde, G.; Bickelhaupt, F. M.; Baerends, E. J.; Guerra, C. F.; Van Gisbergen, S.;
Snijders, J. G.; Ziegler, T. J. Comput. Chem. 2001, 22, 931–967.
S8

(S7) Philipsen, P. H. T.; te Velde, G.; Baerends, E. J.; Berger, J. A.; de Boeij, P. L.;
Franchini, M.; Groeneveld, J. A.; Kadantsev, E. S.; Klooster, R.; Kootstra, F.; Ro-
maniello, P.; Skachkov, D. G.; Snijders, J. G.; Verzijl, C. J. O.; Wiesenekker, G.;
Ziegler, T. BAND2014 ; SCM, Theoretical Chemistry, Vrije Universiteit, Amsterdam,
The Netherlands, 2014.
(S8) te Velde, G.; Baerends, E. J. Phys. Rev. B 1991, 44, 7888–7903.
(S9) Wiesenekker, G.; Baerends, E. J. J. Phys.: Condens. Matter 1999, 3, 6721–6742.
(S10) Franchini, M.; Philipsen, P. H. T.; Visscher, L. J. Comput. Chem. 2013, 34, 1819–
1827.
(S11) Franchini, M.; Philipsen, P. H. T.; van Lenthe, E.; Visscher, L. J. Chem. Theory
Comput. 2014, 10, 1994–2004.
(S12) Yakovlev, A.; Philipsen, P.; Borini, S.; Rüger, R.; de Reus, M.; Ghorbani-Asl, M.;
McCormack, D.; Patchkovskii, S.; Heine, T. ADF DFTB 2014 ; SCM, Theoretical
Chemistry, Vrije Universiteit, Amsterdam, The Netherlands, 2014.
(S13) Wahiduzzaman, M.; Oliveira, A. F.; Philipsen, P.; Zhechkov, L.; van Lenthe, E.;
Witek, H. A.; Heine, T. J. Chem. Theory Comput. 2013, 9, 4006–4017.
(S14) Stewart, J. J. P. J. Mol. Model. 2012, 19, 1–32.
(S15) Stewart, J. J. P. MOPAC2012 ; Stewart Computational Chemistry, Colorado Springs,
CO, USA, 2012.
S9


![[PPT]Introduction to DFTB+ in Material Studio 6.0 · Web viewDFTB Why DFTB? Basic theory DFTB Performance DFTB+ in Materials Studio Energy, Geometry, Dynamics, Parameterization Parameterization](https://img.dokumen.tips/doc/110x75/5aa9ae877f8b9a9a188d4425/pptintroduction-to-dftb-in-material-studio-60-viewdftb-why-dftb-basic-theory.jpg)