Embed Size (px)
Citation preview

S1
Supporting information for
Aminophosphine Ligands as a Privileged Platform for Development of Antitumoral Ruthenium(II) Arene Complexes
Lewis Marc Broomfield,[a] Carlos Alonso-Moreno, * [b] Eddy Martin,[a] Alexandr Shafir,*[a]
Inmaculada Posadas,*[c,d] Valentín Ceña,[c,e] José A. Castro-Osma[b]
[a] Institute of Chemical Research of Catalonia (ICIQ), The Barcelona Institute of Science and Technology, Av. Països Catalans 16, 43007 Tarragona, Spain
[b] Departamento de Química Inorgánica, Orgánica y Bioquímica, Facultad de Farmacia, Universidad de Castilla-La Mancha, Campus Universitario, 02071-Albacete, Spain.
[c] CIBERNED, Instituto de Salud Carlos III, Madrid, Spain.
[d] Unidad Asociada Neurodeath CSIC-UCLM, Departamento de Ciencias Médicas, Facultad de Farmacia, Universidad de Castilla-La Mancha, Campus Universitario de Albacete, 02071-Albacete, Spain.
[e] Unidad Asociada Neurodeath CSIC-UCLM, Departamento de Ciencias Médicas, Facultad de Medicina, Universidad de Castilla-La Mancha, Campus Universitario de Albacete, 02071-Albacete, Spain.
Index.
1. Equipment for general procedure2. X-ray crystallographic structure determination3. NMR spectra4. HRMS spectra
Electronic Supplementary Material (ESI) for Dalton Transactions.This journal is © The Royal Society of Chemistry 2017

S2
1. Equipment for general procedure.
Routine NMR spectra were recorded on a Bruker-Avance-400-Ultrashield spectrometer equipped with a BBFO plus SmartProbe. 1H- and 13C{1H}-NMR chemical shifts (δ) are given in ppm relative to TMS. Routine GC-MS analyses were recorded on an Agilent 7890B chromatograph equipped with an Agilent 5977A MSD detector. Additional mass spectra were recorded on a Waters Micromass LCT Premier (ESI). A Bruker-Nonius diffractometer equipped with an Apex II 4K CCD area detector was used for single-crystal diffraction.
2. X-ray crystallographic structure determination.
Table S1. Crystallographic details for Ru1
Crystal data and structure refinement for LB135_25._____________________________________________________________________Identification code LB135_25Empirical formula C52 H62 Cl16 N2 P2 Ru2 Formula weight 1546.31Temperature 100(2) KWavelength 0.71073 ÅCrystal system TriclinicSpace group P-1 Unit cell dimensions a = 10.9333(17)Å α= 69.559(4)°.
b = 11.2468(15)Å β = 77.274(5)°.c = 14.0128(17)Å γ = 84.437(5)°.
Volume 1574.5(4) Å3Z 1Density (calculated) 1.631 Mg/m3
Absorption coefficient 1.246 mm-1F(000) 778Crystal size 0.06 x 0.05 x 0.02 mm3Theta range for data collection 1.583 to 25.164°.Index ranges -12<=h<=13,-12<=k<=13,0<=l<=16Reflections collected 5477Independent reflections 5477[R(int) = 0.0724]Completeness to theta =25.164° 97.2% Absorption correction EmpiricalMax. and min. transmission 0.976 and 0.733Refinement method Full-matrix least-squares on F2Data / restraints / parameters 5477/ 312/ 375Goodness-of-fit on F2 1.144Final R indices [I>2sigma(I)] R1 = 0.0885, wR2 = 0.2374R indices (all data) R1 = 0.1087, wR2 = 0.2490Largest diff. peak and hole 1.950 and -2.003 e.Å-
S3
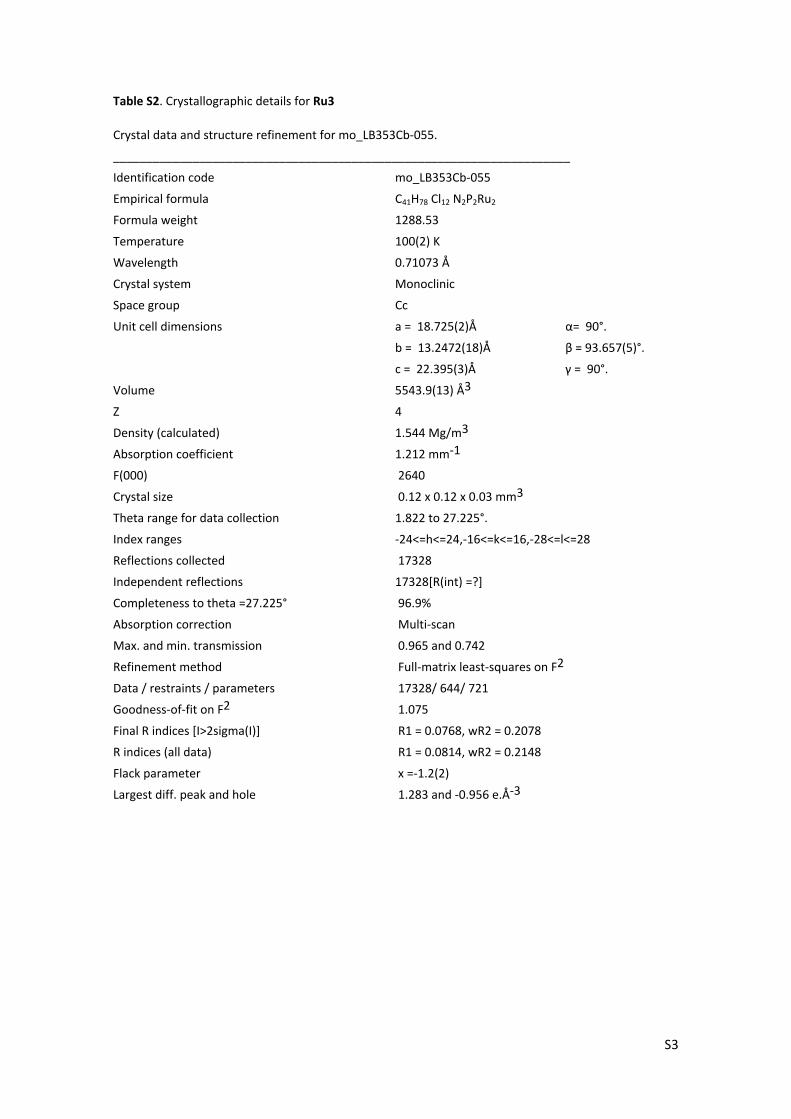
Table S2. Crystallographic details for Ru3
Crystal data and structure refinement for mo_LB353Cb-055.
_____________________________________________________________________
Identification code mo_LB353Cb-055
Empirical formula C41H78 Cl12 N2P2Ru2
Formula weight 1288.53
Temperature 100(2) K
Wavelength 0.71073 Å
Crystal system Monoclinic
Space group Cc
Unit cell dimensions a = 18.725(2)Å α= 90°.
b = 13.2472(18)Å β = 93.657(5)°.
c = 22.395(3)Å γ = 90°.
Volume 5543.9(13) Å3
Z 4
Density (calculated) 1.544 Mg/m3
Absorption coefficient 1.212 mm-1
F(000) 2640
Crystal size 0.12 x 0.12 x 0.03 mm3
Theta range for data collection 1.822 to 27.225°.
Index ranges -24<=h<=24,-16<=k<=16,-28<=l<=28
Reflections collected 17328
Independent reflections 17328[R(int) =?]
Completeness to theta =27.225° 96.9%
Absorption correction Multi-scan
Max. and min. transmission 0.965 and 0.742
Refinement method Full-matrix least-squares on F2
Data / restraints / parameters 17328/ 644/ 721
Goodness-of-fit on F2 1.075
Final R indices [I>2sigma(I)] R1 = 0.0768, wR2 = 0.2078
R indices (all data) R1 = 0.0814, wR2 = 0.2148
Flack parameter x =-1.2(2)
Largest diff. peak and hole 1.283 and -0.956 e.Å-3

S4
Table S3. Crystallographic details for Ru5
Crystal data and structure refinement for mo_LB337_04.
_____________________________________________________________________
Identification code mo_LB337_04
Empirical formula C50H61Cl7N2P2Ru2
Formula weight 1202.23
Temperature 100(2) K
Wavelength 0.71073 Å
Crystal system Monoclinic
Space group P2(1)/c
Unit cell dimensions a = 10.2885(16)Å α= 90°.
b = 36.990(7)Å β = 104.031(5)°.
c = 13.802(2)Å γ = 90°.
Volume 5095.8(15) Å3
Z 4
Density (calculated) 1.567 Mg/m3
Absorption coefficient 1.060 mm-1
F(000) 2448
Crystal size 0.08 x 0.03 x 0.03 mm3
Theta range for data collection 1.101 to 24.818°.
Reflections collected 8537
Independent reflections 8537[R(int) =?]
Completeness to theta =24.818° 97.1%
Absorption correction Empirical
Max. and min. transmission 0.969 and 0.526
Refinement method Full-matrix least-squares on F2
Data / restraints / parameters 8537/ 312/ 670
Goodness-of-fit on F2 0.908
Final R indices [I>2sigma(I)] R1 = 0.0793, wR2 = 0.1620
R indices (all data) R1 = 0.1823, wR2 = 0.1997
Largest diff. peak and hole 1.476 and -1.867 e.Å-3
S5
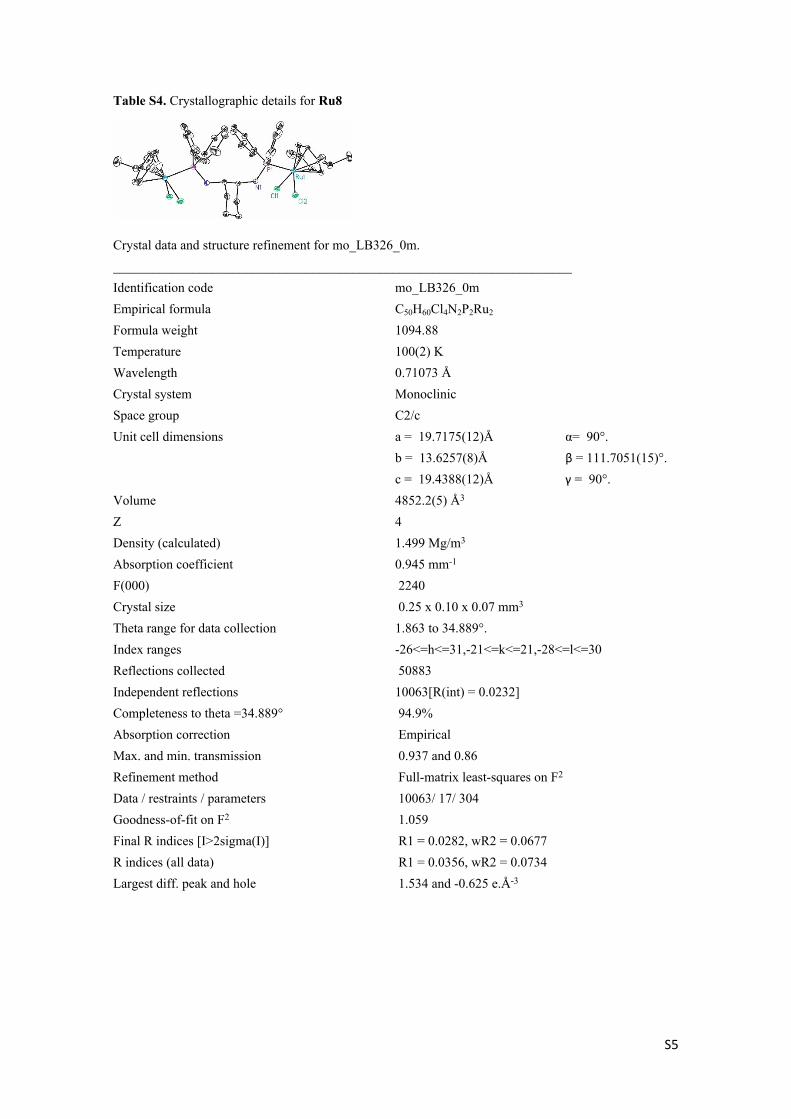
Table S4. Crystallographic details for Ru8
Crystal data and structure refinement for mo_LB326_0m._____________________________________________________________________Identification code mo_LB326_0mEmpirical formula C50H60Cl4N2P2Ru2 Formula weight 1094.88Temperature 100(2) KWavelength 0.71073 ÅCrystal system MonoclinicSpace group C2/cUnit cell dimensions a = 19.7175(12)Å α= 90°.
b = 13.6257(8)Å β = 111.7051(15)°.c = 19.4388(12)Å γ = 90°.
Volume 4852.2(5) Å3
Z 4Density (calculated) 1.499 Mg/m3
Absorption coefficient 0.945 mm-1
F(000) 2240Crystal size 0.25 x 0.10 x 0.07 mm3
Theta range for data collection 1.863 to 34.889°.Index ranges -26<=h<=31,-21<=k<=21,-28<=l<=30Reflections collected 50883Independent reflections 10063[R(int) = 0.0232]Completeness to theta =34.889° 94.9% Absorption correction EmpiricalMax. and min. transmission 0.937 and 0.86Refinement method Full-matrix least-squares on F2
Data / restraints / parameters 10063/ 17/ 304Goodness-of-fit on F2 1.059Final R indices [I>2sigma(I)] R1 = 0.0282, wR2 = 0.0677R indices (all data) R1 = 0.0356, wR2 = 0.0734Largest diff. peak and hole 1.534 and -0.625 e.Å-3

S6
Table S5. Crystallographic details for Ru9
Crystal data and structure refinement for LB327b-05.
_____________________________________________________________________
Identification code LB327b-05
Empirical formula C25 H32 Cl2 N P Ru
Formula weight 549.45
Temperature 100(2) K
Wavelength 1.54178 Å
Crystal system Monoclinic
Space group P2(1)/c
Unit cell dimensions a = 10.0527(5)Å α= 90°.
b = 14.1683(7)Å β = 100.4265(14)°.
c = 17.5477(9)Å γ = 90°.
Volume 2458.0(2) Å3
Z 4
Density (calculated) 1.485 Mg/m3
Absorption coefficient 7.860 mm-1
F(000) 1128
Crystal size 0.15 x 0.15 x 0.10 mm3
Theta range for data collection 4.037 to 68.287°.
Index ranges -11<=h<=11,0<=k<=16,0<=l<=21
Reflections collected 4276
Independent reflections 4276[R(int) =?]
Completeness to theta =68.287° 95.1%
Absorption correction Multi-scan
Max. and min. transmission 0.507 and 0.39
Refinement method Full-matrix least-squares on F2
Data / restraints / parameters 4276/ 13/ 280
Goodness-of-fit on F2 1.115
Final R indices [I>2sigma(I)] R1 = 0.0322, wR2 = 0.0933
R indices (all data) R1 = 0.0336, wR2 = 0.0948
Largest diff. peak and hole 0.931 and -0.935 e.Å-3

S7
Table S6. Crystallographic details for Ru11.
Table 1. Crystal data and structure refinement for Ru11.
_____________________________________________________________________
Identification code LB133
Empirical formula C68H58Cl2Fe2N2P4Ru
Formula weight 1310.71
Temperature 100(2) K
Wavelength 0.71073 Å
Crystal system Monoclinic
Space group P2(1)/c
Unit cell dimensions a = 24.374(2) Å α= 90.00 °.
b = 11.4323(10) Å β = 108.050(3) °.
c = 21.033(2) Å γ = 90.00 °.
Volume 5572.5(9) Å3
Z 4
Density (calculated) 1.562 Mg/m3
Absorption coefficient 1.039 mm-1
F(000) 2680
Crystal size 0.12 x 0.06 x 0.04 mm3
Theta range for data collection 0.88 to 29.68 °.
Index ranges -25 <=h<=33 ,-9 <=k<=15 ,-29 <=l<=24
Reflections collected 51897
Independent reflections 15625 [R(int) = 0.0771 ]
Completeness to theta =29.68 ° 99.0%
Absorption correction Empirical
Max. and min. transmission 0.9596 and 0.8855
Refinement method Full-matrix least-squares on F2
Data / restraints / parameters 15625 / 0 / 712
Goodness-of-fit on F2 1.037
Final R indices [I>2sigma(I)] R1 = 0.0490 , wR2 = 0.0907
R indices (all data) R1 = 0.0928 , wR2 = 0.1070
Largest diff. peak and hole 0.724 and -0.809 e.Å-3
S8
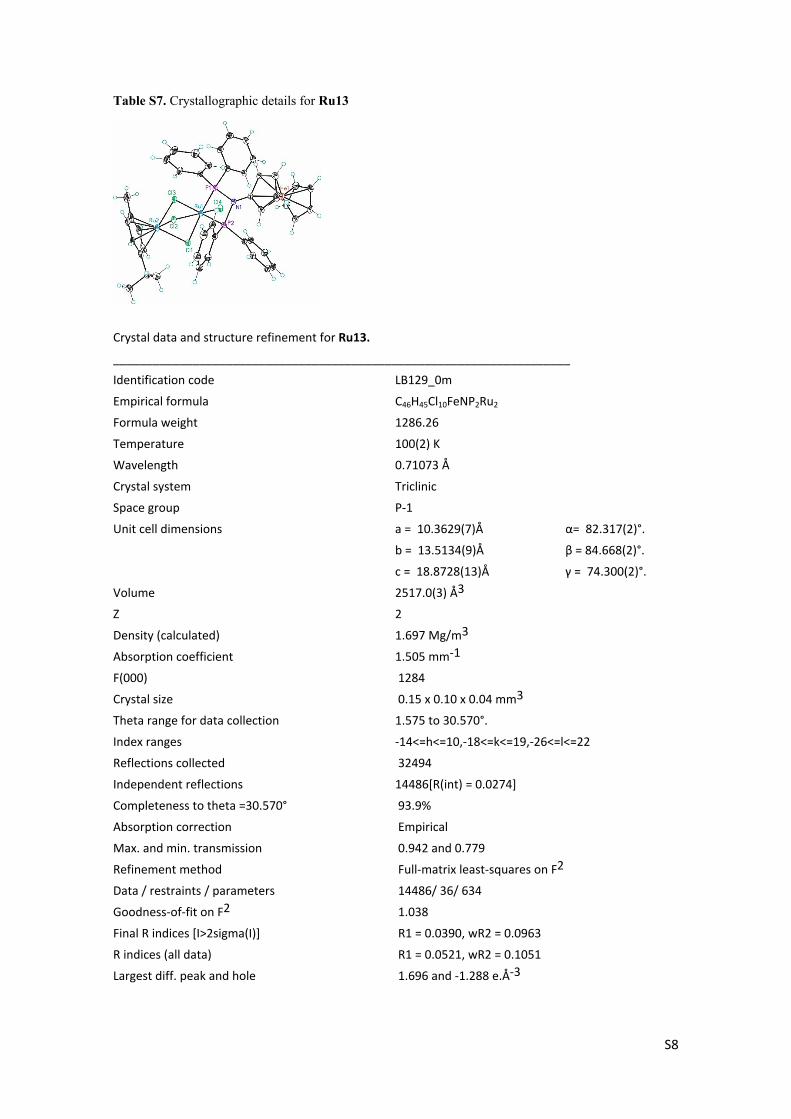
Table S7. Crystallographic details for Ru13
Crystal data and structure refinement for Ru13.
_____________________________________________________________________
Identification code LB129_0m
Empirical formula C46H45Cl10FeNP2Ru2
Formula weight 1286.26
Temperature 100(2) K
Wavelength 0.71073 Å
Crystal system Triclinic
Space group P-1
Unit cell dimensions a = 10.3629(7)Å α= 82.317(2)°.
b = 13.5134(9)Å β = 84.668(2)°.
c = 18.8728(13)Å γ = 74.300(2)°.
Volume 2517.0(3) Å3
Z 2
Density (calculated) 1.697 Mg/m3
Absorption coefficient 1.505 mm-1
F(000) 1284
Crystal size 0.15 x 0.10 x 0.04 mm3
Theta range for data collection 1.575 to 30.570°.
Index ranges -14<=h<=10,-18<=k<=19,-26<=l<=22
Reflections collected 32494
Independent reflections 14486[R(int) = 0.0274]
Completeness to theta =30.570° 93.9%
Absorption correction Empirical
Max. and min. transmission 0.942 and 0.779
Refinement method Full-matrix least-squares on F2
Data / restraints / parameters 14486/ 36/ 634
Goodness-of-fit on F2 1.038
Final R indices [I>2sigma(I)] R1 = 0.0390, wR2 = 0.0963
R indices (all data) R1 = 0.0521, wR2 = 0.1051
Largest diff. peak and hole 1.696 and -1.288 e.Å-3

S9
Table S8. Crystallographic details for Ru14
Crystal data and structure refinement for mo_LB96_0m.
_____________________________________________________________________
Identification code mo_LB96_0m
Empirical formula C75H86B2Cl2F8N2OP4Ru2
Formula weight 1601.99
Temperature 100(2) K
Wavelength 0.71073 Å
Crystal system Orthorhombic
Space group P212121
Unit cell dimensions a = 10.3175(8)Å α= 90°.
b = 19.2105(12)Å β = 90°.
c = 36.437(3)Å γ = 90°.
Volume 7221.9(9) Å3
Z 4
Density (calculated) 1.473 Mg/m3
Absorption coefficient 0.647 mm-1
F(000) 3288
Crystal size 0.20 x 0.08 x 0.08 mm3
Theta range for data collection 1.540 to 30.168°.
Index ranges -13<=h<=14,-25<=k<=27,-50<=l<=50
Reflections collected 130627
Independent reflections 19482[R(int) = 0.0395]
Completeness to theta =30.168° 93.6%
Absorption correction Multi-scan
Max. and min. transmission 0.950 and 0.874
Refinement method Full-matrix least-squares on F2
Data / restraints / parameters 19482/ 471/ 993
Goodness-of-fit on F2 1.040
Final R indices [I>2sigma(I)] R1 = 0.0252, wR2 = 0.0527
R indices (all data) R1 = 0.0285, wR2 = 0.0540
Flack parameter x =-0.022(5)
Largest diff. peak and hole 0.435 and -0.366 e.Å-3

S10
3. NMR spectra
Ru1
NN
Ph2P PPh2
Me
Me
Me
iPrRu
Cl Cl
Me
iPrRu
ClCl
1H NMR (500 MHz, CDCl3)
0.00.51.01.52.02.53.03.54.04.55.05.56.06.57.07.58.08.59.09.5f1 (ppm)
LB352 2C 1H.10.fidResearchGroup ShafirICIQ_1H12p8s CDCl3 /opt/topspin lbroomfield 31
12.0
0
6.05
6.01
2.25
3.97
3.84
3.63
12.0
9
8.04
1.0
21.0
4
1.8
0
2.5
12.5
32.6
12.6
32.6
42.6
63.0
7
4.8
54.8
65.0
0
7.7
47.7
57.7
67.7
67.7
77.7
87.7
8
13C{1H} NMR (101 MHz, CDCl3)
102030405060708090100110120130140150160f1 (ppm)
LB135 ethanol insol 13C.10.fid13C{1H} experiment, 32 scans
17.6
2
22.0
7
30.2
3
38.5
0
50.9
6
87.2
2
89.8
0
96.4
8
111.
49
127.
8012
7.90
130.
1713
2.79
132.
8813
5.80
31P{1H} NMR (202 MHz, CDCl3)
-10-505101520253035404550556065707580859095100105110115120125130f1 (ppm)
LB352 2C 31P.10.fidResearchGroup ShafirICIQ_31P{1H} CDCl3 /opt/topspin lbroomfield 31
76.6
4
Figure S1

S11
Ru2NN
Ph2P PPh2
MeMe
Me
iPrRu
Cl Cl
Me
iPrRu
ClCl
1H NMR (400 MHz, CD2Cl2)
0.51.01.52.02.53.03.54.04.55.05.56.06.57.07.58.08.59.0f1 (ppm)
12.5
7
2.94
6.00
8.98
4.88
4.17
4.01
13.4
3
8.60
1.04
1.05
1.53
1.55
1.80
2.51
2.52
2.56
2.58
2.85
2.87
2.87
2.89
2.91
4.91
4.92
4.93
4.93
5.01
5.02
7.35
7.36
7.36
7.37
7.37
7.38
7.39
7.39
7.40
7.40
7.41
7.41
7.41
7.76
7.76
7.78
7.78
7.79
7.80
7.81
13C{1H} NMR (126 MHz, CD2Cl2)
0102030405060708090100110120130140150160170180f1 (ppm)
17.8
122
.31
26.5
830
.76
38.2
338
.25
51.9
651
.97
54.4
3
87.3
787
.42
90.6
2
96.8
0
110.
8311
0.85
128.
0912
8.17
130.
5013
0.52
133.
2313
3.29
31P{1H} NMR (162 MHz, CD2Cl2)
-20-100102030405060708090100110120130140150f1 (ppm)
75.5
7
Figure S2

S12
Ru3NN
(iPr)2P P(iPr)2
MeMe
Me
iPrRu
Cl Cl
Me
iPrRu
ClCl
1H NMR (500 MHz, CDCl3)
0.00.51.01.52.02.53.03.54.04.55.05.56.06.57.07.58.0f1 (ppm)
lb358B 1H.10.fidResearchGroup ShafirICIQ_1H12p8s CDCl3 /opt/topspin lbroomfield 1
40.5
6
1.99
6.00
6.52
4.45
4.01
3.91
4.05
1.23
1.24
1.26
1.27
1.27
1.28
1.30
1.30
1.31
1.32
1.89
1.89
1.90
1.91
1.92
1.92
1.93
1.94
2.11
2.82
2.84
2.90
2.91
2.92
2.92
2.93
2.93
2.94
2.95
2.95
2.96
2.98
3.11
3.12
3.12
3.13
3.14
3.14
3.15
5.55
5.56
5.63
5.64
13C{1H} NMR (126 MHz, CDCl3)
05101520253035404550556065707580859095100105110115120125130135140145150f1 (ppm)
lb358B 13C.10.fidResearchGroup ShafirICIQ_13C{1H}512s CDCl3 /opt/topspin lbroomfield 1
18.2
819
.74
19.7
520
.17
22.7
3
29.1
729
.35
30.8
1
38.7
6
51.8
853
.57
85.6
585
.69
87.6
987
.72
95.8
6
108.
58
31P{1H} NMR (202 MHz, CDCl3)
Figu6668707274767880828486889092949698100102104106108110112114116118120122124126128130132
f1 (ppm)
lb358B 31P.10.fidResearchGroup ShafirICIQ_31P{1H} CDCl3 /opt/topspin lbroomfield 1
99.1
6
re S3

S13
Ru4N
NPh2P
PPh2
MeMe
Me
iPrRu
Cl Cl
MeiPr
RuClCl
1H NMR (500 MHz, CD2Cl2)
-1.0-0.50.00.51.01.52.02.53.03.54.04.55.05.56.06.57.07.58.08.59.09.510.010.5f1 (ppm)
LB352B 1H.10.fidResearchGroup ShafirICIQ_1H12p8s CD2Cl2 /opt/topspin lbroomfield 52
11.5
3
4.00
5.69
1.95
5.80
3.81
4.00
3.35
11.5
0
7.84
1.05
1.07
1.34
1.35
1.36
1.84
2.48
2.49
2.50
2.52
2.53
2.57
2.59
2.98
2.99
4.99
4.99
5.00
5.00
5.06
7.37
7.37
7.38
7.38
7.39
7.40
7.40
7.40
7.41
7.41
7.79
7.79
7.80
7.80
7.81
7.81
7.82
7.82
7.83
13C{1H} NMR (126 MHz, CDCl3)
0102030405060708090100110120130140150160f1 (ppm)
LB352B 13C.10.fidResearchGroup ShafirICIQ_13C{1H}512s CD2Cl2 /opt/topspin lbroomfield 52 1
7.8
422.3
426.1
926.2
230.7
4
38.0
4
87.4
387.4
890.5
4
97.0
1
110.5
3110.5
5
128.0
3128.1
1130.4
4130.4
6133.2
8133.3
3
31P{1H} NMR (202 MHz, CDCl3)
-100102030405060708090100110120130140f1 (ppm)
LB352B 31P.10.fidResearchGroup ShafirICIQ_31P{1H} CD2Cl2 /opt/topspin lbroomfield 52
75.3
8
Figure S4

S14
Ru5NH
NH
Ph2P PPh2
Me
iPrRu
Cl Cl
Me
iPrRu
ClCl
1H NMR (500 MHz, CDCl3)
0.00.51.01.52.02.53.03.54.04.55.05.56.06.57.07.58.08.5f1 (ppm)
lb337 1H crude.10.fidResearchGroup ShafirICIQ_1H12p8s CDCl3 /opt/topspin lbroomfield 30
3.0
6
6.4
6
3.1
0
2.0
4
1.1
0
1.0
4
2.0
4
2.0
0
6.4
7
4.2
6
0.35
0.82
0.83
1.89
2.07
2.09
2.10
2.55
2.56
2.58
2.59
2.60
2.97
2.98
2.99
2.99
3.00
3.02
4.96
4.97
5.22
5.22
5.23
5.23
7.38
7.39
7.39
7.39
7.39
7.40
7.40
7.41
7.41
7.41
7.42
7.42
7.42
7.43
7.43
7.43
7.43
7.43
7.76
7.76
7.77
7.77
7.77
7.78
7.78
7.78
7.79
7.79
7.80
13C{1H} NMR (126 MHz, CDCl3)
0102030405060708090100110120130140150160f1 (ppm)
LB-337 13C{1H}.2.fid13C{1H} Experiment
17.5
621
.54
22.8
0
30.2
0
36.8
536
.89
37.2
4
51.1
751
.26
85.9
786
.02
91.3
291
.36
93.5
7
108.
32
128.
0812
8.16
130.
6413
0.66
133.
2713
3.35
133.
9213
4.33
31P{1H} NMR (CDCl3)
-70-60-50-40-30-20-100102030405060708090100110120f1 (ppm)
lb337 31P crude.10.fidResearchGroup ShafirICIQ_31P{1H} CDCl3 /opt/topspin lbroomfield 30
63.6
3
Figure S5

S15
Ru6NN
Ph2P PPh2
MeMe
Me
iPrRu
Cl Cl
Me
iPrRu
ClCl
1H NMR (500 MHz, CDCl3)
0.51.01.52.02.53.03.54.04.55.05.56.06.57.07.58.08.59.09.5f1 (ppm)
lb352 a 1H.10.fidResearchGroup ShafirICIQ_1H12p8s CD2Cl2 /opt/topspin lbroomfield 51
6.00
12.5
3
6.15
2.21
6.13
3.93
4.06
3.87
13.0
2
8.19
0.74
1.05
1.06
1.77
2.46
2.48
2.49
2.49
2.51
2.52
2.59
2.62
2.86
2.87
5.01
5.01
5.02
5.02
5.07
5.08
7.35
7.36
7.36
7.37
7.37
7.37
7.38
7.38
7.38
7.39
7.39
7.39
7.40
7.40
7.40
7.41
7.41
7.41
7.42
7.42
7.42
7.42
7.43
7.43
7.43
7.43
7.44
7.77
7.77
7.78
7.79
7.79
7.79
7.79
7.80
7.80
7.81
7.81
13C{1H} NMR (126 MHz, CDCl3)
0102030405060708090100110120130140150160170f1 (ppm)
lb352 a 1H.11.fidResearchGroup ShafirICIQ_13C{1H}512s CD2Cl2 /opt/topspin lbroomfield 51 17
.90
22.3
626
.65
30.7
0
39.1
239
.16
39.2
141
.70
41.7
3
64.1
5
87.4
387
.48
90.5
6
97.0
4
110.
6311
0.65
128.
0412
8.12
130.
6813
0.70
133.
8813
3.96
31P{1H} NMR (202 MHz, CDCl3)
707172737475767778798081828384858687f1 (ppm)
lb352 a 31P.11.fidResearchGroup ShafirICIQ_31P{1H} CD2Cl2 /opt/topspin lbroomfield 51
81.2
6
2DgHSQCped (CDCl3)
-1.0-0.50.00.51.01.52.02.53.03.54.04.55.05.56.06.57.07.58.0f2 (ppm)
0
20
40
60
80
100
120
f1 (
ppm
)
lb352 a 1H 13C.11.serResearchGroup ShafirICIQ_2DgHSQCped CD2Cl2 /opt/topspin lbroomfield 51
Figure S6

S16
Ru7
NNPPh2
PPh2
Me
iPr Ru
Cl
Cl
Me
iPrRu
Cl
Cl
trans eq.
MeMe
1H NMR (500 MHz, CD2Cl2)
0.51.01.52.02.53.03.54.04.55.05.56.06.57.07.58.08.59.0f1 (ppm)
lb352C 1H.10.fidResearchGroup ShafirICIQ_1H12p8s CD2Cl2 /opt/topspin lbroomfield 53
2.9
23.2
31.2
51.0
83.1
5
0.9
5
1.0
1
2.6
4
0.8
7
0.8
61.0
20.9
50.9
7
6.1
9
3.9
0
0.9
60.9
71.0
41.0
61.2
11.2
21.2
61.2
71.3
81.3
91.5
91.5
91.8
51.8
8
2.2
32.2
42.2
62.2
72.2
82.2
92.2
92.3
12.7
03.3
35.0
15.0
25.0
55.0
65.1
85.1
95.2
45.2
57.3
27.3
27.3
37.3
37.3
57.3
57.3
57.3
77.3
87.3
87.3
87.3
97.3
97.3
97.4
17.4
17.4
47.4
57.4
67.4
77.4
77.4
77.4
87.4
87.8
47.8
67.9
17.9
37.9
5
13C{1H} NMR (126 MHz, CD2Cl2)
0102030405060708090100110120130140150160f1 (ppm)
lb352C 13C.10.fidResearchGroup ShafirICIQ_13C{1H}512s CD2Cl2 /opt/topspin lbroomfield 53 16
.55
20.9
922
.63
23.8
425
.29
29.9
832
.87
34.6
3
62.8
4
84.5
186
.04
89.8
192
.03
96.2
2
110.
11
126.
1612
6.92
127.
0012
7.75
127.
8212
8.83
129.
8813
0.06
132.
6613
4.84
31P{1H} NMR (202 MHz, CD2Cl2)
525354555657585960616263646566676869707172737475767778798081828384f1 (ppm)
lb352C 31P second.10.fidResearchGroup ShafirICIQ_31P{1H} CDCl3 /opt/topspin lbroomfield 30
70.9
7

S17
2DgHSQCped (CD2Cl2)
0.00.51.01.52.02.53.03.54.04.55.05.56.06.57.07.58.08.59.09.510.010.511.0f2 (ppm)
0
50
100
150
f1 (
ppm
)
lb352C 1H 13C.10.serResearchGroup ShafirICIQ_2DgHSQCped CD2Cl2 /opt/topspin lbroomfield 53
VT 1H NMR (500 MHz, CDCl3)
0.00.51.01.52.02.53.03.54.04.55.05.56.06.57.07.58.08.59.09.5f1 (ppm)
1
2
3
4
5
6
7
LB352C.14.fid1H experiment, 328 K 7
LB352C.12.fid1H experiment, 318 K 6
LB352C.2.fid1H experiment, 298 K 5
LB352C.4.fid1H experiment, 273 K 4
LB352C.6.fid1H experiment, 253 K 3
LB352C.8.fid1H experiment, 233 K 2
LB352C.10.fid1H experiment, 213 K 1
Figure S7

S18
Ru8
HNNHPPh2
PPh2
Me
iPr Ru
Cl
Cl
Me
iPrRu
Cl
Cl
trans ax.
1H NMR (500 MHz, CDCl3)
-1.0-0.50.00.51.01.52.02.53.03.54.04.55.05.56.06.57.07.58.08.59.09.510.010.5f1 (ppm)
LB359B.1.fid1H experiment 298 K
1.21
3.17
3.26
1.04
2.32
3.20
2.11
1.00
1.04
2.10
1.10
2.10
3.24
1.16
4.14
0.5
90.6
70.6
80.8
30.8
41.1
31.3
01.3
2
1.8
2
2.4
42.4
52.4
72.4
8
3.2
83.3
03.3
3
4.8
24.8
35.0
55.0
65.0
75.0
95.2
15.2
27.1
37.1
47.1
57.1
57.1
57.1
67.1
77.2
67.3
57.3
67.3
67.3
87.3
87.3
87.3
97.4
07.4
07.4
17.4
17.4
57.4
67.4
77.4
77.6
27.6
37.6
57.6
97.7
07.7
17.7
2
13C{1H} NMR (101 MHz, CDCl3)
0102030405060708090100110120130140150160170180190200210f1 (ppm)
LB359B 13C.20.fidResearchGroup ShafirICIQ_13C{1H}512s CDCl3 /opt/topspin lbroomfield 42 17
.38
18.9
520
.95
21.9
426
.14
30.0
9
53.0
0
84.9
886
.91
89.9
291
.98
93.5
9
108.
1012
7.82
127.
9212
8.08
128.
1913
0.24
130.
2713
0.91
130.
9413
2.42
132.
5313
3.37
133.
4713
6.14
136.
68
31P{1H} NMR (162 MHz, CDCl3)
-70-60-50-40-30-20-100102030405060708090100110120130140150f1 (ppm)
lb359B cyclo 31P.10.fidResearchGroup ShafirICIQ_31P{1H} CDCl3 /opt/topspin lbroomfield 120
60.5
3
2DgHSQCped (CDCl3)
-1.0-0.50.00.51.01.52.02.53.03.54.04.55.05.56.06.57.07.58.08.59.0f2 (ppm)
0
50
100
150
f1 (
ppm
)
Figure S8
S19
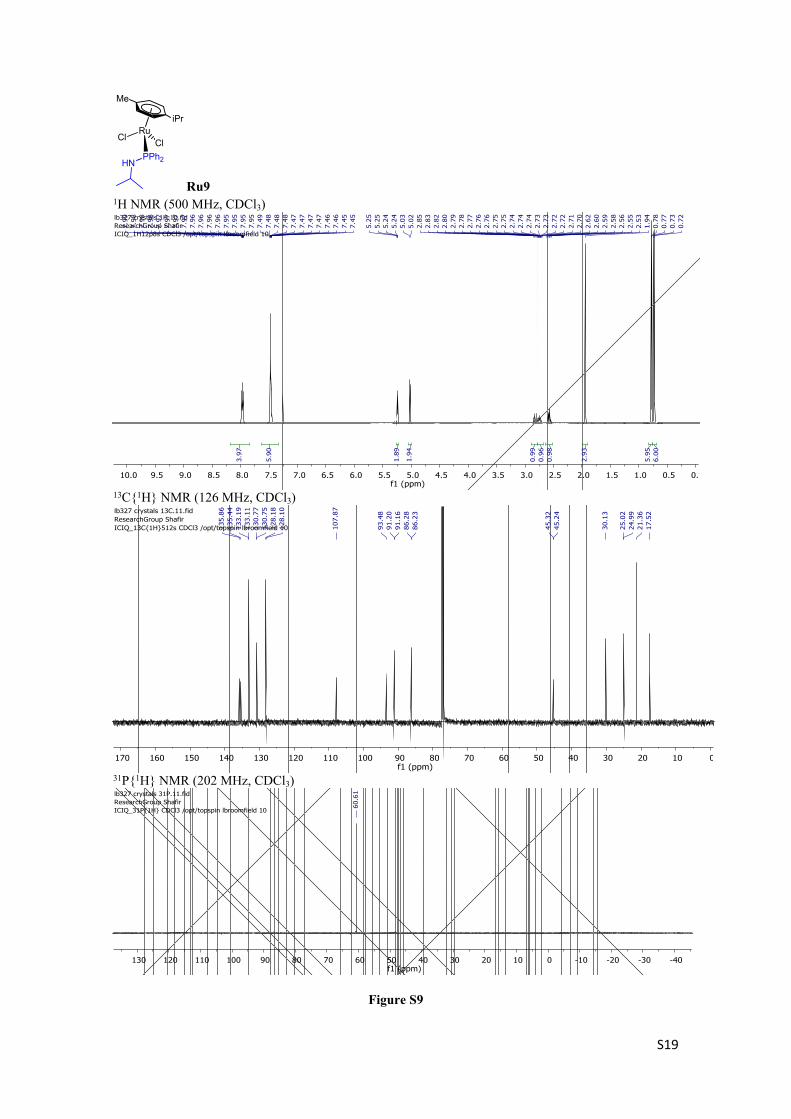
Ru9
HNPPh2
Me
iPrRu
ClCl
1H NMR (500 MHz, CDCl3)
0.00.51.01.52.02.53.03.54.04.55.05.56.06.57.07.58.08.59.09.510.0f1 (ppm)
lb327 crystals 1H.10.fidResearchGroup ShafirICIQ_1H12p8s CDCl3 /opt/topspin lbroomfield 10
6.00
5.95
2.93
0.98
0.96
0.99
1.94
1.89
5.90
3.97
0.72
0.73
0.77
0.78
1.94
2.53
2.55
2.56
2.58
2.59
2.60
2.62
2.70
2.71
2.72
2.72
2.73
2.73
2.74
2.74
2.74
2.75
2.75
2.76
2.76
2.77
2.78
2.79
2.80
2.82
2.83
2.85
5.02
5.03
5.24
5.24
5.25
5.25
7.45
7.45
7.46
7.46
7.47
7.47
7.47
7.47
7.48
7.48
7.48
7.49
7.95
7.95
7.95
7.95
7.96
7.96
7.96
7.96
7.97
7.97
7.97
7.97
7.98
7.98
7.98
7.99
13C{1H} NMR (126 MHz, CDCl3)
0102030405060708090100110120130140150160170f1 (ppm)
lb327 crystals 13C.11.fidResearchGroup ShafirICIQ_13C{1H}512s CDCl3 /opt/topspin lbroomfield 10 1
7.5
221.3
624.9
925.0
2
30.1
3
45.2
445.3
2
86.2
386.2
891.1
691.2
093.4
8
107.8
7
128.1
0128.1
8130.7
5130.7
7133.1
1133.1
9135.4
4135.8
6
31P{1H} NMR (202 MHz, CDCl3)
-40-30-20-100102030405060708090100110120130f1 (ppm)
lb327 crystals 31P.11.fidResearchGroup ShafirICIQ_31P{1H} CDCl3 /opt/topspin lbroomfield 10
60.6
1
Figure S9
S20
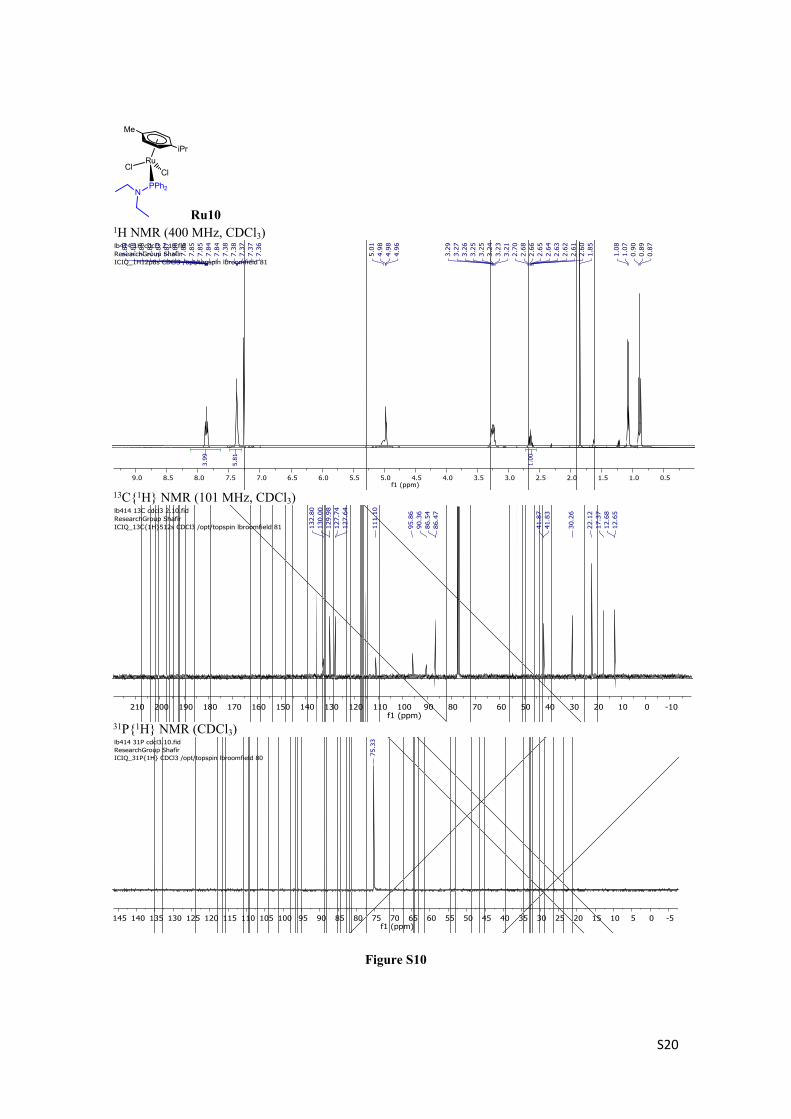
Ru10
NPPh2
Me
iPrRu
ClCl
1H NMR (400 MHz, CDCl3)
0.51.01.52.02.53.03.54.04.55.05.56.06.57.07.58.08.59.0f1 (ppm)
lb414 1H cdcl3 2.10.fidResearchGroup ShafirICIQ_1H12p8s CDCl3 /opt/topspin lbroomfield 81
1.00
5.81
3.99
0.87
0.89
0.90
1.07
1.08
1.85
2.60
2.61
2.62
2.63
2.64
2.65
2.66
2.68
2.70
3.21
3.23
3.24
3.25
3.25
3.26
3.27
3.29
4.96
4.98
4.98
5.01
7.36
7.37
7.37
7.38
7.38
7.84
7.84
7.85
7.85
7.86
7.86
7.87
7.87
7.87
7.88
7.88
7.89
13C{1H} NMR (101 MHz, CDCl3)
-100102030405060708090100110120130140150160170180190200210f1 (ppm)
lb414 13C cdcl3 2.10.fidResearchGroup ShafirICIQ_13C{1H}512s CDCl3 /opt/topspin lbroomfield 81 12
.65
12.6
817
.37
22.1
2
30.2
6
41.8
341
.87
86.4
786
.54
90.3
695
.86
111.
10
127.
6412
7.74
129.
9813
0.00
132.
80
31P{1H} NMR (CDCl3)
-505101520253035404550556065707580859095100105110115120125130135140145f1 (ppm)
lb414 31P cdcl3.10.fidResearchGroup ShafirICIQ_31P{1H} CDCl3 /opt/topspin lbroomfield 80
75.3
3
Figure S10
S21
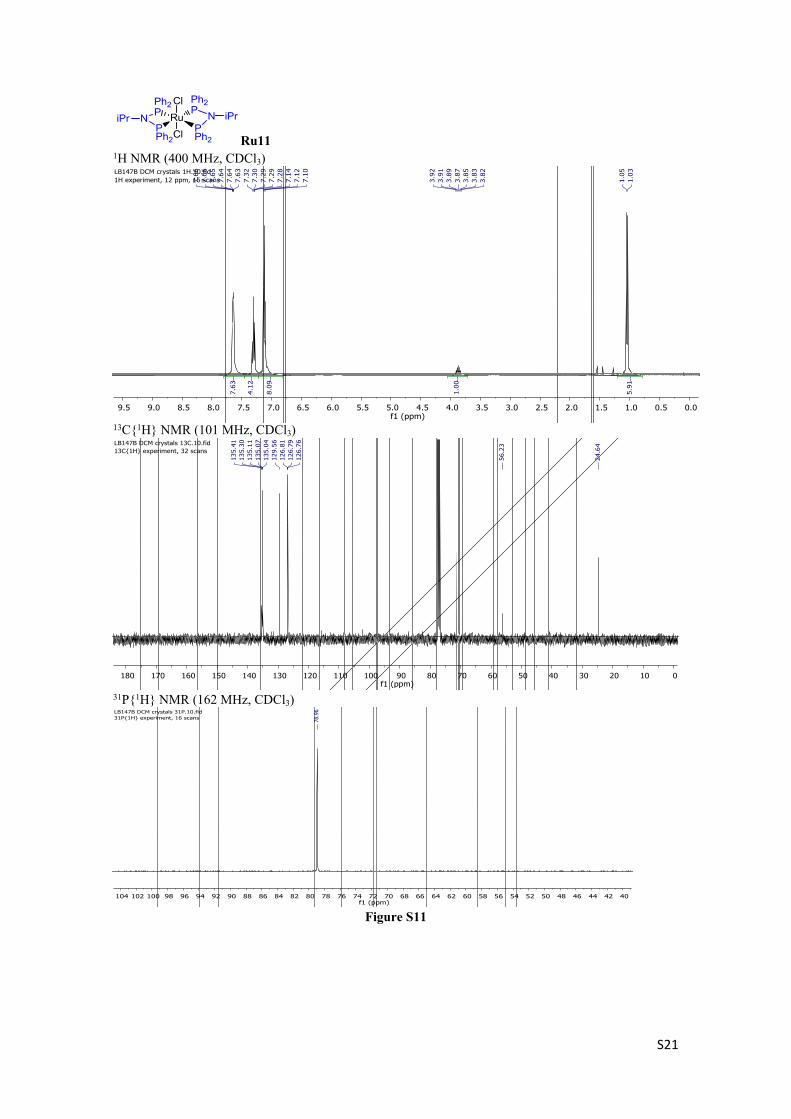
Ru11
RuPPh2
N
Ph2P
Ph2PNPPh2
Cl
CliPr iPr
1H NMR (400 MHz, CDCl3)
0.00.51.01.52.02.53.03.54.04.55.05.56.06.57.07.58.08.59.09.5f1 (ppm)
LB147B DCM crystals 1H.10.fid1H experiment, 12 ppm, 16 scans
5.9
1
1.0
0
8.0
9
4.1
2
7.6
3
1.0
31.0
5
3.8
23.8
33.8
53.8
73.8
93.9
13.9
2
7.1
07.1
27.1
47.2
87.2
97.2
97.3
07.3
27.6
37.6
47.6
47.6
57.6
67.6
6
13C{1H} NMR (101 MHz, CDCl3)
0102030405060708090100110120130140150160170180f1 (ppm)
LB147B DCM crystals 13C.10.fid13C{1H} experiment, 32 scans
24.6
4
56.2
3
126.
7612
6.79
126.
8112
9.56
135.
0413
5.07
135.
1113
5.30
135.
41
31P{1H} NMR (162 MHz, CDCl3)
404244464850525456586062646668707274767880828486889092949698100102104f1 (ppm)
LB147B DCM crystals 31P.10.fid31P{1H} experiment, 16 scans 78
.96
Figure S11

S22
Ru12
RuPPh2
N
Ph2P
Ph2PNPPh2
Cl
ClFe
Fe
1H NMR (500 MHz, CDCl3)
0.51.01.52.02.53.03.54.04.55.05.56.06.57.07.58.08.59.0f1 (ppm)
LB132 etoh insol 1H.10.fidResearchGroup ShafirICIQ_1H12p8s CDCl3 /opt/topspin lbroomfield 41
10.0
0
7.63
17.2
0
9.50
16.9
3
3.54
3.78
7.11
7.13
7.14
7.30
7.30
7.30
7.31
7.32
7.33
7.59
7.60
7.60
7.61
7.61
7.62
13C{1H} NMR (101 MHz, CDCl3)
102030405060708090100110120130140150160170f1 (ppm)
lb132 etoh insol 13C.10.fid13C{1H} experiment, 32 scans
63.7
264
.96
69.6
7
126.
8512
6.88
129.
7313
2.61
134.
6313
4.67
134.
70
31P{1H} NMR (202 MHz, CDCl3)
-100102030405060708090100110120130140150f1 (ppm)
LB132 etoh insol 31P.10.fidResearchGroup ShafirICIQ_31P{1H} CDCl3 /opt/topspin lbroomfield 41
86.9
5
Figure S12

S23
Ru13
PPh2
RuPh2P ClN
Me
iPr
RuCl
Cl
ClFe
1H NMR (400 MHZ, CDCl3)
-1.0-0.50.00.51.01.52.02.53.03.54.04.55.05.56.06.57.07.58.08.59.09.510.010.5f1 (ppm)
LB129 ethanol insoluble 1H.10.fidResearchGroup ShafirICIQ_1H12p8s CDCl3 /opt/topspin lbroomfield 80
5.62
2.80
1.02
5.00
1.94
2.23
2.02
2.11
11.2
4
4.79
4.63
1.1
71.1
9
2.2
0
2.7
12.7
22.7
42.7
63.5
53.6
23.6
33.6
33.7
43.7
53.7
55.1
95.2
15.3
55.3
67.2
87.3
07.3
27.3
47.3
67.3
77.3
87.3
97.4
17.4
37.4
47.6
37.6
47.6
57.6
77.6
77.6
88.0
48.0
58.0
68.0
78.0
9
13C{1H} NMR (126 MHz, CDCl3)
5101520253035404550556065707580859095100105110115120125130135140145150155f1 (ppm)
LB129-full.3.fid13C{1H} Experiment
18.8
122
.38
24.2
3
31.0
6
62.4
162
.43
62.4
663
.20
69.5
0
78.0
579
.04
95.9
510
0.27
103.
9910
4.09
127.
3212
7.36
127.
4112
7.67
127.
7212
7.76
129.
6513
0.71
132.
2113
2.40
132.
5813
2.73
132.
7713
2.81
134.
2913
4.48
134.
6813
4.94
134.
9813
5.03
31P{1H} NMR (162 MHz, CDCl3)
4550556065707580859095100105110115120125130135f1 (ppm)
lb129 31P full.10.fid31P{1H} experiment, 16 scans
91.7
6
Figure S13
S24
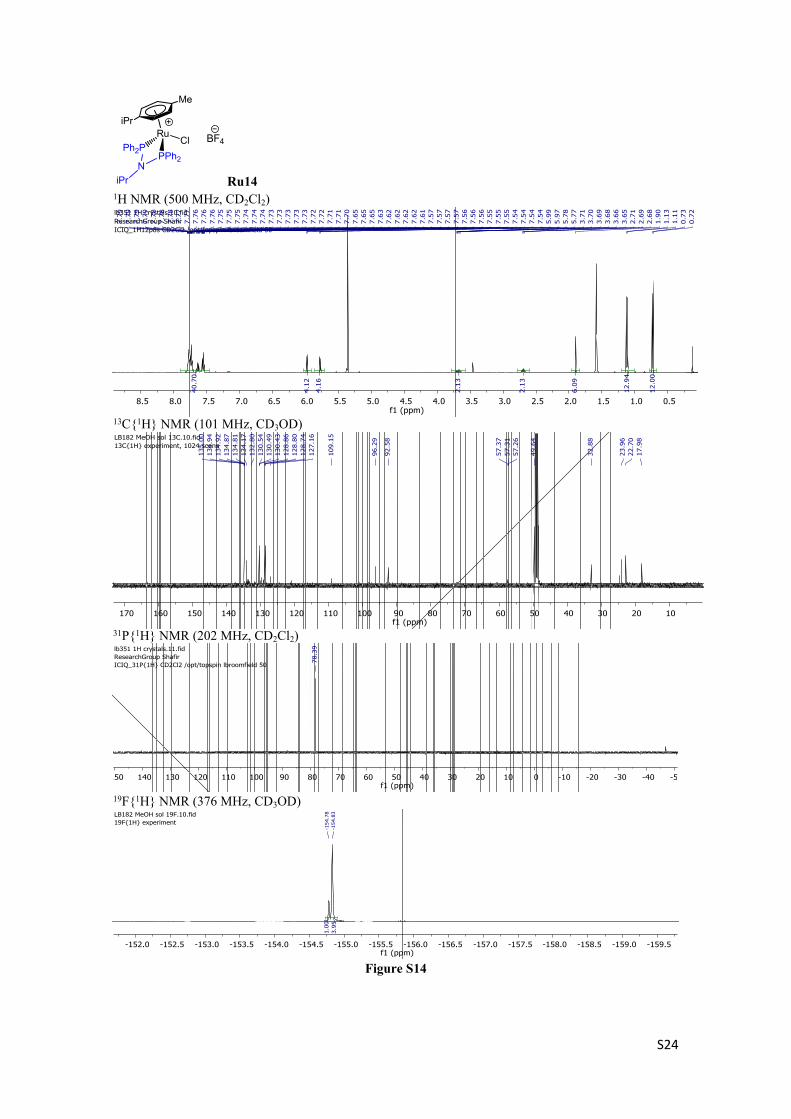
Ru14
PPh2
Me
iPrRu
Ph2PCl
NiPr
BF4
1H NMR (500 MHz, CD2Cl2)
0.51.01.52.02.53.03.54.04.55.05.56.06.57.07.58.08.5f1 (ppm)
lb351 1H crystals.10.fidResearchGroup ShafirICIQ_1H12p8s CD2Cl2 /opt/topspin lbroomfield 50
12.0
0
12.9
4
6.0
9
2.1
3
2.1
3
4.1
6
4.1
2
40.7
0
0.7
20.7
31.1
11.1
31.9
02.6
82.6
92.7
13.6
53.6
63.6
83.6
93.7
03.7
15.7
75.7
85.9
75.9
97.5
47.5
47.5
47.5
47.5
57.5
57.5
57.5
67.5
67.5
67.5
77.5
77.5
77.5
77.6
17.6
27.6
27.6
27.6
27.6
37.6
57.6
57.6
57.7
07.7
17.7
17.7
27.7
27.7
37.7
37.7
37.7
37.7
37.7
47.7
47.7
47.7
57.7
57.7
57.7
67.7
67.7
67.7
77.7
77.7
87.7
87.7
87.7
97.7
97.7
97.7
9
13C{1H} NMR (101 MHz, CD3OD)
102030405060708090100110120130140150160170f1 (ppm)
LB182 MeOH sol 13C.10.fid13C{1H} experiment, 1024 scans
17.9
822.7
023.9
6
32.8
8
49.6
4
57.2
657.3
157.3
7
92.5
8
96.2
9
109.1
5
127.1
6128.7
4128.8
0128.8
6130.4
3130.4
9130.5
4132.8
0134.1
7134.8
1134.8
7134.9
2134.9
4135.0
0
31P{1H} NMR (202 MHz, CD2Cl2)
-50-40-30-20-100102030405060708090100110120130140150f1 (ppm)
lb351 1H crystals.11.fidResearchGroup ShafirICIQ_31P{1H} CD2Cl2 /opt/topspin lbroomfield 50
78.3
9
19F{1H} NMR (376 MHz, CD3OD)
-159.5-159.0-158.5-158.0-157.5-157.0-156.5-156.0-155.5-155.0-154.5-154.0-153.5-153.0-152.5-152.0f1 (ppm)
LB182 MeOH sol 19F.10.fid19F{1H} experiment
3.95
1.00
-154
.83
-154
.78
Figure S14

S25
Ru15
PPh2
Me
iPrRu
Ph2PCl
N
BF4
Fe
1H NMR (400 MHz, CDCl3)
-1.0-0.50.00.51.01.52.02.53.03.54.04.55.05.56.06.57.07.58.08.59.09.510.010.5f1 (ppm)
lb355 Fc 1H.10.fidResearchGroup ShafirICIQ_1H12p8s CDCl3 /opt/topspin lbroomfield 77
6.00
3.04
1.38
4.65
3.09
2.01
1.95
1.90
22.7
7
1.09
1.10
1.83
1.84
1.84
2.58
2.60
2.62
3.41
3.48
3.49
3.49
3.77
3.77
3.78
5.86
5.88
6.03
6.05
7.44
7.45
7.45
7.46
7.47
7.50
7.51
7.51
7.52
7.52
7.62
7.64
7.65
7.66
7.67
7.75
7.77
7.86
7.88
7.90
7.92
7.94
7.95
13C{1H} NMR (101 MHz, CDCl3)
-100102030405060708090100110120130140150160170180190200f1 (ppm)
lb132B ETOH sol 13C.10.fid13C{1H} experiment, 512 scans
23.0
824
.23
31.9
633
.81
62.6
864
.06
69.6
9
90.8
3
98.0
5
126.
3912
7.73
127.
7912
7.85
129.
0913
0.73
131.
4513
2.69
132.
7413
2.80
133.
6313
5.08
135.
14
126127128129130131132133134135f1 (ppm)
126.
39
127.
7312
7.79
127.
85
129.
09
130.
73
131.
45
132.
6913
2.74
132.
80
133.
63
135.
0813
5.14
31P{1H} NMR (162 MHz, CDCl3)
-50-40-30-20-100102030405060708090100110120130140f1 (ppm)
lb355 Fc 31P.10.fidResearchGroup ShafirICIQ_31P{1H} CDCl3 /opt/topspin lbroomfield 77
83.6
8
.
Figure S15
S26
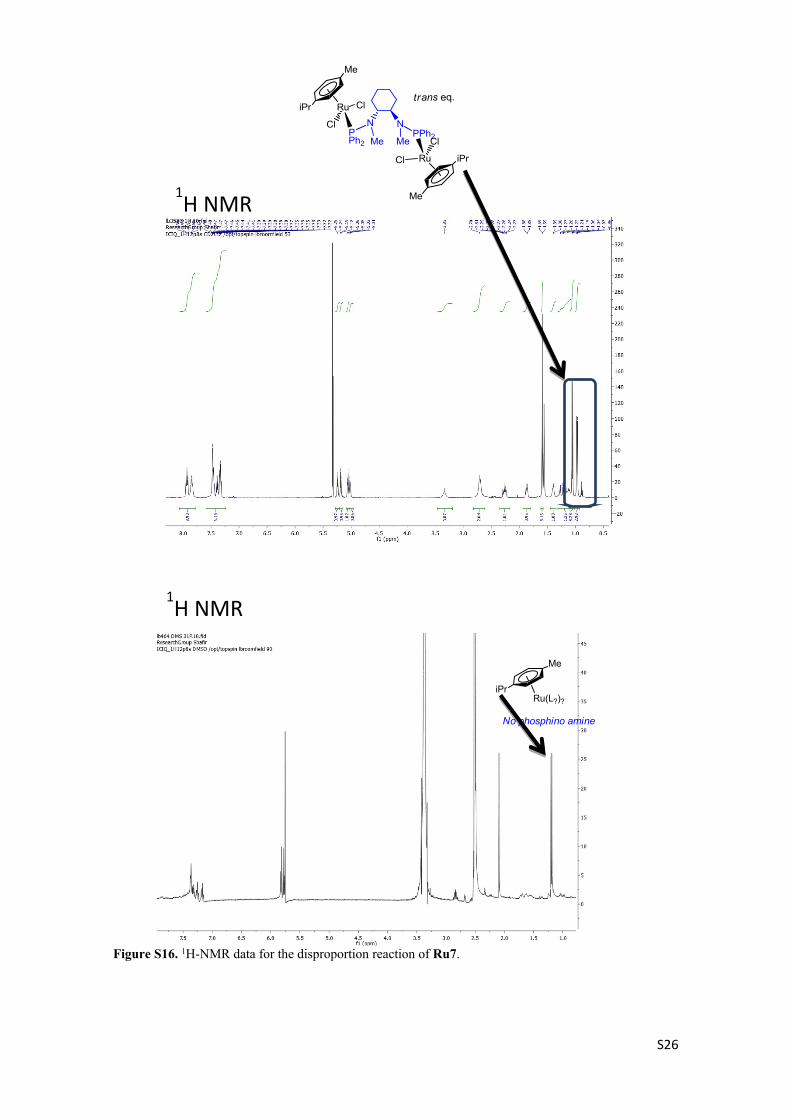
Figure S16. 1H-NMR data for the disproportion reaction of Ru7.
NNPPh2
PPh2
Me
iPr Ru
Cl
Cl
Me
iPrRu
Cl
Cl
trans eq.
MeMe
1H NMR
1H NMR
Me
iPrRu(L?)?
No phosphino amine

S27
NNPPh2
PPh2
Me
iPr Ru
Cl
Cl
Me
iPrRu
Cl
Cl
trans eq.
MeMe
MeOHMS analysis
N
N
Me
MePPh2
Ph2PRu Cl
N
N
Me
MePPh2
PPh2
Ru
OMe
Me
iPr
N
N
Me
MePPh2
PPh2
Ru
H
Me
iPr
4. HRMS spectra
N
N
Me
MePPh2
Ph2PRu Cl
N
N
Me
MePPh2
PPh2
Ru
H
Me
iPr
N
N
Me
MePPh2
PPh2
Ru
OMe
Me
iPr

S28
Figure S17. Analysis of a MeCN solution of Ru7 by HRMS.