Embed Size (px)
Citation preview

S1
Supporting Information for:
High Efficiency Low-Power Upconverting Soft Materials Jae-Hyuk Kim,† Fan Deng,‡ Felix N. Castellano,*,‡ and Jae-Hong Kim*,†
†School of Civil and Environmental Engineering, Georgia Institute of Technology, Atlanta, Georgia 30332, United States
‡Department of Chemistry and Center for Photochemical Sciences, Bowling Green State University, Bowling Green, Ohio 43403, United States

S2
Materials DPA and tetrahydrofuran (THF, >99.9%) were purchased from Aldrich Chemical Company and PdOEP was obtained from Frontier Scientific, all used without further purification. The commercially available polyurethane precursor, which is composed of two parts – polyol and diisocyanate – was purchased under the trade name Clear Flex 50®, from Smooth-on, Inc. Preparation of Molded Polymers Polyurethane film that is typically used to characterize the photonic property was prepared as follows: polyester polyol (1600 µL, component B in Clear Flex 50®) and methylene bis (4-cyclohexyl isocyanate (800 µL, component A in Clear Flex 50®) were mixed with PdOEP solution dissolved in THF (800 µL, 1.6 mM). After thorough mixing, each 150 µL of mixture was distributed to nine separated glass vial. Then, certain amount of DPA solution in THF (15.1 mM, varying from 0 ~ 100 µL) was added to the each vial followed by adding pure THF to make each mixture volume to be 250 µL. 30 µL of mixture was withdrawn from each vial and was cast onto a circular shaped microscopy cover glass (diameter: 12 mm, VWR) and then another cover glass was carefully mounted on the mixture in order to make flat and even polymer film. After curing for 12 hr in room temperature, the samples were subsequently placed in a conventional oven at 60 °C for 12 hr to completely remove residual THF from films. For the other polymer samples, certain amount of PdOEP and DPA solution in THF were mixed with component A and B simultaneously in a glass vial. In some cases, silica microparticles (dispersed in THF) that were synthesized by the Stöber method and subsequently modified to have hydrophobic characteristic were added to the polymer mixture in order to increase green light scattering for better visualization. The viscous solution was then purged with nitrogen gas for 20 min to blow out THF quickly, and subsequently placed in a vacuum chamber for 10 min to remove remaining bubbles. Then, the solution was poured into pre-prepared molds and cured for more than 12 hr at room temperature. Spectroscopic Measurements The static absorption spectra were measured with an Agilent 8453 UV-visible spectrophotometer. Steady-state photoluminescence spectra were measured using an Ar+ ion laser or lamp as the light source. An argon ion laser (Innova 306, Coherent) or an argon/krypton laser (Innova 70C Spectrum, Coherent) was used in conjunction with a PTI spectrofluorimeter. A 514.5 nm band pass filter and 455 nm long pass filter were placed in the laser beam path to isolate the desired excitation wavelength and to exclude the passage of higher energy plasma lines. A 500 nm short pass filter was mounted prior to the emission monochromator in order to remove scattered green light from the upconverted photoluminescence spectra. The incident laser power was varied using a series of neutral density filters and measured using a Nova II/PD300-UV power meter/detector head from Ophir. For the observation of normal photoluminescence spectra (Figure S1), a RF-5301 PC spectrofluorophotometer from Shimadzu was used in conjuction with a Xe lamp light source. To remove possible interference of shorter wavelengths a 500 nm long pass filter was placed between the lamp and sample in the acquisition of the PdOEP phosphorescence spectrum. Time-resolved Emission Spectra and Transient Photoluminescence Measurements Time-resolved emission spectra and photoluminescence intensity decays were recorded using the emission mode of an LP920 spectrometer from Edinburgh Instruments, equipped with both a PMT (single wavelength transients) and an iCCD camera from Andor Technologies; both detectors are simultaneously mounted on the monochromator/spectrograph. The samples were excited using a Nd:YAG laser/OPO combination from Opotek tuned to 540 nm (5-7 ns

S3
fwhm @ 10Hz). For single wavelength photoluminescence intensity decay measurements on PdOEP, the detection wavelength was 670 nm. The obtained photoluminescence intensity decay curve was fitted with biexponential model (Eq. 1) where I(t) is intensity at time t, A1 and A2 are the respective amplitudes of the two lifetime components, τ1 and τ2 (Figure S4).
(Eq. 1)
The mean lifetime (<τ>) was calculated from a sum of two single exponentials as shown in
Eq. 2, where α1 and α2 are the relative amplitudes of the two components.
(Eq. 2)
The decay parameters are summarized in Table S1.

S4
Table S1. Phosphorescence decay parameters of PdOEP in CLRFLX measured as a function of DPA concentration.
DPA concentration (M)
τ1 (α1) (µs) τ2 (α2) (µs) <τ> (µs)
0 1303 (0.89) 120 (0.11) 1290 0.0013 783 (0.17) 374 (0.83) 497 0.0027 277 (0.85) 72 (0.15) 268 0.0040 171 (0.88) 41 (0.12) 166 0.0054 136 (0.78) 19 (0.22) 132 0.0067 104 (0.90) 18 (0.10) 102 0.0108 66 (0.77) 12 (0.23) 64 0.0135 54 (0.69) 10 (0.31) 51
Upconversion Quantum Yield Measurements UC quantum yield (QY) measurements of PdOEP/DPA CLRFLX films were obtained relative to the phosphorescence QY of PdOEP in CLRFLX thin films and all samples were excited at 514.5 nm at two different fluences using an Ar+ laser. The following formula was used to calculate the quantum yield of upconversion:
(Eq. 3)
Here, Φuc, Auc, Iuc and ηuc represents the quantum yield, absorbance at λex, integrated photoluminescence spectral profile, and refractive index of the medium in the upconversion sample. The corresponding terms for the subscript “std” are for the reference quantum counter PdOEP in CLRFLX at the identical corresponding excitation wavelength. The factor of 2 is included since upconversion requires the absorption of 2 photons to produce 1 whereas the reference actinometer’s emission is directly proportional to the incident photons. The QY standards were CLRFLX films doped with only PdOEP (0.5 mM), whose absorbance is the same as that in the UC CLRFLX films (0.5 mM PdOEP + 13 mM DPA) at the 514.5 nm excitation wavelength. Since the standard and the UC films are all in the same CLRFLX material, the refractive indices are also the same. Therefore, under our experimental conditions, Eq. 3 simplifies to:
(Eq. 4)
The phosphorescence quantum yield of the standard were 0.329 ± 0.003 (averaged by 30 times measurement of 3 distinct standard sample) determined using an absolute photoluminescence quantum yield system equipped with an integrating sphere (Hamamatsu, C11347) with excitation tuned to 514.5 nm. Here we assume that the PdOEP/CLRFLX quantum efficiency under laser excitation conditions was the same as that determined from the absolute efficiency measurements. The phosphorescence of the standard was recorded by varying laser power density from 5 mW cm-2 to 187 mW cm-2 and integrated over the 600-

S5
800 nm PdOEP emission profile. Due to the severe photodegradation of the standard, the phosphorescence at higher laser power density was caculated by extrapolation based on linear relationship (R2 > 0.99) between laser power density and integrated emission area ubtained at lower laser power density. On the other hand, the upconverted emission was recorded throughout laser power density (5 mW cm-2 ~ 695 mW cm-2) and integrated over the 380-490 nm profile of the DPA to calculate quantum yield.

S6
Figure S1. Normalized absorption (solid lines) and photoluminescence (dashed lines) spectra of PdOEP (red) and DPA (blue) in THF at RT.

S7
Figure S2. Normalized down- and upconverted fluorescence profile of DPA in THF and polymer blend measured using spectrofluorophotometer while excitation at 380 nm and 544 nm with Xe lamp, respectively. [DPA]THF: 0.06 mM, [DPA]Film: 4.0 mM, [PdOEP]Film: 0.5 mM. For a comparison, phosphorescence of PdOEP in polymer blend excited at 544 nm is also presented. Blue and red inverse-triangles represent excitation wavelength used in down- and upconversion, respectively. The slight difference in relative intensity at around 410 nm between down- and upconverted emission is supposed to be caused by re-absorption of PdOEP.
S8
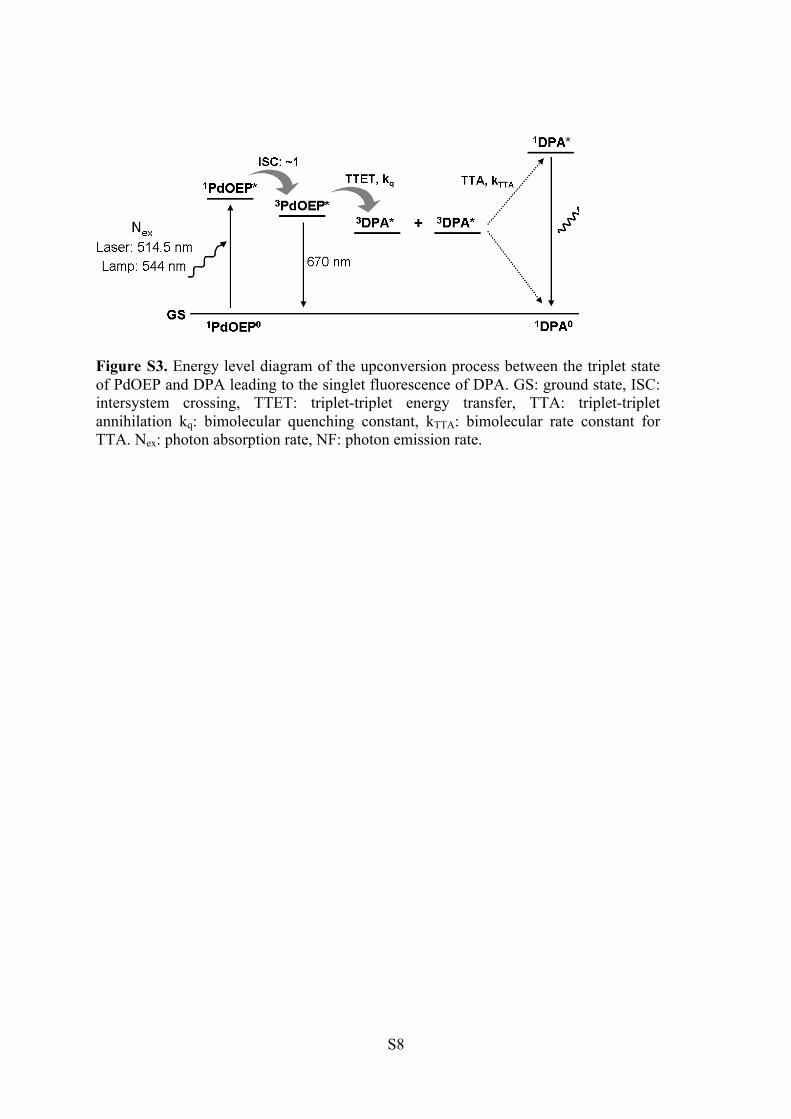
Figure S3. Energy level diagram of the upconversion process between the triplet state of PdOEP and DPA leading to the singlet fluorescence of DPA. GS: ground state, ISC: intersystem crossing, TTET: triplet-triplet energy transfer, TTA: triplet-triplet annihilation kq: bimolecular quenching constant, kTTA: bimolecular rate constant for TTA. Nex: photon absorption rate, NF: photon emission rate.

S9
Figure S4. Biexponential fit of phosphorescence intensity decays of PdOEP in the CLRFLX polymer blend containing different concentrations of DPA. λexcitation: 540 nm, λdetection: 670 nm. The yellow solid line is a representative biexponential fit to the data.

S10
Figure S5. Stern-Volmer plots generated from lifetime quenching of PdOEP measured as a function of DPA concentration in CLRFLX.

S11
Figure S6. Time-resolved emission spectra of the PdOEP/DPA/CLRFLX blend film containing PdOEP (0.5 mM) and DPA (a) 1.3 mM, (b) 4.0 mM, and (c) 13.4 mM. Spectra were collected every 1 µs following 540 nm laser pulses (5-7 ns fwhm) from a Nd:YAG/OPO laser system. The red inverse-triangle represents the excitation wavelength, 540 nm.

S12
Figure S7. Photographs of various configurations of prepared polymer containing DPA/PdOEP pair (a) polymer film, (b) cylinder, (c) tube, (d) disk, and (e) free-shape. The prepared polymer samples were irradiated by commercial green laser pointer pointer (λcenter,ex = 532 nm, laser power: < 10 mW), except for (d), using diverged 514.5 nm Ar+ laser excitation.


