Embed Size (px)
Citation preview
1
SUPPORTING DOCUMENT 2
Proposal P 1004 – Primary Production & Processing Standard for Seed Sprouts
Consultation Regulation Impact Statement

2
Table of Contents
EXECUTIVE SUMMARY .............................................................................................................................................. 3 THE PROBLEM ........................................................................................................................................................ 4 OBJECTIVES ............................................................................................................................................................ 4 OPTIONS ............................................................................................................................................................... 4
Option 1(a) Abandon the Proposal thus making no change to the Code ...................................................... 4 Option 1 (b) Abandon the Proposal. Industry Self Regulation ...................................................................... 4 Option 2 Prepare draft food regulatory measures ........................................................................................ 5
Seed production ........................................................................................................................................ 5 Seed processing ......................................................................................................................................... 5 Sprout production ..................................................................................................................................... 5
IMPACT ANALYSES ................................................................................................................................................... 6 Affected Parties ............................................................................................................................................. 6 Industry Profile .............................................................................................................................................. 6 Option 1(a) – Abandon the Proposal, thus maintaining the status quo ........................................................ 6
Costs .......................................................................................................................................................... 6 Benefits ...................................................................................................................................................... 9 Conclusion ................................................................................................................................................. 9
Option 1 (b) Abandon the Proposal. Industry Self Regulation .................................................................... 10 Assessment of self‐regulation ................................................................................................................. 10 Conclusion ............................................................................................................................................... 11
Option 2(a) Through chain regulatory measures (requirements for seed producers, seed processors and sprout producers) ........................................................................................................................................ 11
Costs ........................................................................................................................................................ 11 Impact on Small & Medium Businesses ................................................................................................... 13 Benefits .................................................................................................................................................... 15 Summary & Discussion ............................................................................................................................ 15
Option 2(b) Regulatory food safety measures for sprout producers only ................................................... 16 Costs ........................................................................................................................................................ 16 Benefits .................................................................................................................................................... 17
Limitations & Sensitivity Analysis................................................................................................................. 17 Net Benefit/Cost Estimates .......................................................................................................................... 18 Break Even Estimates / Analysis .................................................................................................................. 21 Conclusion .................................................................................................................................................... 21
COMPARISON OF OPTIONS ...................................................................................................................................... 22 CONSULTATION ..................................................................................................................................................... 22 CONCLUSION & RECOMMENDED OPTION .................................................................................................................. 23 IMPLEMENTATION AND REVIEW ............................................................................................................................... 23 ATTACHMENT 1: INCIDENCE, HEALTH OUTCOMES AND DURATION OF FOOD‐BORNE SALMONELLOSIS .................................... 24

3
Executive Summary
• This Proposal deals with the problem of food-borne illness caused by the consumption of seed sprouts. Although the costs to the community of outbreaks of food-borne illness vary considerably, the cost to the Australian community from the 2005 and 2006 outbreaks is estimated to be AUD 1.19 million.
• The objective of this Proposal is to reduce the likelihood of food-borne illness occurring due to the consumption of seed sprouts while avoiding any unnecessary cost burden on industry.
• Options identified are the status quo, industry self-regulation, regulatory food safety
measures for seed producers, seed processors and sprout producers; and regulatory food safety measures for sprout producers only.
• Assessment of options indicates that both status quo and industry self-regulation are not adequate to address the public health and safety concerns.
• Through-chain regulatory food safety measures for seed producers, seed
processors and sprout producers has been estimated as being cost ineffective and inconsistent with principles of minimum necessary regulation.
• Regulation of sprout producers only is a less costly option, although on present
estimates based on the costs associated with the 2005-06 outbreak, it may impose a net cost on the community. Sensitivity analysis indicates that the net present values (NPV) accruing from this option are subject to a high degree of uncertainty and are estimated to range between a positive NPV of AUD 595,000 and a negative NPV of (-) AUD 3.48 million over 10 years. This option would require the prevention of about 239 cases of food-borne illness annually to completely offset costs, based on the costs of the 2005-06 outbreak. Depending on the assumptions made, this would require outbreaks to occur between 0.79 to 5.6 times more regularly than they are estimated to currently occur (or be of 0.79 to 5.6 times the magnitude of previous outbreaks). The latter scenario is not unrealistic as large scale food-borne illness outbreaks associated with sprouts or salad components have occurred in developed countries in recent years some of which have resulted in deaths and severe illness.
• Despite the analysis indicating that the status quo option appears on the face of it to have the highest net benefit for the community, regulation of sprout producers only is the preferred option to reduce the risk of future sprouts related food-borne illnesses.
• The costs and benefits associated with regulating sprout producers are based on the last known outbreaks in Australia (2005 and 2006 data). The costs and benefits associated with a potential outbreak could be much higher or lower. An outbreak in Japan resulted in three deaths. A more risk adverse approach than is suggested by the analysis is being recommended because such outbreaks represent a low likelihood high consequence event with extremely uncertain outcomes.

4
The Problem This Proposal deals with the problem of food-borne illness caused by the consumption of seed sprouts. Seed sprouts are considered a high-risk food and have been implicated in food-borne illness outbreaks both domestically and internationally. For example: • in Western Australia and Victoria 132 cases of food-borne salmonellosis were linked to
the consumption of raw sprouts in 2005/061. • the Japanese radish sprouts outbreak in 1996 caused 3 deaths2; and • in the US consumption of sprouts is known to have caused 13643 cases of illness. Currently there are no national regulations for the production of sprouts. However, in New South Wales (NSW) the Plant and Plant Products Food Safety Scheme regulates high priority, high risk plant food products, including seed sprouts. The current level of food-borne illness is not expected to self-correct within a reasonable time period as market forces have not demonstrated the ability to deliver such a correction (See 2nd Assessment Report Section 4 for further details on the significance of the problem, public health risk and existing retailer requirements such as SQF and BRC). Objectives The following are the objectives of this Proposal: • reduce the risk of food-borne illness due to consumption of sprouts • protect health and safety of sprout consumers • improve the safety of seed sprouts • avoid unnecessary costs /burden on industry (See Section 5 of the 2nd Assessment Report for broader FSANZ objectives in context of this proposal). Options Option 1(a) Abandon the Proposal thus making no change to the Code Option 1 (b) Abandon the Proposal. Industry Self Regulation A self-regulatory approach would allow food or primary production businesses to implement and enforce (e.g. through certification schemes) industry guidelines or codes of practice aimed at improving the safety of seed sprouts. This option could include additional measures being adopted by industry on-farm, at processing and at the sprout production stage. These measures could include the adoption of Good Agriculture Practices4, separation of seed
1 Kirk M., 2006. Outbreaks Associated with Raw Sprouts. OzFoodNet presentation. 2 FAO/WHO Global Forum of Food Safety Regulators. Agenda Item 4.2. a) Hygiene Practice Manual for Radish Sprouts Production in Japan. Marrakesh, Morocco, 28 - 30 January 2002 3 http://www.fda.gov/OHRMS/DOCKETS/98fr/05-8103.htm 4 These could include correct use of chemicals, maintenance and cleaning of farm equipment and machinery.

5
grown for agriculture and sprouting purposes, improvements to premises, adherence to health & hygiene requirements, – details of possible food safety control measures are listed under Option 3. Option 2 Prepare draft food regulatory measures Option 2 involves the development of food safety regulatory measures in the Food Standards Code. These measures could potentially apply to some or all of the stages in the production chain (on-farm seed production, seed processing, and sprout production). The technical assessment has identified the following food safety control measures to mitigate contamination and risk. Seed production
• use of Good Agricultural Practices; • managing potential contamination from animal effluent through removal of grazing
animals from paddocks (completely or within a minimum time from harvest) and similar controls on the application of fertilisers/manures;
• segregation of seed grown for agricultural purposes from seed grown for human consumption;
• storage of seed so that it is inaccessible to pests or other sources of contamination; and
• demonstration of compliance through, for example, record keeping. Seed processing
• adequate design, construction and maintenance of premises and equipment (for food purposes);
• traceability system (supporting segregation of seed for food/sprouting purposes from other seed);
• pest control program; • health and hygiene requirements for personnel; • management of inputs (including chemical); and • demonstration of compliance through, for example, record keeping.
Sprout production General requirements for seed sprout production:
• the adequate design, construction and maintenance of premises and equipment to prevent/minimise contamination;
• implementation of health and hygiene practices of workers to prevent/minimise contamination;
• implementation of cleaning and sanitising programs; • control of pests; • the management of inputs (water and chemicals) to prevent/minimise contamination; • appropriate skills and knowledge of workers for the activities they undertake; and • implementation of food handling controls from receipt to transport to
prevent/minimise contamination. (See Section 6 of 2nd Assessment Report for more information on identification of food safety measures and risk management options).
6
As stated above, regulatory measures could be applied to some or all of the stages of production. As a result, Option 2 Regulatory Food Safety Measures has been further subdivided into Option 2(a) Through Chain Regulatory Food Safety Measures (for seed producers, seed processors and sprout producers) and Option 2(b) Regulatory Food Safety measures for Sprout Producers only. This approach has been taken in response to industry feedback and to assess what level of intervention would achieve the maximum net value to the community as a whole. Impact Analyses Affected Parties
• consumers • industry (seed producers, seed processors and sprout producers) • government states & jurisdictions
Industry Profile Consultation with industry indicates that generally businesses in this sector are sole proprietorships, partnerships and family owned businesses. Therefore most businesses would be defined by the Australian Bureau of Statistics (ABS) as small businesses as they employ less than 20 full time staff. Most seed producers mainly supply for agricultural and non sprout customers. There were about 30 seed processors identified as supplying at least some of their seeds for sprouting purposes. Out of these 30 about 10 businesses are known to be mung bean seed suppliers and are expected to be already complying with export standards in order to access overseas markets. Through an industry profiling exercise, FSANZ identified about 30 sprout producers nationally. Subsequent consultations with industry and jurisdictions have indicated that there may be another 5-10 businesses which FSANZ was unable to reach through its survey. Therefore, there may be up to 40 businesses of which 6 are known to be based in NSW. The NSW businesses presently comply with the NSW Plant and Plant Products Food Safety Scheme. Therefore, they will also be less affected in terms of additional costs from the introduction of any national standard. Option 1(a) – Abandon the Proposal, thus maintaining the status quo Costs In Western Australia and Victoria 132 cases of food-borne salmonellosis were associated with the consumption of raw sprouts in 2005 and 20065. For every case of food-borne salmonellosis that is reported by the National Notifiable Diseases Surveillance System, there could be about 7 cases of food-borne salmonellosis in the community6. Therefore, taking into account underreporting, there may be potentially 924 cases of food-borne salmonellosis cases in the community due to the consumption of sprouts. (See
5 Kirk M., 2006. Outbreaks Associated with Raw Sprouts. OzFoodNet presentation. 6 Hall G. et al. 2006. An estimate of under-reporting of food-borne notifiable diseases. NCEPH Working Paper Number 52. February 2006

7
conclusion of Option 1(a) for more discussion on actual number of cases and costs of food-borne illness in a given year). The burden of illness from 924 cases in outbreak years is estimated as follows: Direct Health Care / Medical Costs
• Depending on the severity of illness, different levels of treatment would be required. It is estimated that out of the 924 cases, there could be 26% or 240 GP visits and 0.3% or about 3 hospitalisations7.
• Average cost of a GP visit and hospitalisation are estimated at AUD 70 and AUD 1,500 respectively. Therefore costs of 240 GP visits and 3 hospitalisations are AUD 17,000 and AUD 4,500 respectively8.
• Total health care /medical related costs estimated at AUD 21,500 per year.
Productivity
• It is estimated that 924 cases could lead to an average of 989 days of lost/paid work activities per year (Abelson et al (2006) reports that for 5.4 million cases of food-borne gastroenteritis 5.8 million days lost/paid activities or an average 1.07 days for each case of food-borne salmonellosis).
• 989 days of lost productivity is an average estimate. Not all affected people will be in the workforce. However even for those outside the workforce; the elderly, young and people caring for children, someone in the workforce may be affected as a result of needing to care for the sick or the other dependants for whom the sick are responsible for caring.
• As per Abelson et al (2006), the inflation adjusted economic value for time off work
and loss of disrupted household time, is estimated at AUD 187 and AUD 93 per day respectively or a total of AUD 280 per day.
• The total economic costs of lost productivity and household time are therefore approximately AUD 277,000 per year (280 X 989).
Health, Welfare and Loss of Life - Based on Quality Adjusted Life Day (QALD’s) and Willingness to Pay For loss of health/welfare, Attachment 1 outlines incidence of food-borne illnesses, severity in terms of Quality Adjusted Life Days (QALDs) lost and current values of a QALD and value of a statistical Life. The QALDs or days of compromised health are separate from lost productivity days. While an average 1.07 day for every case of food-borne illness may be lost in terms of work or productivity, the health loss due to duration of illness may be much greater (See Kemmeram et al. 20069 and Attachment 1 for details of duration /incidence).
7 This is based on an estimated 1.4 million cases requiring GP visits and 15,000 hospitalisations out of 5.4 million cases of food-borne illnesses in Abelson et al (2006). 8 Based on Abelson et al (2006) cost of a GP visit i.e. AUD 60 and hospitalisation AUD 1254 adjusted for inflation. 9 http://www.rivm.nl/bibliotheek/rapporten/330080001.pdf
8
• About 86% of the cases are estimated to be mild, equivalent to a loss of 6 days of
perfect health or QALDs. The value of a QALD is estimated at AUD 442.
• Accordingly from 924 potential cases, 795 will affect about 6 days of perfect health each or 4,770 days. The Australian Institute of Health & Welfare (AIHW) disability weight for an uncomplicated gastroenteritis illness is estimated at about 9.3%10. Therefore adjusting for disability weights, about 444 days of perfect health or QALDs may be lost due to mild cases. Value of 444 days at AUD 442 per day is about AUD 196,000 per year.
• For moderate cases i.e. 15%, the loss is 11 QALDs. These 139 (15% of 924) cases could affect 1529 days of illness. Applying disability weighting of 9.3% about 142 QALDs may be lost. The total value of health loss for 142 QALDs is about AUD 63,000 per year.
• A small number, 1.8 %, will be the extreme cases and could involve 16 days each. For 17 cases, this results in 272 days. Applying disability weight of 9.3% about 25 QALDs may be lost. Total value of health loss for extreme cases is estimated at about AUD 11,000 per year.
• Willingness to pay to avoid a hospitalised case is estimated at AUD 1140 (i.e.
inflation adjusted value of 3 hospitalised cases at the cost of AUD 354 each, Abelson et al 2006).
• There are about 1% mild, 0.2% moderate and 0.02% severe cases involving reactive arthritis. Accordingly from potential 924 cases of illness identified, about 9 cases are identified to be mild, that may affect 222 days. Out of the potential 1,998 days affected due to mild reactive arthritis, applying the disability weight for a mild rheumatoid arthritis i.e. 21%11 leads to a potential 420 QALDs lost or about AUD 185,000 per year (420 X 442). Similarly for about 1.8 moderate cases, 222 days may also be affected. Out of about 400 days affected, applying the AIHW disability weight of about 37%of moderate rheumatoid arthritis about 148 QALDs may be lost. Loss of health due to moderate reactive arthritis cases is estimated about AUD 65,000 (148X 442) per year. In severe cases of reactive arthritis or .18 cases (i.e. .0002 of 924 potential cases) 222 days each or about 40 days may be affected. As the AIHW disability weight for severe rheumatoid arthritis is estimated at 94% about 38 QALDs may be lost at estimated AUD 17,000 per year (38X442). There is also a 0.02% likelihood of acquiring Irritable Bowel Syndrome (IBS). Therefore about 0.2 of the cases may be adversely affected lifelong. Applying the AIHW disability weight of 40%12 of Inflammatory Bowel Disease for value of life i.e. AUD 3.74 million to the IBD cases loss of health attributable to IBD is estimated at about AUD 299,000 per year. Combining IBD and reactive arthritis, loss of health estimated at about 566,000 per year.
10 Australian Institute of Health and Welfare http://www.aihw.gov.au/publications/phe/bdia/bdia.pdf :Pg. 186 11 Australian Institute of Health and Welfare http://www.aihw.gov.au/publications/phe/bdia/bdia.pdf : Pg. 199 12 Australian Institute of Health and Welfare http://www.aihw.gov.au/publications/phe/bdia/bdia.pdf : Pg. 198

9
• The incidence of death from a food-borne illness is estimated at .0015%13. Inflation adjusted value of statistical life is about AUD 3.74 million. For 924 cases there will be .014 deaths each year and total loss from death is equivalent to about AUD 52,000 per year.
• The total health, welfare loss and loss of life, is therefore estimated at about AUD 890,000 per year.
Loss to Industry from food- borne illness
• Industry suffers from loss of sales, goodwill and consumer confidence.
• In extreme situations businesses can shut down on being identified as the cause of a food-borne illness (e.g. a WA sprout business in 2005/06 was shut down), thereby causing loss of employment and output. No attempt has been made in the present analysis to quantify such a loss.
Overall potential costs of food-borne illness as estimated above are AUD 1.19 million (sum of direct health care, productivity, health welfare and loss of life costs). Cost per case in relation to 924 cases is about AUD 1,300. Benefits There are no additional benefits for the status quo. Conclusion Option 1(a) – Abandon the Proposal, thus maintaining the status quo The total cost of food-borne illness estimated above is based on Australian outbreak data over 2 years. While there is international evidence from the US14 regarding the frequent nature of sprouts related food-borne illness outbreaks there is no further Australian data regarding the frequency of reported outbreaks caused by consumption of sprouts per se. Therefore for the purposes of this analysis (to annualise costs and benefits from this proposal) it is assumed that if similar outbreaks are frequent, they may occur every 2 years. Alternatively if such outbreaks are infrequent, they may only occur once in about 515 years. Accordingly the annual costs of food-borne illness due to consumption of sprouts from base costs of AUD 1.19 million may be AUD 600,000 per year (if such events occur biannually) or about AUD 240,000 (if such outbreaks occur once in every 5 years). In summary community costs of food-borne illness due to consumption of sprouts may be in the range of AUD 240,000 – AUD 600,000 per year.
13 Based on 80 deaths from 5.4 million cases of food-borne illness each year, Abelson et al. 2006 14 http://www.fda.gov/OHRMS/DOCKETS/98fr/05-8103.htm 15 See http://www.foodstandards.gov.au/_srcfiles/SPROUTS%20Poster.pdf for more details on frequency of international outbreaks.
10
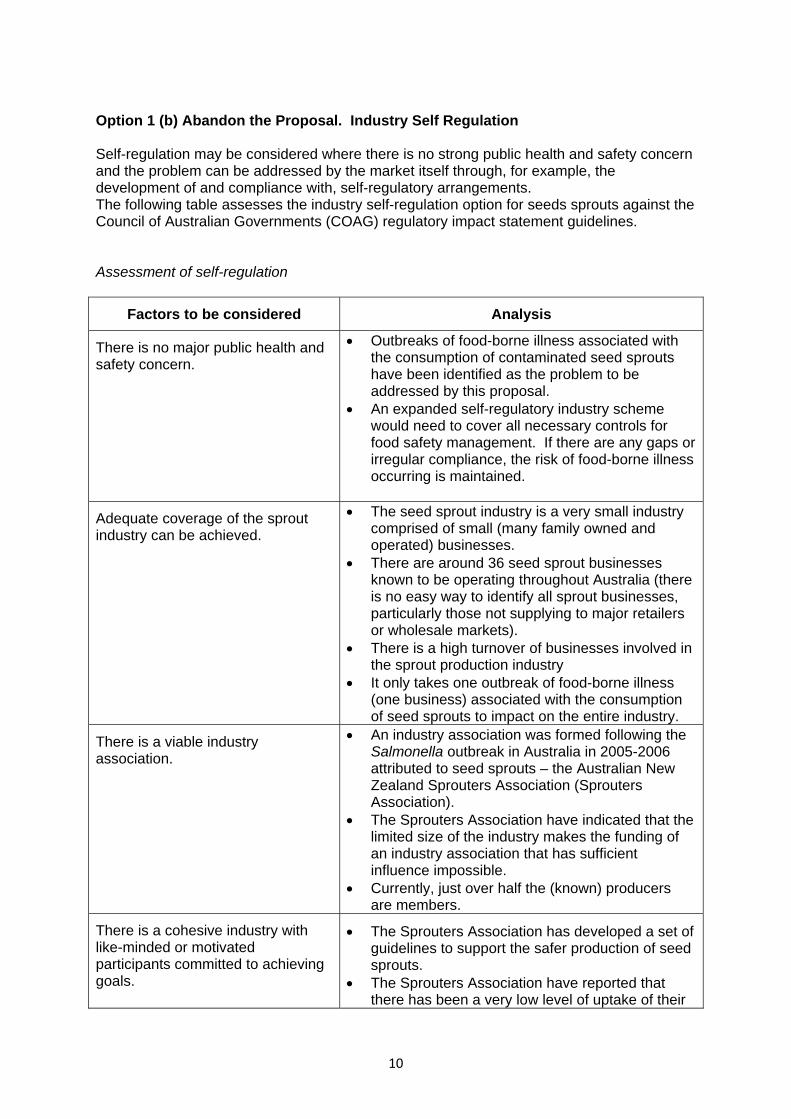
Option 1 (b) Abandon the Proposal. Industry Self Regulation Self-regulation may be considered where there is no strong public health and safety concern and the problem can be addressed by the market itself through, for example, the development of and compliance with, self-regulatory arrangements. The following table assesses the industry self-regulation option for seeds sprouts against the Council of Australian Governments (COAG) regulatory impact statement guidelines. Assessment of self-regulation
Factors to be considered Analysis
There is no major public health and safety concern.
• Outbreaks of food-borne illness associated with the consumption of contaminated seed sprouts have been identified as the problem to be addressed by this proposal.
• An expanded self-regulatory industry scheme would need to cover all necessary controls for food safety management. If there are any gaps or irregular compliance, the risk of food-borne illness occurring is maintained.
Adequate coverage of the sprout industry can be achieved.
• The seed sprout industry is a very small industry comprised of small (many family owned and operated) businesses.
• There are around 36 seed sprout businesses known to be operating throughout Australia (there is no easy way to identify all sprout businesses, particularly those not supplying to major retailers or wholesale markets).
• There is a high turnover of businesses involved in the sprout production industry
• It only takes one outbreak of food-borne illness (one business) associated with the consumption of seed sprouts to impact on the entire industry.
There is a viable industry association.
• An industry association was formed following the Salmonella outbreak in Australia in 2005-2006 attributed to seed sprouts – the Australian New Zealand Sprouters Association (Sprouters Association).
• The Sprouters Association have indicated that the limited size of the industry makes the funding of an industry association that has sufficient influence impossible.
• Currently, just over half the (known) producers are members.
There is a cohesive industry with like-minded or motivated participants committed to achieving goals.
• The Sprouters Association has developed a set of guidelines to support the safer production of seed sprouts.
• The Sprouters Association have reported that there has been a very low level of uptake of their

11
guidelines because it is voluntary and businesses do not want to meet the expenses involved in implementation (such as HACCP accreditation, verification testing).
Evidence that voluntary participation can work. • The Sprouters Association has sought
government intervention and the development of regulatory measures (as appropriate) for the industry, because there has been resistance to the voluntary adoption of guidelines.
Conclusion Option 1 (b) Abandon the Proposal. Industry Self Regulation Based on the above, self-regulation is not considered adequate to address the health and safety concerns that have been identified. Option 2(a) Through chain regulatory measures (requirements for seed producers,
seed processors and sprout producers) Costs Industry
(i) Seed Producers
• Cost of separating lucerne seeds for human consumption could range from AUD 1.16 million to 9.68 million annually (industry submission reported that the incremental cost is AUD 1.29 per kg. This could apply to 900 tonnes (including exports) of sprout production only or the entire lucerne crop i.e. 7,500 tonnes annually. The two estimates are given as it may or may not be economically viable to run two separate production systems.
• In addition there may be the cost of demonstrating compliance e.g. record keeping/ auditing and other ongoing costs.
• Total costs for seed producers are estimated at AUD 1.16 million – 9.68 million
annually excluding compliance costs.
(ii) Seed Processors
• Design , construction of premises and other capital equipment is estimated to
initially cost AUD 960, 000 – AUD 9.5 million (while a shed that is export registered for mungbeans may incur minimal additional costs, latest industry data suggests a one-off AUD 50,000 – AUD 500,000 may be incurred by the 19 seed processors supplying seeds other than mung beans).
• Industry sources have indicated that program design for, and implementation of, tracing systems, health and hygiene training, compliance and record keeping are estimated to cost between AUD 10,000 – AUD 20,000 per business on an ongoing annual basis. Excluding Mung Bean seed processors 19 business may be affected

12
resulting in an annual cost of at least AUD 190,000 – AUD 380,000 on an ongoing basis.
• Skills and training requirements are estimated to cost in the range of AUD 500 – AUD
900 per business (based on industry Fresh Care Program). Similarly industry indicated that online programs may be accessed at AUD 100- AUD 200 per business plus cost of staff wages. For 29 businesses, skills and training would cost AUD 15000 – AUD 26,000 per year.
• Based on industry data, seed testing costs are estimated to be AUD 230,000 – AUD
460,000 annually (i.e. AUD 0.10 – 0.20 per kg for 2307 tonnes of all seed used for sprout production).
• Management of other hazards that may be specific to each seed type. Industry
submissions indicated holding lucerne seed as an alternative to scarification may cost AUD 105,000 ongoing (AUD 0.35 per kg for 300 tonnes of lucerne seed).
• Total costs for seed processors are estimated at AUD 960,000 – 9.5 million in the
first year and AUD 540,000 – AUD 970,000 per year thereafter.
(iii) Sprout Producers
• Additional costs of regulatory measures will largely depend on the existing production
practices of the business and compliance arrangements with vendors (e.g Woolworth’s quality assurance requirements). Other local factors may also reduce the incremental cost. For example, NSW businesses have to comply with the Plant and Plant Products Food Safety scheme and their incremental costs are expected to be relatively lower.
• Costs will be incurred to alter premises and equipment (upfront costs). A large sprout producer had indicated that they incurred AUD 1,000 for minor equipment to comply with NSW State requirements. While no further data is available regarding costs incurred by other smaller producers, if the remaining 34 businesses in Australia incur similar costs then costs for this activity is estimated at a minimum of AUD 34,000 (As stated, FZANZ identified about 30 sprout producers nationally through an industry profiling exercise. Subsequent consultations with industry and jurisdictions have confirmed that there may be another 5-10 businesses.. Therefore, there may be up to 40 businesses of which 6 are known to be based in NSW. The remaining 34 may have to change practices to comply).
• Costs will be incurred to develop and implement food safety/HACCP type programs (upfront cost). The average cost is estimated at AUD 2000 per business (industry consultation). This information is consistent with the NSW Plant & Plant Products Food Safety Scheme where the average cost of food safety programs and implementation was identified at AUD 1610 per business in 2002-03 and inflation adjusted current prices would be about AUD 1830. However approximately 60% of sprout producers are known to have already implemented a program that includes some food safety controls (personal communication and interview with wholesale market sellers and market auditors across various states). Therefore additional costs should only apply to the remaining 40% of the businesses. As there could be 40 sprout producing businesses, the incremental costs of a food safety or equivalent program for 16 businesses is estimated at AUD 32,000.
13
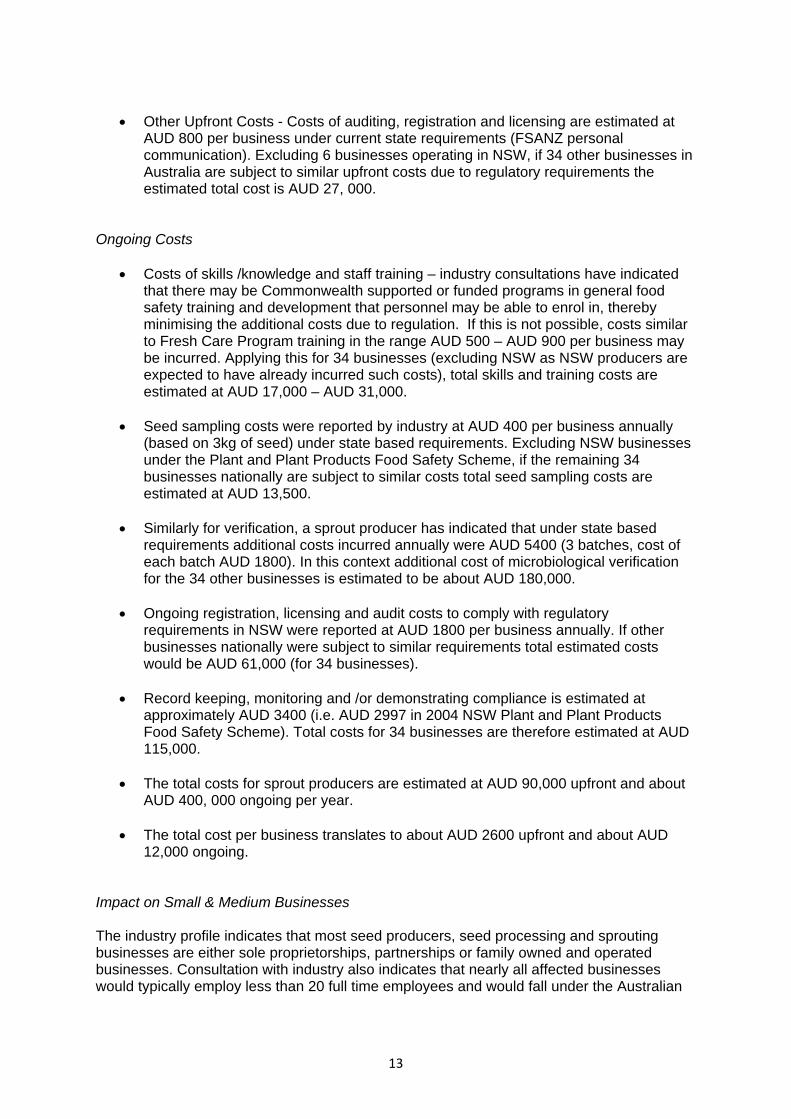
• Other Upfront Costs - Costs of auditing, registration and licensing are estimated at
AUD 800 per business under current state requirements (FSANZ personal communication). Excluding 6 businesses operating in NSW, if 34 other businesses in Australia are subject to similar upfront costs due to regulatory requirements the estimated total cost is AUD 27, 000.
Ongoing Costs
• Costs of skills /knowledge and staff training – industry consultations have indicated that there may be Commonwealth supported or funded programs in general food safety training and development that personnel may be able to enrol in, thereby minimising the additional costs due to regulation. If this is not possible, costs similar to Fresh Care Program training in the range AUD 500 – AUD 900 per business may be incurred. Applying this for 34 businesses (excluding NSW as NSW producers are expected to have already incurred such costs), total skills and training costs are estimated at AUD 17,000 – AUD 31,000.
• Seed sampling costs were reported by industry at AUD 400 per business annually
(based on 3kg of seed) under state based requirements. Excluding NSW businesses under the Plant and Plant Products Food Safety Scheme, if the remaining 34 businesses nationally are subject to similar costs total seed sampling costs are estimated at AUD 13,500.
• Similarly for verification, a sprout producer has indicated that under state based
requirements additional costs incurred annually were AUD 5400 (3 batches, cost of each batch AUD 1800). In this context additional cost of microbiological verification for the 34 other businesses is estimated to be about AUD 180,000.
• Ongoing registration, licensing and audit costs to comply with regulatory requirements in NSW were reported at AUD 1800 per business annually. If other businesses nationally were subject to similar requirements total estimated costs would be AUD 61,000 (for 34 businesses).
• Record keeping, monitoring and /or demonstrating compliance is estimated at approximately AUD 3400 (i.e. AUD 2997 in 2004 NSW Plant and Plant Products Food Safety Scheme). Total costs for 34 businesses are therefore estimated at AUD 115,000.
• The total costs for sprout producers are estimated at AUD 90,000 upfront and about AUD 400, 000 ongoing per year.
• The total cost per business translates to about AUD 2600 upfront and about AUD 12,000 ongoing.
Impact on Small & Medium Businesses The industry profile indicates that most seed producers, seed processing and sprouting businesses are either sole proprietorships, partnerships or family owned and operated businesses. Consultation with industry also indicates that nearly all affected businesses would typically employ less than 20 full time employees and would fall under the Australian

14
Bureau of Statistics (ABS) definition of a small business. Therefore no additional or disproportionate impacts to small business are identified. Government Additional costs to governments will depend on their approach, existing resources, budgetary considerations and the number of businesses operating in their jurisdictions. Consultations with jurisdictions have indicated that they could potentially incur significant costs to develop, implement and maintain a scheme, legislation or an arrangement to regulate sprout producers in their states. Some of these costs may be recovered through cost recovery from industry (e.g. auditing) and are included as part of industry costs. However other costs such as developing the scheme, license and accreditation (fee for privilege type of services) will not be fully recovered due to small number of business operating in this sector. The following estimates are made on the basis of available information: Upfront Costs A government agency indicated that it had incurred upfront costs of about AUD 200,000 to develop its proposal (which incorporates similar requirements). At the time sprout businesses represented about 16% of all plant producers. Therefore proportionate costs attributable to sprout producers could be AUD 32,000.Other jurisdictions may be able to reduce their upfront costs by adopting elements of the current state based requirements (e.g. food safety program template for businesses) in their jurisdiction. However, if this turns out to not be appropriate, then it is estimated that total additional upfront costs for remaining jurisdictions may be in the range of AUD 60,000 (i.e. base costs of AUD 32,000 scaled up for other jurisdictions, where the remaining 65% of sprout producers are known to be operating). Ongoing Costs NSW estimated the Plant and Products Food Safety Scheme enforcement costs at about AUD 162,50016 annually in 2004. However the Plant and Plant Products Food Safety scheme covered 4 sectors including seed sprouts. As sprout producers accounted for 16% of all plant producers, the indicative costs for a jurisdiction to enforce the regulation of seed sprouts in current prices could be about AUD 30,000. Auditing, sampling and other fee for service costs are excluded as they may be recovered from industry and have been estimated in industry compliance costs. If other states incur additional ongoing costs to implement, then total additional ongoing costs for government may be estimated at AUD 55,000 annually (i.e. base costs of AUD 30,000 scaled up to other jurisdictions, where the remaining 65% of sprout producers are known to be operating). While the above costs for government may not be additional costs requiring a budget allocation, this could be thought of as opportunity costs for developing and enforcing regulation. 16 NSWFA Plant and Plant Food Safety Scheme http://www.foodauthority.nsw.gov.au/_Documents/industry_pdf/Plant+Products+Regulatory+Impact+Statement.pdf : Pg 46

15
Consumers Incremental costs of regulatory measures incurred by the industry will be ultimately passed on to the consumers in full or in part. It is unknown to what extent the costs will be passed on. Benefits
• A 23% - 65%17 estimated reduction in incidence of food-borne illness from food safety regulations incorporating a HACCP /equivalent food safety type of program, for high risk plant products (including sprouts).
• The US have experienced about an 80%18 decline in their reported food-borne illness cases due to consumption of sprouts since their industry (all parties involved in production of seed sprouts) incorporated similar preventative controls in the production of sprouts.
• As the average burden of illness was estimated at AUD 240,000- AUD 600,000 per
year, the potential benefits (i.e. 23% - 80% reduction) from regulating seed producers, seed processors and sprout producers are estimated in the range of AUD 55,000 – AUD 480,000 each year.
Benefits not valued Benefits not valued include:
• the value of managing food safety business risk. The value of managing this business risk is evidenced by the fact that many industry participants have voluntarily decided to put management systems in place. The concern as a regulator is that some industry participants potentially do not understand the nature of the risk nor how to manage it
• the negative externalities avoided flowing from the negligent activities of one or more industry participant. Past outbreaks associated with other commodities have shown negative business outcomes for businesses in the same industry or in related industries not associated with the disease outbreak
• consumer expenditure for redress potentially saved and cost of uncertainty to consumers.
Summary & Discussion Option 2(a) Through chain regulatory measures (requirements for seed producers, seed processors and sprout producers) 17 NSWFA Plant and Plant Food Safety Scheme http://www.foodauthority.nsw.gov.au/_Documents/industry_pdf/Plant+Products+Regulatory+Impact+Statement.pdf : Pg 24 18 From 1364 Reported Illnesses to 272 Reported illnesses. For more details see http://www.fda.gov/OHRMS/DOCKETS/98fr/05-8103.htm

16
Total costs Identified in the following range: Affected Party Upfront Costs (AUD) Ongoing Costs (AUD) Seed Producers / Growers 1.16 million – 9.68 million Seed Processors 960,000 – 9.5 million 540,000 – 970,000 Sprout Producers 90,000 400, 000 Government 60,000 55,000 Consumers Some or all costs passed on Some or all costs passed on Total 1.24 million – 9.69 million 2.21 million – 10.93 million From the table above, the estimated higher end of costs to all affected parties could be up to about AUD 9.7 million upfront and another AUD 10.93 million ongoing. The total costs to all parties involved in the production of sprouts is likely to be overestimated due to the shifting of costs e.g. if seed processors are thoroughly testing for microorganisms, then costs of microbiological testing and verification for sprout producers may be reduced. The potential for higher regulatory costs to seed producers and seed processors reflect that the majority of their seeds are being used for non-sprouting purposes and their total production may be affected if they were regulated for the safety of sprouts. However, only up to AUD 480,000 per year of benefits may be realised if all parties involved in the production of seed sprouts comply with similar preventative control measures (based on the US experience discussed in the benefits section). Taking into consideration the potential for significant costs to seed producers and seed processors, it is likely that costs of regulating seed producers and seed processors will not achieve the maximum net benefit for the community as a whole. Though ideal from a food safety perspective, the burden of illness or the estimated risk is not commensurate to justify regulatory requirements on seed producers and seed processors. Also, the practicality and effectiveness of regulating seed processors is uncertain as they may be able to prevent further contamination, but could not necessarily address existing contamination passed on to them from the seed production stage (See Section 9.3.1 of the 2nd Assessment Report for more information on the effectiveness and practicality of proposed food safety measures). Adoption of an extremely conservative approach in this case would not be cost effective and go against the principles of minimum necessary regulation. Therefore FSANZ recommends that seed producers and seed processors not be subject to regulatory requirements. Option 2(b) Regulatory food safety measures for sprout producers only
Costs As estimated under Option 3 (a) total costs to sprout producers are in order of AUD 90,000 upfront and another AUD 400,000 ongoing. These costs are much lower compared to seed producers and seed processors. In addition costs to government are estimated to be AUD 60,000 upfront and AUD 55,000 ongoing. Therefore total costs of option 3(b) are estimated to be about AUD 150,000 upfront and AUD 455,000 ongoing.

17
Benefits For high risk plant products (including sprouts), a 23% -65%19 reduction may be possible from food safety regulations incorporating a HACCP /equivalent food safety type of program. Therefore FSANZ estimates that by regulating sprout producers only a 23%-65% reduction in burden of illnesses or benefits of AUD 55,000 – AUD 390,000 per year may be realised (i.e. 23% - 65% of estimated AUD 240,000 – AUD 600,000 burden of illness). As there are limitations and uncertainty surrounding some of the key cost and benefit estimates, the outcomes are subject to limitations and sensitivity analysis in the following section. Limitations & Sensitivity Analysis
• The average cost of food-borne illness due to consumption of seed sprouts was based on outbreak data from one particular outbreak which occurred at a point in time. The actual burden off illness for an outbreak or for illnesses for a particular year is highly uncertain. In some years few illnesses may be attributed to sprouts yet it is possible that the cost of an outbreak could far exceed costs experienced to date. Therefore, the current burden of illness as estimated by FSANZ should not be taken as fully representative of the cost of food-borne illness that may be possible due to consumption of sprouts. Therefore Sensitivity Analyses scenarios take into account a lower AUD 240,000 and upper range AUD 600,000 of burden of illness due to consumption of sprouts.
• Regulatory costs were estimated on the basis of a limited number of submissions, information sources and consultation with stakeholders. Some were based on actual costs incurred by business and jurisdictions to comply with some of the current requirements and then extrapolated. Secondly the full implications for regulatory costs may not be evident at this stage and would depend on the nature and details of the implementation arrangements in each state. While further feedback is sought from stakeholders regarding the accuracy of the costs, the sensitivity analyses examines additional hypothetical scenarios of increasing and decreasing costs by 25%.
• Monetary benefits (in terms of reducing the burden of illness) from regulatory
requirements is uncertain and wide ranging i.e. 23% - 80%. An 80% decline was observed in the US after the adoption of through- chain preventative control measures including seed producers, seed processors and sprout producers. A similar approach would not be cost effective in Australia. Based on the outcomes in the US, a pro-rated reduction by regulating sprout producers alone is unavailable. As the proportion of contamination/ risk prevention at each stage cannot be ascertained, FSANZ estimates a lower range of risk reduction i.e. 23% and an upper range of 65% by regulating sprout producers only (based on evidence from plant products sector).
19 NSWFA Plant and Plant Food Safety Scheme http://www.foodauthority.nsw.gov.au/_Documents/industry_pdf/Plant+Products+Regulatory+Impact+Statement.pdf : Pg 24
18
• The base case discount rate is chosen at 7% with additional sensitivity testing at 3% and 11% scenarios.
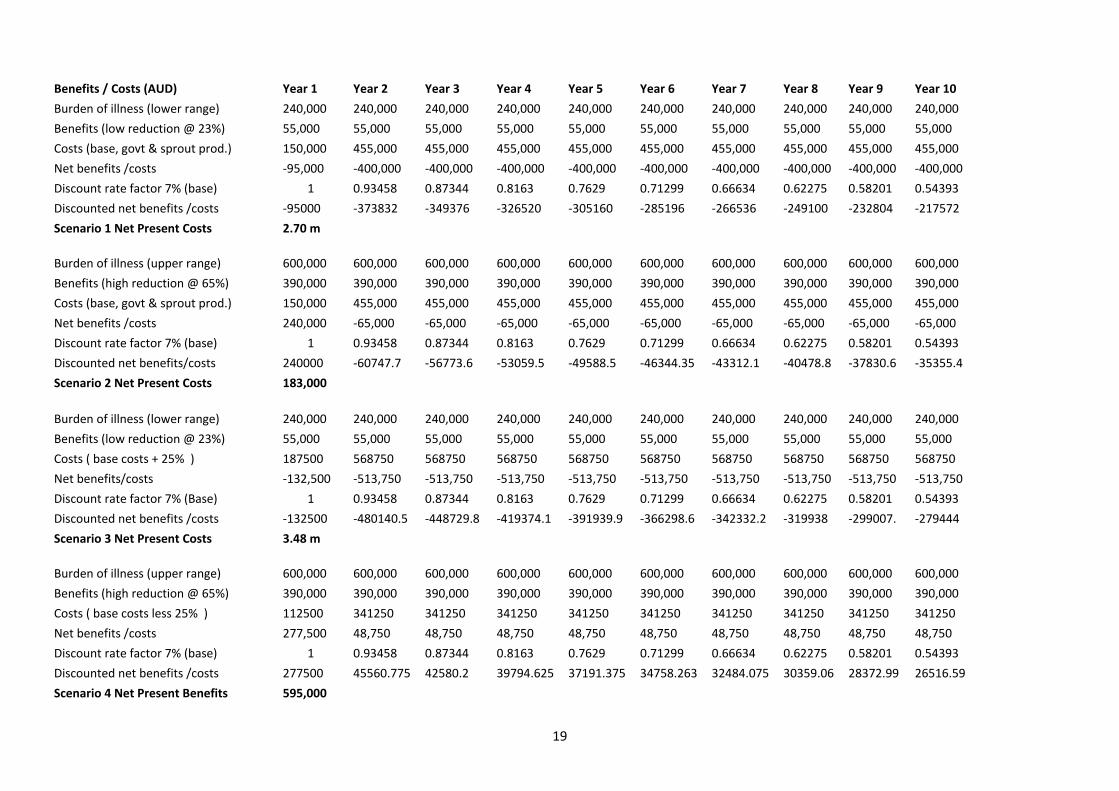
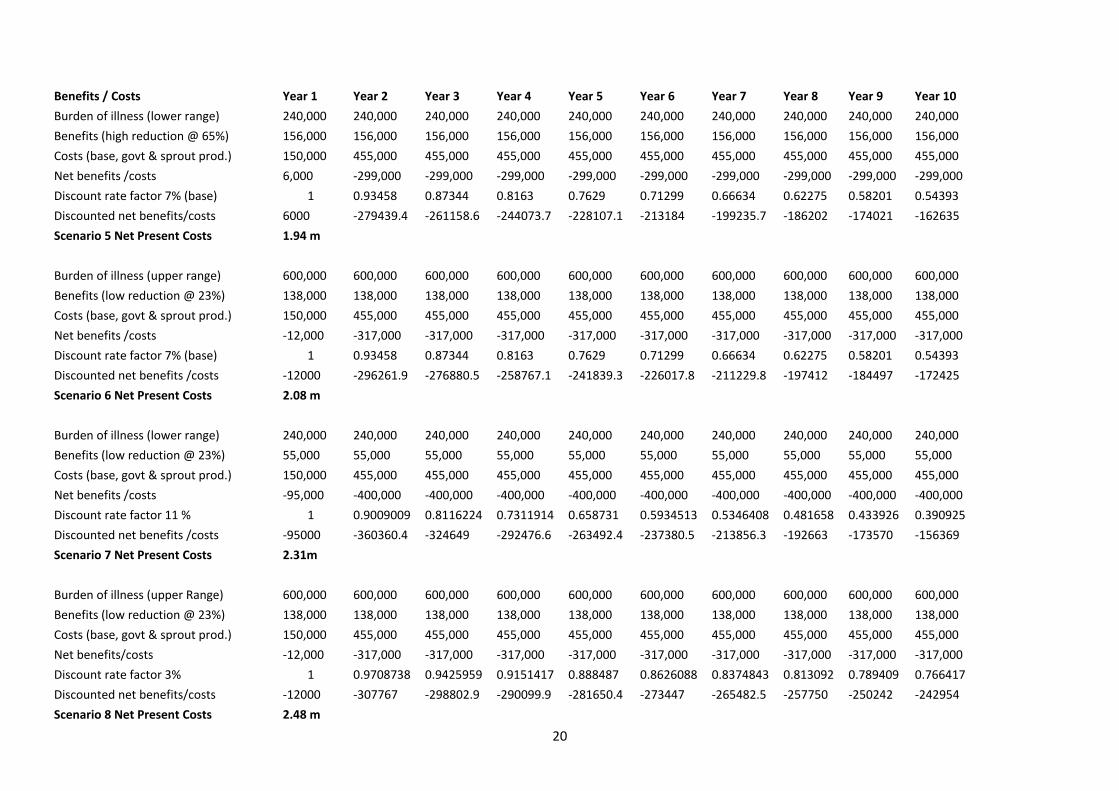
Net Benefit/Cost Estimates The following calculations are based on 8 scenarios, varying the level of cost of food-borne illness, benefits (cost savings), costs to government and industry and the discount rate applied to the proposal. The results show that the 10 year Net Present Benefits/ Costs from the Proposal of regulating sprout producers only may be in the range of AUD 595,000 (benefits) to AUD 3.48 million in costs depending on the variables (See following pages for computation of estimates under different scenarios).
19
Benefits / Costs (AUD) Year 1 Year 2 Year 3 Year 4 Year 5 Year 6 Year 7 Year 8 Year 9 Year 10
Burden of illness (lower range) 240,000 240,000 240,000 240,000 240,000 240,000 240,000 240,000 240,000 240,000
Benefits (low reduction @ 23%) 55,000 55,000 55,000 55,000 55,000 55,000 55,000 55,000 55,000 55,000
Costs (base, govt & sprout prod.) 150,000 455,000 455,000 455,000 455,000 455,000 455,000 455,000 455,000 455,000
Net benefits /costs ‐95,000 ‐400,000 ‐400,000 ‐400,000 ‐400,000 ‐400,000 ‐400,000 ‐400,000 ‐400,000 ‐400,000
Discount rate factor 7% (base) 1 0.93458 0.87344 0.8163 0.7629 0.71299 0.66634 0.62275 0.58201 0.54393
Discounted net benefits /costs ‐95000 ‐373832 ‐349376 ‐326520 ‐305160 ‐285196 ‐266536 ‐249100 ‐232804 ‐217572
Scenario 1 Net Present Costs 2.70 m
Burden of illness (upper range) 600,000 600,000 600,000 600,000 600,000 600,000 600,000 600,000 600,000 600,000
Benefits (high reduction @ 65%) 390,000 390,000 390,000 390,000 390,000 390,000 390,000 390,000 390,000 390,000
Costs (base, govt & sprout prod.) 150,000 455,000 455,000 455,000 455,000 455,000 455,000 455,000 455,000 455,000
Net benefits /costs 240,000 ‐65,000 ‐65,000 ‐65,000 ‐65,000 ‐65,000 ‐65,000 ‐65,000 ‐65,000 ‐65,000
Discount rate factor 7% (base) 1 0.93458 0.87344 0.8163 0.7629 0.71299 0.66634 0.62275 0.58201 0.54393
Discounted net benefits/costs 240000 ‐60747.7 ‐56773.6 ‐53059.5 ‐49588.5 ‐46344.35 ‐43312.1 ‐40478.8 ‐37830.6 ‐35355.4
Scenario 2 Net Present Costs 183,000
Burden of illness (lower range) 240,000 240,000 240,000 240,000 240,000 240,000 240,000 240,000 240,000 240,000
Benefits (low reduction @ 23%) 55,000 55,000 55,000 55,000 55,000 55,000 55,000 55,000 55,000 55,000
Costs ( base costs + 25% ) 187500 568750 568750 568750 568750 568750 568750 568750 568750 568750
Net benefits/costs ‐132,500 ‐513,750 ‐513,750 ‐513,750 ‐513,750 ‐513,750 ‐513,750 ‐513,750 ‐513,750 ‐513,750
Discount rate factor 7% (Base) 1 0.93458 0.87344 0.8163 0.7629 0.71299 0.66634 0.62275 0.58201 0.54393
Discounted net benefits /costs ‐132500 ‐480140.5 ‐448729.8 ‐419374.1 ‐391939.9 ‐366298.6 ‐342332.2 ‐319938 ‐299007. ‐279444
Scenario 3 Net Present Costs 3.48 m
Burden of illness (upper range) 600,000 600,000 600,000 600,000 600,000 600,000 600,000 600,000 600,000 600,000
Benefits (high reduction @ 65%) 390,000 390,000 390,000 390,000 390,000 390,000 390,000 390,000 390,000 390,000
Costs ( base costs less 25% ) 112500 341250 341250 341250 341250 341250 341250 341250 341250 341250
Net benefits /costs 277,500 48,750 48,750 48,750 48,750 48,750 48,750 48,750 48,750 48,750
Discount rate factor 7% (base) 1 0.93458 0.87344 0.8163 0.7629 0.71299 0.66634 0.62275 0.58201 0.54393
Discounted net benefits /costs 277500 45560.775 42580.2 39794.625 37191.375 34758.263 32484.075 30359.06 28372.99 26516.59
Scenario 4 Net Present Benefits 595,000
20
Benefits / Costs Year 1 Year 2 Year 3 Year 4 Year 5 Year 6 Year 7 Year 8 Year 9 Year 10
Burden of illness (lower range) 240,000 240,000 240,000 240,000 240,000 240,000 240,000 240,000 240,000 240,000
Benefits (high reduction @ 65%) 156,000 156,000 156,000 156,000 156,000 156,000 156,000 156,000 156,000 156,000
Costs (base, govt & sprout prod.) 150,000 455,000 455,000 455,000 455,000 455,000 455,000 455,000 455,000 455,000
Net benefits /costs 6,000 ‐299,000 ‐299,000 ‐299,000 ‐299,000 ‐299,000 ‐299,000 ‐299,000 ‐299,000 ‐299,000
Discount rate factor 7% (base) 1 0.93458 0.87344 0.8163 0.7629 0.71299 0.66634 0.62275 0.58201 0.54393
Discounted net benefits/costs 6000 ‐279439.4 ‐261158.6 ‐244073.7 ‐228107.1 ‐213184 ‐199235.7 ‐186202 ‐174021 ‐162635
Scenario 5 Net Present Costs 1.94 m
Burden of illness (upper range) 600,000 600,000 600,000 600,000 600,000 600,000 600,000 600,000 600,000 600,000
Benefits (low reduction @ 23%) 138,000 138,000 138,000 138,000 138,000 138,000 138,000 138,000 138,000 138,000
Costs (base, govt & sprout prod.) 150,000 455,000 455,000 455,000 455,000 455,000 455,000 455,000 455,000 455,000
Net benefits /costs ‐12,000 ‐317,000 ‐317,000 ‐317,000 ‐317,000 ‐317,000 ‐317,000 ‐317,000 ‐317,000 ‐317,000
Discount rate factor 7% (base) 1 0.93458 0.87344 0.8163 0.7629 0.71299 0.66634 0.62275 0.58201 0.54393
Discounted net benefits /costs ‐12000 ‐296261.9 ‐276880.5 ‐258767.1 ‐241839.3 ‐226017.8 ‐211229.8 ‐197412 ‐184497 ‐172425
Scenario 6 Net Present Costs 2.08 m
Burden of illness (lower range) 240,000 240,000 240,000 240,000 240,000 240,000 240,000 240,000 240,000 240,000
Benefits (low reduction @ 23%) 55,000 55,000 55,000 55,000 55,000 55,000 55,000 55,000 55,000 55,000
Costs (base, govt & sprout prod.) 150,000 455,000 455,000 455,000 455,000 455,000 455,000 455,000 455,000 455,000
Net benefits /costs ‐95,000 ‐400,000 ‐400,000 ‐400,000 ‐400,000 ‐400,000 ‐400,000 ‐400,000 ‐400,000 ‐400,000
Discount rate factor 11 % 1 0.9009009 0.8116224 0.7311914 0.658731 0.5934513 0.5346408 0.481658 0.433926 0.390925
Discounted net benefits /costs ‐95000 ‐360360.4 ‐324649 ‐292476.6 ‐263492.4 ‐237380.5 ‐213856.3 ‐192663 ‐173570 ‐156369
Scenario 7 Net Present Costs 2.31m
Burden of illness (upper Range) 600,000 600,000 600,000 600,000 600,000 600,000 600,000 600,000 600,000 600,000
Benefits (low reduction @ 23%) 138,000 138,000 138,000 138,000 138,000 138,000 138,000 138,000 138,000 138,000
Costs (base, govt & sprout prod.) 150,000 455,000 455,000 455,000 455,000 455,000 455,000 455,000 455,000 455,000
Net benefits/costs ‐12,000 ‐317,000 ‐317,000 ‐317,000 ‐317,000 ‐317,000 ‐317,000 ‐317,000 ‐317,000 ‐317,000
Discount rate factor 3% 1 0.9708738 0.9425959 0.9151417 0.888487 0.8626088 0.8374843 0.813092 0.789409 0.766417
Discounted net benefits/costs ‐12000 ‐307767 ‐298802.9 ‐290099.9 ‐281650.4 ‐273447 ‐265482.5 ‐257750 ‐250242 ‐242954
Scenario 8 Net Present Costs 2.48 m
21
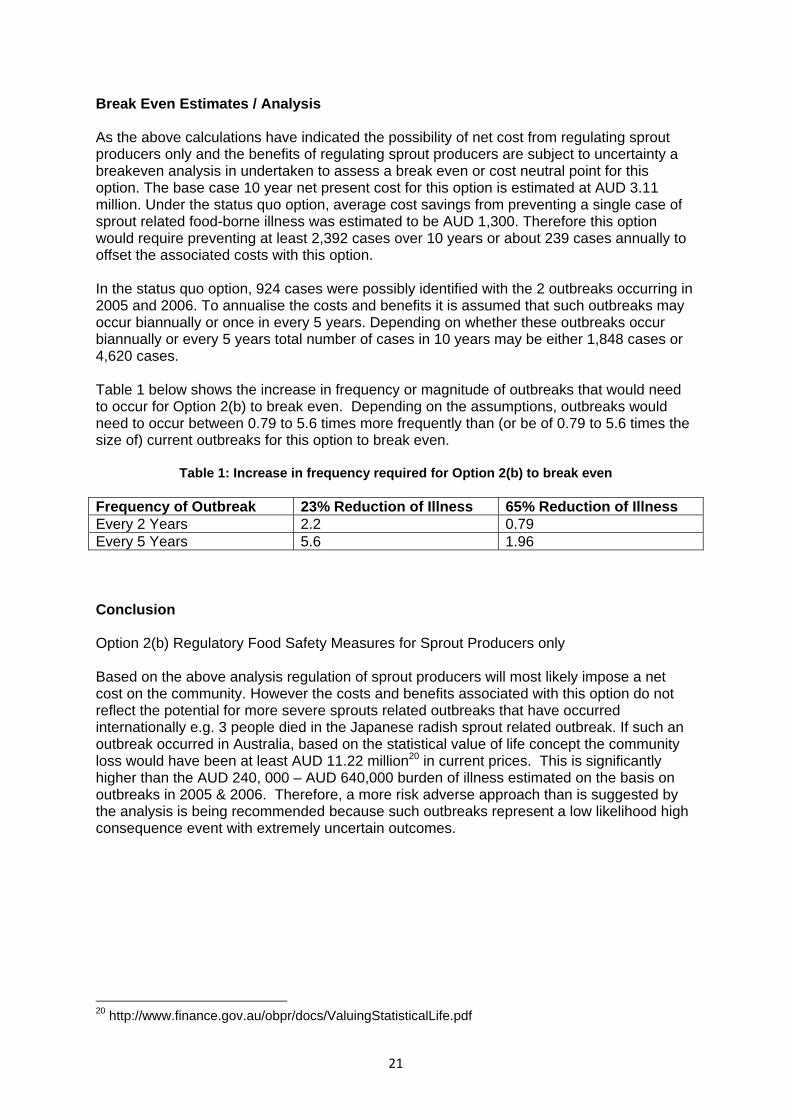
Break Even Estimates / Analysis As the above calculations have indicated the possibility of net cost from regulating sprout producers only and the benefits of regulating sprout producers are subject to uncertainty a breakeven analysis in undertaken to assess a break even or cost neutral point for this option. The base case 10 year net present cost for this option is estimated at AUD 3.11 million. Under the status quo option, average cost savings from preventing a single case of sprout related food-borne illness was estimated to be AUD 1,300. Therefore this option would require preventing at least 2,392 cases over 10 years or about 239 cases annually to offset the associated costs with this option. In the status quo option, 924 cases were possibly identified with the 2 outbreaks occurring in 2005 and 2006. To annualise the costs and benefits it is assumed that such outbreaks may occur biannually or once in every 5 years. Depending on whether these outbreaks occur biannually or every 5 years total number of cases in 10 years may be either 1,848 cases or 4,620 cases. Table 1 below shows the increase in frequency or magnitude of outbreaks that would need to occur for Option 2(b) to break even. Depending on the assumptions, outbreaks would need to occur between 0.79 to 5.6 times more frequently than (or be of 0.79 to 5.6 times the size of) current outbreaks for this option to break even.
Table 1: Increase in frequency required for Option 2(b) to break even Frequency of Outbreak 23% Reduction of Illness 65% Reduction of Illness Every 2 Years 2.2 0.79 Every 5 Years 5.6 1.96 Conclusion Option 2(b) Regulatory Food Safety Measures for Sprout Producers only Based on the above analysis regulation of sprout producers will most likely impose a net cost on the community. However the costs and benefits associated with this option do not reflect the potential for more severe sprouts related outbreaks that have occurred internationally e.g. 3 people died in the Japanese radish sprout related outbreak. If such an outbreak occurred in Australia, based on the statistical value of life concept the community loss would have been at least AUD 11.22 million20 in current prices. This is significantly higher than the AUD 240, 000 – AUD 640,000 burden of illness estimated on the basis on outbreaks in 2005 & 2006. Therefore, a more risk adverse approach than is suggested by the analysis is being recommended because such outbreaks represent a low likelihood high consequence event with extremely uncertain outcomes.
20 http://www.finance.gov.au/obpr/docs/ValuingStatisticalLife.pdf

22
Comparison of Options A comparison of options indicates that the status quo would not be preferred as it continues to expose the community to the risk of food-borne illness due to consumption of sprouts, with an average cost of food- borne illness estimated to be AUD 240,000– AUD 600,000 annually. As discussed above, industry self regulation is not an adequate option to address health and safety concerns. A through-chain regulation option incorporating preventative control measures for all sectors involved in the production of sprouts (i.e. seed producers, seed processors and sprout producers) may be ideal from a food safety perspective. However this option is estimated to be cost ineffective and could be inconsistent with principles of minimum necessary regulation for achieving the maximum net benefit for the community as a whole. Regulation of sprout producers only is likely on present estimates to impose a net cost on the community; however it is more cost effective than the through-chain option. Based on sensitivity analysis, this option is estimated to have an NPV in the range of positive AUD 0.6 million to negative AUD 3.48 million. It is likely to result in less illness than would be recorded in the status quo. The costs and benefits associated with regulating sprout producers are based on the last known outbreaks in Australia (2005 and 2006 data). The costs and benefits associated with a potential outbreak could be much higher or lower. A high cost scenario is not unrealistic as large scale food-bourne illness outbreaks associated with sprouts or salad components have occurred in developed countries in recent years some of which have resulted in deaths and severe illness. Consultation The 1st Assessment Report has gone through a public consultation process. During the development of this Proposal extensive consultation has been undertaken with all stakeholders through Standard Development Committee meetings, request for submissions and targeted consultations with industry (See section 10 of the 2nd Assessment Report for more information on consultation to date on this Proposal). FSANZ would like to provide a further opportunity to stakeholders and invite feedback regarding the costs, benefits and any other information or comments in regard to the following questions: Are there any other affected parties that have not been identified in this regulatory impact statement that should be included? Are there any other costs or benefits that should be considered in the regulatory impact statement? Do you consider that the benefits of approving this Proposal outweigh the costs? If you have any data or information to support your view, FSANZ would welcome the opportunity to consider it. Are there any other costs or benefits for business that have not been covered in the regulatory impact statement?

23
Are there any other costs or benefits for government that have not been considered in the regulatory impact statement? Are the sensitivity analyses appropriate to cover the range of outcomes for the preferred option? Conclusion & Recommended Option Based on the risk and impact analyses, on the face of it the status quo option appears to present the highest net benefits to the community. The inherent limitations in extrapolating from a single outbreak event as a basis for estimating costs of potential future events in an area characterised by unpredictability should be noted. A more risk adverse approach than is suggested by the analysis is being recommended because such outbreaks potentially represent a low likelihood high consequence event with extremely uncertain outcomes. Consequently FSANZ sees merit in the regulation of sprout producers only and recommends this as the preferred option. This option is preferred because:
• it addresses public health and safety concerns arising from consumption of sprouts; • it does not place an undue burden on seed producers and seed processors; • it is consistent with principles of minimum necessary regulation; and • it is practical, less costly and can recover its costs within the range of benefits
identified in the Proposal. The industry self regulation option was not considered feasible and the status quo represents an unacceptable public health and safety risk. Implementation and Review Implementation of the Code is the responsibility of the State and Territory governments. The Implementation Sub-Committee21 (ISC) facilitates the consistent national implementation of the Code and is responsible for developing nationally consistent implementation approaches. A recent initiative of ISC to harmonise the processes of standard development and implementation is, the integrated model for standards development and consistent implementation (the integrated model). The integrated model is built on the concept that a ‘package’ of information is provided to Food Ministers, rather than a just a draft standard and has been piloted on the Primary Production and Processing Standard for Eggs and Egg Products. In March 2010 FRSC endorsed the development of implementation plans for other primary production and processing standards, which would include this Proposal. Some of the possible implementation costs have been factored into the impact analyses.
21 The Implementation Sub-Committee (ISC) is a sub-committee of the Food Regulation Standing Committee. Its role is to develop and oversee a consistent approach across jurisdictions to implementation and enforcement of food regulations and standards, regardless of whether food is sourced from domestic producers, export-registered establishments or from imports.

24
Attachment 1: Incidence, Health Outcomes and Duration of food-borne salmonellosis Explanatory Notes Outcomes: A range of adverse health outcomes have been reported to be associated with human illness resulting from a food-borne salmonellosis. An occurrence could vary from a mild gastroenteritis illness (GE) to extreme consequences like death. Long term adverse health complications include reactive arthritis and irritable bowel Syndrome. These outcomes have been derived from the Dutch study (Kemmeren, et al. 200622). Incidence: A Mild case of Gastroenteritis illness is classified as one that involves no visit to a general practitioner (GP), a moderate case involves a GP visit and a severe case would be one that requires hospitalisation. The breakdown of cases into Mild, Moderate and Severe cases of illness is based on Kemmeren et al. (2006) estimate of 35,000 community cases of salmonella- associated gastroenteritis and sequelae illness. For example out of the 35,000 most likely community wide cases, 30,000 or approximately .857 or (approximately 86%) could experience mild symptoms. Quality Adjusted Life Day (QALD): QALD refers to a day of life adjusted for its quality or its value. A day in perfect health is considered equal to 1.0 QALD. The estimated number of QALDs lost due to illness has also been derived from the Dutch study where a mild illness may only impact about 5 days whereas a severe illness could affect up to 16 days of an individual’s life (Kemmerer, et al. 2006). Value of QALD: measures what the community is willing to pay to avoid a day of an adverse health outcome or consequence. The recommended Value of a Life Year (VLY) which may also be expressed as Quality Adjusted Life Year (QALY) in Australia is AUD151, 000 22 http://www.rivm.nl/bibliotheek/rapporten/330080001.pdf : Pg 58
Outcomes Incidence Total QALDs Lost per Illness
Gastroenteritis Mild .857 5.58 Moderate .154 10.65 Severe .018 16.15 Reactive Arthritis Mild Moderate Severe
.011 .002
.0002
222 222 222
Irritable Bowel Syndrome .0002 Life Long Death .001 8454

25
(Abelson, 200723). Therefore the value of a Quality Adjusted Life Day (QALD) would be AUD151, 000 divided by 365 or AUD 414 in 2007 prices. Based on the Australian Taxation Office’s (ATO’s) Consumer Price Index (CPI), and adjusted for 2009 inflation, the value of QALD is AUD 442 (increase of 6.8%).
23 http://www.finance.gov.au/obpr/docs/ValuingStatisticalLife.pdf


![PROPOSAL P1004 PRIMARY PRODUCTION ... 6 September 2010 [19-10] PROPOSAL P1004 PRIMARY PRODUCTION & PROCESSING STANDARD FOR SEED SPROUTS 2nd ASSESSMENT REPORT Executive Summary Purpose](https://img.dokumen.tips/doc/110x75/5afd91de7f8b9a434e8dc5bb/proposal-p1004-primary-production-6-september-2010-19-10-proposal-p1004-primary.jpg)