Embed Size (px)
Citation preview

UpdatesinMS
Supported by educational grants from EMD Serono and Teva CNS
Provided by
FacultyBarbara Giesser, MDAmy Perrin Ross, APN, MSN, CNRN, MSCNBryan Walker, PA-C

TABLE OF CONTENTS 1
CME/CE Information.................................................................................................................................................2
Introduction................................................................................................................................................................5
Diagnosis......................................................................................................................................................................5
Risk Factors for MS Disease and Course............................................................................................................7
Disease Modifying Therapies .............................................................................................................................14
Symptom Management.......................................................................................................................................36
Future Challenges ..................................................................................................................................................38
References.................................................................................................................................................................38
Table of Contents
UpdatesinMS

2 CME/CE INFORMATION
TARGET AUDIENCEThis activity is intended for neurologists, neurologynurses and nurse practitioners, neurology physicianassistants, case workers and any other healthcareproviders involved in the care of patients with MS.
STATEMENT OF NEEDMultiple sclerosis (MS) affects more than 350 000people in the United States and 2.5 millionworldwide. In the United States, prevalenceestimates are approximately 90 per 100 000population and MS-related health care costs areestimated to be more than $10 billion annually inthe United States. Advances continue in thediagnosis and management of the disease.
Constant developments in treatment optionsavailable for MS patients are occurring. Interferonbeta (IFN-β), the first therapy in randomized trialsto reduce the number of relapses that people withMS experience, has revolutionized themanagement of MS, and introduced the concept ofdisease-modifying treatment (DMT). The year 2010marked the beginning of the era of oralmedications for the treatment of MS, with theapproval of dalfampridine to improve walking andfingolimod as the first oral disease- modifyingagent. Therapeutics in late-stage development forMS include non-selective immunosupressants,targeted immune- modulators, and monoclonalantibodies. Oral agents including cladribine andlaquinimod, as well as monoclonal antibodiesalemtuzumab, daclizumab, ofatumumab,ocrelizumab and rituximab are also being studied.
The emergence of oral disease-modifyingtherapies, such as the recently approved oralagents teriflunomide and dimethyl fumarate, willhave a significant impact on the evolving scenarioof immunomodulatory treatments in MS wherecurrent therapies are all injectable (with theexception of fingolimod).
EDUCATIONAL ACTIVITY LEARNING OBJECTIVESUpon completion of this course, the participantsshould be able to:
• Review latest research and clinical information available on the accurate diagnosis of MS
• Review latest research and clinical information available on the appropriate treatment of MS
ACCREDITATION STATEMENTThe France Foundation is accredited by theAccreditation Council for Continuing MedicalEducation (ACCME) to provide continuing medicaleducation for physicians.
CREDIT DESIGNATIONPhysicians: The France Foundation designates thisenduring material for a maximum of 1.0 AMA PRACategory 1 Credit™. Physicians should claim only thecredit commensurate with the extent of theirparticipation in the activity.
Physician Assistants: This program has beenreviewed and is approved for a maximum of
1.00 hours of AAPA Category 1 CME credit by thePhysician Assistant Review Panel. Approval is validfor one year from the issue date of 09/01/2014.
CME/CE Information

CME/CE INFORMATION 3
Participants may submit the self-assessment at anytime during that period.
This program was planned in accordance withAAPA’s CME Standards for Enduring MaterialPrograms and for Commercial Support of EnduringMaterial Programs.
Nurses: This continuing nursing education activitywas approved by the North Carolina NursesAssociation, an accredited approver by theAmerican Nurses Credentialing Center’sCommission on Accreditation. This activity hasbeen awarded 1 contact hour.
METHOD OF PARTICIPATION / HOW TO RECEIVECREDIT1. There are no fees for participating in and
receiving credit for this activity.
2. Review the activity objectives and CME/CE information.
3. Complete the CME/CE activity.
4. Go to www.cmeaims.org/Updates-in-MS and complete the posttest. A score of at least 75% is required to successfully complete this activity. The participant may take the test until successfully passed.
5. Complete the CME/CE evaluation/attestation form at www.cmeaims.org/Updates-in-MS, which provides each participant with the opportunity to comment on how participating in the activity will affect their professional practice; the quality of the instructional process;the perception of enhanced professional effectiveness; the perception of commercial bias; and his/her views on future educational needs.
6. Your CME/CE certificate will be available for download.
RELEASE DATE: July 31, 2014
ExPIRATION DATE: July 30, 2015
ESTIMATED TIME TO COMPLETE ACTIVITY:60 minutes
FACULTY Barbara Giesser, MDVice Chair, Education and Clinical Affairs, NeurologyProfessor, NeurologyUCLA HealthLos Angeles, California
Amy Perrin Ross, APN, MSN, CNRN, MSCNNeuroscience Program CoordinatorLoyola University Medical CenterMaywood, Illinois
Bryan Walker, PA-CAssistant Professor of Physician Assistant StudiesGeorge Washington School of Medicine & HealthSciencesWashington, District of Columbia
DISCLOSURES It is the policy of The France Foundation to ensurebalance, independence, objectivity, and scientificrigor in all its sponsored educational activities. Allfaculty, activity planners, content reviewers, andstaff involved in the development of this activityhave disclosed any significant financial interest orother relationship with manufacturer(s) of anycommercial product(s)/device(s) and/or provider(s)of commercial services included in this educationalactivity. The intent of this disclosure is not toprevent a person with a relevant financial or other
UpdatesinMS
4 CME/CE INFORMATION
relationship from participating in the activity, butrather to provide participants with information onwhich they can base their own judgments. TheFrance Foundation has identified and resolved anyand all conflicts of interest prior to the release ofthis activity.
Activity Staff Disclosures The planners, reviewers, editors, staff, CMEcommittee, or other members at The FranceFoundation who control content have no relevantfinancial relationships to disclose.
Faculty DisclosureThe following faculty have indicated they haverelationships with industry to disclose relative tothe content of this CME activity:• Barbara Giesser, MD, has disclosed her
spouse is a stock shareholder of Biogen Idec and Pfizer.
• Amy Perrin Ross, APN, MSN, CNRN, MSCN, has served as a consultant for Acorda, Bayer Healthcare, EMD Sorono, Genzyme, Novartis, Questcor, and Teva. She has received honoraria from Acorda, Bayer Healthcare, Biogen Idec, EMD Serono, Genzyme, Novartis, Pfizer, Questcor, and Teva.
• Bryan Walker, PA-C, is a stock shareholder of Biogen Idec.
UNAPPROVED USE DISCLOSUREThe France Foundation requires CME faculty todisclose to the attendees when products orprocedures being discussed are off-label,unlabeled, experimental, and/or investigational(not FDA approved); and any limitations on theinformation that is presented, such as data that arepreliminary or that represent ongoing research,interim analyses, and/or unsupported opinion.
Faculty in this activity may discuss informationabout pharmaceutical agents that is outside of USFood and Drug Administration approved labeling.This information is intended solely for continuingmedical education and is not intended to promoteoff-label use of these medications. If you havequestions, contact the medical affairs departmentof the manufacturer for the most recent prescribinginformation.
COMMERCIAL SUPPORT ACKNOWLEDGMENTThis activity is supported by an educational grantfrom EMD Serono and Teva CNS.
DISCLAIMER The France Foundation presents this informationfor educational purposes only. The content isprovided solely by faculty who have been selectedbecause of recognized expertise in their field.Participants have the professional responsibility toensure that products are prescribed and usedappropriately on the basis of their own clinicaljudgment and accepted standards of care. TheFrance Foundation assumes no liability for theinformation herein.
SPONSORThis activity is sponsored by The FranceFoundation.
CONTACT INFORMATIONIf you have questions about this educationalactivity, please contact The France Foundation at860-434-1650 or [email protected].
To claim credit for this CME/CE activity, please go towww.cmeaims.org/Updates-in-MS and completethe posttest and evaluation.

UPDATES IN MS 5
The American Academy of Neurology (AAN) 66th annual meeting was held April 26–May 3, 2014 inPhiladelphia, Pennsylvania. Clinical topics at the AAN meeting included a wide variety of subjects; thismonograph provides a summary of selected presentations focusing on multiple sclerosis. Care was taken tohighlight new findings with practical clinical relevance. This summary is not sanctioned by, nor part of theAmerican Academy of Neurology. Readers are reminded that new material presented at AAN should beconsidered preliminary until publication in peer-reviewed journals.
Introduction
NEWLY DIAGNOSED PATIENTSBrain volume loss (BVL) is a natural process of agingthat is accelerated in patients with multiplesclerosis (MS).1 BVL begins early in the disease andis one of the best magnetic resonance imaging(MRI) predictors of subsequent disability. At theneurology conference in May, Bourre et al reportedon BVL in early MS.2 These authors presented anexploratory study with 78 patients at 3 Frenchcenters. Patients were examined at diagnosis and at2 years for clinical parameters associated withMRI-detected brain atrophy. At baseline theGo-No-Go portion of the Brief Repeatable Battery(BRB), the Temporal Right Eye test by OpticalCoherence Tomography, and the 9-Hole Peg Test(9-HPT) of the MS Functional Composite Score wereeach significantly associated with brain volume,grey volume, and white volume. The only identifiedbaseline parameter that was significantlyassociated with brain volume change assessed at
2 years was the Timed 25-Foot Walk test (T25-FW, P = 0.025). The study design includes a 5-yearassessment.
A presentation by Azevedo and colleaguescompared brain volumes of 21 subjects withradiologically isolated syndrome (RIS) with 42healthy controls.3 There were no differences in totalparenchymal volume, total white matter, total greymatter, or cortical grey matter. The RIS individualshad slightly less subcortical grey matter thancontrols (0.126 vs 0.131, P = 0.04). Normalizedthalamic volumes were reduced in RIS subjectscompared with controls (0.0045 vs 0.0049, P = 0.004). The authors speculate thatdemyelination and reduced neuronal densitycontribute to thalamic atrophy. The contribution ofthalamic volume loss to conversion to clinicallyisolated syndrome (CIS) or clinical MS is not known.
Diagnosis
UpdatesinMS

6 UPDATES IN MS
NEUROMYELITIS OPTICA (NMO) As NMO may be part of the differential diagnosis ofMS, it is useful to review the distinguishing featuresof these inflammatory demyelinating diseases(Table 1).
Unlike MS, a highly specific serum biomarker existsfor NMO, namely aquaporin-4 antibody (AQP4-IgG).In May, Pittock et al reviewed the performance of 6NMO-IgG assays.4 While the specificities wereextremely high (98%–100%), the sensitivitiesvaried. Cell-based assays (visual observation-basedand flow cytometry-based) were the most sensitive(73%–77%), followed by ELISA-R (60%),
fluorescence immunoprecipitation assays (53%),and indirect immunofluorescence assay (48%).6
Accurate diagnosis should translate to initiation ofappropriate therapies for patients with NMO, asstandard MS therapies are ineffective and mayeven exacerbate NMO. Rituximab, azathioprine, ormycophenolate mofetil are commonly used forrelapse prevention in patients with NMO, andemerging strategies include complement inhibitionwith the anti-C5 monoclonal antibody eculizumab,interleukin-6 receptor blockade via tocilizumab,maintenance plasma exchange, and inhibition ofAQP4 antibody binding.7
Table 1: Comparing MS and NMO (adapted4,5)
Feature
Median age of onset (years)
Sex (F:M)
Course
Attack severity
Secondary progressive course
Autoimmune diseases
CSF cells
CSF oligoclonal bands
MRI: spinal cord
MRI: brain
Multiple Sclerosis
29
2:1
85% relapsing-remitting15% primary-progressive
Not monophasic
Usually mild
Common
Uncommon
Mild pleocytosisMononuclear cells
85%
Short-segment peripheral lesions
Periventricular white matter lesions
Neuromyelitis Optica
39
9:1
80%-90% relapsing course10%-20% monophasic course
Usually severe
Uncommon
15%-30%
Occasional prominentpleocytosis
PMNs and mononuclear cells
15%-30%
Longitudinally extensive (≥ 3 vertebral segments)
Usually normal or nonspecificwhite-matter lesions;10% unique lesions

UPDATES IN MS 7
The prevalence of MS is rising, and the ratio ofrelapsing-remitting MS (RRMS) in womencompared to men has increased from 2:1 to 3:1.Klein and Burton found 32 articles in the PUBMEDdatabase appearing between 2005 and 2013 onpossible factors contributing to the increasingdisparity in MS prevalence.8 Obesity, smoking,reduced serum levels of vitamin D metabolites, andchanges in the reproductive behavior of women inthe West are candidates for environmental factorsthat may be modifying MS risk. Severalobservational studies support approximately a 50%increase in the risk of MS associated withsmoking.9,10 Palacios et al found a very strongcorrelation between the increase in MS sex ratios
and the increase in smoking sex ratios in severalnational registries.10 The increased ratio of femaleto male smokers, however, is due to decreasedsmoking among males, suggesting that smoking isnot the only environmental factor contributing tothe increase in MS. Both sun avoidance and obesitycan result in low levels of vitamin D, a known riskfactor for MS. Increases in both of these factors maycontribute to increased risk of MS in women.Finally, the authors identify changes inreproductive behavior such as delaying pregnancy,in vitro fertilization, and number of offspring aspossible risk factors for MS or MS relapse. Thecontribution of these various factors to risk for MSis summarized in the schematic in Figure 1.
Risk Factors for MS Disease and Course
UpdatesinMS
Figure 1: Schematic of the Interaction of Various Factors and MS (adapted)8
RISK OF MSGenetic riskfactors
Obesity–increasing more
in women
Change in reproductive and social behavior of women–
delaying pregnancy
Smoking–increasing in women
compared to men
Increased sun protection
Decreased levelsof vitamin D
This figure is not exhaustive but represents theinteractions within this exploratory review

8 UPDATES IN MS
DIETARY FACTORSRecent studies have shown that excess salt (NaCl)uptake can impact the immune system.Kleinewietfeld et al reported in Nature thatexposure of naïve human T cells to high-saltconditions (similar to levels found in theinterstitium of animals fed a high-salt diet) resultsin induction of an enhanced Th17 phenotype,expression of proinflammatory cytokines, andactivation of the p38/MAP kinase pathway.11 Theseinvestigators have also shown that mice fed ahigh-salt diet develop accelerated onset andincreased severity of experimental autoimmuneencephalomyelitis (EAE) compared with controls ona normal diet.11 Farez et al reported results of anobservational study of sodium intake and MSdisease activity in a cohort of patients with RRMS.12
Sodium intake was calculated from urine samplescollected over the 2-year study; clinical andradiological assessments were conducted every 3to 6 months, or in the case of a relapse. Regressionanalysis was used to estimate the effect of sodiumintake on MS disease activity. The mean age of the
70 patients was 37.5 years, median diseaseduration was 5 years (range 1-16 years), the medianExpanded Disability Status Scale (EDSS) was 1(range 0-3.5), and 77% of patients were female.Regression analysis showed that increased sodiumintake was associated with increased relapse rateand increased radiological activity (Table 2).
In a similar evaluation of a second cohort of 52RRMS patients, these authors reported thatincreased sodium intake was associated withincreased T2 lesion load. Interestingly, Doty et alpresented a poster on gustatory dysfunction inpatients with MS.13 This study in 73 patients withMS and 73 matched controls tested the ability ofsubjects to correctly identify a given stimulus(tasting sweet, sour, bitter, or salty) and to rate theintensity of such stimuli. Overall, approximatelyone-fifth of patients with MS exhibited lower testidentification scores compared with controls, withthe largest deficits noted for sodium chloride. Whilesodium intake is clearly a modifiable factor, it isnoteworthy to consider that patients with MS mayhave an altered sense of taste, particularly for salt.
Table 2: Sodium Intake and Disease Activity in 70 Patients with RRMS12
Relapse Rate
Sodium Intake < 2 grams/day
2–4.8 grams/day
> 4.8 grams/day
MRI Activity
Sodium Intake < 2 grams/day
2–4.8 grams/day
> 4.8 grams/day
Incidence Rate Ratio
1
2.75
3.95
1
2.86
3.42
95% Confidence Interval
---
1.3–5.8
1.4–11.2
---
1.52–5.4
1.37–8.55
P-value
---
0.008
0.01
---
0.001
0.008

UPDATES IN MS 9
Linker et al studied the effect of another dietaryfactor, saturated fatty acids, in the murine EAEmodel.14 These investigators showed that mice feda high-fat diet had severe clinical symptoms of EAEcompared with milder symptoms in animals fed anormal diet. At 14 days following EAE induction,animals on a high-fat diet had increasedfrequencies of splenic effector T cells and increasedTh17 cells in the spinal cord compared with normaldiet controls. In addition, in vitro experimentsshowed that exposure of naïve murine T cells tolauric acid promoted p38/MAPK-dependent Th17development. Yadav et al conducted a study toexamine the potential benefits of a low-fat,plant-based diet in patients with RRMS. In this1-year prospective randomized controlled trial, 61MS patients were assigned to either a low-fat dietor a wait-listed control group.15 The plant-baseddiet is very low in saturated fat, with an estimatedcaloric breakdown of 10% fat, 14% protein, and76% carbohydrate. Study outcomes includedchanges over 1 year in new brain T2 lesion countand other MRI disease activity parameters, safety,relapse rate, EDSS, Timed 25-Foot Walk (T25-FW),Fatigue Severity Score (FSS), blood lipids, bodyweight, and diet compliance. Of the 61 patientsrandomized, 27 patients in the control group and26 patients in the diet group completed the study.Four of the 26 patients in the diet group werenon-compliant. After adjusting for baselineparameters, there were no significant differencesbetween groups in MRI endpoints, relapse rate,EDSS, or T25-FW. FSS changed significantly in thediet group relative to baseline measures. Averageweight, low density lipoprotein, and totalcholesterol improved in the diet compliant grouprelative to the control group (-16.3 vs + 1.6 lbs,-12.4 vs -5.6 mg/dL, and -16.2 vs -4.7 mg/dL,respectively). The authors indicated that the smallsample size, and one year of follow-up may have
contributed to reduced power to detect changeson MRI and clinical outcomes.
GUT MICROBIOMEThe gut wall is populated by immune cells that arecapable of antigen processing and presentation,raising the possibility that it is an active player inimmune recognition. Exposure to gut microbiotacan trigger EAE in genetically susceptibletransgenic mice.16 There are findings connectinggut flora to new onset rheumatoid arthritis (RA),17
inflammatory bowel disease (IBD),18 and type 1diabetes.19 Jhangi et al investigated gutmicrobiome differences between patients with MSand healthy controls.20 They analyzed the diversityof bacteria in stool samples of 168 patients withRRMS and 44 healthy controls by sequencinghypervariable regions of bacterial 16s ribosomalRNA. Some RRMS patients were untreated (n = 44),others were treated with Interferon (IFN) (n = 49),glatiramer acetate (GA) (n = 46), or other drugs, butpatients with recent antibiotic or probiotic use andthose with a history of autoimmune disease, bowelsurgery, or other drug use (prednisone, rituximab,methotrexate, etc) were excluded. They foundsimilar levels of overall diversity in both groups. Themethanobrevibacter M smithii was present in abouthalf of the MS patients (regardless of treatment) atlevel 10–50 times higher than in healthy controls.Methanobrevibacter is also associated with obesityand IBD. The level of stimulation of peripheralblood mononuclear cells (PBMCs) and theprevalence of high titer antibodies to this organismwere not different in the subject groups. Butyratecan promote colonic Treg expansion.21 Butyrate-producing bacteria were less prevalent in MSpatients (37%) than in healthy controls (57%) andin untreated MS patients compared to treatedpatients.
UpdatesinMS
10 UPDATES IN MS
WHIPWORM EGGSThe “hygiene hypothesis” proposes that theincreased frequency of autoimmune diseases likeMS in industrialized countries is due to a reductionin exposures to infectious bacteria, viruses, andparasites resulting from a high level of sanitation inthe modern environment. Fleming and colleaguesreported a small study of the safety andeffectiveness of the helminth Trichuris suis ova(TSO) (porcine whipworm) in subjects with earlyRRMS.22 This approach has been tried for IBD23 andallergic rhinitis.24 The study reported at AAN was asmall trial with 15 treatment-naïve, recentlydiagnosed RRMS subjects. Each participantunderwent 5 months of pre-treatment observationand 10 months of treatment with TSO (2500 liveova orally every 2 weeks). The primary outcomemeasures were as follows: (1) safety and tolerabilityand (2) changes in the number of gadoliniumenhancing lesions (Gd+) detected by monthly brainMRI scans. No significant safety or tolerability issueswere observed. With 90% of time points analyzedto date, the mean number of Gd+ lesions permonth was 3.2 during 5 months of observation and2.1 during the last 5 months of treatment, a 34%relative reduction. TSO was associated withincreases in T regulatory cells and a modified Th2immune response. Transcriptional analyses ofperipheral blood mononuclear cells suggested thattreatment led to diminished expression of thepellino E3 ubiquitin protein ligase 1 (pelli 1) gene,recently demonstrated to be a central activator ofmicroglia in EAE and possibly in MS itself.
VACCINES AND RISK OF MSThere have been anecdotal reports of a temporalassociation between receipt of vaccines and theonset of CNS demyelinating diseases including MS;
however, such a link is not supported by robuststudies.25 Langer-Gould et al presented results of acase-control study from the membership of KaiserPermanente Southern California that wasperformed to determine whether there is increasedrisk for MS with vaccine exposure (hepatitis Bvaccine [HBV] and human papillomavirus vaccine[HPV] in particular).26 Cases were newly diagnosedwith MS and other CNS acquired demyelinatingsyndromes (CNS ADS) between January 2008 andDecember 2011; up to 5 controls were matched ondate of birth, sex, and ZIP code. Vaccination recordswithin 3 years of the index date were obtained, andany vaccination was considered exposure. Therewere 780 cases of CNS ADS and 3885 matchedcontrols identified, including 92 cases and 459controls who were women 9–26 years (targetpopulation for HPV). Analysis of the data indicatedno association between HBV (OR 1.12, 95% CI0.72-1.73), HPV (OR 1.05, 95% CI 0.62-1.78), or anyvaccination (OR 1.03, 95% CI 0.86-1.22) and risk forCNS demyelinating diseases up to 3 years later.According to the authors, an apparent short-termrisk for CNS ADS onset within the first 30 days afterany vaccination in younger persons (< 50 years)may reflect transition from subclinical disease tosymptom onset accelerated by receipt of a vaccine.No long-term association of vaccines with MS orother CNS ADS was found.
SMOKINGCigarette smoking is a known susceptibility factorfor MS.27 Kavak et al presented results of a studyconducted to determine if there was an associationbetween smoking and indicators of psychosocialwellbeing in patients with MS.28 Subjects wereobtained from the New York State MultipleSclerosis Consortium database. At enrollment,

UPDATES IN MS 11
patients were asked about smoking status andwere then categorized as smokers or non-smokers.Patients were asked to rank their level of loneliness,pessimism, tension, panic, irritation, morbidthoughts, and feelings of guilt on a 1 to 5 scale(“none” to “extremely”). A cumulative mood statemeasure was determined from the sum of the 7Rasch scored items, ranging from 14 to 700 (lowestto highest mood state, respectively). Thecumulative measure was normalized bylog-transformation. Of 2249 subjects enrolled, 761(33.8%) were current smokers. Using a cutoff of 3 to5 as most affected by each of the mood states;smokers were significantly more likely to reportloneliness, pessimism, panic, irritation, and morbidthoughts than non-smokers with MS. The groupsdid not differ in levels of tension or feelings of guilt.Cumulative mood state was significantly lower forsmokers (548.0 vs 574.7 for non-smokers; P < 0.001). The authors indicated that it is notpossible to ascribe directionality to this association,as psychosocial factors may be associated withincreased tendency for smoking. Constantinescu etal conducted a study to investigate whethersmoking cessation in patients with MS can affectthe risk for disability progression.29 Smoking andclinical data from 681 patients with MS wereobtained, and Cox proportional hazard regressionmodels were used to estimate the effects ofsmoking cessation on time to reaching EDSS scoresof 4.0 and 6.0. In this cohort of MS patients, 39% ofmales and 31% of females were smokers at diseaseonset (21 and 17% were ex-smokers, respectively).Patients smoked for an average of 22.8 years, andsmoking intensity was 18.7 cigarettes per day.Current smoking status by gender was 14.7% ofmales and 16.5% of females, representing a 62%and 46% reduction in smokers, respectively. Eachyear that elapsed from smoking cessation was
associated with a 3% decreased risk of reachingEDSS 4.0 (HR: 0.97, 95% CI: 0.95-0.98, P < 0.001),and a 5% decreased risk of reaching EDSS 6.0 (HR:0.95, 95% CI: 0.93-0.97, P < 0.001). Collectively,these studies may help to inform discussions withMS patients about the importance of smokingcessation.
OBESITYObesity is associated with a chronic inflammatorystate and abnormal cytokine release. Correale et alpresented a study of 210 patients with RRMS and210 healthy controls.30 Patients reported theirheight and weight or used a visual scale toestimate their BMI. There is an inverse correlationbetween vitamin D and BMI (r = -0.87, P < 0.001)and a positive correlation between serum leptinand BMI (r = 0.77, P < 0.001).
The authors showed that obesity at 20 years of agewas associated with a higher risk of MS (OR = 2.1)after adjustment for smoking and vitamin D levels.Obesity at 20 years of age was also associated withvitamin D deficiency and increased serum leptin. Invitro exposure of myelin basic protein(MBP)-peptide specific CD4+ T cells to leptininhibits steroid-induced apoptosis. Cytokines IL-1α,IL-2, IL-6, IL-15, IL-17, IFN-γ, and TNF-α wereincreased with elevated BMI, but leptin exertsopposite effects on Treg (anergy andhyporesponsiveness) and CD4+ effector T cells(induction of proliferation, secretion ofpro-inflammatory cytokines, and inhibition ofapoptosis). The authors speculated that leptin maybe a link between obesity and autoimmunity.
MENOPAUSECLIMB (Comprehensive Longitudinal Investigationof Multiple sclerosis at the Brigham and Women's
UpdatesinMS

12 UPDATES IN MS
Hospital, Partners MS Center) is a 20-yearlongitudinal study of patients with MS. One ofthe primary goals is to refine prognosis based onearly disease. Patients with MS were enrolledwithin 3 years of diagnosis and characterizedwith neurological examinations, MRI imaging,immunologic, genetic, neuropsychological, andquality of life studies.31 Bove and colleagues senta survey on MS during menopause to 1202women with CIS or MS and received 391responses.32 The responses show thatprogression of MS (measured with the standardEDSS scale) changed at or around menopausetoward a more rapid accumulation of disability.The team is following up on this finding; ifhormonal shifts are responsible, it may presentan opportunity to find a solution for women withMS going through menopause.
COMORBIDITIES: METABOLICSYNDROMEBerriosmorales et al presented results of aretrospective study that investigated theassociation between metabolic syndrome anddisease severity in patients with MS.33
Consecutive MS patients were identified from theUMass MS center database. Metabolic syndromewas defined by the presence of obesity (BMI ≥ 25kg/m2), and 2 of the following: fasting bloodglucose > 100 mg/dL; blood pressure > 130/85;serum triglyceride ≥ 150 mg/dL; or HDLcholesterol < 40 mg/dL in men, < 50 mg/dL inwomen. New T2 and/or gadolinium-enhancinglesions were used as indices of MRI activity; EDSS,T25-FW, and modified 9-Hole Peg Test (m9-HPT)were used as disability measures. The studypopulation was comprised of 399 patients withMS (75% relapsing and 25% progressive); the
mean age was 48.1 years, 74% were female, andthe median EDSS was 2.5. Ten percent of thepatients (38) had metabolic syndrome. MeanT25-FW and m9-HPT were significantly differentin patients with metabolic syndrome comparedwith those without: 8.5 vs 6.5 seconds, P = 0.037;and 20.9 vs 14.9 seconds, P = 0.027, respectively).There were no differences between groups inEDSS or in brain MRI activity. In multivariatelogistic regression analysis, the presence ofmetabolic syndrome was a significantindependent predictor of T25-FW (P = 0.025), andm9-HPT (P = 0.005).
COMORBIDITIES: HEADACHEWilcox et al presented results of a prospectivesurvey-based study of headache in patients withMS.34 The single center study included patientswith MS and a self-identified history ofheadaches. Over a 6-month period, patients wereinvited to complete a survey that includedquestions about headache history, frequencyand pain description, triggers, and impact ondaily functioning. Of the 72 patients whocompleted the survey, 65% had headaches priorto MS onset. Over half of the patientsexperienced headaches ≥ 4 days per month.Eighty-five percent of patients rated their pain assevere at least some of the time and 63% ofpatients indicated that headaches worsenedduring MS exacerbations. In patients withoutheadache history prior to onset of MS, 64% hadmigraine headaches with aura with diseaseprogression. Stress and fatigue were the mostcommon headache triggers identified by 78.1%and 64.1% of patients, respectively. Patientsindicated that headaches very often or alwayslimited daily activities (35.5%), necessitated rest

UPDATES IN MS 13
(59.7%), affected mood (42.0%), and impairedconcentration (40.3%). While the prevalence ofheadache in patients with MS may be variable,these results indicate that including headacheinquiry during routine examinations of patientswith MS may be warranted in order to minimizethe negative impact on quality of life.
COMORBIDITIES: THYROID DISEASEBarone et al presented a poster reporting theprevalence of thyroid disease in a cohort ofpatients from their MS clinic.35 This retrospectivereview of 380 patients with MS from 2010–2011identified 46 (12.1%) with thyroid disease (45were hypothyroid and 1 had thyroiditis alone). Ofthe hypothyroid patients, 2 patients had thyroidsurgery, 1 patient had benign thyroid nodules,and 4 patients had thyroiditis. Eighty-ninepercent of the patients with thyroid disease werefemale, compared with 77% females in theoverall MS cohort. All but 1 of the patients withthyroid disease had been treated with disease-modifying therapies; 37% with IFNβ, 20% withGA, 17% with GA and IFNβ, and 24% withmultiple medications. Awareness of theprevalence of thyroid disease in patients with MSis important, particularly with the potential forautoimmune side effects associated withtherapeutic agents.
COMORBIDITIES: DEPRESSIONDepression is a frequent comorbidity in womenwith MS. Winder et al explored associationsbetween MRI changes and clinical parameters ofdepression.36 They assessed scores of the 20-itemBeck Depression Inventory-V (BDI-V)37 andphysical disability using EDSS in 50 women with
MS (37.0±9.9 years). They performed SpearmanRank correlations of BDI-V scores with patientage, disease duration, EDSS, and MS-lesion-loadin frontal, parietal, temporal, occipital, opercular,cingulate, thalamic, midbrain, cerebellar, pontine,medulla oblongata, and spinal cord areas (P < 0.05).
BDI-V scores did not correlate with patient age,disease duration and EDSS scores. BDI-V scorescorrelated indirectly with MS-lesion volume inthe right temporal middle/inferior/fusiform gyralarea (Spearman Rho, -0.32; P = 0.032), BDI-Vscores correlated directly with the MS lesion loadin the right opercular region (Spearman Rho,0.29; P = 0.043) and total area of enhancingMS-lesions in the supratentorial brain (SpearmanRho, 0.31; P = 0.029). The authors conclude fromthese reduced depression scores in women withright temporal lobe lesions suggest that the righttemporal lobe contributes to disinhibitingdepressive mood changes. The increasing BDI-Vscores with lesions in the right operculum andcumulative active supratentorial MS lesion loadsuggest that these areas contribute to inhibitingdepressive mood changes. These findings areconsistent with Mohr et al, who found that BDIresults at 6-month follow-up, residualized for end-of-treatment BDI, were predicted by totallesion volume (R2 = 0.22, P = 0.005), lesionvolume in many discrete areas, andneuropsychological functioning (R2 = 0.29, P = 0.0009).38 They also found weak butsignificant relationships between BDI and righttemporal periventricular lesion volume (R2 = 0.32,P = 0.002) and left temporal grey-white junctionlesion volume (R2 = 0.19, P = 0.02).
UpdatesinMS

14 UPDATES IN MS
MRI LESIONS PREDICT RELAPSESMarkers for predicting MS relapses would beuseful for clinical management. In 2009 Sormaniet al conducted a meta-analysis of the relationbetween new or enlarging T2 MRI lesions andclinical relapses.39 They discovered a strongcorrelation between a treatment’s average effecton MRI lesions and its effect on relapse rates(coefficient of determination, R2 = 0.81). Theauthors encouraged using MRI as a phase 2endpoint for clinical trials of drugs related toexisting therapies but warned against using MRIlesions as a primary endpoint in pivotal trials,especially of drugs of novel mechanism.
Using a large dataset of subjects with relapsingMS who received placebo in the AFFIRM(Natalizumab Safety and Efficacy in RelapsingRemitting Multiple Sclerosis), DEFINE(Determination of the Efficacy and Safety of OralFumarate in Relapsing Remitting MultipleSclerosis), and CONFIRM (Comparator and an OralFumarate in Relapsing Remitting MultipleSclerosis) clinical trials, Richert and colleaguesevaluated the relationship of brain lesions withlater disease course.40 They found that subjectswho had one or more new or enlarging T2 MRIlesions during the first year were twice as likely toexperience a relapse during the second yearcompared to those who did not have theselesions. The odds ratio (OR) for a relapse in year 2for placebo-treated patients generally increasedwith lesion activity in year 1.
The authors also examined the active treatmentarms of phase 3 clinical trials of IM IFNβ-1a,
natalizumab, dimethyl fumarate (DMF), andglatiramer acetate. A significant associationbetween T2 lesion activity in year 1 and relapse inyear 2 was observed for patients treated with IMIFNβ-1a in the SENTINEL (Safety and Efficacy ofNatalizumab in Combination with Interferonbeta-1a in Patients with Relapsing RemittingMultiple Sclerosis) study. The ORs ranged from1.4 to 2.7 for different levels of lesion activity andall were statistically significant. Interestingly, theORs observed for patients in AFFIRM, DEFINE, andCONFIRIM receiving natalizumab, DMF, orglatiramer acetate were not statisticallysignificant. This study shows the relation of T2activity with subsequent relapses in the naturalhistory of MS but also shows that thisrelationship may be useful for patients receivingsome DMTs but not others.
INJECTABLE DISEASE MODIFYINGTHERAPIESInterferonTraboulsee et al presented a poster on anexploratory post hoc analysis of data from thePRISMS (Prevention of Relapses and Disability byInterferon beta-1a Subcutaneously in MultipleSclerosis) study.41 All patients in the PRISMS studyhad MRI twice yearly, and a subgroup of patientshad monthly MRI scans in the first 9 treatmentmonths.42 The current analysis was conducted tospecifically look at the effect of IFNβ-1a on theevolution of chronic black holes in patients withRRMS. Patients included in the analysis werethose who had monthly MRI scans from studymonths -1 to 9 and had ≥ 1 newly enhancing T1gadolinium (Gd+) lesions from study months -1
Disease Modifying Therapies

UPDATES IN MS 15
UpdatesinMS
to 3. MRI scans were reanalyzed to assess for theevolution of chronic black holes. A chronic blackhole was defined as a T1 Gd+ lesion that evolvedinto a T1 hypointense lesion that was visible for ≥ 6months. [For patients without a month 9 scan, datawere analyzed from MRI scans at months -1 to 2
and month 8] The analysis endpoints were thepercentage of newly enhancing T1 Gd+ lesions onscans from Months -1 to 2/3 that evolved intochronic black holes at Month 8/9; and the presenceof ≥ 1 evolved chronic black holes and total volumeof evolved chronic black holes at Month 8/9. One
hundred twenty-two patientswith newly enhancing Gd+lesions were included, 73 ofwhom were treated withIFNβ-1a (44 or 22 μg SC threetimes per week) and 49 ofwhom were from the placebogroup. For patients treatedwith IFNβ-1a, 12.6% of T1 Gd+lesions from Months -1 to 2/3evolved into chronic blackholes at Month 8/9 comparedwith 19.8% for patients in theplacebo group (36%reduction, P = 0.033). In thesubgroup of patients withbaseline EDSS scores ≤ 3.5,IFNβ-1a was associated with a51% reduction in thepercentage of Gd+ lesionsevolving into chronic blackholes (10.4% vs 21.2% forplacebo, P = 0.010). Thepercentage of patients with ≥ 1 evolved chronic blackholes at Months 8/9 andchronic black hole volumesper patient are shown inFigure 2.
In the subgroup of patientswith baseline EDSS scores ≤ 3.5, the evolved chronic
34.2
55.1
0
10
20
30
40
50
60
IFNß-1a (n = 73)Placebo (n = 49)
Patients with ≥ 1 Evolved Chronic Black Holes A
B
OR = 0.4295% CI 0.20, 0.89
P = 0.024
66
118.3
0
20
40
60
80
100
120
140
IFNß-1a (n = 72)Placebo (n = 48)
Perc
ent o
f Pat
ient
s C
hron
ic B
lack
Hol
e Vo
lum
e (m
m3)
Evolved Chronic Black Hole Volume
P = 0.073
Figure 2: IFNβ-1a and Evolved Chronic Black Holes41

16 UPDATES IN MS
black hole volume was 129.0 mm3 in the placebogroup and 46.9 mm3 in the IFNβ-1a group (P = 0.035). Overall, these results suggest thattreatment with IFNβ-1a is associated with areduction in chronic black holes evolving from newGd+ lesions, with the effect most apparent inpatients with lower disability scores at baseline.
Pegylated IFNβ-1a (PEG IFN) is in clinicaldevelopment as a lower frequency dosingformulation for patients with RRMS. The safety andefficacy of PEG IFN (125 μg) administeredsubcutaneously once every 2 weeks (Q2W) or every4 weeks (Q4W) was evaluated in the 2-year, phase3, ADVANCE trial. Recently published results fromthe first 48 weeks showed that treatment with PEGIFN significantly reduced the ARR by 36% and 28%compared to placebo, for the Q2W and Q4Wgroups, respectively.43 Both treatment schedulessignificantly reduced the risk of disability
progression by 38% compared to placebo.Calabresi et al presented 2-year safety and efficacydata from ADVANCE.44 Of 1516 patientsrandomized at the start of the study, 1332completed year 1 (the placebo-controlled phase ofthe study). After the first year, patients in theplacebo arm were re-randomized to either PEG IFNQ2W or Q4W groups. Patients originally in the PEGIFN treatment groups continued through studycompletion on the same treatment and schedule.The ARR over 2 years favored the PEG IFNtreatment groups; 0.29 and 0.22 for the PEG IFNQ4W and PEG IFN Q2W groups compared with 0.35for the placebo arm (17% reduction, P = 0.091; and37% reduction, P < 0.0001, respectively).Continuous treatment with PEG IFN was associatedwith a reduced risk for time to disabilityprogression compared with the placebo to PEG IFNpatients (Q2W HR = 0.67, 95% CI 0.49-0.95, P = 0.0257; Q4W HR = 0.75, 95% CI 0.53-1.05,
14.8
0.5
5.6
12.5
0.7
4.95.0
0.2
2.3
0
2
4
6
8
10
12
14
16
New/newly-enlarged T2 Lesions Gd+ Lesions T1 Hypointense Lesions
Mea
n N
umbe
r
Placebo–PEG IFN
PEG IFN Q4W
PEG IFN Q2W
*
*
*P < 0.0001, Q2W vs Q4W
*
Figure 3: ADVANCE: Brain MRI over 2 Years43

UPDATES IN MS 17
UpdatesinMS
P = 0.0960). Over 2 years, the PEG IFN Q2Wtreatment group had the least new or newlyenlarged T2-weighted hyperintense lesions, Gd+lesions, and T1 hypointense lesions (Figure 3).The most common adverse events associated withPEG IFN were injection site erythema (59%–64%),influenza-like illness (50%–51%), pyrexia(41%–43%), and headache (41%–42%). Less than1% of patients treated with PEG IFN developed IFNneutralizing antibodies over the 2-year study.Collectively, the 2-year results provide evidence ofgreater treatment effects with the PEG IFN Q2Wcompared with the Q4W schedule.
Kieseier et al presented a retrospective analysis ofthe first year of the ADVANCE trial, to determinewhether treatment with PEG IFN was associatedwith improved recovery following relapse inpatients with RRMS.45 Baseline demographic andclinical characteristics were well balanced amongthe 3 treatment groups. Baseline EDSS scores were1.18, 1.24, and 1.26 for the placebo, PEG IFN Q4W,and PEG IFN Q2W groups, respectively. In the firstyear of the study, 55 patients had disabilityprogression associated with a relapse and 57patients experienced disability progression notassociated with relapse. A lower proportion ofpatients treated with PEG IFN had confirmeddisability progression associated with a relapsecompared with placebo (30% and 22% reductionfor the Q2W and Q4W groups, respectively). Inaddition, fewer patients treated with PEG IFN had
sustained disability progression due to incompleterecovery after a relapse (12% and 16% for PEG IFNQ2W and Q4W, vs 27% for placebo).
Arnold et al presented a post hoc analysis of thefirst year of the ADVANCE trial, evaluating thecomposite endpoint, freedom from measureddisease activity or FMDA, also referred to as “noevidence of disease activity”.46 FMDA was definedas the absence of clinical activity (no relapses andno sustained accumulation of disability) andabsence of MRI disease activity (no Gd+ lesions andno new or newly-enlarging T2 lesions). Theinvestigators looked at FMDA from baseline toweek 48 and from week 24 to week 48 of the study.Significantly higher proportions of patients in thePEG IFN Q2W treatment group had FMDA frombaseline to week 48 and from week 24 to week 48as compared with PEG IFN Q4W and placebogroups (Table 3).
These results provide additional evidencesupporting the beneficial effects associated withPEG IFN Q2W compared with placebo and PEG IFNQ4W.
GLATIRAMER ACETATEA new preparation of GA with less frequent dosing(40 mg SC 3 times a week vs 20 mg SC daily) wasFDA approved in early 2014.47 In the 12-monthplacebo-controlled GALA trial, treatment with GA40 mg SC TIW was associated with a 34% reduction
Table 3: ADVANCE: Freedom from Measured Disease Activity46
Timeframe
Baseline to Week 48
Week 24 to Week 48
Placebo (n = 484)
15.1%
28.9%
PEG IFN Q4W (n = 469)
21.5%‡
38.6%‡
PEG IFN Q2W (n = 466)
33.9%*†
60.2%*†
Values represent percent of patients; *P < 0.0001 vs placebo; ‡P = 0.01 vs placebo; †P < 0.0001 vs Q4W

18 UPDATES IN MS
in confirmed relapses and improvements in MRIendpoints compared with placebo.48 In May, Khanet al presented 24-month efficacy and safety resultsfrom the open-label extension study.49 Patientstreated with GA 40 mg TIW in the placebo-controlled phase of GALA continued with thistreatment regimen in the extension phase or “earlystart.” Patients in the placebo arm were switched toGA 40 mg TIW at month 12 or “delayed start.”Continued treatment with GA 40 mg wasassociated with a 31% reduction in ARR at 24months compared with patients in theplacebo→GA (delayed start) group (Table 4). Theauthors reported that the safety profile observedfor the 40 mg GA dose was consistent with the 20 mg GA formulation.
Wolinsky et al presented results of GLACIER, anopen-label, randomized, multicenter study toevaluate the safety and tolerability of GA 40 mg
TIW compared with GA 20mg QD in patients withRRMS.50 Eligible patients for GLACIER had beenstable on GA 20 mg QD for at least 6 months priorto screening, then were randomized to eithercontinuing on GA 20 mg QD or switching to GA 40 mg TIW for the core phase (4 months) of thetrial. A total of 209 patients were enrolled andrandomized. All patients were offered the GA 40 mg TIW during the extension phase. Baselinecharacteristics were balanced between groups;patients were approximately 50 years of age, 82%were female, they were ~11.5 years from MSdiagnosis, and had 0.2 relapses in the 1 year beforethe study. The primary endpoint was the rate ofinjection-related adverse events (IRAEs). IRAEsincluded injection site reactions (ISRs) andsymptoms/events related to immediatepost-injection reactions, such as flushing, chestpain, palpitations, anxiety, dyspnea, throatconstrictions, and urticaria. Treatment with GA
Table 5: Injection-Related Adverse Events (IRAE): GA 40 mg TIW vs GA 20 mg QD50
Treatment
GA 20 mg QD (n = 101)
GA 40 mg TIW (n = 108)
Adjusted Mean Annualized IRAE
70.4
35.3
Percent Reduction
---
50% (P = 0.0006)
Table 4: GALA: Glatiramer Acetate (40 mg TIW) ARR at 12 and 24 months49
Treatment ARR Percent Reduction
Placebo (n = 461)
GA 40 mg TIW (n = 943)
Placebo to GA 40 mg TIWDelayed Start (n = 419)
GA 40 mg TIWEarly Start (n = 834)
0.505
0.331
0.257
0.177
---
34% (P < 0.0001)
---
31% (P = 0.0002)
Placebo-controlled Phase at 12 Months
Open-label Phase at 24 Months

UPDATES IN MS 19
UpdatesinMS
40 mg TIW was associated with a significantreduction in IRAEs compared with daily treatmentwith GA 20 mg (Table 5).
When looking only at injection site reactions, therewas also a 50% reduction in the adjustedannualized rate for the GA 40 mg TIW treatmentarm compared with GA 20 mg QD. There were nosignificant differences between treatment arms inpatient reported outcomes. Collectively, the resultsfrom GALA and GLACIER provide additionalinformation about GA that may be useful indiscussions with patients about therapeuticoptions for RRMS.
ESTRIOL PLUS GAInterest in sex hormones as factors in MS relapserates goes back to the observation in 1998 that inwomen with MS, the relapse rate declines duringpregnancy.51 The relapse rate is 3 to 4-fold lower inthe third trimester than in the year prior topregnancy. These changes are opposite to thefluctuations in sex hormones, which may exertprotective effects. Estriol is unique to pregnancy,was protective in multiple EAE models (reviewedby Spence and Voskuhl52), and showed positiveeffects in a pilot trial in women with MS.53 Neuralestrogen receptor knock-out experiments in miceimplicate direct neuroprotection as a mechanismof action.52
Voskuhl and colleagues presented results of acombination trial of estriol plus GA in RRMS.54,55 Thestudy was a double-blind, placebo-controlled studyof 164 women with RRMS. The treatment periodwas 2 years and the primary endpoint was relapserate. Subjects were randomized to treatment withGA plus 8 mg estriol daily or GA plus placebo.Blood levels of estriol reached mid-pregnancy
levels in the active treatment group. The mostcommon adverse event was irregular menstrualspotting. Estriol has a good safety record, whichwas confirmed by the safety monitoring in thisstudy. At 12 months the GA plus estriol group had astatistically significant reduction in relapses vsplacebo; at 2 years the GA plus estriol group had alower relapse rate than the GA plus placebo groupbut the difference was no longer significant.Cognitive improvement was assessed with thePaced Auditory Serial Addition Task at 3 seconds(PASAT3) and PASAT2. At 1 year there weresignificant increases in the cognition scores in thetreatment group but no change in the GA plusplacebo group. At 24 months the GA plus estriolgroup’s improvement over baseline was stillsignificant and there was a trend towardimprovement in the placebo group. In summary,this combination study shows that addition ofestriol to GA was associated with improvement inrelapse rate and cognition at 12 months and somecontinued benefit on cognition seen at 24 months.Combination with other DMTs and possible use inmen remain to be investigated.
ATx-MS-1467ATX-MS-1467 is a mixture of 4 T cell epitopes frommyelin basic protein (MBP). Wraith et al showedthat treatment with ATX-MS-1467 after induction ofEAE in mice resulted in a dose-dependentsuppression of the mean EAE score.56 The authorsalso presented a phase 1 open-label, ascending-dose study in patients with relapsing MS.Treatment with 800 mcg intradermal ATX-MS-1467every 2 weeks from week 8 to week 16 resulted in asignificant reduction in newly enhancing MRIlesions (maximum effect was 78% reduction atweek 16). The effect was lost 12 weeks after therapy cessation. There was also a reduction in

20 UPDATES IN MS
the total volume of Gd+ lesions during thetreatment period.
VITAMIN D WITH IFN OR GAResults of a study designed to determine the effectof vitamin D levels on clinical and MRI outcomes inpatients with RRMS treated with interferon and GAwere presented by Rotstein et al in both oral andposter sessions.57 Patients in this prospective,longitudinal cohort were enrolled in the CLIMBstudy. All patients had EDSS < 5.0, and wereinitiating their first disease-modifying therapy(monotherapy) with either GA or interferon β(IFNβ-1a SC, IFNβ-1a IM, or IFNβ-1b SC). Vitamin D(25-hydroxy—vitamin D) levels were determinedby chemiluminescent assay from blood samplescollected within 18 months of treatment initiation.A standard random effects model was used toadjust vitamin D levels for seasonality. Outcomemeasures included time to first relapse or T1 Gd+lesion; time to first relapse; and time to disabilityprogression. The patient population included 151patients treated with GA and 96 treated with IFN;69% of each group were female; and diseaseduration was a mean of 4.5 and 3.3 years for the GAand IFN groups, respectively. Patients werecategorized using seasonally adjusted vitamin Dlevel tertiles: > 28.7 ng/mL; > 20.6 ng/mL and ≤ 28.7 ng/mL; and ≤ 20.6 ng/mL. The time to thefirst inflammatory event (relapse or T1 Gd+ lesion)was longest for patients in the highest vitamin Dtertile.
Using the Cox model, the hazard ratios for thecomposite endpoint of clinical and MRI eventsadjusted for age, gender, and disease durationwere 0.75 overall (P = 0.028); 0.87 for the GA group(P = 0.375); and 0.58 for the IFN group (P = 0.013),
suggesting that the benefit for the cohort overallwas driven by effects of vitamin D in the IFN group.A similar trend was noted for time to relapse alone;however, the effect did not reach significance. Theauthors speculate that the effects of IFN andvitamin D may be complementary, contributing tothe beneficial effect on inflammatory endpointsobserved in this study, whereas greaterredundancy exists in the immunomodulatoryeffects of GA and vitamin D.
MONOCLONAL ANTIBODIESNatalizumabIn the double-blind, placebo-controlled AFFIRMtrial, treatment with natalizumab reduced the riskof disability progression by 42% over 2 years inpatients with RRMS.58 Recently, Rudick et alpresented the results of a post hoc analysis ofAFFIRM to determine the effect of natalizumab onimprovement in walking speed.59 The baselinecharacteristics of patients in the natalizumab andplacebo groups of the AFFIRM trial were wellbalanced. EDSS and T25-FW were performed atbaseline and every 3 months during the study;SF-36 was reported at baseline and then at months6, 12, and 24. For the current analysis, the authorslooked at the percentage of patients who had ≥ 15% or ≥ 20% confirmed improvement inwalking speed (CIWS) from baseline on the T25-FW.The analysis showed that a greater proportion ofpatients treated with natalizumab had CIWS over 2years than placebo controls (Figure 4).
CIWS was associated with improvement in physicalcomponent scores of the SF-36 (SF-36 PCS).Patients with ≥ 20% CIWS had a mean change of2.7 on the SF-36 PCS compared with -0.3 forpatients without CIWS (P = 0.002). The largest

UPDATES IN MS 21
UpdatesinMS
treatment-related effects of natalizumab on CIWSoccurred in those patients with higher EDSS scores(≥ 4.0) at baseline.
While natalizumab has demonstrated efficacy forreducing annualized relapse rates, disabilityprogression, and MRI endpoints, its use is limitedby the risk for progressive multifocalleukoencephalopathy (PML) caused by the JCvirus.58,60,61 The presence of anti-JC virus antibodies,prior immunosuppressant use, and natalizumabexposure beyond 24 months are risk factors for thedevelopment of PML.61 As a result, patientseffectively treated with natalizumab may beswitched to other disease-modifying therapies dueto increasing risk for PML. There is great interest instrategies for the management of patients with MSduring a transition, due to the risk of diseaserecurrence with natalizumab treatmentinterruption. Fox et al recently published results
from the RESTORE study; aprospective, randomized,partially placebo- controlledstudy designed to examine thecourse of MS disease activity inpatients undergoing aninterruption of natalizumabtreatment for up to 24 weekscompared with thosecontinuing on natalizumab.62 Ofthe 175 patients in the RESTOREstudy, 45 were randomized tocontinue on natalizumab, 42 toplacebo, and 88 to treatmentwith other therapies (IFNβ-1a,GA, or methyl prednisolone).MRI disease recurrence occurredin none of the patients whocontinued treatment with
natalizumab compared to 7%–53% of patients inthe other treatment groups. Relapses werereported in 4% of patients who continued onnatalizumab and in 15%–29% of patients in theplacebo and other treatment groups. Following thelast dose of natalizumab, MRI activity recurred asearly as 12 weeks, and relapses as early as 4–8 weeks.
In May, Clerico et al presented a poster on theTY-STOP study, an observational, prospectiveItalian multicenter study of patients with RRMSfollowed for 1 year after receiving 24 doses ofnatalizumab.63 The primary outcome was the meanannualized relapse rate (ARR) at the end of the yearof observation; secondary outcomes were annualMRI activity and EDSS. One hundred thirty RRMSpatients who had received 24 doses of natalizumaband had clinical and MRI stability were enrolled inthe study; 124 completed follow-up. In the
12
7
19
12
0
2
4
6
8
10
12
14
16
18
20
≥ 15% CIWS ≥ 20% CIWS
Perc
ent o
f Pat
ient
s
Placebo (n = 301)
Natalizumab (n = 613)
P = 0.013
P = 0.011
Figure 4: Natalizumab and Walking Speed59

22 UPDATES IN MS
intention-to-treat (ITT) population, 43 patients(34.7%) chose to continue treatment withnatalizumab and 81 (65.3%) elected to interruptnatalizumab treatment. The treatment interruptiongroup includes those patients who stoppednatalizumab for part of the observation year thenrestarted, and also patients who switched amongother therapies. The ARR in the ITT population was0.24 for patients continuing natalizumab treatmentand 0.73 for those interrupting treatment (P = 0.004); the presence of MRI activity in the yearof observation was 25.6% and 48.2% for thenatalizumab continuation and interruption groupsrespectively (P = 0.018). There were no significantdifferences between groups on the EDSS.
In another study related to the transition followingtreatment with natalizumab, Capobianco et alpresented a poster with the results of aretrospective single center study looking at theeffects of different therapeutic approaches onrecurrence of disease activity 12 months followingdiscontinuation of natalizumab.64 Of 196 patientsidentified who had received at least 1 infusion ofnatalizumab, 79 discontinued treatment andfollow-up data were available. Thirty-five patientswere switched to fingolimod following at least 3months of washout; 24 patients received notreatment; and 19 patients received othertreatments including monthly pulsed steroids, GA,IFNβ, azathioprine, and cyclophosphamide.Survival curves and log-rank test of the percentageof relapse-free patients showed no significantdifference between the 3 groups (fingolimod, othertreated, and untreated). Clinical relapses occurredin 31.4% of patients treated with fingolimod and in41.8% of the patients who were untreated ortreated with other agents (non-significant
difference). There were no differences betweengroups for change in EDSS at the end of follow-up.Two recently published studies of patients treatedwith fingolimod after natalizumab highlight theimportance of the washout period during thisswitch, namely that a shorter washout period (lessthan 3 months) was associated with lower risk forrelapse.65 Further study in this area will beimportant to inform decisions about the optimaltherapeutic approach for patients discontinuingtreatment with natalizumab.
AlemtuzumabThe safety and efficacy of the humanized anti-CD52antibody, alemtuzumab, have been demonstratedin 2 phase 3 studies in patients with RRMS.66,67 Inthe CARE-MS I and CARE-MS II trials, conducted intreatment-naïve and treatment-experiencedpatients (relapsed on prior therapy), treatment withalemtuzumab (IV, 12 mg/day for 5 days at baseline,then 3 days at 12 months) was associated withsignificant benefits in clinical and MRI endpointscompared with IFNβ-1a (44 μg SC 3x/week) overthe 2-year studies. Arnold et al presented MRIoutcomes at 3 years of follow-up for the CARE-MS Iand II studies.68 Patients entered into the extensionstudy included 349 from the CARE-MS I trial(previously treatment-naïve) and 393 fromCARE-MS II (previously treatment-experienced).Approximately 80% of patients who were treatedwith alemtuzumab during the core studies did notrequire additional treatment during year 3. Theinvestigators showed that most patients(treatment-naïve and treatment-experienced) werefree of MRI activity in the third year of follow-up. Inaddition, treatment with alemtuzumab appearedto slow the rate of brain volume loss over 3 years(Table 6).

UPDATES IN MS 23
UpdatesinMS
Collectively, these results support the efficacy ofalemtuzumab in patients with RRMS, and help tocharacterize the durability of the treatment effectsfor both treatment naïve and those patients whohave relapsed on prior therapy.
In the CARE-MS trials, thyroid-associated adverseevents and immune thrombocytopenia (ITP) werenoted as risks with alemtuzumab treatment.66,67
Cuker et al presented a poster at a neurologyconference summarizing the experience in thealemtuzumab phase 2, phase 3, and extensionstudies with regard to the development of ITP inpatients with RRMS.69 Overall, 1486 patients weretreated with alemtuzumab across these studies,with a mean follow-up of 54.4 months. Across allpatients, the incidence of protocol-defined ITP was2.0%, corresponding to 20/1217 (1.6%) treated withthe 12 mg alemtuzumab dose, and 10/269 (3.7%)who received 24 mg alemtuzumab. All cases of ITPwere identified through the ITP safety monitoringprogram, which was initiated during theCAMMS223 phase 2 study, and continued duringthe phase 3 and extension studies. Of thosepatients who developed ITP following treatmentwith alemtuzumab, a mean of 29 months (range4-51) elapsed between the first alemtuzumab doseto ITP onset, and a mean of 16 months (range 1-34)from the last alemtuzumab dose. The treatment-related cases of ITP were successfully managedwith medical therapy or self-limiting.
Hunter et al presented data on treatment ofalemtuzumab in treatment-refractory patients withMS and high disability scores.70 The patient cohortincluded 29 patients with a mean ARR of 1.6 in the2 years prior to current alemtuzumab treatment,baseline EDSS of 5.1, and mean MS severity score(MSSS) of 6.6. The patients were all treatment-experienced with approved disease-modifyingtherapies. After receiving 2 or more cycles ofalemtuzumab (60 mg total in the first cycle over 5days, a second cycle 12 months later of 30–36 mgover 3 days, and subsequent 3-day cycles 12months apart as needed for ongoing diseaseactivity), 72% of patients showed improvement inEDSS compared to baseline. The mean change inMSSS was -1.8. For patients who were stable orworsened on the EDSS, the change in MSSS was-0.2. The ARR was 1.1 for Year 1, 0.97 for Year 2, and0.92 for Year 3, compared with 1.6 in the 2 yearsprior to alemtuzumab treatment. This small studydemonstrates benefit associated withalemtuzumab treatment in a cohort of patientswith MS characterized by greater disability thanthose included in the CARE-MS phase 3 studies.
Graves et al presented a poster with visualoutcomes data from the CARE-MS II study.71
Binocular and monocular Sloan visual acuitytesting was performed every 6 months over the2-year study, and outcomes included theproportions of patients who improved, remained
Table 6: CARE-MS Trials: Brain Volume Loss73
Treatment-Naïve Patients (CARE-MS I)
Treatment-Experienced Patients (CARE-MS II)
Year 0-1
-0.59
-0.48
Year 1-2
-0.25
-0.22
Year 2-3
0.19
-0.10
Median Yearly Brain Parenchymal Fraction Change (%)Patients

24 UPDATES IN MS
stable, or worsened according to the visualmeasures. In this population of patients with RRMSwho had relapsed on prior therapy, treatment withalemtuzumab was associated with improvement inSloan visual metrics compared with IFNβ-1a. Theauthors suggest that monitoring visual dysfunctionin MS clinical trials may shed light on an importantdimension of disability in this patient population.
OfatumumabOfatumumab (OFA) is a fully human anti-CD 20monoclonal antibody that depletes B cells viaantibody dependent cell-mediated cytotoxicity andcomplement-dependent cytotoxicity.72 Bar-Or et alpresented results of the phase 2 MIRROR study ofofatumumab in patients with RRMS at AAN.73
MIRROR is an international, randomized,double-blind, placebo-controlled, parallel grouptrial designed to determine the MRI efficacy and
safety of SC ofatumumab at doses of 3 mg, 30 mg,and 60 mg compared to placebo in patients withRRMS. Patients (n = 231) were randomized toplacebo (placebo for 12 weeks followed byofatumumab 3 mg at 12 weeks), ofatumumab 3 mgevery 12 weeks, ofatumumab 30 mg every 12weeks, ofatumumab 60 mg every 12 weeks, orofatumumab 60 mg every 4 weeks. The 24-weekdouble-blind treatment phase was followed by 24 weeks of follow-up. The primary endpoint wasthe cumulative number of new Gd+ T1 brainlesions over 12 weeks compared with placebo. Thetreatment arms were well balanced in terms ofdemographic and clinical parameters at baseline,and 85%–97% of patients completed week 24 ofthe study. Ofatumumab treatment resulted indose-dependent depletion of B cells, and asignificant reduction in new Gd+ lesions over 12 weeks compared with placebo (Figure 5).
0.84
0.25
0.09 0.08 0.07
0
0.1
0.2
0.3
0.4
0.5
0.6
0.7
0.8
0.9
Placebo (n = 67) OFA 3 mg Q12W(n = 32)
OFA 30 mg Q12W(n = 32)
OFA 60 mg Q12W(n = 33)
OFA 60 mg Q4W(n = 63)
Mea
n Ra
te (N
ew G
d+ L
esio
ns p
er S
can)
71% ↓P = 0.002
90% ↓P < 0.001
91% ↓ P < 0.001
92% ↓ P < 0.001
Figure 5: MIRROR: Ofatumumab and New T1 Gadolinium-Enhancing Lesions (Weeks 4–12)73

UPDATES IN MS 25
UpdatesinMS
Over 24 weeks, 79% of patients in the placebo armhad any adverse event, compared with 74%–86%of patients in the ofatumumab treatment arms.Adverse events led to study withdrawal for a totalof 6 patients, from the 3 mg, 30 mg, and 60 mg(every 4 weeks) ofatumumab groups. Six seriousadverse events were reported, all fromofatumumab treatment arms. A summary ofcommon adverse events is shown in Table 7.
In a related presentation, Austin et al reported onthe relationship between peripheral B-cell levelsand MRI disease activity with ofatumumab in theMIRROR study.74 This analysis demonstrated thatthere was a threshold of B-cell depletion to levelsof 32–64 cells/μL, below which there is no addedbenefit with regard to effects on new Gd+ MRIlesions in patients with RRMS. These results mayhelp to inform optimal dosing of ofatumumab foradditional studies in patients with RRMS.
DaclizumabDaclizumab is a humanized monoclonal antibodyspecific for the alpha subunit (CD25) of the humaninterleukin-2 receptor. SELECT was a 52-week,randomized, double-blind, placebo-controlledstudy to evaluate the safety and efficacy ofdaclizumab high-yield process (DAC HYP) (150 mgor 300 mg every 4 weeks) in adults with RRMS.75
SELECTION was a 1-year extension, where patientsin the SELECT placebo group were randomized toreceive 150 mg or 300 mg DAC HYP and those intreatment groups were randomized to continue thesame dose or to a 24-week washout followed by 24weeks of the original dose.76 Radue et al presenteda poster with a post hoc analysis of T1 hypointenselesion volumes at the conclusion of SELECT (1 year)and SELECTION (2 years).77 At year 1, the treatmentgroups had a 15% decrease in lesion volume whilethe placebo group had a 16% increase (P < 0.0001).During year 2, the continuous treatment group had
Table 7: MIRROR: Common Adverse Events Weeks 0–1273
Adverse Event
Injection-relatedreaction
Nasopharyngitis
Dizziness
Urinary tractinfection
Anxiety
Pyrexia
Respiratorytract infection
Ecchymosis
Neuralgia
Placebo(n = 67)
15
6
0
3
3
0
1
0
0
OFA 3 mgQ12W (n = 34)
47
3
0
3
3
3
3
6
0
OFA 30 mgQ12W (n = 32)
41
6
3
9
6
6
0
0
6
OFA 60 mgQ12W (n = 34)
44
18
0
0
0
0
6
0
0
OFA 60 mg Q4W (n = 64)
66
9
6
0
0
2
0
0
0
Values represent %

26 UPDATES IN MS
an additional 15% decrease in volume while thepatients who were switched from placebo in year 1to treatment in year 2 had a 6% decrease involume. The authors conclude that DAC HYPtreatment resulted in a sustained reduction in thevolume of total and new T1 hypointense lesionsover 2 years of treatment. This radiologic effect isconsistent with the clinical effects on disabilityprogression observed in the clinical trials.
Rituximab in Progressive MSWhile mitoxantrone is approved for progressiveforms of MS, its use is limited by risk forcardiotoxicity and treatment-related leukemia.78
The lack of safe and effective treatment options forpatients with progressive MS is a significant unmetneed. Perrone et al presented a poster with resultsof a retrospective, single center analysis ofrituximab therapy in patients withsecondary-progressive MS.79 This analysis included80 patients with secondary progressive MS, 40treated with rituximab and 40 controls. Patients inthe rituximab group received at least 4 cycles oftreatment (each cycle 1 g rituximab IV, 2 weeksapart), with 2 years of pretreatment andposttreatment follow-up. Patients in the controlgroup had at least 4 years of monitoring onsecond-line therapies or on no medication.Baseline characteristics were relatively similarbetween the 2 groups; disease duration was 16.4and 17.1 years for the rituximab and controlgroups, respectively. After 2 years of rituximabtreatment, the mean change in EDSS score wassignificantly improved compared with controls (P = 0.016). Categorizing response based on theEDSS, 45% of patients treated with rituximabshowed improvement, 38% were stable, and 18%progressed. There were no severe adverse events
associated with rituximab treatment. Urinary tractinfections, fatigue, infusion reactions, rash,bronchitis, headache, serum sickness disease, andnausea were reported in ≥ 5% of patients. Theseresults suggest that B cell depletion may be abeneficial treatment strategy for patients withsecondary-progressive MS and worthy of additionalstudy.
ORAL DISEASE-MODIFYING THERAPIESFingolimodFingolimod is a sphingosine 1-phosphate receptormodulator indicated at a dose of 0.5 mg orally oncedaily for the treatment of patients with relapsingforms of multiple sclerosis to reduce the frequencyof clinical exacerbations and to delay theaccumulation of physical disability.80 Brain volumeloss (BVL) is a natural part of aging but isaccelerated in patients with MS. Correlations havebeen reported between BVL and cognitiveperformance in patients with MS81 as well as RIS.82
The rate of BVL in healthy adults has been assessedby several investigators. A meta-analysis of multipleMRI studies in healthy control subjects found thatthe brain volume is stable until 35 years of age, anddecreases by approximately 0.2% per yearafterwards.83 De Stefano et al presentedunpublished data at a Neurology conference from asmaller study of healthy adults over a period up to12 years. Using the Structural Image Evaluationusing Normalization of Atrophy (SIENA) algorithm,adults less than 35 years (n = 15) lost brain volumeat 0.2% per year while subjects ≥ 35 years (n = 22)lost brain volume at a rate of 0.35% per year. Healso referred to several studies of healthy adultswho lost brain volume at a rate of approximately0.24% per year, assessed with the SIENA algorithm.

UPDATES IN MS 27
UpdatesinMS
Patients with MS in the placebo groups from theFREEDOMS and FREEDOMS II studies had BVL ofapproximately 0.66% per year, while this loss wasreduced to 0.44% in the 0.5 mg fingolimodtreatment groups.84 Another way to approach thedata is by asking what percentage of the treatedpatients in these two trials exceeded a threshold of0.2% BVL per year. This categorical analysis showedthat 20.0% of placebo-treated patients lost lessthan 0.2% of brain volume per year (N = 580) while29.1% of patients at the 0.5 mg dose and 32.9% ofpatients at the 1.25 mg dose lost this amount ofbrain volume (N = 623 and 581; P = 0.0003 and P < 0.0001, respectively). Analysis with a thresholdvalue of 0.4% gave a qualitatively similar result.Since 0.2% BVL per year is a good approximation ofthe rate in healthy adults, this threshold approachto BVL could constitute part of a definition of “noevidence of disease activity” that is evolving as ametric for success of MS therapy.
Radue et al reported BVL in three fingolimodstudies (FREEDOMS, N = 1272, FREEDOMS II, N = 1083, and TRANSFORMS, N = 1280).85 Theyanalyzed each patient individually to account fortreatment discontinuation by some participants.The TRANSFORMS extension study included IMIFNβ-1a as an active comparator and did not have aplacebo arm. All these studies had extensionphases where all patients were switched tofingolimod. Their BVL findings are consistent withvalues reported for the individual studies andsupport fingolimod’s activity in slowing the rate ofBVL for patients with MS. The lowest rate of BVL(approximately 0.2% per year) was observed inTRANSFORMS patients who switched from IMIFNβ-1a after 12 months to fingolimod.
A post-hoc analysis of pooled data from FREEDOMSand FREEDOMS II patients who had been treatedpreviously with glatiramer acetate (subgroup GA1)was presented in a poster by Jeffery et al.86
Seventy-six patients received 0.5 mg/dayfingolimod and 90 patients received placebo. Highdisease activity (GA1-DA) was defined as relapse inthe year before screening and with either at least 1Gd-enhancing T1 lesion or at least 9 T2 lesions atbaseline and/or equal or more relapses in this 1year before screening than 2 years beforescreening. GA1-DA patients benefited fromfingolimod treatment compared to placebo in anumber of key measures:
• The ARR was reduced by 53% (0.250, 95% CI: 0.166; 0.376) compared to placebo (0.529; 95% CI: 0.393; 0.712)
• There was a higher proportion of relapse-free patients after fingolimod treatment (68.1%) than with placebo (49.4%, odds ratio: 2.20, P = 0.042)
• There was higher proportion of patients free of 3-month disability progression compared to placebo (81.7% vs 64.2%, HR = 0.423, P = 0.042)
• All subgroups had highly significant reductions in the number of new/newly enlarged T2 lesionsas well as the number of Gd+ T1 lesions at month 24 compared to placebo
• Treatment with fingolimod resulted in a significant reduction in percent change from baseline in normalized brain volume at month 24 compared to placebo in both, group GA1 and subgroup GA1-DA
Fingolimod has been associated with a decrease inheart rate and/or atrioventricular conduction after

28 UPDATES IN MS
the first dose. The FDA-approved labeling includes6 hours of monitoring for bradycardia after the firstdose, and overnight monitoring of patients at riskof bradycardia or heart block or those with aprolonged QTc interval.80 These cardiovasculareffects would be of special concern for patientstaking other drugs with similar effects. Oneexample is the selective serotonin reuptakeinhibitors (SSRIs) that are used to treat depressionand other conditions; bradycardia andprolongation of QT interval have been observedwith SSRIs.87,88 Bermel et al evaluated safety datafrom phase 2 and phase 3 studies of fingolimod toevaluate first dose effects in patients with RRMSwho were receiving concomitant SSRIs.89 The dataset included all patients randomized to receivefingolimod 0.5 mg or 1.25 mg or placebo in thecore, controlled phases of all phase 2 and 3fingolimod studies (FREEDOMS, FREEDOMS II,TRANSFORMS and a phase 2 study). Although theSSRI citalopram is associated with a dose-dependent increase in QTc,90 the current studyfound no indication of added effect on QTc intervalduring treatment initiation in over 400 patientstreated with fingolimod and SSRIs. The possibilityremains that rare patients may be sensitive to bothSSRI and fingolimod effects on QTc.
The 2-year FREEDOMS II study showed thatfingolimod reduced the ARR by 48% comparedwith placebo and increased the percentage ofpatients free from relapse.91 A study in SouthernCalifornia found that African American (AA) womenhave a higher risk of MS than white women.92 It hasbeen proposed that African Americans have apoorer response to DMTs than whites.93 Coyle et alanalyzed the FREEDOMS II results for evidence ofracial differences in response to fingolimod.94 There
were 77 African American subjects in the studydistributed in the placebo, fingolimod 0.5 mg, andfingolimod 1.25 mg groups (n = 28, 24, and 25,respectively). The ARRs were 0.26 and 0.17 in thefingolimod 0.5 mg and 1.25 mg treatment groups,respectively, versus 0.36 for placebo in AA patients.This translates into 29% and 54% relativereductions in the two treatment groups. There werefewer Gd+ lesions in the fingolimod groups than inthe placebo group at 6, 12, and 24 months, and ahigher proportion of patients were free from Gd+lesions in the fingolimod groups than in theplacebo group at these times. The numbers ofnew/newly enlarged T2 lesions during months 0–6,0–12 and 0–24 were lower in the fingolimodgroups than in the placebo group andproportionately more patients were free fromnew/newly enlarged T2 lesions in the fingolimodgroups than in the placebo group during eachperiod. The overall incidence of adverse events wassimilar in the three arms. The authors conclude thatthe efficacy and safety of fingolimod in AfricanAmerican patients in FREEDOMS II are consistentwith results from the overall study population. Thisstudy with fingolimod does not support theproposal that African Americans responddifferently to DMTs.
SiponimodSiponimod is an oral sphingosine 1-phosphatereceptor modulator being developed for secondaryprogressive MS (SPMS).95 In the phase 2 BOLD studysiponimod treatment reduced combined uniqueactive MRI lesions (CUAL) up to 80% versus placeboin RRMS patients. The MRI dose-response curveindicated near-maximal efficacy at 2 mg and theARR was reduced versus placebo (0.20 vs. 0.58; P = 0.041).96 Kappos et al presented a poster with

UPDATES IN MS 29
UpdatesinMS
24-month results of a BOLD dose-blindedextension study.97 In this phase, BOLD patientscontinued on the siponimod dose from the corestudy; patients on placebo were randomized toactive treatment groups. The final phase is anopen-label extension study where all patientsreceive siponimod 2 mg. At the end of the corestudy, the mean number of Gd+ T1 lesions wasreduced in all treatment groups. At extensionmonth 24, the mean number of Gd+ T1 lesions wasreduced in the higher dose groups. Similarly, themean number of new/newly enlarged T2 lesionswas lower at higher doses. The therapeutic effectappears to plateau at the 1.25 mg dose.Approximately 90% of the subjects experiencedadverse effects. Nasopharyngitis and headachewere the most common effects and the authorssaid that in general the treatment waswell-tolerated.
Ceralifimod (ONO-4641)Ceralifimod is also an emerging oral sphingosine1-phosphate receptor modulator underdevelopment for RRMS. The 26-week DreaMSmultidose phase 2 study showed positive efficacyresults in 201298 and a poster presentation byBar-Or et al shows interim results from the first 26weeks of the 229 week extension trial.99 Patientsentering the extension study continued on theircore study dose of ceralifimod or were randomizedfrom placebo to active treatment (0.05 mg, 0.10mg, or 0.15 mg per day). During the extensionperiod patients originally on placebo had adecrease in the mean number of new/enlarging T2lesions and patients continually receiving drugmaintained a low number of these lesions. Over the6-month extension study, ARRs decreased inpatients who had switched from placebo to
ceralifimod, while patients who had continued ontreatment had consistently low ARRs. The safetyand tolerability findings were similar to the corestudy, and approximately 70% of patients in theextension group experienced an adverse event.
A poster presentation by Huang et al describedwork with the Dark Agouti (DA) EAE rat model.100
Ceralifimod was administered daily beginning atthe peak of disease, 13 days after induction withfull length myelin oligodendrocyte glycoprotein ina Complete Freund’s Adjuvant emulsion. Invehicle-treated animals, quantitative MRI analysisdemonstrated that inflammation anddemyelination continued to develop throughoutthe course of disease, correlating with clinical score.Levels of inflammation and demyelination werereduced to baseline levels in animals treated withceralifimod. Spinal cord T2 and MT MRImeasurements in the DA rats correlated withclinical assessments of the animals.
TeriflunomideTeriflunomide, an inhibitor of dihydroorotatedehydrogenase (de novo pyrimidine synthesisinhibitor), is an FDA-approved therapy for RRMSwith once daily oral dosing at either 7 mg or 14 mg.101 In a clinical trials plenary session, Miller etal presented data from TOPIC, an international,randomized, double-blind, placebo-controlled trialdesigned to evaluate the safety and efficacy ofteriflunomide (7 mg or 14 mg) in patients with afirst clinical episode consistent with MS.102 Patients (n = 618) were randomized to 1 of 3 treatment arms(teriflunomide 14 mg, teriflunomide 7 mg, orplacebo), and the core study duration was 108weeks. The primary endpoint was time to newclinical relapse confirming clinically definite MS

30 UPDATES IN MS
(CDMS), and a key secondary endpoint was theoccurrence of a new clinical relapse or MRI lesion(Gd+ or new T2). The patient demographic andbaseline disease characteristics were well balancedamong treatment groups. Mean patient age was 32years, 68% of patients were female, and 59% had amonofocal presentation. Treatment withteriflunomide resulted in a 37% and 43% reductionin the risk for conversion to CDMS for the 7 mg and14 mg doses, respectively, compared with placebo(Table 8).
Treatment with both doses of teriflunomide wassuperior to placebo in risk for either new clinicalrelapse or MRI lesion, and the 14 mg dose wasassociated with a significantly lower total lesionvolume and number of Gd+ T1 lesions per scancompared with placebo. The occurrence of sideeffects was similar to results observed in other MSclinical trials with teriflunomide; the most commontreatment-emergent adverse events occurring atgreater frequency in the teriflunomide armsincluded increased ALT, headache, hair thinning,diarrhea, paresthesia, and upper respiratory tractinfection. Overall, these results suggest that
teriflunomide may have beneficial effects very earlyin the MS disease course, as has beendemonstrated for IFNβ-1a/1b and GA in patientswith CIS.103,104,105,106,107
Pooled safety data from 4 placebo-controlledteriflunomide studies (phase 2 proof-of-concept,TEMSO, TOWER, and TOPIC) were presented inposters at a conference in May.108,109 The combinedcore studies included data from 1002 patientstreated with teriflunomide 14 mg, 1045 patients interiflunomide 7 mg arms, and 997 patients whoreceived placebo. Overall, this analysis did notidentify any new safety signals associated withteriflunomide treatment. Information related toselected adverse events is summarized in Table 9.
Teriflunomide has a Pregnancy Category X rating,and the product label recommends that if a womanbecomes pregnant while being treated,teriflunomide should be discontinued immediatelyand an accelerated elimination procedureimplemented.101 Henson et al presented a posterproviding updated pregnancy outcomes inpatients and partners of patients in the
Table 8: Teriflunomide in Patients with CIS: TOPIC Outcomes102
Outcome Measure
Risk for Conversion to CDMS
Risk for New Clinical Relapseor MRI Lesion
Percent Change from Baselinein Total Lesion Volume
Adjusted Gd+ T1 Lesions
Teriflunomide (7 mg) [n = 203]
HR: 0.628(95% CI: 0.416, 0.949)
P = 0.0271
HR: 0.686(95% CI: 0.540, 0.871)
P = 0.0020
18% vs 28% for placeboP = 0.7789
21% RRR vs placeboP = 0.4366
Teriflunomide (14 mg) [n = 214]
HR: 0.574(95% CI: 0.379, 0.869)
P = 0.0087
HR: 0.651(95% CI: 0.515, 0.822)
P = 0.0003
5% vs 28% for placeboP = 0.0374
59% RRR vs placeboP = 0.0008
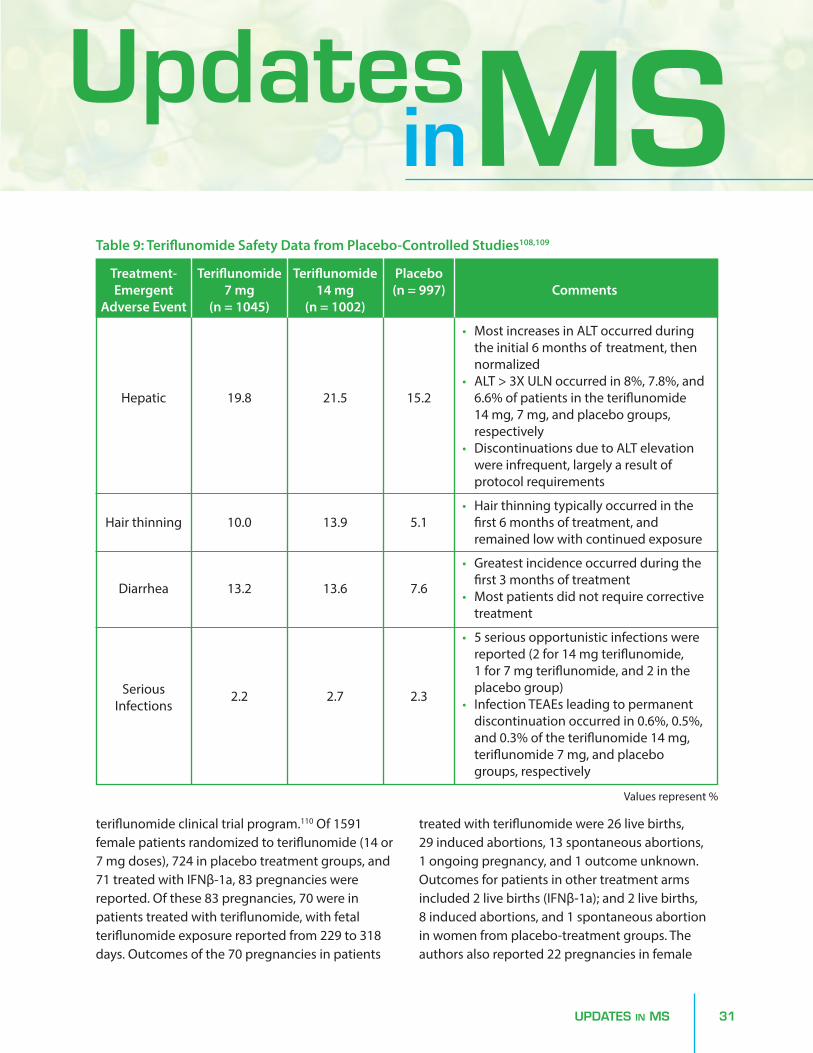
UPDATES IN MS 31
UpdatesinMS
teriflunomide clinical trial program.110 Of 1591female patients randomized to teriflunomide (14 or7 mg doses), 724 in placebo treatment groups, and71 treated with IFNβ-1a, 83 pregnancies werereported. Of these 83 pregnancies, 70 were inpatients treated with teriflunomide, with fetalteriflunomide exposure reported from 229 to 318days. Outcomes of the 70 pregnancies in patients
treated with teriflunomide were 26 live births, 29 induced abortions, 13 spontaneous abortions, 1 ongoing pregnancy, and 1 outcome unknown.Outcomes for patients in other treatment armsincluded 2 live births (IFNβ-1a); and 2 live births, 8 induced abortions, and 1 spontaneous abortionin women from placebo-treatment groups. Theauthors also reported 22 pregnancies in female
Table 9: Teriflunomide Safety Data from Placebo-Controlled Studies108,109
Treatment-Emergent
Adverse Event
Hepatic
Hair thinning
Diarrhea
SeriousInfections
Values represent %
Teriflunomide7 mg
(n = 1045)
19.8
10.0
13.2
2.2
Teriflunomide14 mg
(n = 1002)
21.5
13.9
13.6
2.7
Placebo(n = 997)
15.2
5.1
7.6
2.3
Comments
• Most increases in ALT occurred during the initial 6 months of treatment, then normalized
• ALT > 3X ULN occurred in 8%, 7.8%, and6.6% of patients in the teriflunomide 14 mg, 7 mg, and placebo groups, respectively
• Discontinuations due to ALT elevation were infrequent, largely a result of protocol requirements
• Hair thinning typically occurred in the first 6 months of treatment, and remained low with continued exposure
• Greatest incidence occurred during the first 3 months of treatment
• Most patients did not require correctivetreatment
• 5 serious opportunistic infections were reported (2 for 14 mg teriflunomide, 1 for 7 mg teriflunomide, and 2 in the placebo group)
• Infection TEAEs leading to permanent discontinuation occurred in 0.6%, 0.5%, and 0.3% of the teriflunomide 14 mg, teriflunomide 7 mg, and placebo groups, respectively

32 UPDATES IN MS
partners of male patients from the teriflunomidetrials. Of the 18 live births from these pregnancies,16 were to partners of men treated withteriflunomide. Collectively, there were no structuralor functional abnormalities reported in the 42infants born to mothers or fathers treated withteriflunomide. Pregnancy outcomes are beingcollected on an ongoing basis through globalteriflunomide pregnancy registries.
Dimethyl fumarateDimethyl fumarate (DMF, BG-12) was originallyused as an anti-inflammatory agent in Europe fortreating psoriasis.111 It has since been investigatedfor MS and gained FDA approval in 2013 for thetreatment of patients with relapsing forms of MS.112
DMF has immunomodulatory and antioxidativeeffects. Keap1 is a protein that binds Nrf2, a nucleartranscription factor. DMF modifies Keap1, disruptsthe interaction with Nrf2, and permitsaccumulation of Nrf2 in the nucleus withsubsequent up-regulation of antioxidantgenes.113,114 DMF is not a specific agent, and Nrf2 isnot the only affected pathway. For example, theside effect of flushing is mediated by the nicotinicacid receptor.
The most common side effects of DMF are flushingand GI symptoms,115 though the incidence of theseeffects decreased with ongoing treatment.111
Tornatore et al speculated that the GI symptomswere related to a transient increase in eosinophilcounts during the first 2 months of DMF therapy.116
They performed a study of 21 patients withpersistent DMF-related GI symptoms to see if aleukotriene receptor antagonist would reduce thesymptoms. Patients were treated with 10 mg ofmontelukast each morning. The Gastrointestinal
Symptom Rating Scale (GSRS) was used to measurethe change in the gastrointestinal symptoms bothprior to and one month after the introduction ofmontelukast. The GSRS questionnaire includes 15 questions, and assess severity of GI symptoms in5 domains: indigestion, diarrhea, constipation,abdominal pain, and reflux. Most patientsimproved during the month of treatment: 8/21patients were symptom free, 8/21 patients hadattenuation of symptoms (62% reduction frombaseline), and 5/21 patients had no response tomontelukast.
DEFINE117 and CONFIRM118 were pivotal phase 3studies of delayed-release DMF. Both trials mettheir primary endpoints, proportion of patientsrelapsed at 2 years and ARR at 2 years, respectively.Havrdova et al presented a poster with a post-hocanalysis of these studies looking at the absence ofmeasured disease activity at 6 months, 1 year, and2 years.119 This endpoint (aka No Evidence ofDisease Activity, NEDA; or Freedom from MeasuredDisease Activity, FMDA) is receiving considerableinterest as a clinical goal as the number, variety,and efficacy of MS therapies increases. Havrdovaand colleagues defined overall absence ofmeasured disease activity as meeting all of thesecriteria:
• No relapses (confirmed by an independent neurology evaluation committee)
• No EDSS progression (progression was a > 1.0-point increase in patients with a baseline score of > 1.0 or a > 1.5-point increase in patients with a baseline score of 0, sustained for 12 weeks)
• No brain MRI activity (no new or newly enlarging T2 lesions and no Gd+ lesions)

UPDATES IN MS 33
UpdatesinMS
The ITT population comprised 2301 patientsrandomized and treated with DMF BID (n = 769),delayed-release DMF TID (n = 761), or placebo (n = 771); the MRI cohort included 1046 patients.Patients treated with DMF were approximatelytwice as likely to have no measured overall diseaseactivity at 6 months, 1 year, and 2 years, as well asbetween year 1 and year 2 of treatment. Theproportions of patients in the delayed-release DMFBID and TID groups with no measured clinicaldisease activity at 2 years were 69% and 71%,respectively, versus 53% in the placebo group(both P = 0.0001). The proportions of patients withno measured brain MRI activity at 2 years were 34%and 35%, respectively, versus 20% in the placebogroup (both P = 0.0001). The proportion of patientswith no measured overall disease activity at 2 yearswas 23% for both BID and TID versus 11% in theplacebo group (both P = 0.0001); and between Year1 and Year 2 the proportions were 48% and 47% forBID and TID groups, respectively, versus 19% in theplacebo group (both P = 0.0001). Patients in allsubgroups analyzed by demographics and diseasecharacteristics benefited from DMF treatment,compared with placebo. These findings of thiscombined analysis are similar to individual resultsof the DEFINE and CONFIRM studies.
Since many MS patients are females ofchild-bearing age, reproductive safety is of concernfor MS therapies. Gold et al presented an overviewof reproductive toxicology observations frompreclinical animal studies as well as clinical trialswith DMF.120 Rats and rabbits exposed to highdoses of DMF had reduced maternal body weightgain. Rat fetal alterations and an increased rate ofabortion in rabbits were observed at high doses.These animals received high doses throughoutpregnancy, unlike human subjects, so the relevance
to treating patients with DMF is unknown. Goldalso presented an analysis of humans receivingDMF, including 2665 subjects with MS, 320 subjectswith psoriasis, 101 subjects with RA, and 338healthy volunteers. Postmarketing outcomes fromMS patients in the United States, Canada, andAustralia were also included. There were 44pregnancies in DMF clinical trials and 45pregnancies in women treated with DMF afterapproval (according to protocol DMF wasdiscontinued after the pregnancy was discovered).Outcomes are known for 38 of these pregnancies.No fetal abnormalities have been reported andthree-quarters of the live births were full term. Twoof the 13 (15%) of the women receiving placebo inthe clinical trials and three of the 44 (7%) of thewomen receiving delayed-release DMFexperienced spontaneous abortions early in thefirst trimester, rates similar to those reported in thegeneral population.121 Gold and colleaguesconcluded that there is no evidence that exposureto DMF increases the rate of fetal abnormalities,adverse pregnancy outcomes, or spontaneousabortion.
EXPLORE122 was a safety/tolerability study of DMFas add-on therapy for RRMS patients with diseaseactivity currently being treated with IFNβ or GAmonotherapy for at least 1 year.123 Disease activitywas defined as at least 1 relapse in the 12 months prior to enrollment or a Gd+ MRI lesionwithin 6 weeks of enrollment. Approximately 40%of the patients had a prior therapy before thecurrent IFNβ or GA regimen. Patients continued ontheir prescribed MS therapy for 2 months, thenreceived delayed-release DMF 240 mg 3 times daily(TID) in addition to their prescribed MS therapy for6 months.

34 UPDATES IN MS
One hundred four patients completed themonotherapy period and were dosed withdelayed-release DMF/IFNβ (n = 57) ordelayed-release DMF/GA (n = 47). During theadd-on therapy period the overall incidence of AEswas 95% and 100%; the most common AEs wereflushing (42% and 53%), diarrhea (32% and 15%),and abdominal pain (21% and 6%). There were 3patients with serious AEs (2 in the DMF/IFNβ groupand 1 in the DMF/GA group); most AEs were mild ormoderate in severity and 14% and 17%,respectively, of the patients discontinued DMF.There was no overall increased risk of infection andno malignancies were reported. Both groupsshowed a decrease in mean white blood cell andlymphocyte counts, which both remained withinnormal limits. The authors concluded that theoverall safety profile of delayed-release DMF incombination with IFNβ or GA was similar to theknown safety profile of delayed-release DMFmonotherapy.
LaquinimodLaquinimod is an orally availableimmunomodulatory drug with multiple effects.Laquinimod has been suggested to reduceleukocyte migration into the CNS, modulate B-cellactivity, augment T-regulatory cells, and modulatedendritic cells’ antigen presentation capacity.124
Comi125 presented a pooled analysis of theALLEGRO126 and BRAVO127 phase 3 trials.Laquinimod 0.6 mg was associated with aconsistently lower Confirmed Disability Progression(CDP) for one year (Figure 6). Laquinimod reducedwhole brain tissue loss over 24 months 30% from1.19% in the placebo group (n = 1006) to 0.84% inthe treatment group (laquinimod 0.6 mg, n = 984, P < 0.0001). This protection was evident in whitematter, grey matter, and thalamus.128
A meta analysis by Sormani et al suggests that CDPcan be predicted from the annualized relapserate.129 This model predicts that laquinimod’s
0.3
0.35
0.4
0.45
0.5
0.55
0.6
0.65
0.7
0 2 4 6 8 10 12 14
CDP,
Haz
ard
Rati
o
Months
Figure 6: Confirmed Disability Progression (CDP) in the Pooled Analysis of ALLEGRO and BRAVO125
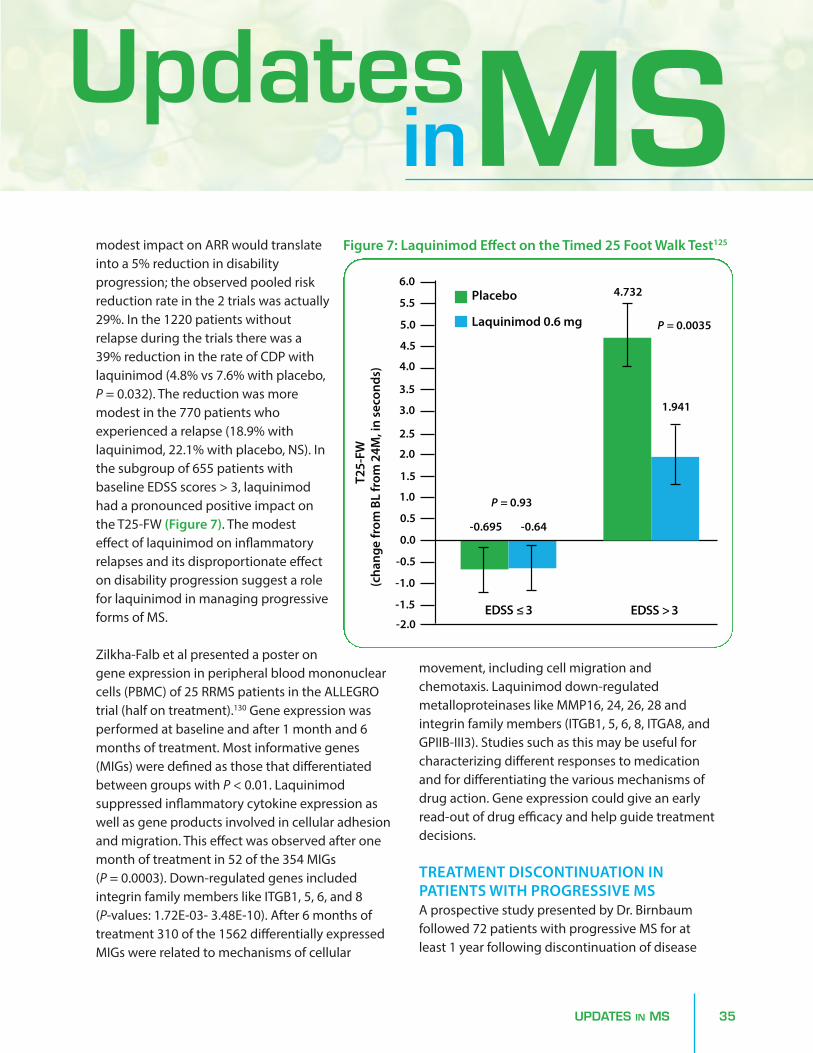
UPDATES IN MS 35
modest impact on ARR would translateinto a 5% reduction in disabilityprogression; the observed pooled riskreduction rate in the 2 trials was actually29%. In the 1220 patients withoutrelapse during the trials there was a39% reduction in the rate of CDP withlaquinimod (4.8% vs 7.6% with placebo,P = 0.032). The reduction was moremodest in the 770 patients whoexperienced a relapse (18.9% withlaquinimod, 22.1% with placebo, NS). Inthe subgroup of 655 patients withbaseline EDSS scores > 3, laquinimodhad a pronounced positive impact onthe T25-FW (Figure 7). The modesteffect of laquinimod on inflammatoryrelapses and its disproportionate effecton disability progression suggest a rolefor laquinimod in managing progressiveforms of MS.
Zilkha-Falb et al presented a poster ongene expression in peripheral blood mononuclearcells (PBMC) of 25 RRMS patients in the ALLEGROtrial (half on treatment).130 Gene expression wasperformed at baseline and after 1 month and 6months of treatment. Most informative genes(MIGs) were defined as those that differentiatedbetween groups with P < 0.01. Laquinimodsuppressed inflammatory cytokine expression aswell as gene products involved in cellular adhesionand migration. This effect was observed after onemonth of treatment in 52 of the 354 MIGs (P = 0.0003). Down-regulated genes includedintegrin family members like ITGB1, 5, 6, and 8(P-values: 1.72E-03- 3.48E-10). After 6 months oftreatment 310 of the 1562 differentially expressedMIGs were related to mechanisms of cellular
movement, including cell migration andchemotaxis. Laquinimod down-regulatedmetalloproteinases like MMP16, 24, 26, 28 andintegrin family members (ITGB1, 5, 6, 8, ITGA8, andGPIIB-III3). Studies such as this may be useful forcharacterizing different responses to medicationand for differentiating the various mechanisms ofdrug action. Gene expression could give an earlyread-out of drug efficacy and help guide treatmentdecisions.
TREATMENT DISCONTINUATION INPATIENTS WITH PROGRESSIVE MSA prospective study presented by Dr. Birnbaumfollowed 72 patients with progressive MS for atleast 1 year following discontinuation of disease
UpdatesinMS
T25-
FW(c
hang
e fr
om B
L fr
om 2
4M, i
n se
cond
s)
EDSS ≤ 3 EDSS > 3
-0.695
-2.0
-1.5
-1.0
-0.5
0.0
0.5
1.0
1.5
2.0
2.5
3.0
3.5
4.0
4.5
5.0
5.5
6.0
-0.64
P = 0.93
4.732
1.941
P = 0.0035
Placebo
Laquinimod 0.6 mg
Figure 7: Laquinimod Effect on the Timed 25 Foot Walk Test125

36 UPDATES IN MS
modifying therapy.131 Patients in Group 1discontinued treatment on the advice of theirphysicians and based on > 10 years withoutevidence of acute inflammatory disease (clinical orMRI activity), and Group 2 were patients whoelected to stop disease-modifying therapy on theirown (due to treatment-related side effects or forfinancial reasons). Both groups were largely female(Group 1, 80.6%; Group 2, 90.0%), and the medianage was 61.5 years for Group 1 and 50.5 years forGroup 2 (P ≤ 0.0001). The median time ondisease-modifying therapy was 10 and 8 years forGroup 1 and Group 2 patients, respectively. Of the
62 patients in Group 1, 94% remained stable;patients who worsened in this group weresignificantly younger than those who remainedstable (53.5 years vs 62 years, P = 0.004). In contrast,fewer patients in Group 2 remained stable (6/10)and 40% worsened following treatmentdiscontinuation (age was not associated withincreased risk for active disease in Group 2). Overall,89% of this patient cohort were stable followingtreatment discontinuation, however higher relapserates were observed in those patients whoindependently decided to discontinue therapy.
VITAMIN DFatigue is a common symptom of MS, occurring in30%–80% of patients. Dr. Anat Achiron presentedthe results of an efficacy trial with the syntheticanalog alfacalcidol (1α-hydroxy vitamin D3).132
Alfacalcidol is hydroxylated in the liver to the activeform of vitamin D, calcitriol. A small 6-month pilotstudy in patients with MS suggested thatalfacalcidol had few side effects and may have hada positive impact on relapse rate.133 In vitroexperiments showed that PBMC from MS patientshad a lower level of apoptosis than cells fromhealthy subjects. Stimulation of MS PBMC byvitamin D3 restored the normal level of apoptosis,mainly through an increase of NR4A1 and to alesser extent BAX, while in cells from healthysubjects both pathways were stimulated.134 In thecurrent trial 158 patients were randomized toreceive alfacalcidol 1 mcg/day or placebo for
6 months. These subjects were selected from 600random patients from the Sheba MS registry on thebasis of a Fatigue Severity Scale question (“Fatigueinterferes with my work, family, or social life”answer ≥ 3). Patient fatigue was evaluated with theFatigue Impact Scale (FIS), a 40-item questionnairewith subscales in physical, cognitive, and socialareas. The primary endpoint was the difference inthe FIS score between alfacalcidol and placebogroups at 6 months.
Both groups showed improvement (decreases) inthe FIS scores, and the treatment group wassignificantly lower than the placebo group (relativedecreases of 41.6% and 27.4%, respectively, P = 0.007). Among the secondary endpoints, thechange in EDSS was not significant but morepatients remained relapse-free in the treatmentgroup (89.5% vs 67.1%, P = 0.007). No serious
Symptom Management

UPDATES IN MS 37
adverse events were reported in the trial and thefrequencies of patients in each group whoexperienced any adverse event were not different(treatment, 15.8%, placebo, 16.7%). These positivefindings are notable as the first prospectivetherapeutic trial results of vitamin D in MS.
ExERCISEIn addition to evidence that exercise is associatedwith improvement in physical parameters, recentstudies indicate that exercise may also havebenefits on cognitive function in patients withMS.135,136 In a poster, Mandelbaum et al presentedthe results of a small study of salsa dancing inpersons with MS.137 This pilot study included 8individuals with MS who participated in a 4-weekdance program (dance sessions twice per week, 40minutes each) and independent physical activities(30 minutes/week). Compared with pre-interventionvalues, participation in the dance program wasassociated with significant improvement in3-month follow-up measures on the Timed Up andGo (P = 0.05), Dynamic Gait Index (P = 0.04), and MSWalking Scale (P = 0.05). The investigators indicatedthat a larger controlled study of dance interventionfor patients with MS is underway.
CONSTRAINT-INDUCED THERAPYPatients with neurologic disorders who suffer limbdisability frequently favor their stronger side,reduce the use of the weaker limb, and therebyexacerbate the disability. Victor Mark presented asmall randomized controlled trial ofconstraint-induced (CI) movement therapy.138 Coreelements of CI therapy include the following:• Massed practice with the paretic limb 3 hours/day• Physical restraint to the less-affected arm 90% of
waking hours
• Shaping of training exercises (incrementally increased task difficulty)
• Transfer package of behavioral techniques– Behavioral contract with patient– Home practice assignments– Daily activity diary– Daily review of activities with therapist, using
the Motor Activity Log (MAL)
The MAL is a structured interview where thepatient rates the use of the paretic hand. It uses a0-5 scale covering 30 activities of daily life. MAL hasexcellent test/retest reliability and has beenvalidated with activity counts with anaccelerometer. The reported trial consisted of 20patients with chronic non-relapsing progressive MSand upper limb hemiparesis who had MAL scoresless than 3/5. Patients were randomized to CItherapy or complementary and alternativemedicine (CAM), which included a package ofaquatic therapy, yoga, relaxation exercises, musictherapy, and massage. Patients in the CI therapygroup had their less-affected hand restrained in amitt for the 35 hours of therapy over 10 days. Themore-affected hand was used to perform trainingtasks such as transferring tennis balls betweencontainers under the guidance andencouragement of a therapist. CI therapy resultedin significant improvement in MAL score comparedto the CAM group (changes of 2.7 and 0.5,respectively) and all patients in the CI therapygroup showed improvement. The CI group showedcortical gray matter growth by 3T MRI voxel-basedmorphometry (P < 0.02) while the CAM groupshowed no change. These results are consistentwith previous findings in stroke patients139 andchildren with cerebral palsy treated with CI therapy.
UpdatesinMS

38 UPDATES IN MS
Ongoing advances in the diagnosis and management of MS are reflected in the research presented atrecent neurology conferences. Choice of DMT is a process that must be custom tailored for eachindividual patient. One of the biggest remaining challenges is that it is still not possible to predictwhich patient will have an optimal response (ie no relapses and no new or inflammatory MRI lesions)to any one medication. This is an emerging area where biomarkers and genetic information will bevery valuable. Other considerations include side effect profile, lifestyle, and comorbidities. Changing toanother therapeutic agent when response to the first agent is deemed suboptimal is complicated. Inaddition to the inability to predict response to any one agent, there are very few head-to-head trialsbetween agents, and therefore comparisons of efficacy may only be inferred. The data oncombinations of DMTs as a safe and effective strategy are very limited at the current time, but this mayprove to be an effective and feasible treatment approach in the future.
Future Challenges
1. Bermel RA, Bakshi R. The measurement and clinical relevanceof brain atrophy in multiple sclerosis. Lancet Neurol.2006;5(2):158-170.
2. Bourre B, Clerc C, Blanc F, et al. Clinical and ParaclinicalParameters Associated With Brain Atrophy In Newly DiagnosedMS Patients. Neurology. 2014;82:S13.004.
3. Azevedo C, Overton E, Khadka S, et al. Thalamic Atrophy inRIS: MRI Evidence of Early CNS Neurodegeneration. Neurology.2014;82:S13.002.
4. Pittock SJ. NMO and the evolving spectrum of aquaporin-4autoimmunity. AAN 2014. C139: Neuromyelitis optica: scientificand clinical update.
5. Wingerchuk D, Lennon V, Lucchinetti C, Pittock S,Weinshenker B. The spectrum of neuromyelitis optica. LancetNeurol. 2007;6:805-815.
6. Waters PJ, McKeon A, Leite M, et al. Serologic diagnosis ofNMO. A multicenter comparison of aquaporin-4-IgG assays.Neurology. 2012;78:665-671.
7. Wingerchuk D. A practical guide to the treatment of NMOspectrum disorders. AAN 2014. C139: Neuromyelitis optica:scientific and clinical update.
8. Klein R, Burton J. The Gender Divide in Multiple Sclerosis: AReview of the Environmental Factors Influencing the Increasing
Prevalence of Multiple Sclerosis in Women. Neurology.2014;82(10S):P4.024.
9. Hernán MA, Olek MJ, Ascherio A. Cigarette smoking andincidence of multiple sclerosis. Am J Epidemiol.2001;154(1):69-74.
10. Palacios N, Alonso A, Brønnum-Hansen H, Ascherio A.Smoking and increased risk of multiple sclerosis: parallel trendsin the sex ratio reinforce the evidence. Ann Epidemiol.2011;21(7):536-542.
11. Kleinewietfeld M, Manzel A, Titze J, et al. Sodium chloridedrives autoimmune disease by the induction of pathogenicTh17 cells. Nature. 2013;496:518-522.
12. Farez M, Fiol M, Gaitan M, Quintana F, Correale J. Sodiumintake is associated with increased disease activity in multiplesclerosis. Neurology. 2014;82(10S):P6.150.
13. Doty R, Tourbier I, Leon-Sarmiento F, et al. Gustatorydysfunction in multiple sclerosis. Neurology.2014;82(10S):P6.159.
14. Linker R, Kleinewietfeld M, Lee DH, Muller D, Manzel A.Dietary saturated fatty acids promote differentiation of Th1 andTh17 cells and aggravate neuroinflammation. Neurology.2014;82(10S):P6.149.
References

REFERENCES 39
15. Yadav V, Marracci G, Kim E, et al. Effects of a low fat plantbased diet on multiple sclerosis (MS): results of a 1-year longrandomized controlled (RC) study. Neurology.2014;82(10S):P6.152.
16. Berer K, Mues M, Koutrolos M, et al. Commensal microbiotaand myelin autoantigen cooperate to trigger autoimmunedemyelination. Nature. 2011;479(7374):538-541.
17. Scher JU, Sczesnak A, Longman RS, et al. Expansion ofintestinal Prevotella copri correlates with enhancedsusceptibility to arthritis. Elife. 2013;2:e01202.
18. Machiels K, Joossens M, Sabino J, et al. A decrease of thebutyrate-producing species Roseburia hominis andFaecalibacterium prausnitzii defines dysbiosis in patients withulcerative colitis. Gut. 2013. doi: 10.1136/gutjnl-2013-304833.[Epub ahead of print]
19. Bach JF. The effect of infections on susceptibility toautoimmune and allergic diseases. N Engl J Med.2002;347(12):911-920.
20. Jhangi S, Gandhi R, Glanz B, et al. Increased Archaea Speciesand Changes with Therapy in Gut Microbiome of MultipleSclerosis Subjects. Neurology. 2014;82:S24.001.
21. Furusawa Y, Obata Y, Fukuda S, Endo TA, et al. Commensalmicrobe-derived butyrate induces the differentiation of colonicregulatory T cells. Nature. 2013;504(7480):446-450.
22. Fleming J, Hartman L, Maksimovic J, et al. Clinical Trial ofHelminth-induced Immunomodulatory Therapy (HINT 2) inRelapsing-Remitting Multiple Sclerosis. Neurology.2014;82:P3.149.
23. Garg SK, Croft AM, Bager P. Helminth therapy (worms) forinduction of remission in inflammatory bowel disease. CochraneDatabase Syst Rev. 2014 Jan 20;1:CD009400.
24. Bager P1, Arnved J, Rønborg S, et al. Trichuris suis ovatherapy for allergic rhinitis: a randomized, double-blind,placebo-controlled clinical trial. J Allergy Clin Immunol.2010;125(1):123-130.
25. Marshall G. The Vaccine Handbook: a Practical Guide forClinicians. Professional Communications, Inc; 2010.
26. Langer-Gould A, Chen L, Tartof S, Chao C, Tseng HF. Vaccinesand the risk of multiple sclerosis and other CNS demyelinatingdiseases. Neurology. 2014;82(10S):S34.005.
27. Handel A, Williamson A, Disanto G, Dobson R, Giovannoni G,Ramagopalan S. Smoking and multiple sclerosis: an updatedmeta-analysis. PLoS One. 2011;6:e16149.
28. Kavak K, Teter B, Weinstock-Guttman B. Smoking in multiplesclerosis patients is negatively associated with patientperceived psychosocial factors. Neurology. 2014;82(10S):P6.177.
29. Constantinescu C. Manouchehrinia A, Tanasescu R, Britton J.Smoking cessation and disability progression in multiple
sclerosis: an observational cohort study. Neurology.2014;82(10S):P6.141.
30. Correale J, Balbuena Aguirre ME, Farez M. Body Mass Indexand Multiple Sclerosis Risk. The Role of Leptin. Neurology.2014;82:S24.004.
31. Gauthier SA, Glanz BI, Mandel M, Weiner HL. A model for thecomprehensive investigation of a chronic autoimmune disease:the multiple sclerosis CLIMB study. Autoimmun Rev.2006;5(8):532-536.
32. Bove R, Healy B, Musallam A, Alsharif N, Glanz B, Chitnis T.Menopause In A Longitudinal Clinical Cohort Of Women WithMultiple Sclerosis. Neurology. 2014; 82:P4.163.
33. Berriosmorales I, Saipetch C, Turetsky A, Kane K, Garg N,Riskind P. Metabolic syndrome and disability in multiplesclerosis: a retrospective study. Neurology. 2014;82(10S):P6.168.
34. Wilcox J, Tabby D, Majeed MH, Youngman B. Headache inmultiple sclerosis: features and implications for diseasemanagement. Neurology. 2014;82(10S):P6.163.
35. Barone D, Khelemsky S, Hercules D, Barone K. Prevalence ofthyroid disease in a multiple sclerosis clinic cohort. Neurology.2014;82(10S):P6.170.
36. Winder K, Engelhorn T, Wagner I, et al. Deterioration orImprovement of Depression in Women Is Associated with Siteand Size of Multiple Sclerosis Lesions. Neurology.2014;82:P6.174.
37. Schmitt M, Maes J. Diagnostica. 2000;46:38-46.
38. Mohr DC, Epstein L, Luks TL, et al. Brain lesion volume andneuropsychological function predict efficacy of treatment fordepression in multiple sclerosis. J Consult Clin Psychol.2003;71(6):1017-1024.
39. Sormani MP, Bonzano L, Roccatagliata L, Cutter GR, MancardiGL, Bruzzi P. Magnetic resonance imaging as a potentialsurrogate for relapses in multiple sclerosis: a meta-analyticapproach. Ann Neurol. 2009;65(3):268-275.
40. Richert N, Forrestal F, Lee S, Duda P. Do MRI Lesions PredictMS Relapses? Neurology. 2014 82:P3.190.
41. Traboulsee A, Li D, Zhao Y, et al. Subcutaneous interferonβ-1a decreases the evolution of gadolinium-enhancing lesionsinto chronic black holes in relapsing multiple sclerosis.Neurology. 2014;82(10S):P7.240.
42. PRISMS Study Group. Randomised double-blindplacebo-controlled study of interferon β-1a inrelapsing/remitting multiple sclerosis. Lancet.1998;352:1498-1504.
43. Calabresi P, Bieseier B, Arnold D, et al. Pegylated interferonbeta-1a for relapsing –remitting multiple sclerosis (ADVANCE): arandomized, phase 3, double-blind study. Lancet Neurol. May2014. [Epub ahead of print]
UpdatesinMS

40 REFERENCES
44. Deykin A, Arnold D, Hung S, et al. Interim analysis of 2-yearclinical efficacy and safety of peginterferon beta-1a in patientswith relapsing-remitting multiple sclerosis: data from thepivotal phase 3 ADVANCE study. Neurology.2014;82(10S):S4.005.
45. Kieseier B, Scott T, Newsome S, et al. Peginterferon beta-1amay improve recovery following relapses: data from the pivotalphase 3 ADVANCE study in patients with relapsing-remittingmultiple sclerosis. Neurology. 2014;82(10S):S4.003 and PI7.002.
46. Arnold D, Kieseier B, Sheikh S, et al. Peginterferon beta-1asignificantly increases the proportion of patients with freedomfrom measured disease activity in relapsing-remitting multiplesclerosis: findings from the ADVANCE study. Neurology.2014;82(10S):S4.007.
47. Copaxone Prescribing Information.http://www.accessdata.fda.gov/drugsatfda_docs/label/2014/020622s089lbl.pdf. Accessed May 2014.
48. Khan O, Rieckmann P. Boyko A, Slemaj K, Zivadinov R for theGALA study group. Three times weekly glatiramer acetate inrelapsing-remitting multiple sclerosis. Ann Neurol.2013;73:705-703.
49. Khan O, Rieckmann P, Boyko A, Selmaj K, Barkay H, KolodnyS, Zivadinov R. 24-month efficacy and safety of glatirameracetate 40mg/1 mL 3-times weekly: open-label extension studyof the GALA trial in subjects with relapsing-remitting multiplesclerosis. Neurology. 2014;82(10S):S31.003.
50. Wolinsky J, Borresen T, Dietrich D, et al. GLACIER: anopen-label, randomized, multicenter study to assess safety andtolerability of glatiramer acetate 40 mg/1 mL 3-times weeklyversus 20 mg/1 mL daily in patients with relapsing-remittingmultiple sclerosis. Neurology. 2014;82(10S):S31.002.
51. Confavreux C, Hutchinson M, Hours MM,Cortinovis-Tourniaire P, Moreau T. Rate of pregnancy-relatedrelapse in multiple sclerosis. Pregnancy in Multiple SclerosisGroup. N Engl J Med. 1998;339(5):285-291.
52. Spence RD, Voskuhl RR. Neuroprotective effects of estrogensand androgens in CNS inflammation and neurodegeneration.Front Neuroendocrinol. 2012;33(1):105-115.
53. Sicotte NL, Liva SM, Klutch R, et al. Treatment of multiplesclerosis with the pregnancy hormone estriol. Ann Neurol.2002;52(4):421-428.
54. Voskuhl R. A Combination Trial of Estriol Plus GlatimerAcetate in Relapsing-Remitting Multiple Sclerosis. Neurology.2014;82(10S):S23.003.
55. ClinicalTrials.gov Identifier: NCT00451204. Accessed May2014.
56. Wraith D, Streeter H, Rigden R, et al. Preclinical Efficacy andPhase I Clinical Testing of ATX-MS1467, an Antigen-Specific
Immunotherapy for Multiple Sclerosis. Neurology.2014;82:P1.189.
57. Rotstein D, Healy B, Malik M, et al. Differential effects ofvitamin D in GA- versus IFN-treated MS patients. Neurology.2014;82(10S):S24.005 and I7.004.
58. Polman C. O’Connor P, Havrdova E, et al. A randomized,placebo-controlled trial of natalizumab for relapsing multiplesclerosis. N Engl J Med. 2006;354:899-910.
59. Rudick R, Hutchinson M, Havrdova E, You X, Cadavid D,Belachew S. Natalizumab treatment improves walking speed inMS patients: a post hoc analysis of AFFIRM. Neurology.2014;82(10S):S24.006.
60. Rudick R, Stuart W, Calabresi P, et al. Natalizumab plusinterferon beta-1a for relapsing multiple sclerosis. N Engl J Med.2006;354:911-923.
61. Bloomgrern G, Richman S, Hotermans C, et al. Risk ofnatalizumab-associated progressive multifocalleukoencephalopathy. N Engl J Med. 2012;366:1870-1880.
62. Fox R, Cree B, De Seze J, et al. MS disease activity inRESTORE. A randomized 24-week natalizumab treatmentinterruption study. Neurology. 2014;82:1491-1498.
63. Clerico M, De Mercanit S, Piazza F, et al. Natalizumab therapyhow to treat how to stop: the TY-STOP study. Neurology.2014;82(10S):P7.216.
64. Capobianco M, Di Sapio A, Malucchi S, et al. Fingolimod isnot able to inhibit multiple sclerosis disease reactivation afternatalizumab discontinuation. Neurology. 2014;82(10S):P7.206.
65. Cohen M, Maillart E, Tourbah A, et al. Switching fromnatalizumab to fingolimod in multiple sclerosis. A Frenchprospective study. JAMA Neurol. February 2014 [Epub ahead ofprint].
66. Cohen J, Coles A, Arnold D, et al. Alemtuzumab versusinterferon beta-1a as first-line treatment for patients withrelapsing-remitting multiple sclerosis: a randomized controlledphase 3 trial. Lancet. 2012;380:1819-1828.
67. Coles A, Twyman C, Arnold D, et al. Alemtuzumab forpatients with relapsing multiple sclerosis afterdisease-modifying therapy: a randomized controlled phase 3trial. Lancet. 2012;380:11829-1839.
68. Arnold D, Fisher E, Cohen J, et al. Alemtuzumab improvesbrain MRI outcomes in patients with active relapsing-remittingmultiple sclerosis: three-year follow-up of the CARE-MS studies.Neurology. 2014;82(10S):S65.008.
69. Cuker A, Palmer J, Oyuela P, Margolin D, Bass A. Successfuldetection and management of immune thrombocytopenia inalemtuzumab-treated patients with active relapsing-remittingmultiple sclerosis. Neurology. 2014;82(10S):P2.198.

REFERENCES 41
70. Hunter S, Hunter H, Kantor D. Positive response toalemtuzumab (ALE) rescue immunotherapy in a high disability,treatment refractory MS cohort. Neurology. 2014;82(10S):P7.224.
71. Graves J, Balcer L, Palmer J, Margolin D, Galetta S.Alemtuzumab improves visual outcomes vs. subcutaneousinterferon beta-1a in patients with relapsing-remitting multiplesclerosis who relapsed on prior therapy: analysis from theCARE-MS II study. Neurology. 2014;82(10S):P3.158.
72. Sorensen P, Lisby S, Grove R, et al. Safety and efficacy ofofatumumab in relapsing-remitting multiple sclerosis. A phase2 study. Neurology. 2014;82:573-581.
73. Bar-Or A, Grove R, Austin D, et al. The MIRROR study: arandomized, double-blind, placebo-controlled, parallel-group,dose-ranging study to investigate the safety and MRI efficacy ofsubcutaneous ofatumumab in subjects withrelapsing-remitting multiple sclerosis (RRMS). Neurology.2014;82(10S):S23.006 and I7.007.
74. Austin D, Freedman I, Grove R, Tolson J, VanMeter S. Therelationship between peripheral B-cell levels and MRI diseaseactivity in relapsing remitting multiple sclerosis. Neurology.2014;82(10S):S65.009.
75. Gold R, Giovannoni G, Selmaj K, et al; SELECT studyinvestigators. Daclizumab high-yield process inrelapsing-remitting multiple sclerosis (SELECT): a randomised,double-blind, placebo-controlled trial. Lancet. 2013;381(9884):2167-2175.
76. Giovannoni G, Gold R, Selmaj K, et al; SELECTION StudyInvestigators. Daclizumab high-yield process inrelapsing-remitting multiple sclerosis (SELECTION): amulticentre, randomised, double-blind extension trial. LancetNeurol. 2014;13(5):472-481.
77. Radue EW, Havrdova E, McNeill M, Riester K, Elkins J.Decrease in T1 Black Hole Volume Over 2 Years of DaclizumabHigh-Yield Process Treatment. Neurology. 2014;82:P3.188.
78. Mitoxantrone.http://www.accessdata.fda.gov/scripts/cder/drugsatfda/index.cfm. Accessed May 2014.
79. Perrone C, Beretich B, DiIulio M, Riskind P, Ionete C. Aretrospective analysis of rituximab therapy insecondary-progressive MS. Neurology. 2014;82(10S):P7.228.
80. GILENYA Prescribing Information. 2012.http://www.accessdata.fda.gov. Accessed May 2014.
81. Christodoulou C, Krupp LB, Liang Z, et al. Cognitiveperformance and MR markers of cerebral injury in cognitivelyimpaired MS patients. Neurology. 2003;60(11):1793-1798.
82. Amato MP, Hakiki B, Goretti B, et al. Association of MRImetrics and cognitive impairment in radiologically isolatedsyndromes. Neurology. 2012;78(5):309-314.
83. Hedman AM, van Haren NE, Schnack HG, Kahn RS, HulshoffPol HE. Human brain changes across the life span: a review of 56longitudinal magnetic resonance imaging studies. Hum BrainMapp. 2012;33(8):1987-2002.
84. De Stefano N, Tomic D, Haering D, et al. Proportion ofpatients with brain volume loss comparable to healthy adults infingolimod phase 3 multiple sclerosis studies. Neurology.2014;82(10S):S13.006.
85. Radue EW, Sprenger T, Chin P, Meier DP, Sfikas N, Barkhof N.Consistent Reduction in the Annualized Rate of Brain VolumeLoss Across Phase 3 Core and Extension Trials of Fingolimod inRelapsing Multiple Sclerosis (P3.180) Neurology. 2014;82(10Suppl): P3.180.
86. Jeffery D, Radue EW, Karlsson G, Zheng H, von Rosenstiel P,Kappos L. Efficacy Benefits of Fingolimod 0.5 mg Once-daily inPatients Previously Treated with Glatiramer Acetate: PooledAnalysis of the Phase 3, Placebo-controlled FREEDOMS andFREEDOMS II Studies in Relapsing Multiple Sclerosis. Neurology.2014;82(10 Suppl): P3.193.
87. Pacher P, Kecskemeti V. Cardiovascular side effects of newantidepressants and antipsychotics: new drugs, old concerns?Curr Pharm Des. 2004;10(20):2463-2475.
88. Funk KA, Bostwick JR. A comparison of the risk of QTprolongation among SSRIs. Ann Pharmacother.2013;47(10):1330-1341.
89. Bermel R, Hashmonay R, Meng X, et al. FingolimodFirst-Dose Effects In Patients With Relapsing-Remitting MultipleSclerosis Concomitantly Treated With Serotonin-SpecificReuptake Inhibitors. Neurology. 2014; 82:P7.233.
90. Citalopram Prescribing Information. 2014.http://www.accessdata.fda.gov. Accessed May 2014.
91. Calabresi PA, Radue EW, Goodin D, et al. Safety and efficacyof fingolimod in patients with relapsing-remitting multiplesclerosis (FREEDOMS II): a double-blind, randomised,placebo-controlled, phase 3 trial. Lancet Neurol. 2014 Mar 28.pii: S1474-4422(14)70049-3. doi:10.1016/S1474-4422(14)70049-3. [Epub ahead of print]
92. Langer-Gould A, Brara SM, Beaber BE, Zhang JL. Incidence ofmultiple sclerosis in multiple racial and ethnic groups.Neurology. 2013;80(19):1734-1739.
93. Klineova S, Nicholas J, Walker A. Response todisease-modifying therapies in African Americans with multiplesclerosis. Ethn Dis. 2012;22(2):221-225.
94. Coyle P, Cree B, Cabre P, et al. Fingolimod Efficacy and Safetyin an African-American Patient Subgroup from FREEDOMS II.Neurology. 2014; 82:P3.156.
95. Exploring the Efficacy and Safety of Siponimod in PatientsWith Secondary Progressive Multiple Sclerosis (EXPAND).ClinicalTrials.gov Identifier: NCT01665144. Accessed May 2014.
UpdatesinMS

42 REFERENCES
96. Selmaj K, Li DK, Hartung HP, et al. Siponimod for patientswith relapsing-remitting multiple sclerosis (BOLD): an adaptive,dose-ranging, randomised, phase 2 study. Lancet Neurol.2013;12(8):756-767.
97. Kappos L, Stuve O, Hartung H, et al. Safety and Efficacy ofSiponimod (BAF312) in Patients with Relapsing-remittingMultiple Sclerosis: Results from Dose-blinded Extension Phaseof BOLD Study. Neurology. 2014;82:P3.151.
98. Zipp F, T.L. Vollmer, K.W. Selmaj, A. Bar-Or on behalf of theDreaMS Study Group. Efficacy and safety of the S1P receptoragonist ONO-4641 in patients with relapsing-remitting multiplesclerosis: results of a 26-week, double-blind, placebo-controlled, phase II trial (DreaMS). Mult Scler J. 2012;18(Suppl.4):199 [P482].
99. Bar-Or A, Zipp F, Scaramozza M, et al. Ceralifimod(ONO-4641), a Sphingosine-1-Phosphate Receptor-1 and -5Agonist, on Magnetic Resonance Imaging Outcomes in Patientswith Multiple Sclerosis: Interim Results from the Extension ofthe DreaMS Study. Neurology. 2014;82:P3.161.
100. Huang S, Choi JK, Gray A, et al. ONO-4641 (Ceralifimod)Reduces MRI Lesions and Prevents Disease Progression in anAnimal Model of Multiple Sclerosis. Neurology. 2014;82:P1.219.
101. Teriflunomide. [email protected]://www.accessdata.fda.gov/drugsatfda_docs/label/2012/202992s000lbl.pdf. Accessed May 2014.
102. Miller A, Wolinsky J, Kappos L, et al. TOPIC: efficacy andsafety of once-daily oral teriflunomide in patients with firstepisode consistent with multiple sclerosis. Neurology.2014;82(10S):PL2.002.
103. Jacobs LD, Beck RW, Simon JH, et al. Intramuscularinterferon beta-1a therapy initiated during a first demyelinatingevent in multiple sclerosis. CHAMPS Study Group. N Engl J Med.2000;343:898-904.
104. Comi G, Filippi M, Barkhof F, et al. Effect of early interferontreatment on conversion to definite multiple sclerosis: arandomised study. Lancet. 2001;357:1576-1582.
105. Kappos L, Polman CH, Freedman MS, et al. Treatment withinterferon beta-1b delays conversion to clinically definite andMcDonald MS in patients with clinically isolated syndromes.Neurology. 2006;67:1242-1249.
106. Comi G, Martinelli V, Rodegher M, et al. Effect of glatirameracetate on conversion to clinically definite multiple sclerosis inpatients with clinically isolated syndrome (PreCISe study): arandomized, double-blind, placebo-controlled trial. Lancet.2009;374:1503-1511.
107. Comi G, Martinelli V, Rodegher M et al. Effects of earlytreatment with glatiramer acetate in patients with clinicallyisolated syndrome. Mult Scler. 2013;19:1074-1083.
108. Leist T, Freedman M, Benamor M, Truffinet P, Dukovic D,Comi G. Pooled safety data from four placebo-controlledteriflunomide studies. Neurology. 2014;82(10S):P2.203.
109. Singer B, Comi G, Miller A, Freedman M, Benamor M,Truffinet P. Teriflunomide treatment is not associated withincreased risk of infections: pooled data from the teriflunomidedevelopment program. Neurology. 2014;82(10S):P2.194.
110. Henson LJ, Benamor M, Truffinet P, Kieseier B. Updatedpregnancy outcomes in patients and partners of patients in theteriflunomide clinical trial program. Neurology.2014;82(10S):P4.161.
111. Salmen A, Gold R. Mode of action and clinical studies withfumarates in multiple sclerosis. Exp Neurol. 2014 Feb 22. pii:S0014-4886(14)00060-0. doi: 10.1016/j.expneurol.2014.02.015.[Epub ahead of print]
112. DMF (Tecfidera) Prescribing Information.http://www.accessdata.fda.gov. Accessed May 2014.
113. Scannevin RH, Chollate S, Jung MY, et al. Fumaratespromote cytoprotection of central nervous system cells againstoxidative stress via the nuclear factor (erythroid-derived 2)-like2 pathway. J Pharmacol Exp Ther. 2012;341(1):274-284.
114. Takaya K, Suzuki T, Motohashi H, et al. Validation of themultiple sensor mechanism of the Keap1-Nrf2 system. FreeRadic Biol Med. 2012;53(4):817-827.
115. Havrdova E, Hutchinson M, Kurukulasuriya NC, et al. OralBG-12 (dimethyl fumarate) for relapsing-remitting multiplesclerosis: a review of DEFINE and CONFIRM. Expert OpinPharmacother. 2013;14(15):2145-2156.
116. Tornatore C, Amjad F. Attenuation Of DimethylFumarate-Related Gastrointestinal Symptoms WithMontelukast. Neurology. 2014;82:P7.251.
117. Gold R, Kappos L, Arnold DL, et al; DEFINE StudyInvestigators. Placebo-controlled phase 3 study of oral BG-12for relapsing multiple sclerosis. N Engl J Med.2012;367(12):1098-1107.
118. Fox RJ, Miller DH, Phillips JT, et al; CONFIRM StudyInvestigators. Placebo-controlled phase 3 study of oral BG-12 orglatiramer in multiple sclerosis. N Engl J Med.2012;367(12):1087-1097.
119. Havrdova E, Gold R, Fox R, et al. Effect of Delayed-ReleaseDimethyl Fumarate on Freedom from Measured Clinical andNeuroradiological Disease Activity in Relapsing-RemittingMultiple Sclerosis (RRMS) Patients: An Integrated Analysis ofDEFINE and CONFIRM. Neurology. 2014;82:P3.159.
120. Gold R, Phillips JT, Havrdova E, et al. Delayed-ReleaseDimethyl Fumarate and Pregnancy: Preclinical Studies andPregnancy Outcomes Reported During the ClinicalDevelopment Program. Neurology. 2014;82(10S):S24.006.

REFERENCES 43
121. García-Enguídanos A, Calle ME, Valero J, Luna S,Domínguez-Rojas V. Risk factors in miscarriage: a review. Eur JObstet Gynecol Reprod Biol. 2002;102(2):111-119.
122. Viglietta V. Safety and Tolerability of Delayed-ReleaseDimethyl Fumarate Administered as Add-On Therapy to BetaInterferons or Glatiramer Acetate in Relapsing-RemittingMultiple Sclerosis (RRMS) Patients. Neurology.2014;82(10S):S24.002.
123. ClinicalTrials.gov Identifier: NCT01156311. Accessed May2014.
124. Haggiag S, Ruggieri S, Gasperini C. Efficacy and safety oflaquinimod in multiple sclerosis: current status. Ther Adv NeurolDisord. 2013;6(6):343-352.
125. Comi G, Sormani MP, Giovannoni G, et al. Rationale foradvancing laquinimod for progressive MS: evidence from largeclinical trials in RRMS. Neurology. 2014;82(10S):S4.001.
126. Comi G, Jeffery D, Kappos L, et al; ALLEGRO Study Group.Placebo-controlled trial of oral laquinimod for multiplesclerosis. N Engl J Med. 2012;366(11):1000-1009.
127. Vollmer TL, Sorensen PS, Selmaj K, et al; BRAVO StudyGroup. A randomized placebo-controlled phase III trial of orallaquinimod for multiple sclerosis. J Neurol. 2014;261(4):773-783.
128. Filippi M, Rocca MA, Pagani E, et al; on behalf of theALLEGRO Study Group. Placebo-controlled trial of orallaquinimod in multiple sclerosis: MRI evidence of an effect onbrain tissue damage. J Neurol Neurosurg Psychiatry. 2013 Sep 12.doi: 10.1136/jnnp-2013-306132. [Epub ahead of print]
129. Sormani MP, Bonzano L, Roccatagliata L, Mancardi GL,Uccelli A, Bruzzi P. Surrogate endpoints for EDSS worsening inmultiple sclerosis. A meta-analytic approach. Neurology.2010;75(4):302-309.
130. Zilkha-Falb R, Gurevich M, Nisimov LH, Achiron A.Treatment Mechanisms of Action Laquinimod Modulates GenesEncoding Cell Migration in Multiple Sclerosis. Neurology.2014;82:P1.203.
131. Birnbaum G. Stopping disease-modifying therapy inprogressive multiple sclerosis–a prospective study. Neurology.2014;82(10S):P7.207.
132. Barak Y, Magalashvili D, Dolgopiat MD, et al. Effect ofAlfacalcidol on Fatigue in MS Patients: A Randomized,Double-Blind Study. Neurology. 2014;82:S23.004.
133. Achiron A, Barak Y, Miron S, Izhak Y, Faibel M, Edelstein S.Alfacalcidol treatment in multiple sclerosis. ClinNeuropharmacol. 2003;26(2):53.
134. Achiron A, Feldman A, Gurevich M. Characterization ofmultiple sclerosis traits: nuclear receptors (NR) impairedapoptosis pathway and the role of 1-α 25-dihydroxyvitamin D3.J Neurol Sci. 2011;311(1-2):9-14.
135. Sandroff B, Klaren R, Pilutti L, Dlugonski D, Benedict R, MotlR. Randomized controlled trial of physical activity, cognition,and walking in multiple sclerosis. J Neurol. 2014;261:363-372.
136. Briken S, Gold S, Patra S, et al. Effects of exercise on fitnessand cognition in progressive MS: a randomized, controlled pilottrial. Mult Scler J. 2014;20:382-390.
137. Mandelbaum R. Triche E, Fasoli S, Lo A. The effects of salsadance on gait and balance in multiple sclerosis. Neurology.2014;82(10S):P3.053.
138. Mark V. Randomized Controlled Trial of CI Therapy forProgressive MS: Increased Real-World Function andNeuroplasticity on MRI. Neurology. 2014;82(10S):S23.007.
139. Gauthier LV, Taub E, Perkins C, Ortmann M, Mark VW,Uswatte G. Remodeling the brain: plastic structural brainchanges produced by different motor therapies after stroke.Stroke. 2008;39(5):1520-1525.
UpdatesinMS

44 UPDATES IN MS
Notes

www.cmeAIMS.org
10 Vista Drive, Suite 100Old Lyme, CT 06371