Embed Size (px)
Citation preview
1
SUPPLY CHAINS AND FIRMS’ INTERNATIONALIZATION1
GIORGIA GIOVANNETTI*†
, ENRICO MARVASI*, MARCO SANFILIPPO
†
*Department of Economics, University of Florence
†Global Governance Programme, European University Institute.
We explore the relevance of supply chains participation on firms’
probability to internationalize. Besides controlling for traditional
forms of inter-firm cooperation, we study whether the involvement
in supply chains increases the ability of smaller and less
productive firms to join international markets. Our findings show
that firms integrated into a supply chain generally perform better
and are more likely to access the foreign market. Belonging to a
supply chain is particularly helpful for small and medium size
firms. Moreover, the effect of the supply chain on the probability of
exporting is bigger for small and medium size suppliers than for
final-good producers. (JEL F12, F14, F21)
I. INTRODUCTION
Heterogeneous firms’ models have attracted the attention on the fact that engaging into
international activities is uncommon and confined to a small group of larger and more productive
firms (Melitz, 2003; Bernard et al., 2007; Melitz and Redding, 2013). Recent theoretical models
have focused on firms’ self-selection into foreign markets, highlighting entry cost supported by
firms with (exogenously drawn) heterogeneous productivity. The resulting self-selection,
together with an imperfectly competitive market structure (usually monopolistic competition),
allows successful firms to expand into larger markets. Surviving domestic firms are instead
confined to the home market, because of their lower initial productivity, which makes
internationalization costs unaffordable. Hence, exporting (international) firms tend to be larger,
more productive and generally perform better according to a number of indicators. A vast
1 Preliminary version not to be quoted without authors’ permission.

2
empirical literature (see Wagner, 2012 for a recent review) confirms these predictions for
different countries and groups of countries. Despite the fact that only the “happy few” participate
to international markets, increasing the number of international firms is considered crucial to
improve a country’s economic performance (Mayer and Ottaviano, 2007). For this reason,
exploring the factors contributing to firms internationalization, including in particular that of
small and medium enterprises (SMEs), is worthwhile and has potentially important policy
implications. The reduction of trade barriers and the diffusion of new technologies have recently
enhanced the role of SMEs in international markets (OECD, 2012). Nevertheless, the literature
on the internationalization of SMEs is still relatively underdeveloped compared to the one on
larger firms (Wagner, 2007). Evidence is mostly focusing on the factors that may hamper
internationalization, including the role of family ownership or lack of human capital and poor
access to credit, rather than on those that enhance firms’ capacity to internationalize, including
for instance innovation and networking (Higón Añón and Driffield, 2011; OECD, 2012; Cerrato
and Piva, 2012; Bricongne et al., 2012). A new strand of literature emphasizing international
fragmentation of production and the subsequent move to heterogeneous specialization in trading
“tasks” rather than goods is likely to be more relevant to understand smaller firms
internationalization patterns (Grossman and Rossi-Hansberg, 2008). Against this background,
firms find new ways to internationalize, including greater specialization, involvement in
importing activities and participation to global supply chains (Castellani et al., 2010; Baldwin
and Lopez-Gonzales, 2013). Participation to supply chains, in particular, can guarantee greater
efficiency to firms involved, generated by the many external economies arising from linkages
along the chain, as well as opportunities to upgrading in a number of different ways, including
through exports and innovation (Humprey and Schimtz, 2002; Gereffi, 1999; Agostino et al.,

3
2011). This paper aims at linking these two strands of the literature, focusing on the impact of
participation to local and international supply chains on firms probability to internationalize.
More precisely, this paper analyses the role of supply chains in determining firms’
internationalization strategies in general and SMEs’ more specifically. To this aim, we take
advantage of a new dataset based on the results of a survey by MET on 25,090 Italian firms, a
large share of which are SMEs. The 2011 wave of the MET survey puts a specific focus on the
involvement of firms in networks and in production chains.
Our main findings indicate that belonging to a supply chain, is particularly helpful for SMEs.
Furthermore, the positive effect of the supply chain is higher when the firm is a “supplier” rather
than purely a final-good producer. For larger firms, on the contrary, supply chain has a positive
effect on the probability of exporting if they are final-good producers.
The remaining of the paper is organized as follows. Section 2 briefly reviews the literature on the
supply chains, with a focus on small and medium firms. Section 3 presents the data and
descriptive statistics. Section 4 analyzes the link between export and productivity. Section 5
contains the econometric analysis. Section 6 focuses on the differences between SMEs and large
firms. Section 7 further investigates whether belonging to a supply chain affects differently, and
if so to what extent, suppliers and final-good producers. Section 8 concludes.
II. FIRMS IN SUPPLY CHAINS
The empirical evidence is increasingly pointing out that participation to supply chains, opening
new niches for products and services, can enhance SMEs engagement in international trade,
allowing them to overcome some barriers to internationalization (OECD, 2012). Involvement in
supply chains implies a complex set of relationships among firms, and the active participation of

4
supplier to the (international) production process. The sole fact of being part of a supply chain,
however, does not guarantee a better performance, since this depends on other factors too,
including for instance the governance model of the supply chain and the characteristic of the
firms involved. Under some conditions, however, an active involvement in supply chains allows
firms to carry out functions better fitting their abilities, benefiting from intensive specialization
and the exploitation of external linkages, which include access to high managerial capabilities,
technical knowledge, innovation and exports (Agostino et al., 2011; OECD, 2006). SMEs play
already an important role within supply chains, especially as subcontractors and suppliers of
intermediate goods. These mechanisms have important implications for countries, with a
substantial share of SMEs and many barriers constraining their participation to international
activities (Minetti and Chun Zhu, 2011; Basile et al., 2005). Against this background, Italy
represents an interesting benchmark for our analysis. On the one hand, SMEs are the bulk of both
the productive structure and employment and contribute to the overall export performance,
especially when compared with other major European countries (Navaretti et al., 2011). On the
other hand, due to its sectoral specialisation and industrial structure, Italy is characterised by an
high division of labour among firms, many of which (and especially SMEs) works mostly as
specialised suppliers for other firms. Furthermore, to reduce concerns over their size, access to
credit, innovation and exports Italian SMEs have often engaged in formal and informal
networking at the local level (Giovannetti et al., 2013). A successful form of networking for
Italian SMEs have been Industrial districts (clusters), an effective form of cooperation among
sectorally specialized firms, allowing them to reach collective efficiency and superior
performance vis à vis non clustered firms (Becattini, 1990; Brusco and Paba, 1997; Di Giacinto
et al. 2012), as well as contributing to support their international projection (Becchetti et al.,

5
2010; Becchetti and Rossi, 2000). This literature on districts, to our knowledge, has not been
linked to that on supply chains and works on the effects on firm’s performance and
internationalization of supply chain participation for Italy is very recent and limited. Accetturo et
al. (2011) and Agostino et al. (2011), using different samples of Italian firms and proxing the
participation to the global supply chain with the generic status of supplier of intermediate goods,
show that participation to global supply chains increases firms’ productivity and performance,
especially when they are able to upgrade. In this paper, we rely on a direct measure of firms’
integration into supply chains. Our definitions follow the information available in the survey,
where a supply chain is defined as a “continuative involvement of the firm in the production
process of a specific good, provided that this activity constitutes the majority of firm’s revenue”.
Although we do not have direct information on firms’ position within the supply chain, we are
able to approximate it with the type of goods representing the largest share of their turnover. The
information on the supply chain is confined to the organization of the production process and is
independent from other firms’ network relationships. Our database includes separate information
on firms’ “relevant and continuative relationships with other firms and institutions,” either at the
local, national or international level. Combining the above definitions on supply chain and
network, we are able to summarize the characteristics for 8 different types of firms, as showed in
TABLE 1. Such classification allows us to clearly distinguish between networks of firms whose
production process is integrated into a supply chain and networks of firms not belonging to a
supply chain. Firms that do not belong to any network but belong to a supply chain are
specialized in the production of a specific good, but do not entertain any stable relationships with
other firms or institutions; we label such firms as “unstable supply chain”. Finally, firms that are

6
neither into a supply chain nor belong to a network are labeled as “independent or isolated
firms.”2 Firms distribution across the 8 types of firms is reported in TABLE 2.
III. DATA AND DESCRIPTIVE STATISTICS
Our main source of information is the MET 2011 survey, including 25,090 Italian firms in the
manufacturing sector and services. The survey covers information for the last three years and
includes a large number of questions about employment, inputs, sales, investments,
internationalization and innovation. We have merged and matched the MET survey data with
balance sheet information from AIDA, a database published by the Bureau van Dijk and
collecting the financial information of Italian firms, and with the ICE-Reprint database,
containing information on FDI operations during the same period. The final dataset, for which
the matching procedure was completed successfully, contains 7,590 firms. A detailed description
of the dataset is provided in the appendix. In the following, we proxy productivity with total
factor productivity (TFP), as standard in the literature on heterogeneous firms (Helpman et al.,
2004; Melitz, 2003) and on the foreign performance of MNEs (Benfratello and Sembenelli,
2006; Criscuolo and Martin, 2009). The TFP estimation is generally based on the Solow
residuals from an econometric specification derived from a Cobb-Douglas production function.
This measure of the TFP, strictly related to the economic theory and rooted on clear assumptions,
triggers a number of empirical issues, mainly due to the endogeneity of the observed data (del
Gatto et al., 2011; van Beveren, 2012). As a robustness check, we estimate the TFP in three
different ways using a fixed effects estimation (FE), the general method of moments (GMM) and
2 For the sake of exposition, we use the term “independent” or “isolated” without any further distinction only for
labeling firms that are not into a supply chain nor into a network as defined in the text. Strictly speaking, those firms
may be not independent nor isolated, but they are not steadily involved in the production of a specific good nor their
relationships with other firms or institutions are relevant and continuative.

7
the Levinsohn-Petrin (2003) approach (LP).3 Exploiting information from our merged database
we build a panel of indicators to estimate TFP on data covering the period 2007-2011. The three
TFP estimates are robust and show a good degree of overlap (TABLE 3). In what follows we
only present the results based on the LP estimates, more appropriate for our analysis, since they
explicitly take into account firms’ intermediate inputs.
IV. EXPORT AND PRODUCTIVITY
The empirical literature has clearly shown that a hierarchy of firms exists in terms of
productivity and other performance indicators, by mode of internationalization. Our analysis
confirms this result (FIGURE 1) showing that firms with different characteristics with respect to
the internationalization form present different productivity premia. Additionally, our data show
that the productivity premium tends to increase with the exported value and large exporters are
generally involved in more complex internationalization forms (e.g. FDI). Some evidence of
heterogeneity emerges if we consider the role of the supply chain: firms integrated into a supply
chain show a level of productivity that can be set between that of non-exporters and exporters
(FIGURE 1.a). These results suggest that a hierarchy may not be clearcut, if the level of detail of
the analysis is increased. In particular, other factors must be considered in order to disentangle
the determinants of firms’ internationalization and productivity. Our variable of interest is the
firm’s integration into a supply chain. Descriptive statistics show that being integrated into a
supply chain boosts the probability of exporting (proxied by the share of exporters) by 20 p.p.
(from 37% to 58% for the whole sample). Moreover, a productivity premium emerges both for
exporters and non-exporters belonging to a supply chain. Overall, however, the aggregate effect
of the supply chain looks stronger on the probability of exporting than on the productivity level
3 Details about the TFP estimation can be found in the appendix.

8
(TABLE 4). Let us consider separately local, domestic and global supply chains integrated firms.
Belonging to a supply chain increases the probability of exporting for all types of firms, but its
effect seems weaker if firms integrate into a domestic and foreign network (TABLE 5).4 This is
not surprising considering that 87.4% of all firms integrated into a foreign network
(independently of the whether they are in a supply chain or not) are also exporters: since the
share is so high, the fact that belonging to a supply chain still has a positive effect is very
relevant. On the other hand, it is interesting to observe that firms into a local network have a
lower probability of exporting than firms not in any kind of network. TABLE 6 reports the
average productivity for the different types of firms we have defined. Being integrated into a
supply chain increases the productivity of firms into local and domestic networks and of firms
not belonging to any network, but it appears not to have a significant effect on firms into a
foreign network. While we see that over 91% of firms classified into a global supply chain are
exporters, on average their productivity is lower than that of firms into other forms of supply
chain and even lower than firms into a foreign network but not in a supply chain. This evidence
is rather surprising. Belonging to a supply chain seems to have a stronger effect on the
probability of exporting than on the productivity of the firm. It is also interesting to note that the
aggregate effect of the domestic network is not very clear, while the local network reduces both
the probability of exporting and the average productivity. We expect the positive effect of the
domestic supply chain to be stronger for SMEs. To test this hypothesis, we consider the effect of
the supply chain on the probability of exporting and on productivity by size of the firm
(measured by employment classes). The data show that firms size matters. In particular, we find
significant evidence of a positive effect of the supply chain on the probability of exporting for all
4
22 p.p. for firms not in any network, 20 p.p. for firms into a local network, 15 p.p. for firms into a domestic
network and 5.4 p.p. for firms into a foreign network.

9
the employment classes. The effect is significantly positive also on the productivity of the SMEs
only, while there is no evidence of any effect of being integrated into a supply chain for larger
firms. Results a reported in TABLE 7.
V. EMPIRICAL ANALYSIS
In this section, we test the (different) effect of belonging to a supply chain and firm’s size on the
probability of exporting. Our dependent variable is binary and takes the value of 1 if a firm is an
exporter, and 0 otherwise. The set of independent variables includes most of the controls adopted
in the literature on the determinants of firms’ internationalization, such as firms’ size, age, group,
and innovation. We augment this standard model with the inclusion of a variable measuring
firm’s participation to supply chains. In addition, we separately control for firms’ participation to
a network. Our final specification is the following:
(1) Pr(Y=1|X)=f(supply chain, size, age, group, innovation, networks, other controls)
TABLE 8 reports some descriptive statistics on the variables.
As an initial robustness check, we run two sets of (probit) regressions: the first including data for
all the firms covered by the survey, and the second on our final merged dataset. Results, reported
in TABLE 9 (models 1-4), are consistent across the different samples pointing to an overall
stability of the relations. In line with the existing evidence, we confirm that the probability of
exporting increases with the age of the firm and with the participation to a group, as well as that
innovation is a key driver to internationalization (Grossman and Helpman, 1991; Hallack and
Schott, 2008). The introduction of a dummy variable representing small and medium sized firms
confirms another key finding of the heterogeneous firms’ theory, i.e. that larger companies are
most likely to internationalize (Melitz, 2003; Ottaviano and Mayer, 2007). Moving to our

10
variables of interest, we find that the participation to different networks has heterogeneous
effects on the probability of exporting. Firms belonging to local networks are less likely to
export, since they might be able to exploit local knowledge and find market niches, while on the
contrary reaching stable relations with foreign actors fosters internationalization, probably
reducing transaction costs of exploring far away markets. In addition, we find that belonging to a
supply chain has a positive effect on the probability of exporting on aggregate, even after
introducing different sets of controls. In order to control whether participation to supply chains
represents a springboard to the internationalization of SMEs, as descriptive statistics seem to
show, we introduce an interaction term. However this term turns out to be insignificant. Next, we
introduce TFP as a possible determinant of a firm’s internationalization (TABLE 9 models 5-6).
More specifically, we want to test whether firms with higher initial productivity and/or that
increased (or decreased less) their productivity during the period are more likely to export.5 As
mentioned above, we computed TFP change for a period covering 2007-2011. The reasons why
we choose this period are twofold. On the one side, this fits the specific question made in survey,
as firms were asked to provide information about the last three years for their activities
(including internationalization). The second is that this period covers the beginning and the acute
phase of the financial crisis. Testing the impact of changes in productivity during the crisis
represents in itself an interesting test for the proposition that internationalized firms have been
less affected than strictly domestic ones, this being especially true for the group of SMEs. We
find that both initial levels of productivity and its subsequent rate of growth exert a positive
impact on the probability of exporting. This result is in line with our expectations. First, since
firms with higher initial productivity are more likely to be exporters, it perfectly fits new trade
5 Note that we have no data on firms that started exporting or exited export markets during the period; thus, not
much can be said on the effect of one variable on the other.

11
models (such as Melitz, 2003) in which the firms’ self-selection into the foreign market is a key
feature. Second, given the initial level of productivity, firms that experienced a higher increase in
the TFP are more likely to be exporters, suggesting that they suffered less from the crisis.
Finally, these results confirm our previous findings on the supply chain: being integrated into a
supply chain has generally a positive effect on the export probability, but no special effect on
SMEs. The evidence above shows that the effect of the supply chain on the export probability is
robust to the introduction of the initial level of productivity and its change, as well as to other
controls. In particular, our preferred model (i.e. regression 6 in TABLE 9) correctly predicts
72.6% of the observations.6 The estimated numerical values for the supply chain are quite similar
and around 0.20 once we add all the controls (models 4 and 6 in TABLE 9). This implies that
belonging to a supply chain can increase the probability of exporting by 6.2-8 p.p. on average, as
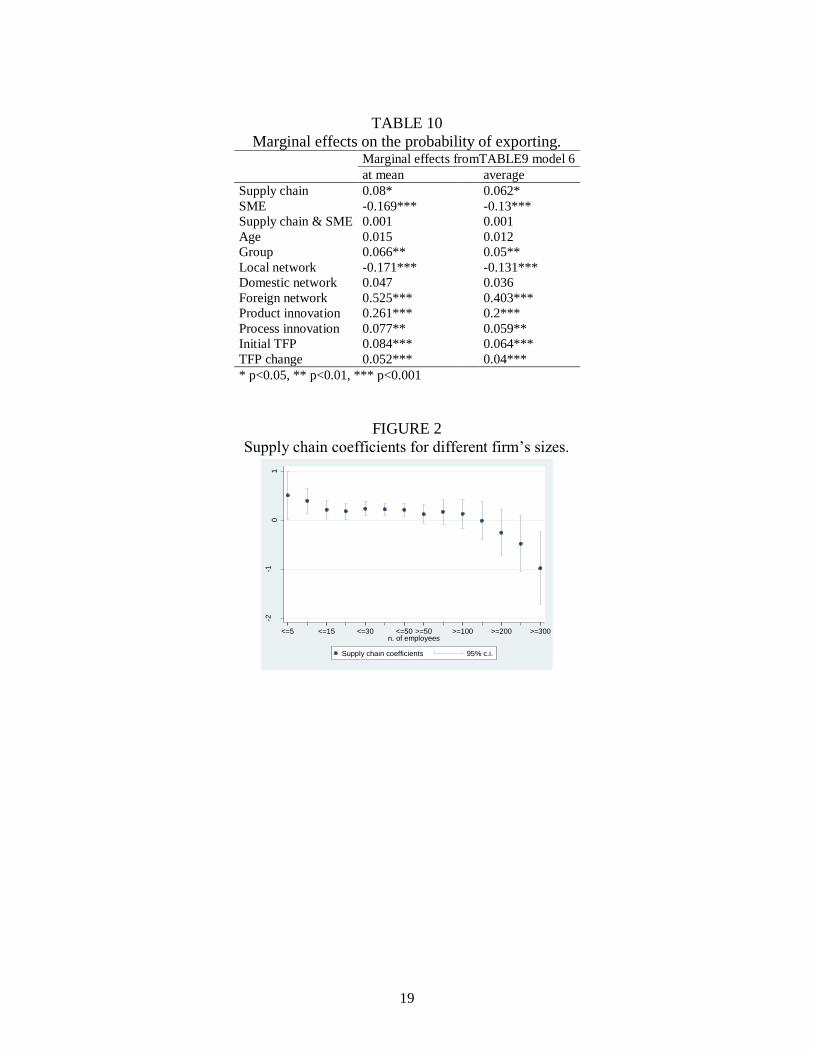
the marginal effects computed from the last estimation clearly show (TABLE 10).
VI. SUPPLY CHAINS AND SMEs’ INTERNATIONALIZATION
We detected in general a significant relation between being into a supply chain and exporting.
We expect however, also on the basis of descriptive statistics presented above, this relationship
to be different between SMEs and the others. Hence, we replicate the analysis for two types of
firms (SMEs and large firms) separately, so to allow for specificity in each coefficient (TABLE
11). Separate regressions produce results that differs from the aggregate estimations for a number
of variables. In the case of SMEs, for instance, we find that neither the participation to a group
nor the firms’ age has a direct influence on their exporters’ status. Contrary to what found in
aggregate, our results show that what really makes SMEs more viable to enter foreign market is
6 The prediction is considered to be correct if the predicted probability is greater than 50% and the firm is indeed
exporting or if the probability is below 50% and the firms is not exporting (Hosmer and Lemeshow, 2000).
12
the introduction of new products rather than also of innovative processes. As far as their
networking strategy is concerned, in line with previous results, domestic and international
partnerships matter more for SMEs internationalization compared to traditional local linkages or
isolation. Interestingly, when comparing SMEs with large firms, our results seem to indicate that
the impact of TFP discussed in the previous paragraph is to be attributed to the former group
only. More relevant for our research question, belonging to a supply chain has now a clear effect
on the SMEs, but no effect for large firms. This result suggests that the supply chain has
heterogeneous effects by firms size; such effects were not emerging in the aggregate
specifications, possibly due to counterbalancing impacts. The marginal effects computed from
the separate regressions report that belonging to a supply chain can increase the probability of
exporting by 6.5-7.9 p.p. for SMEs. Given that the above results contrast with the initial evidence
where no difference between SMEs and large firms was detected for the supply chain, a further
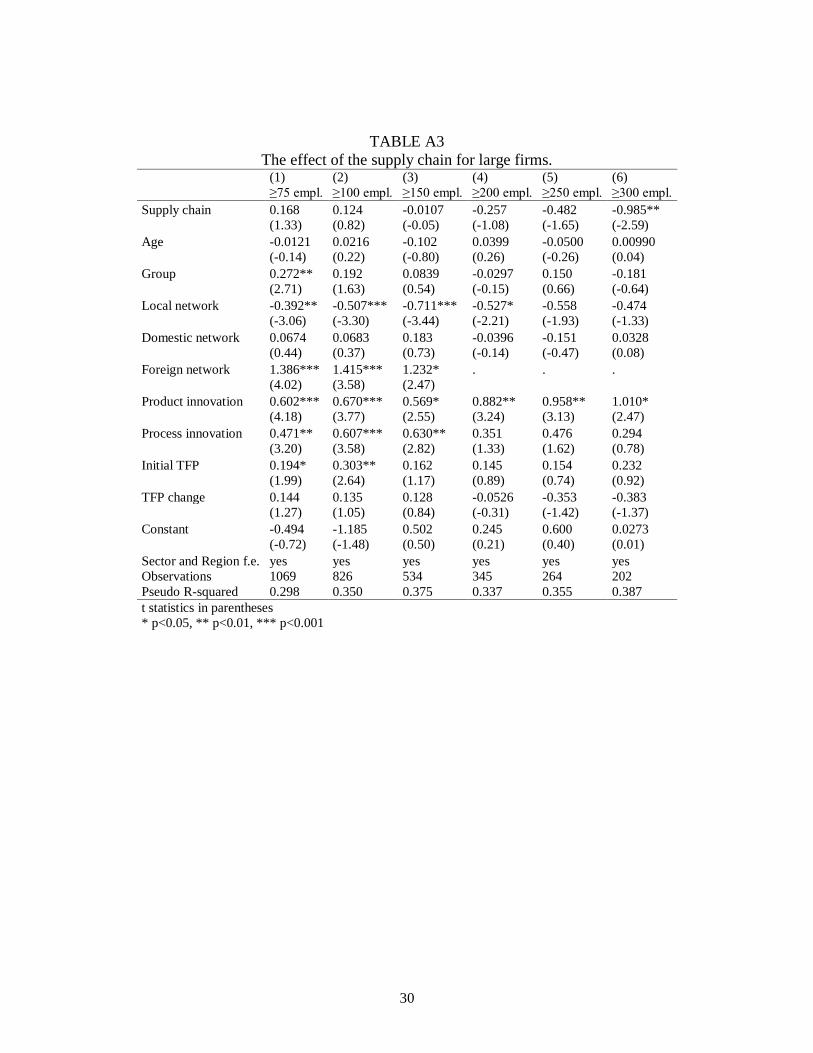
investigation is needed. To have a more detailed picture of how firm’s size affects the results, we
run two sets of regressions for different size thresholds. In the first set we consider very small
firms only (up to 5 employees) and progressively increase the upper bound; in the second set we
do the opposite, i.e. start from the largest firms (at least 300 employee) and progressively reduce
the lower bound. Clearly, once the upper bound is sufficiently high or the lower bound
sufficiently low, regression results converge to the aggregate results. Results for 6 different
regressions for small firms (up to 50 employee) and 6 for large firms (from 50 employee) are
reported in the appendix.7 The size of the coefficients of the supply chain and their confidence
interval are instead depicted in FIGURE 2, which confirms that the positive effect of the supply
7 For simplicity, we report here regressions up to 50 employee for SMEs and from 50 employee for large firms.
Above 50 employee the two sets of regressions produce very similar results. Regressions for all the different
thresholds are available from the authors.
13
chain on the probability of exporting mostly concerns SMEs. On the contrary, no significant
effect emerges for large firms, and the effect even becomes negative for the largest in the group.
VII. SUPPLIERS AND FINAL-GOOD PRODUCERS
Globalization of production has affected not only final, but also (and mostly) intermediate goods.
The process of outsourcing of many Italian firms has come at the expense of many SMEs,
especially those located within industrial clusters (Brusco and Paba, 1997). In order to survive to
these changing market conditions, firms in industrial clusters can exploit the opportunities
offered by supply chains by enhancing their high degrees of specialization. Hence, we
investigate how the supply chain differently affects suppliers and final-goods producers of
different sizes. The (scant) existing evidence, including on Italian firms (Razzolini and Vannoni,
2011), reports a marginal role of suppliers in terms of performance, when compared to final
producers. In our database, we do not directly observe firms’ position within the supply chain,
but we know for each respondent their share of total sales by type of product. We classify a firm
as a supplier if intermediates and components or transport, logistics, commercial and other
services represent more than 50% of total sales. On the contrary, a firm is classified as a final-
good producer if consumption and final industrial goods represent the bulk of sales.8 Given this
definition, we introduce the “supplier” dummy variable into our baseline model (TABLE 12).
Regressions are robust to the inclusion of the “supplier” dummy: all coefficients have the same
sign and their numerical value is similar to previous results. The additional evidence regards the
difference between suppliers and final-good producers: on aggregate, being a supplier within the
supply chain significantly lowers the probability of exporting. Again, a difference between SMEs
8 In our case, the definition of a binary variable is preferable to the use of the actual share of total sales by product
type. In fact, the latter is likely to contain measurement errors, i.e. the observed shares are only indicative and
extreme values are indeed prevalent in the sample.

14
and LEs emerges, as the status of supplier seems prima facie to affect in a stronger way larger
than smaller firms. Given that being a supplier negatively affects the probability of exporting, we
now consider suppliers and final-good producers separately in order to assess how the supply
chain influences the different type of firms (second half of TABLE 12). Results look somehow
symmetric for SMEs and LEs: the supply chain has the strongest positive effect on supplier
SMEs and on final-good producer LEs.
VIII. CONCLUSION
Our results show that belonging to a supply chain has a positive effect on the probability of
exporting, being particularly helpful for SMEs.9 The effect of the supply chain for LEs is also
positive but insignificant and, in any case, its numerical value is about half that for SMEs.
Results are robust to different specifications and to the introduction of different controls. The
distinction between suppliers and final-good producers, allows us to detect some interesting and
novel results. The underlying hypothesis is that best suppliers are able to develop deep relations
with buyers and assemblers, taking a crucial role in the production process. Those able to extend
their network of clients need to reach a higher level of productivity, which allows them to
overcome the high cost of approaching foreign markets. As a result, the effect of the supply
chain is even greater when the SMEs is a supplier as opposed to when it is a final-good producer.
On the contrary, for LEs the supply chain does not seem to help those that are suppliers, while
when the firm is a final-good producer belonging to a supply chain has a positive effect.
9 On average, SMEs into a supply chain are more likely to export by at least 6.5-7.9 p.p. with respect to other firms,
even after controlling for a number of variables such as different kind of networks and productivity.

15
TABLES AND FIGURES
TABLE 1
Definitions of supply chain, network and different types of firms.
Network
relevant and continuative relationships
with other firms or institutions
none local Domestic foreign
Su
pp
ly c
hain
steady and
prevalent
involvement
in the
production
process of a
specific good
no Isolated
firms
Local
network
Domestic
network
Foreign
network yes
Unstable
supply chain
Local supply
chain
Domestic
supply chain
Global
supply chain
TABLE 2
Firms’ distribution by supply integration and type of network. Network
Supply chain none local domestic foreign total
no Isolated firm Local network Domestic network Foreign network
58.8% 13.2% 8.2% 4.1%
84.3%
yes Unstable s.c. Local s.c. Domestic s.c. Global s.c.
8.6% 3.1% 2.4% 1.6%
15.7%
total 67.4% 16.2% 10.6% 5.7% 100%
* p<0.05, ** p<0.01, *** p<0.001
TABLE 3
Estimates of the total factor productivity. Summary statistics Correlations
Mean Std. Dev. Min Max FE GMM LP
ln(TFP) in 2011
FE 5.16 1.19 -1.73 13.59
1
GMM 3.93 1.08 -2.77 9.10
0.55 1
LP 4.06 0.94 -2.60 10.96
0.73 0.53 1
Δln(TFP) 2007-2011
FE -0.11 0.52 -6.01 4.18
1
GMM -0.13 0.54 -5.96 3.94
0.92 1
LP -0.13 0.54 -5.97 4.16 0.91 0.93 1

16
FIGURE 1
Total factor productivity by mode of internationalization.
(a) Average TFP by mode of internationalization. (b) TFP distribution by mode of internationalization.
TABLE 4
Probability of exporting, total factor productivity and the supply chain. Share of firms Total factor productivity
Exporters Non-exporters Total Exporters Non-exporters Total
Supply chain 0.58 0.42 1
4.34 4.04 4.21
Others 0.37 0.63 1
4.25 3.90 4.03
Total 0.40 0.60 1 4.27 3.92 4.06
TABLE 5
Exporters by supply integration and type of network. Network
Supply chain none local domestic foreign total
no Isolated firm Local network Domestic network Foreign network
36.1% 21.5% 43.1% 85.8%
36.9%
yes Unstable s.c. Local s.c. Domestic s.c. Global s.c.
58.0% 41.4% 58.2% 91.2%
58.3%
total 38.9% 25.3% 46.5% 87.4%
40.3%
difference 21.9*** 19.9*** 15.1*** 5.4 21.4***
* p<0.05, ** p<0.01, *** p<0.001
Non-export Supply chain Export Out-FDI In-FDI
01
23
45
TF
P
0.2
.4.6
de
nsity
0 5 10TFP
Non-export Export
OUT-FDI IN-FDI

17
TABLE 6
Average TFP by supply integration and type of network. Network
Supply chain none local domestic foreign total
no Isolated firm Local network Domestic network Foreign network
4.04 3.91 4.07 4.24
4.03
yes Unstable s.c. Local s.c. Domestic s.c. Global s.c.
4.24 4.16 4.26 4.11
4.21
total 4.07 3.95 4.11 4.21
4.06
difference 0.20*** 0.25*** 0.19** -0.13 0.18***
* p<0.05, ** p<0.01, *** p<0.001
TABLE 7
Probability of exporting and total factor productivity by class of employment.
Probability of exporting Total factor productivity
Class of employment Supply chain Others Diff. Supply chain Others Diff.
1-9 0.36 0.18 0.18***
3.84 3.71 0.13***
10-49 0.57 0.42 0.14***
4.15 4.04 0.11***
50-249 0.73 0.54 0.19***
4.43 4.42 0.01
≥250 0.75 0.60 0.15***
4.82 4.89 -0.06
Total 0.58 0.37 0.21*** 4.21 4.03 0.18***
* p<0.1; ** p<0.05; *** p<0.01
TABLE 8
Main summary statistics. Mean Std. Dev. Min Max
Export dummy 0.40 0.49 0 1
Employment class 1.97 0.86 1 4
Age 25.55 15.63 2 181
Group dummy 0.17 0.38 0 1
Supply chain 0.16 0.36 0 1
Local network 0.16 0.37 0 1
Domestic network 0.11 0.31 0 1
Foreign network 0.06 0.23 0 1
Product innovation dummy 0.11 0.32 0 1
Process innovation dummy 0.09 0.29 0 1
Outward FDI dummy 0.09 0.28 0 1
Inward FDI dummy 0.05 0.21 0 1

18
TABLE 9
Selection into the foreign market, productivity and the supply chain.
Whole survey
Final dataset
Controlling for TFP
(1) (2)
(3) (4)
(5) (6)
Supply chain 0.424*** 0.300***
0.409*** 0.182*
0.419*** 0.202*
(6.99) (4.58)
(5.18) (2.16)
(4.86) (2.20)
SME -0.685*** -0.608***
-0.455*** -0.511***
-0.360*** -0.424***
(-23.04) (-18.31)
(-10.83) (-10.99)
(-7.51) (-7.79)
Supply chain & SME -0.0249 -0.0247
-0.0153 0.0504
-0.0989 0.00198
(-0.36) (-0.33)
(-0.16) (0.51)
(-0.95) (0.02)
Age 0.213*** 0.153***
0.181*** 0.0496
0.148*** 0.0382
(17.19) (10.24)
(6.73) (1.66)
(4.59) (1.07)
Group 0.402*** 0.352***
0.276*** 0.258***
0.178*** 0.165**
(13.44) (10.78)
(6.35) (5.54)
(3.66) (3.17)
Local network -0.278*** -0.274***
-0.459*** -0.405***
-0.478*** -0.430***
(-9.89) (-8.97)
(-10.23) (-8.46)
(-8.87) (-7.49)
Domestic network 0.207*** 0.178***
0.0709 0.0902
0.0855 0.118
(6.34) (5.07)
(1.42) (1.72)
(1.48) (1.95)
Foreign network 1.354*** 1.317***
1.312*** 1.347***
1.297*** 1.320***
(26.45) (23.07)
(15.90) (15.02)
(13.67) (12.75)
Product innovation 0.768*** 0.694***
0.783*** 0.677***
0.762*** 0.655***
(21.23) (17.49)
(14.00) (11.42)
(11.93) (9.68)
Process innovation 0.205*** 0.229***
0.148* 0.211**
0.150* 0.195**
(5.10) (5.19)
(2.40) (3.24)
(2.14) (2.62)
Initial TFP
0.122*** 0.210***
(5.42) (5.57)
TFP change
0.0693* 0.130***
(2.00) (3.35)
Constant -0.905*** 3.351
-0.681*** 0.111
-1.341*** -0.931***
(-18.77) (0.03)
(-7.19) (0.77)
(-9.08) (-3.69)
Sector and Region f.e. no yes
no yes
no yes
Observations 23796 20413
7560 7549
5383 5357
Pseudo R-squared 0.173 0.225 0.140 0.227 0.135 0.221
t statistics in parentheses
* p<0.05, ** p<0.01, *** p<0.001
19
TABLE 10
Marginal effects on the probability of exporting. Marginal effects fromTABLE9 model 6
at mean average
Supply chain 0.08*
0.062*
SME -0.169***
-0.13***
Supply chain & SME 0.001
0.001
Age 0.015
0.012
Group 0.066**
0.05**
Local network -0.171***
-0.131***
Domestic network 0.047
0.036
Foreign network 0.525***
0.403***
Product innovation 0.261***
0.2***
Process innovation 0.077**
0.059**
Initial TFP 0.084***
0.064***
TFP change 0.052*** 0.04***
* p<0.05, ** p<0.01, *** p<0.001
FIGURE 2
Supply chain coefficients for different firm’s sizes.
-2-1
01
<=5 <=15 <=30 <=50 >=50 >=100 >=200 >=300n. of employees
Supply chain coefficients 95% c.i.

20
TABLE 11
Probability of exporting regressions and marginal effects for SMEs and large firms. Probability of exporting
probit
marginal effects
SMEs LEs SMEs LEs
Supply chain 0.206** 0.122
average 0.065** 0.033
(3.24) (1.24)
at mean 0.079** 0.044
Age 0.0453 0.0236
average 0.014 0.006
(1.06) (0.34)
at mean 0.017 0.009
Group 0.124 0.253**
average 0.039 0.068**
(1.73) (3.07)
at mean 0.048 0.091**
Local network -0.436*** -0.367*** average -0.137*** -0.099***
(-6.20) (-3.46)
at mean -0.167*** -0.133**
Domestic network 0.168* -0.0232
average 0.053* -0.006
(2.34) (-0.19)
at mean 0.065* -0.008
Foreign network 1.301*** 1.438***
average 0.409*** 0.388***
(11.44) (4.98)
at mean 0.499*** 0.520***
Product innovation 0.646*** 0.663***
average 0.203*** 0.179***
(7.56) (5.64)
at mean 0.248*** 0.240***
Process innovation 0.107 0.297*
average 0.034 0.080*
(1.09) (2.44)
at mean 0.041 0.107*
Initial TFP 0.249*** 0.139
average 0.078*** 0.037
(5.32) (1.80)
at mean 0.095*** 0.050
TFP change 0.155*** 0.0636
average 0.049*** 0.017
(3.42) (0.76)
at mean 0.06** 0.023
Constant -1.363*** -0.157
(-4.86) (-0.29)
Sector and Region f.e. yes yes
Observations 3755 1561
Pseudo R-squared 0.181 0.270
t statistics in parentheses
* p<0.05, ** p<0.01, *** p<0.001

21
TABLE 12
Supply chain, suppliers and firm’s size. SMEs LEs
all SMEs LEs supplier final supplier final
Supply chain 0.230*** 0.231*** 0.154
0.282** 0.188*
-0.0538 0.313*
(4.36) (3.61) (1.55)
(2.91) (2.09)
(-0.37) (1.99)
SME -0.425***
(-8.45)
Supplier -0.282*** -0.258*** -0.329***
(-6.78) (-5.21) (-4.02)
Age 0.0350 0.0398 0.0243
0.0897 0.00516
-0.0534 0.121
(0.98) (0.92) (0.34)
(1.37) (0.09)
(-0.50) (1.15)
Group 0.171** 0.127 0.262**
0.0440 0.201
0.383** 0.171
(3.27) (1.76) (3.16)
(0.42) (1.94)
(3.05) (1.35)
Local network -0.414*** -0.422*** -0.341**
-0.419*** -0.432*** -0.542*** -0.188
(-7.18) (-5.98) (-3.19)
(-4.09) (-4.29)
(-3.55) (-1.05)
Domestic network 0.120* 0.168* -0.0229
0.260* 0.0879
0.208 -0.347*
(1.97) (2.33) (-0.19)
(2.38) (0.87)
(1.13) (-1.98)
Foreign network 1.310*** 1.289*** 1.436***
1.300*** 1.369***
1.860*** 1.353**
(12.62) (11.31) (4.96)
(7.40) (8.52)
(3.66) (2.82)
Product innovation 0.633*** 0.625*** 0.641***
0.646*** 0.649***
0.729*** 0.728***
(9.31) (7.29) (5.43)
(4.32) (5.96)
(3.88) (4.14)
Process innovation 0.189* 0.101 0.297*
0.188 0.0605
0.437* 0.174
(2.54) (1.02) (2.44)
(1.18) (0.46)
(2.39) (0.95)
Initial TFP 0.213*** 0.249*** 0.139
0.126 0.374***
0.211 0.0409
(5.60) (5.31) (1.80)
(1.70) (5.76)
(1.80) (0.34)
TFP change 0.137*** 0.160*** 0.0829
0.227** 0.109
0.234 0.0199
(3.53) (3.52) (0.99)
(3.22) (1.73)
(1.58) (0.17)
Constant -0.701** -1.317*** -0.122
-1.525** -1.724*** -1.942 0.570
(-2.78) (-4.68) (-0.23)
(-3.18) (-4.52)
(-1.95) (0.72)
Sector and Region f.e. yes yes yes
yes yes
yes yes
Observations 5357 3755 1561
1724 1986
735 779
Pseudo R-squared 0.227 0.186 0.278 0.181 0.193 0.314 0.262
t statistics in parentheses
* p<0.05, ** p<0.01, *** p<0.001

22
REFERENCES
Accetturo A., Giunta A., Rossi S. (2011) The Italian firms between crisis and the new globalization. Questioni di
Economia e Finanza (Occasional Papers) 86, Bank of Italy, Economic Research and International Relations
Area.
Agostino M., Nugent J.B., Scalera D., Trivieri F., Giunta A. (2011) Firm Productivity, Organizational Choice and
Global Value Chain. Working Papers, Basque Institute of Competitiveness.
Baldwin R., Lopez-Gonzalez J. (2013) Supply-Chain Trade: A Portrait of Global Patterns and Several Testable
Hypotheses. NBER Working Papers 18957, National Bureau of Economic Research, Inc.
Basile R., Benfratello L., Castellani D. (2005) Attracting Foreign Direct Investments in Europe: Are Italian Regions
Doomed? Rivista di Politica Economica, SIPI Spa, vol. 95(1), pages 319-.
Becattini G. (1990) The Marshallian industrial district as a socio-economic notion. In Pyke F., Becattini G.,
Sengenberger W. (Eds) Industrial District and Inter-firm Cooperation in Italy, pp. 37–51. International
Institute for Labour Studies, Geneva.
Becchetti L., De Panizza A., Oropallo F. (2007) Role of Industrial District Externalities in Export and Value-added
Performance: Evidence from the Population of Italian Firms. Regional Studies, vol. 41(5).
Becchetti L., Rossi S. (2000) The Positive Effect of Industrial District on the Export Performance of Italian Firms.
Review of Industrial Organization, Springer, vol. 16(1), pages 53-68.
Benfratello L., Sembenelli A. (2006) Foreign ownership and productivity: Is the direction of causality so obvious?
International Journal of Industrial Organization, Elsevier, vol. 24(4), pages 733-751.
Bernard A.B., Jensen J.B., Redding S.J., Schott P.K. (2007) Firms in International Trade. Journal of Economic
Perspectives, American Economic Association, vol. 21(3), pages 105-130.
Blundell R., Bond S. (2000) GMM Estimation with persistent panel data: an application to production functions.
Econometric Reviews, Taylor and Francis Journals, vol. 19(3), pages 321-340.
Bricongne J.C., Fontagné L., Gaulier G., Taglioni D., Vicard V. (2012) Firms and the global crisis: French exports
in the turmoil. Journal of International Economics, Elsevier, vol. 87(1), pages 134-146.
Brusco S., Paba S. (1997) Per una storia dei distretti industriali italiani dal secondo dopoguerra agli anni novanta. In
Barca F. (Ed) Storia del capitalismo italiano dal dopoguerra ad oggi. Donzelli Editore Roma, pages 265-
333.
Castellani D., Serti F., Tomasi C. (2010) Firms in International Trade: Importers' and Exporters' Heterogeneity in
Italian Manufacturing Industry. The World Economy, Wiley Blackwell, vol. 33(3), pages 424-457.
Cerrato D., Piva M. (2012) The internationalization of small and medium-sized enterprises: the effect of family
management, human capital and foreign ownership. Journal of Management and Governance, Springer,
vol. 16(4), pages 617-644.
Criscuolo C., Martin R. (2009) Multinationals and U.S. Productivity Leadership: Evidence from Great Britain. The
Review of Economics and Statistics, MIT Press, vol. 91(2), pages 263-281.
Del Gatto M., Di Liberto A., Petraglia C. (2011) Measuring Productivity. Journal of Economic Surveys, Wiley
Blackwell, vol. 25(5), pages 952-1008.
Di Giacinto V., Gomellini M., Micucci G., Pagnini M. (2012) Mapping local productivity advantages in Italy:
industrial districts, cities or both? Temi di discussione (Economic working papers) 850, Bank of Italy,
Economic Research and International Relations Area.
Gereffi G. (1999) International trade and industrial upgrading in the apparel commodity chain. Journal of
International Economics, vol. 48, pages 37-70.
Giovannetti G., Ricchiuti G., Velucchi M. (2013) Location, internationalization and performance of firms in Italy: a
multilevel approach. Applied Economics, vol. 45(18).

23
Grossman G.M., Rossi-Hansberg E. (2008) Trading Tasks: A Simple Theory of Offshoring. American Economic
Review, American Economic Association, vol. 98(5), pages 1978-97.
Helpman E., Melitz M.J., Yeaple S.R. (2004) Export Versus FDI with Heterogeneous Firms. American Economic
Review, American Economic Association, vol. 94(1), pages 300-316.
Higón Añón D., Driffield N. (2011) Exporting and innovation performance: Analysis of the annual Small Business
Survey in the UK. International Small Business Journal, vol. 29(4).
Hosmer D.W. Jr., Lemeshow S. (2000) Applied Logistic Regression. 2nd ed. New York: Wiley.
Humphrey J., Schmitz H. (2002) How does insertion in global value chains affect upgrading in industrial clusters?
Regional Studies, 36(9), pages 1017-1027.
Levinsohn, J., Petrin A. (2003) Estimating production functions using inputs to control for unobservables. Review of
Economic Studies, vol. 70, pages 317–341.
Mayer T, Ottaviano G.I.P. (2007) The Happy Few: New Facts on the Internationalization of European Firms.
Bruegel { CEPR EFIM Report. Bruegel Blueprint Series.
Melitz M.J. (2003) The Impact of Trade on Intra-Industry Reallocations and Aggregate Industry Productivity.
Econometrica, 71, pages 1695-725.
Melitz, M.J., Redding S.J. (2013) Heterogeneous Firms and Trade. CEPR Discussion Papers 9317, C.E.P.R.
Discussion Papers.
Minetti R., Chun Zhu S. (2011) Credit constraints and firm export: Microeconomic evidence from Italy. Journal of
International Economics, vol. 83(2), pages 109–125.
OECD (2006) Enhancing the role of SMEs in global value chains, OECD Centre for SMEs, Entrepreneurship and
Local Development, Paris.
OECD (2012) Fostering SMEs' Participation in Global Markets: Final Report, Entrepreneurship and Local
Development, Paris.
Olley S.G., Pakes A. (1996) The dynamics of productivity in the telecommunications equipment industry.
Econometrica, vol. 64, pages 1263–1297.
Van Beveren I. (2012) Total Factor Productivity Estimation: A Practical Review. Journal of Economic Surveys,
Wiley Blackwell, vol. 26(1), pages 98-128.
Wagner J. (2007) Exports and Productivity: A Survey of the Evidence from Firm-level Data. The World Economy,
vol. 30(1), pages 60–82.
Wagner J. (2012) International trade and firm performance: a survey of empirical studies since 2006. Review of
World Economics, vol. 148(2), pages 235-267.
24
APPENDIX
Data and variables description
The main source of information is a survey conducted by the MET (Monitoraggio Economia e
Territorio s.r.l.). The survey contains information on 25,090 Italian firms for the year 2011, with
some information also referring to the period 2009-2011. The firms’ sample is built using a
stratification procedure by firm’s size, sector and region in order to ensure representativeness at
the national level. Firms in the dataset belong to different sectors of manufacturing and services
and are located in all the Italian regions. The information contained in the survey is mostly
qualitative and ranges from employment to investments, innovation and internationalization. In
order to add more quantitative information (particularly for the TFP estimation), the final dataset
we employ in this paper is the result of a merging and matching procedure between the MET
survey and the balance sheet information from AIDA (Bureau Van Dijk). After matching the
information for each firm from the survey with the balance sheet data and checking the
consistency of a number of firm identifiers (mainly the 2-digit sector and the region) we are left
with 7,590 firms for which the matching procedure has been successful. We also merged our
data with the ICE-Reprint database (one of the main source of information on the Italian
multinationals) in order to flag firms that are involved in FDI activities. The main variables we
employ are described in TABLE A1.

25
TABLE A1
Main variables description. Variable Source Description
Export dummy MET 1 if direct or indirect export in the last three years
Export class MET 1=non-exporters, 2-4 quartiles by direct and indirect foreign sales in the
last year (share of total sales)
Employment class MET <9, 10-49, 50-249, >250 employees
Age MET Number of years of the firm
Group dummy MET 1 if firm belongs to a group
Supply chain MET 1 if firm is steadily involved in the production process of a specific good
and this activity constitutes its major source of revenue.
Network (loc./dom./for.) MET 1 if firm has relevant and continuative relationships with
local/domestic/foreign firms
Supplier MET 1 if intermediates, components, transport, logistics and other services
represent more than 50% of total sales
Product innovation dummy MET 1 if product innovation in the last three years
Process innovation dummy MET 1 if process innovation in the last three years
Outward FDI dummy ICE-Reprint 1 if outward FDI in the last 10 years
Inward FDI dummy ICE-Reprint 1 if inward FDI in the last 10 years
Output AIDA Value added, th. € years 2007-11
Labor AIDA Number of employees, years 2007-11
Capital AIDA Total intangible fixed assets, th. € years 2007-11
Intermediate inputs AIDA Raw materials and consumables, th. € years 2007-11

26
Total factor productivity estimation
Our TFP estimation procedure follows a vast literature on the topic. The theoretical basis for the
estimation lies in the assumption of a Cobb-Douglas production function for the firm:
(A1) kl
itititit KLAY
0, kl
where i and t are firms and year subscripts respectively; Y is output (value added); L is labor; K
is capital and A is a Hicksian neutral technology multiplier (unobservable). One of the
advantages of the econometric approach is that the production function is not required to exhibit
constant returns to scale (i.e. 1 kl ), as it is often necessary under non-econometric
approaches. However, in order to perform the estimation, we must assume that firms share the
same technology, except than for the neutral parameter A, that is l and k are the same for all
firms, otherwise we may get biased estimates. Taking the logarithm (denoted by small case
letters), the baseline econometric specification takes the following form:
(A2) ititkitlit kly 0
In the above equation, the sum of the constant and the error term gives the Hicksian technology:
(A3) itita 0
Theoretically, we can further model the unobservable firm-level error term so to decompose it
into a predictable and an unpredictable component such that ititit uv . Since both terms are
unobservable, additional assumptions need to be made on the itv terms; while the itu terms are
usually assumed to be i.i.d. and uncorrelated with inputs choices, being due to measurement
errors and other unpredictable factors. After the estimation of the production function
parameters, the estimated productivity can be calculated as:
(A4) itkitlitit klya ˆˆˆ
27
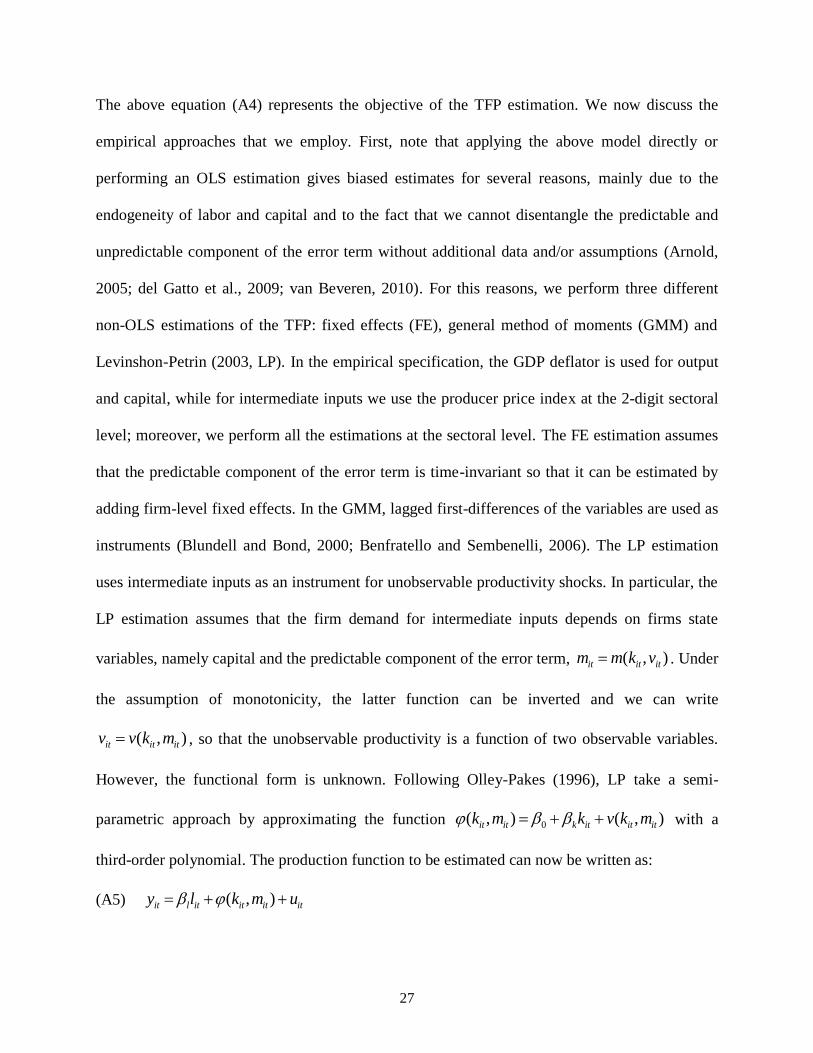
The above equation (A4) represents the objective of the TFP estimation. We now discuss the
empirical approaches that we employ. First, note that applying the above model directly or
performing an OLS estimation gives biased estimates for several reasons, mainly due to the
endogeneity of labor and capital and to the fact that we cannot disentangle the predictable and
unpredictable component of the error term without additional data and/or assumptions (Arnold,
2005; del Gatto et al., 2009; van Beveren, 2010). For this reasons, we perform three different
non-OLS estimations of the TFP: fixed effects (FE), general method of moments (GMM) and
Levinshon-Petrin (2003, LP). In the empirical specification, the GDP deflator is used for output
and capital, while for intermediate inputs we use the producer price index at the 2-digit sectoral
level; moreover, we perform all the estimations at the sectoral level. The FE estimation assumes
that the predictable component of the error term is time-invariant so that it can be estimated by
adding firm-level fixed effects. In the GMM, lagged first-differences of the variables are used as
instruments (Blundell and Bond, 2000; Benfratello and Sembenelli, 2006). The LP estimation
uses intermediate inputs as an instrument for unobservable productivity shocks. In particular, the
LP estimation assumes that the firm demand for intermediate inputs depends on firms state
variables, namely capital and the predictable component of the error term, ),( ititit vkmm . Under
the assumption of monotonicity, the latter function can be inverted and we can write
),( ititit mkvv , so that the unobservable productivity is a function of two observable variables.
However, the functional form is unknown. Following Olley-Pakes (1996), LP take a semi-
parametric approach by approximating the function ),(),( 0 itititkitit mkvkmk with a
third-order polynomial. The production function to be estimated can now be written as:
(A5) ititititlit umkly ),(

28
The first stage of the LP estimation involves estimating the above equation (A5) so to get l̂ ,
while k̂ is obtained in the second stage under some additional assumptions about the itv terms,
e.g. that they follow a first order Markov process. For further details we refer to LP (2003).

29
Tables and figures
TABLE A2
The effect of the supply chain for small firms. (1) (2) (3) (4) (5) (6)
≤5 empl. ≤10 empl. ≤15 empl. ≤20 empl. ≤30 empl. ≤40 empl.
Supply chain 0.502* 0.390** 0.212* 0.179* 0.232** 0.218**
(2.00) (3.04) (2.26) (2.21) (3.24) (3.29)
Age -0.0339 -0.127 -0.0630 -0.0568 -0.0259 0.0576
(-0.22) (-1.56) (-1.01) (-1.04) (-0.53) (1.28)
Group 0.612* 0.284 0.133 0.107 0.112 0.135
(2.20) (1.86) (1.17) (1.10) (1.31) (1.74)
Local network 0.0196 -0.234 -0.327*** -0.302*** -0.366*** -0.428***
(0.09) (-1.89) (-3.30) (-3.55) (-4.76) (-5.89)
Domestic network 0.222 0.238 0.189 0.230* 0.213** 0.176*
(0.79) (1.61) (1.75) (2.43) (2.60) (2.31)
Foreign network 1.138** 1.298*** 1.326*** 1.328*** 1.356*** 1.285***
(3.28) (6.36) (8.43) (9.24) (10.50) (10.74)
Product innovation 1.021** 0.774*** 0.513*** 0.520*** 0.607*** 0.637***
(3.14) (4.08) (3.73) (4.47) (6.20) (6.99)
Process innovation 0.191 0.214 0.0171 0.0724 0.0893 0.0868
(0.45) (0.90) (0.10) (0.53) (0.78) (0.82)
Initial TFP -0.0700 0.00281 0.0962 0.156** 0.158** 0.199***
(-0.56) (0.04) (1.54) (2.76) (3.03) (4.09)
TFP change -0.189 -0.0467 0.0326 0.0803 0.0999* 0.129**
(-1.61) (-0.70) (0.59) (1.57) (2.05) (2.77)
Constant -1.054 -0.339 -0.654 -0.897** -0.929** -1.277***
(-1.24) (-0.71) (-1.73) (-2.64) (-2.98) (-4.38)
Sector and Region f.e. yes yes yes yes yes yes
Observations 494 1325 2041 2510 3048 3468
Pseudo R-squared 0.186 0.178 0.158 0.154 0.166 0.174
t statistics in parentheses
* p<0.05, ** p<0.01, *** p<0.001
30
TABLE A3
The effect of the supply chain for large firms. (1) (2) (3) (4) (5) (6)
≥75 empl. ≥100 empl. ≥150 empl. ≥200 empl. ≥250 empl. ≥300 empl.
Supply chain 0.168 0.124 -0.0107 -0.257 -0.482 -0.985**
(1.33) (0.82) (-0.05) (-1.08) (-1.65) (-2.59)
Age -0.0121 0.0216 -0.102 0.0399 -0.0500 0.00990
(-0.14) (0.22) (-0.80) (0.26) (-0.26) (0.04)
Group 0.272** 0.192 0.0839 -0.0297 0.150 -0.181
(2.71) (1.63) (0.54) (-0.15) (0.66) (-0.64)
Local network -0.392** -0.507*** -0.711*** -0.527* -0.558 -0.474
(-3.06) (-3.30) (-3.44) (-2.21) (-1.93) (-1.33)
Domestic network 0.0674 0.0683 0.183 -0.0396 -0.151 0.0328
(0.44) (0.37) (0.73) (-0.14) (-0.47) (0.08)
Foreign network 1.386*** 1.415*** 1.232* . . .
(4.02) (3.58) (2.47)
Product innovation 0.602*** 0.670*** 0.569* 0.882** 0.958** 1.010*
(4.18) (3.77) (2.55) (3.24) (3.13) (2.47)
Process innovation 0.471** 0.607*** 0.630** 0.351 0.476 0.294
(3.20) (3.58) (2.82) (1.33) (1.62) (0.78)
Initial TFP 0.194* 0.303** 0.162 0.145 0.154 0.232
(1.99) (2.64) (1.17) (0.89) (0.74) (0.92)
TFP change 0.144 0.135 0.128 -0.0526 -0.353 -0.383
(1.27) (1.05) (0.84) (-0.31) (-1.42) (-1.37)
Constant -0.494 -1.185 0.502 0.245 0.600 0.0273
(-0.72) (-1.48) (0.50) (0.21) (0.40) (0.01)
Sector and Region f.e. yes yes yes yes yes yes
Observations 1069 826 534 345 264 202
Pseudo R-squared 0.298 0.350 0.375 0.337 0.355 0.387
t statistics in parentheses
* p<0.05, ** p<0.01, *** p<0.001