Embed Size (px)
Citation preview
1
www.scl.gatech.edu/invmgmt
Supply Chain Management (SCM) Certificate
Sept 22-24, 2015 | GT Global Learning Ctr (Atlanta, GA)
Inventory Planning and Management
Paul GriffinProfessor, Stewart School of Industrial & Systems EngineeringLecturer, Supply Chain and Logistics Institute
Webinar: Challenges and Opportunities in Inventory Management Optimize the use of inventory throughout the Supply Chain
2
What’s the agenda for this webinar?
Inventory “issues”Current modeling strategiesCommon problems with current methodsApproaches and technologies for
improvement
2

3
Other faculty…
Julie SwannHarold R. and Mary Anne Nash Professor
Stewart School of Industrial & Systems Engineering
Pinar KeskinocakWilliam W. George Chair and Professor
Stewart School of Industrial & Systems Engineering
4
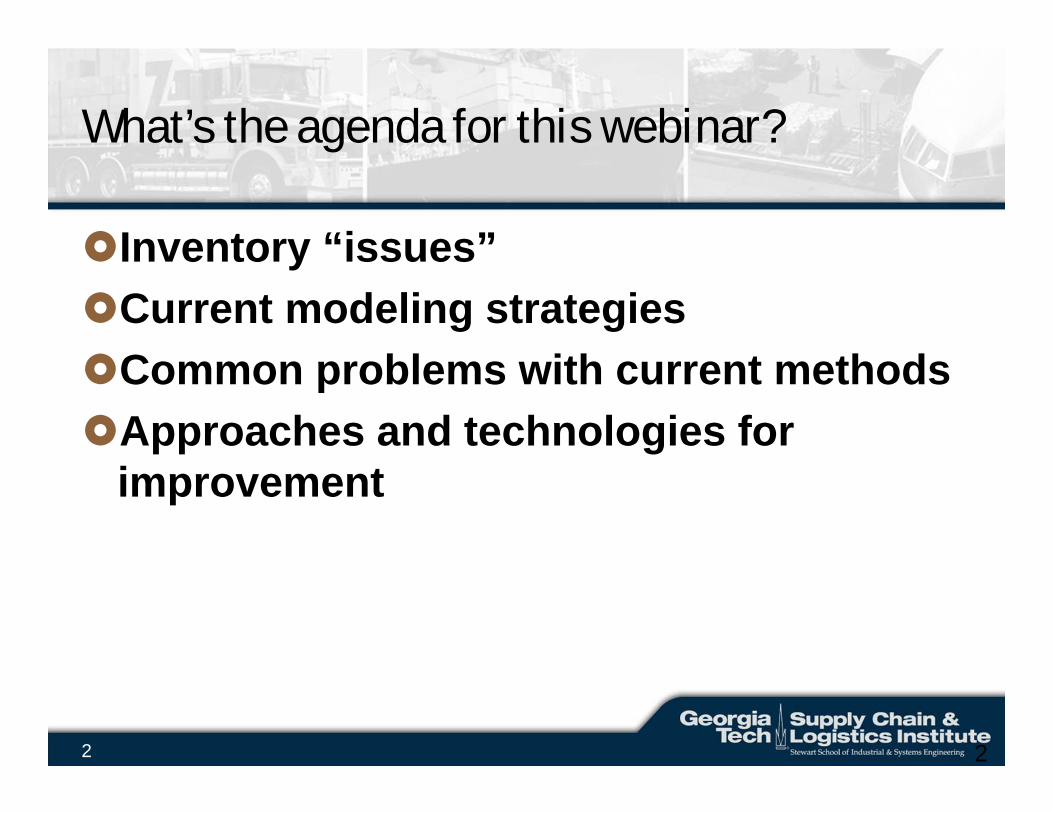
Historical measures
Components of Inventory Carrying Costs:• Interest (8%)• Warehousing (26%)• Other, e.g., taxes, obsolescence,
depreciation, insurance (66%)
(Source: US Department of Transportation)
5
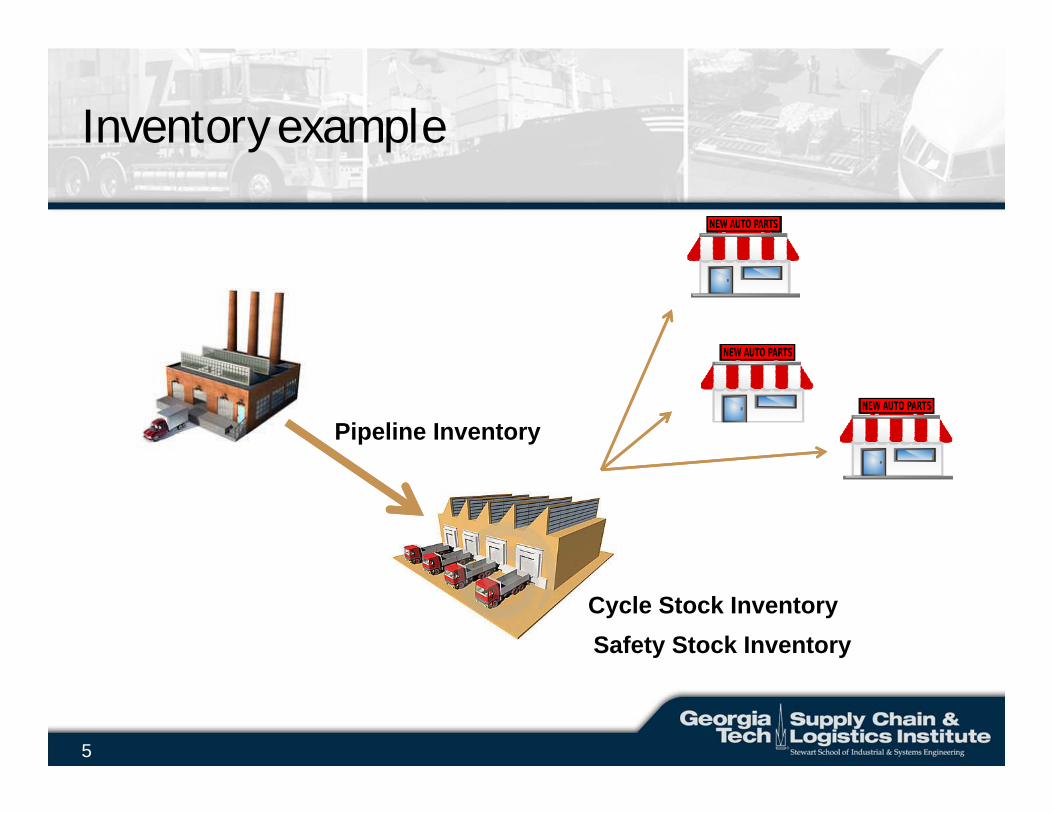
Inventory example
Pipeline Inventory
Cycle Stock InventorySafety Stock Inventory
6
Illustrative example
Warehouse serves 2 customers and desires perfect service
Each customer orders 1 item per weekReplenishment occurs every two weeksReplenishments are instantaneous
(replenishment leadtime is zero)
7
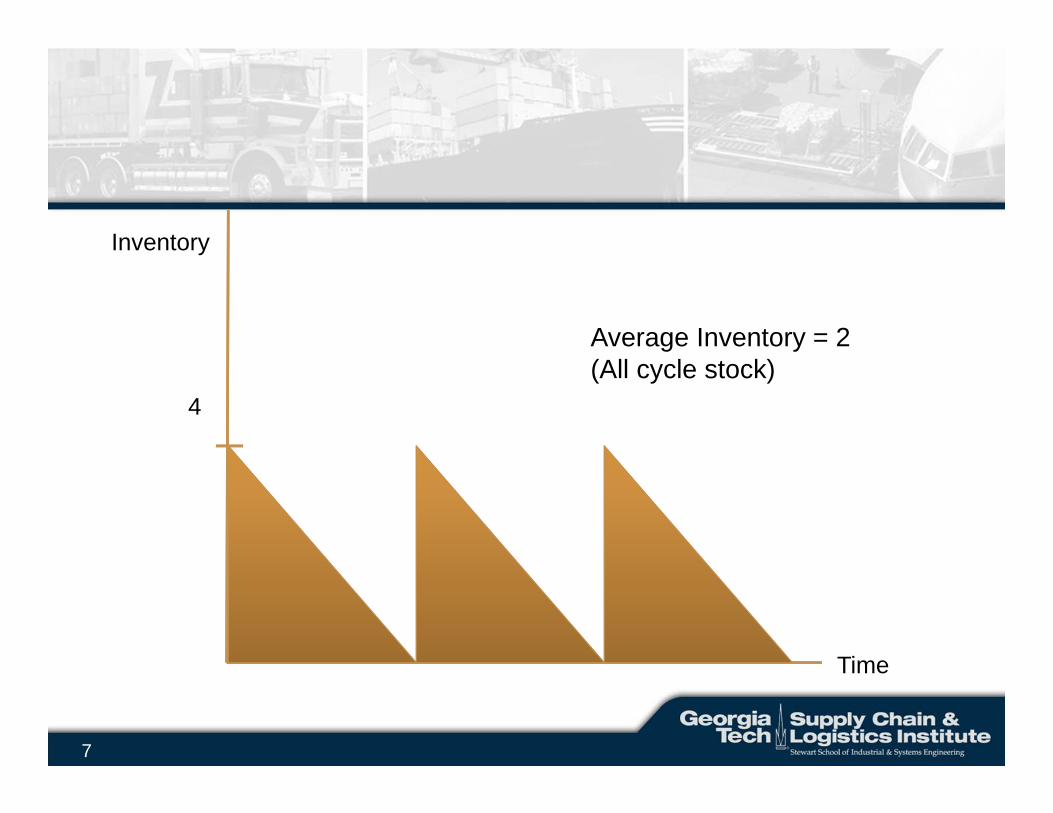
Time
Inventory
4
Average Inventory = 2(All cycle stock)
8
Illustrative example continued
Everything is the same except:Customers order 1 item per week (on average): 2 items half the time, 0 items half the time
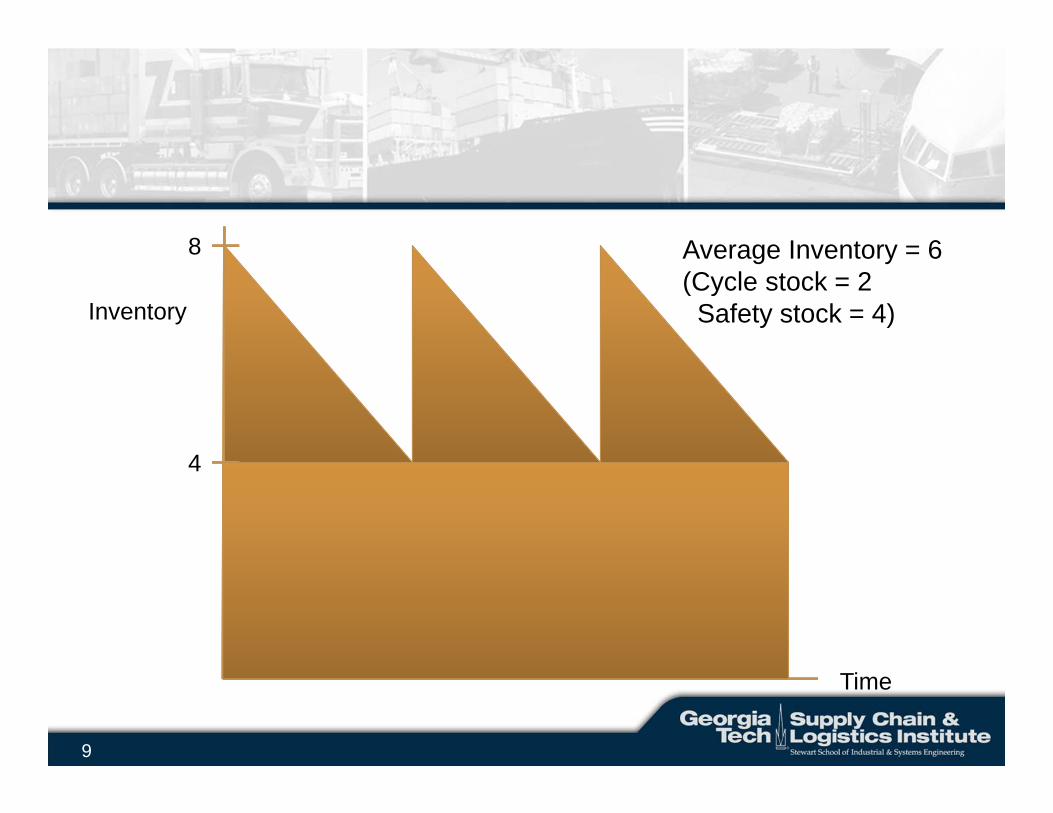
9
Time
Inventory
8 Average Inventory = 6(Cycle stock = 2Safety stock = 4)
4
10
Illustrative example continued
Everything is the same except:Replenishment leadtime is 1 week
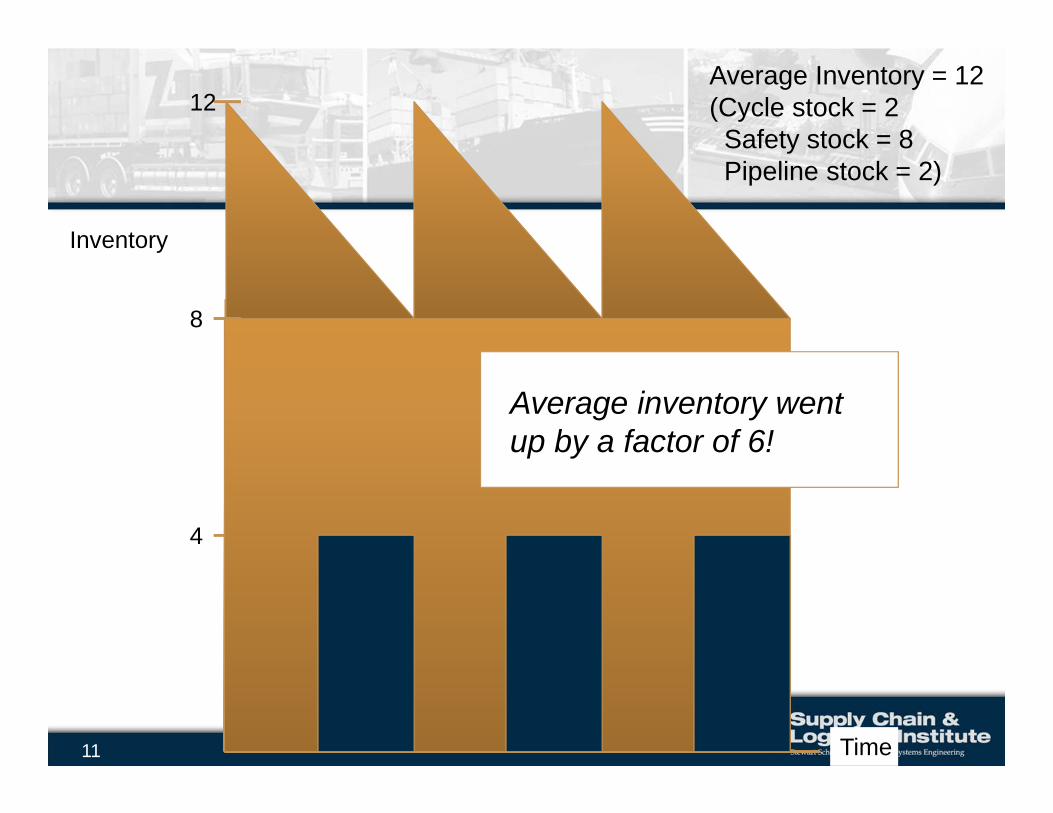
11 Time
Inventory
8
Average Inventory = 12(Cycle stock = 2Safety stock = 8Pipeline stock = 2)
4
12
Average inventory went up by a factor of 6!
12
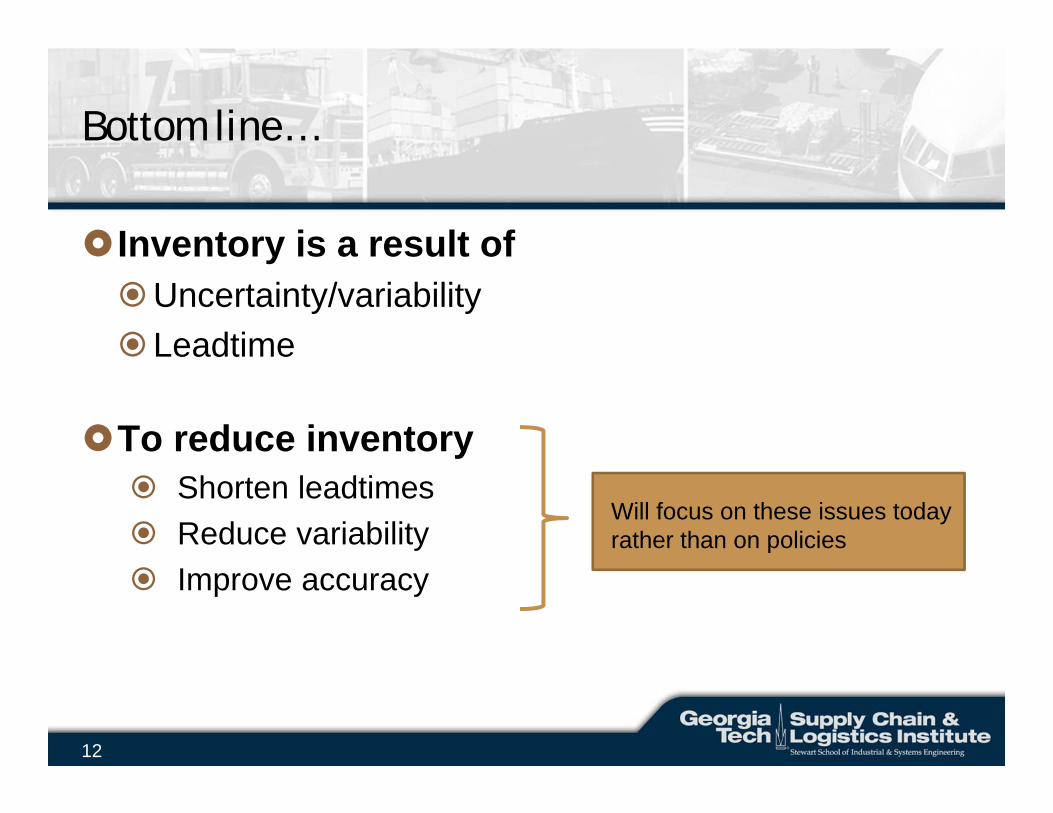
Bottom line…
Inventory is a result of Uncertainty/variabilityLeadtime
To reduce inventory Shorten leadtimes Reduce variability Improve accuracy
Will focus on these issues todayrather than on policies
13
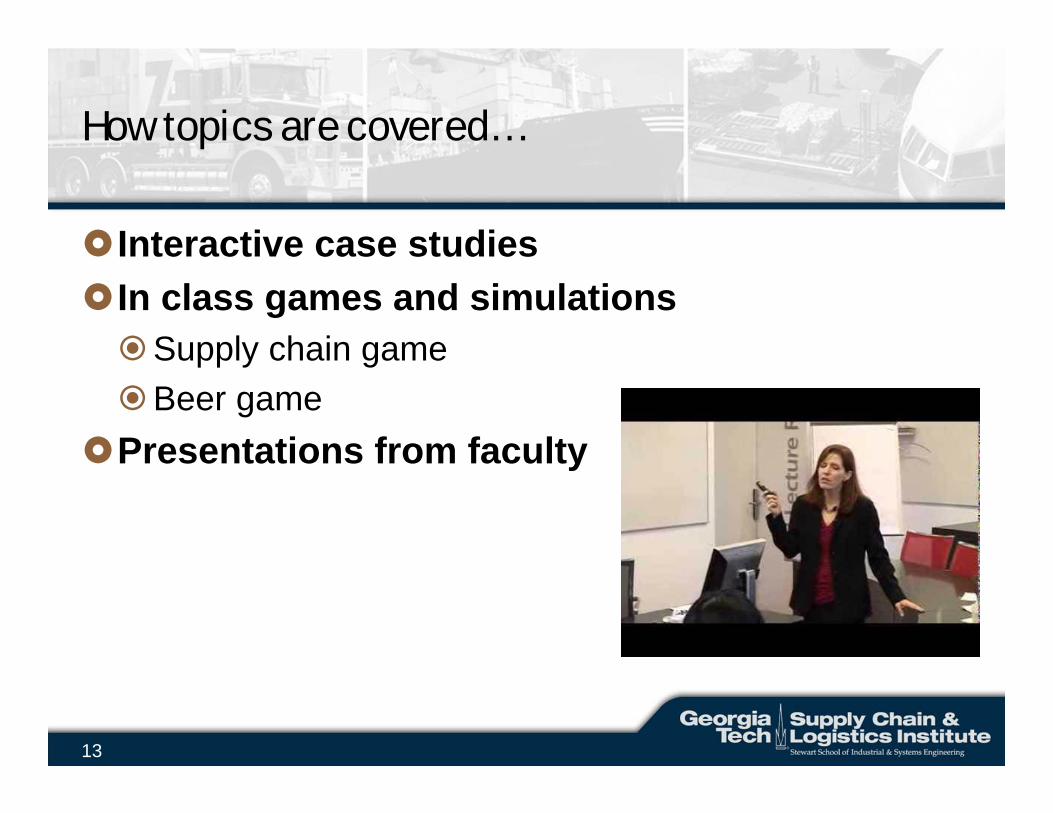
How topics are covered…
Interactive case studiesIn class games and simulationsSupply chain gameBeer game
Presentations from faculty
14
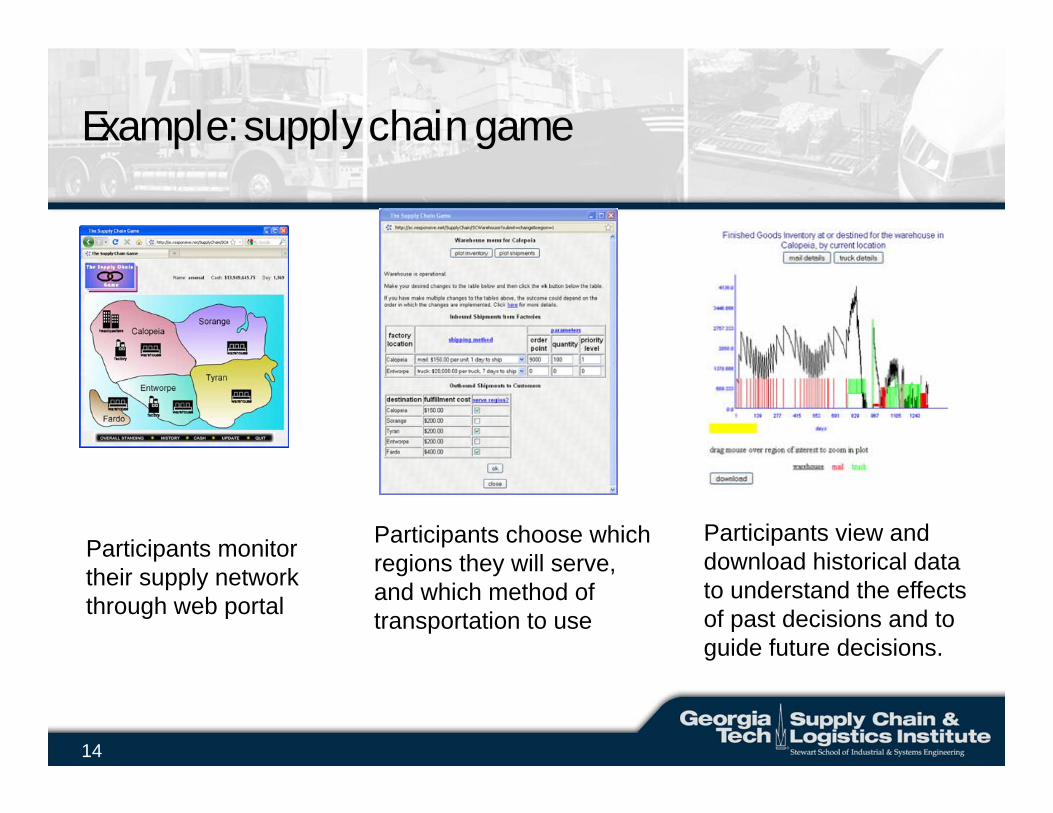
Example: supply chain game
Participants monitor their supply networkthrough web portal
Participants choose which regions they will serve, and which method of transportation to use
Participants view and download historical data to understand the effects of past decisions and to guide future decisions.
15
Basic inventory problem
When a replenishment order should be placed
How large a replenishment order should beHow often the inventory status should be
determined
Different products may need different control systems and different policies
15
16
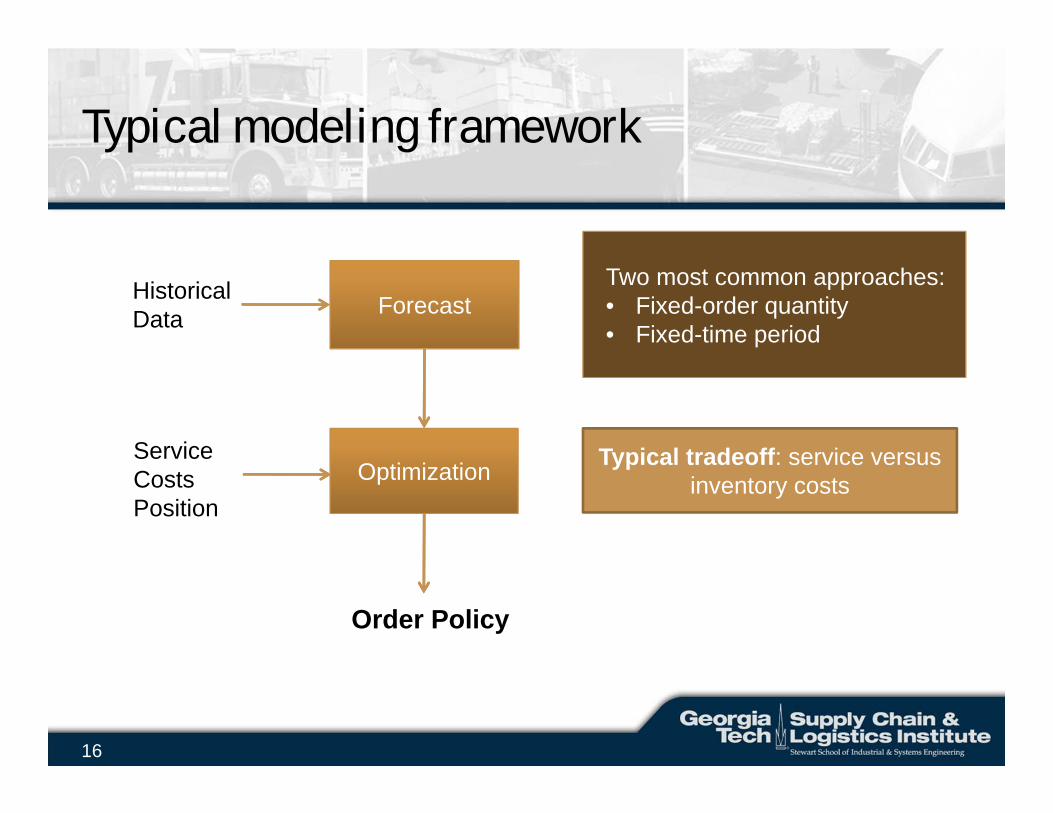
Typical modeling framework
ForecastHistoricalData
OptimizationServiceCostsPosition
Order Policy
Two most common approaches:• Fixed-order quantity• Fixed-time period
Typical tradeoff: service versus inventory costs
17
17
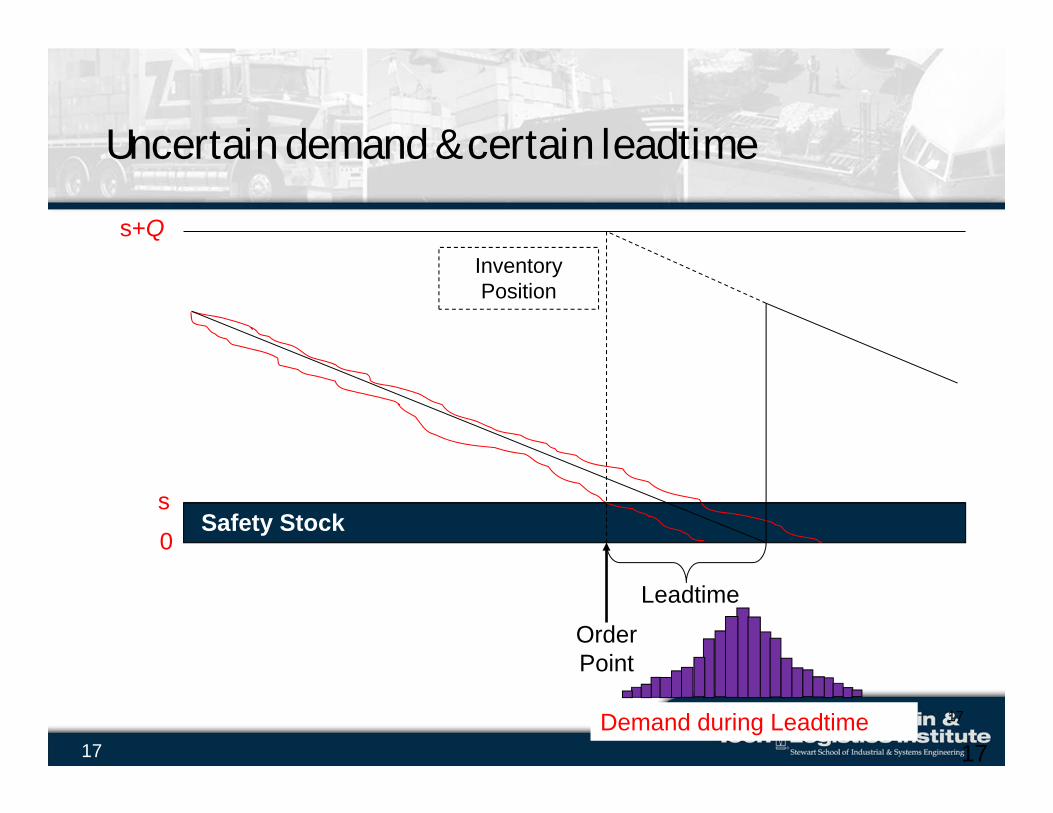
Uncertain demand & certain leadtime
Inventory Position
Safety Stock
Order Point
s
Demand during Leadtime
Leadtime
s+Q
17
0
18
18
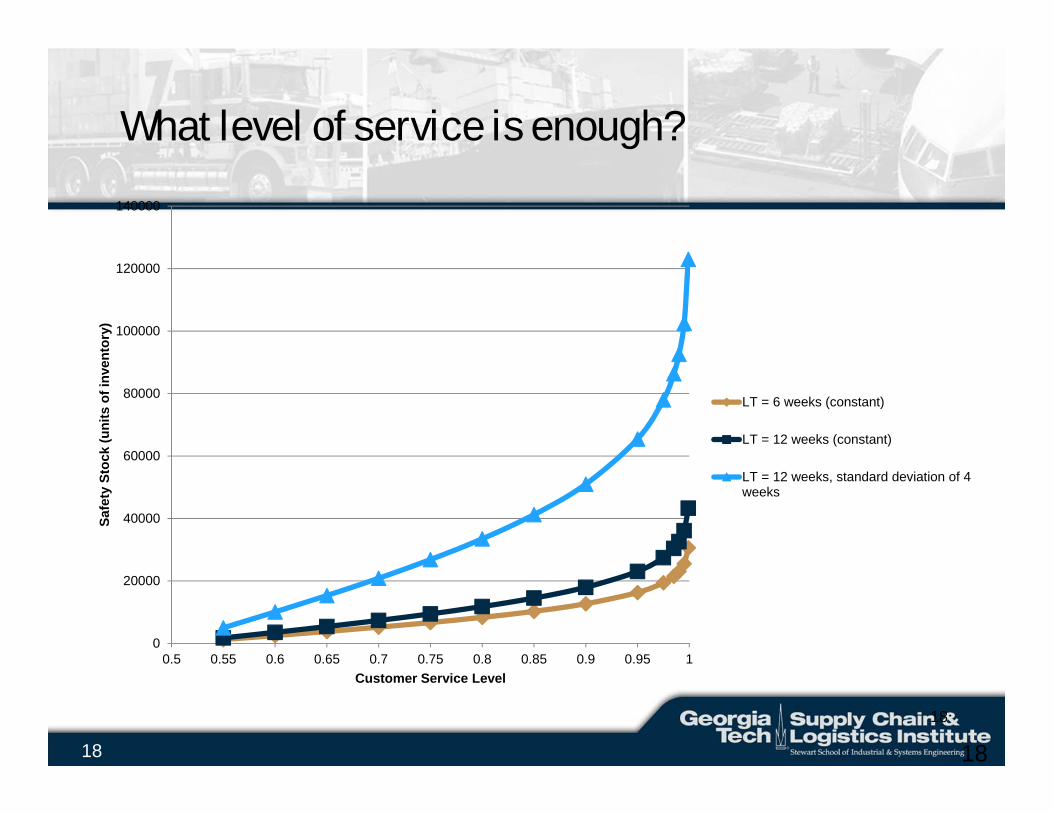
What level of service is enough?
0
20000
40000
60000
80000
100000
120000
140000
0.5 0.55 0.6 0.65 0.7 0.75 0.8 0.85 0.9 0.95 1
Safe
ty S
tock
(uni
ts o
f inv
ento
ry)
Customer Service Level
LT = 6 weeks (constant)
LT = 12 weeks (constant)
LT = 12 weeks, standard deviation of 4weeks
18
19
Question…
What level of “service” is acceptable to you when you go grocery shopping (i.e., percentage of time that the item you want is out of stock)?
A. 0% to 5%B. 6% to 10%C. Greater than 10%
20
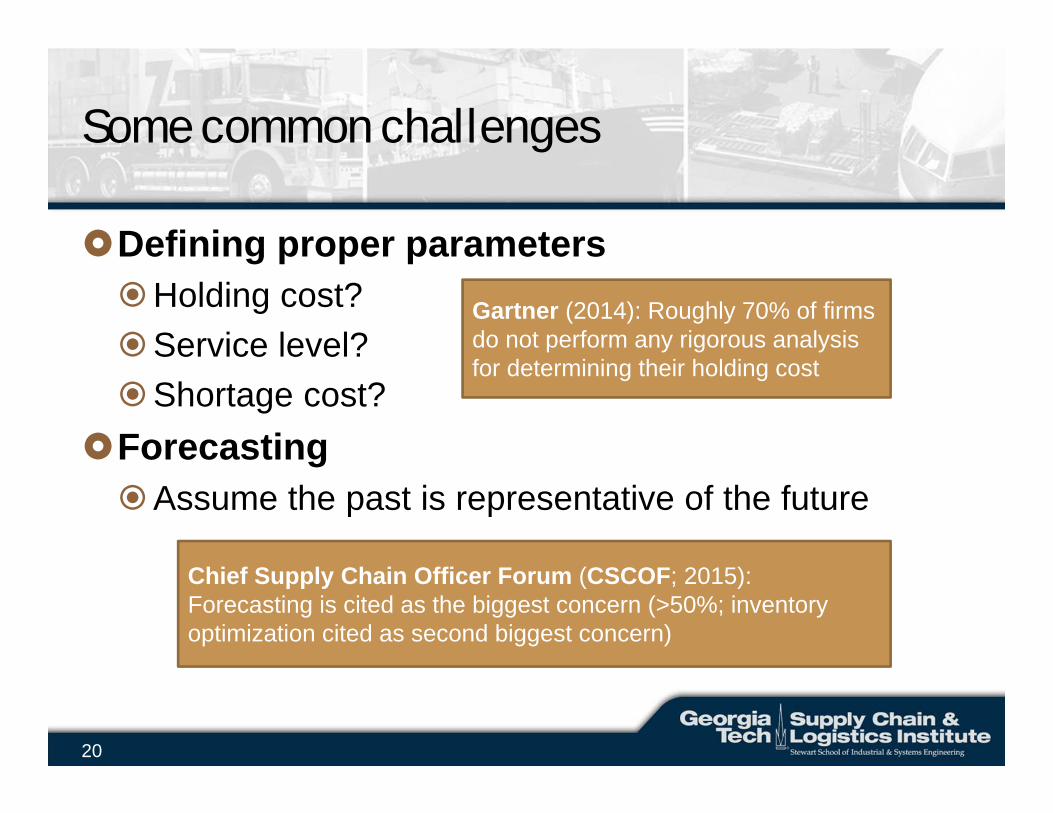
Some common challenges
Defining proper parametersHolding cost?Service level?Shortage cost?
Forecasting Assume the past is representative of the future
Gartner (2014): Roughly 70% of firms do not perform any rigorous analysis for determining their holding cost
Chief Supply Chain Officer Forum (CSCOF; 2015): Forecasting is cited as the biggest concern (>50%; inventory optimization cited as second biggest concern)
21
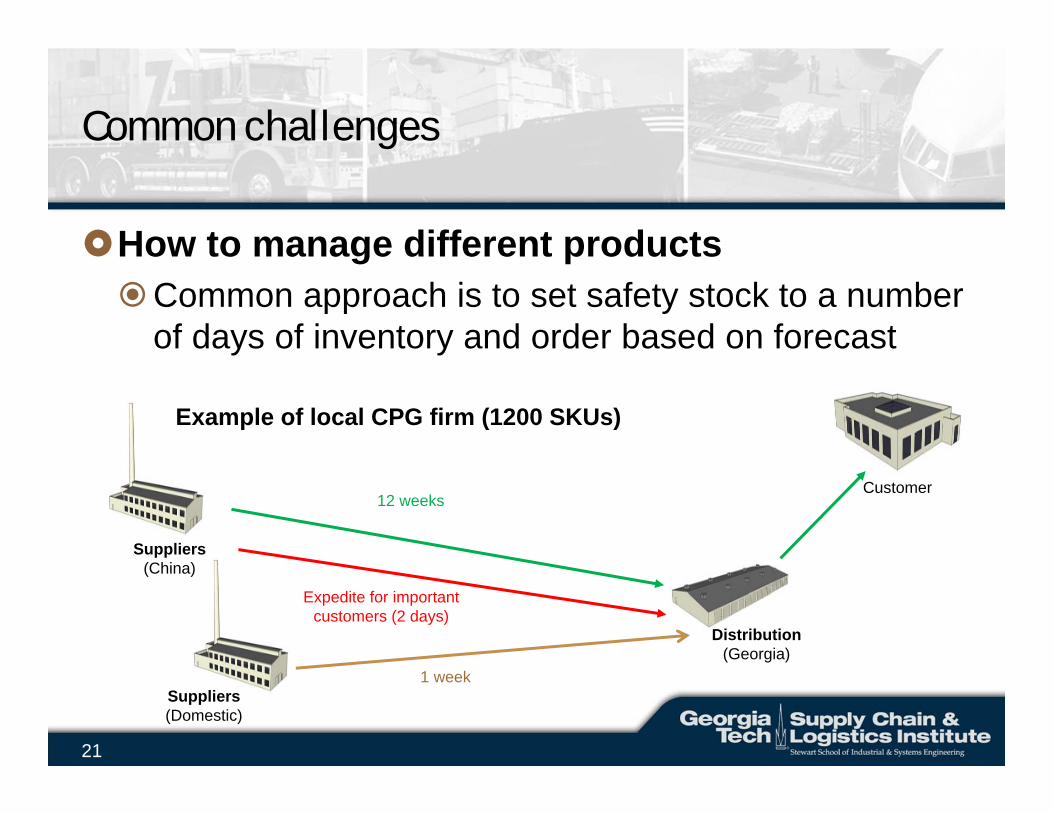
Common challenges
How to manage different productsCommon approach is to set safety stock to a number
of days of inventory and order based on forecast
Distribution(Georgia)
Customer
Expedite for important customers (2 days)
Suppliers(China)
12 weeks
Example of local CPG firm (1200 SKUs)
Suppliers(Domestic)
1 week
22
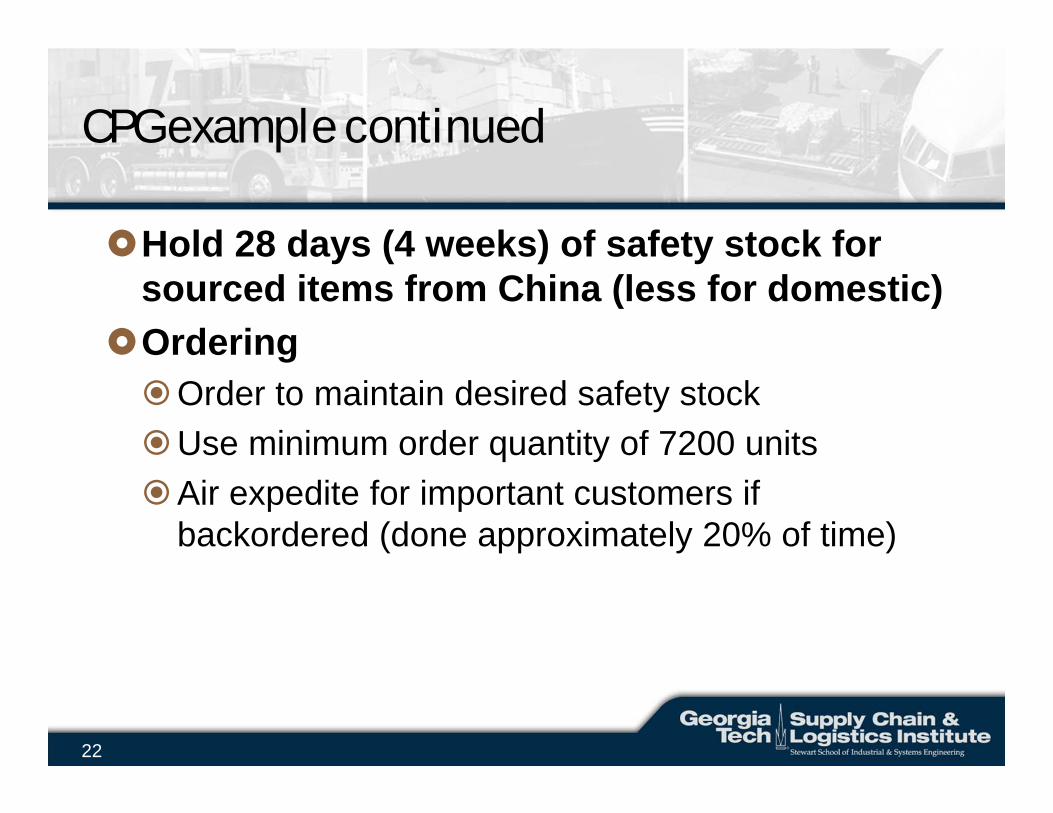
CPG example continued
Hold 28 days (4 weeks) of safety stock for sourced items from China (less for domestic)
OrderingOrder to maintain desired safety stockUse minimum order quantity of 7200 unitsAir expedite for important customers if
backordered (done approximately 20% of time)
23
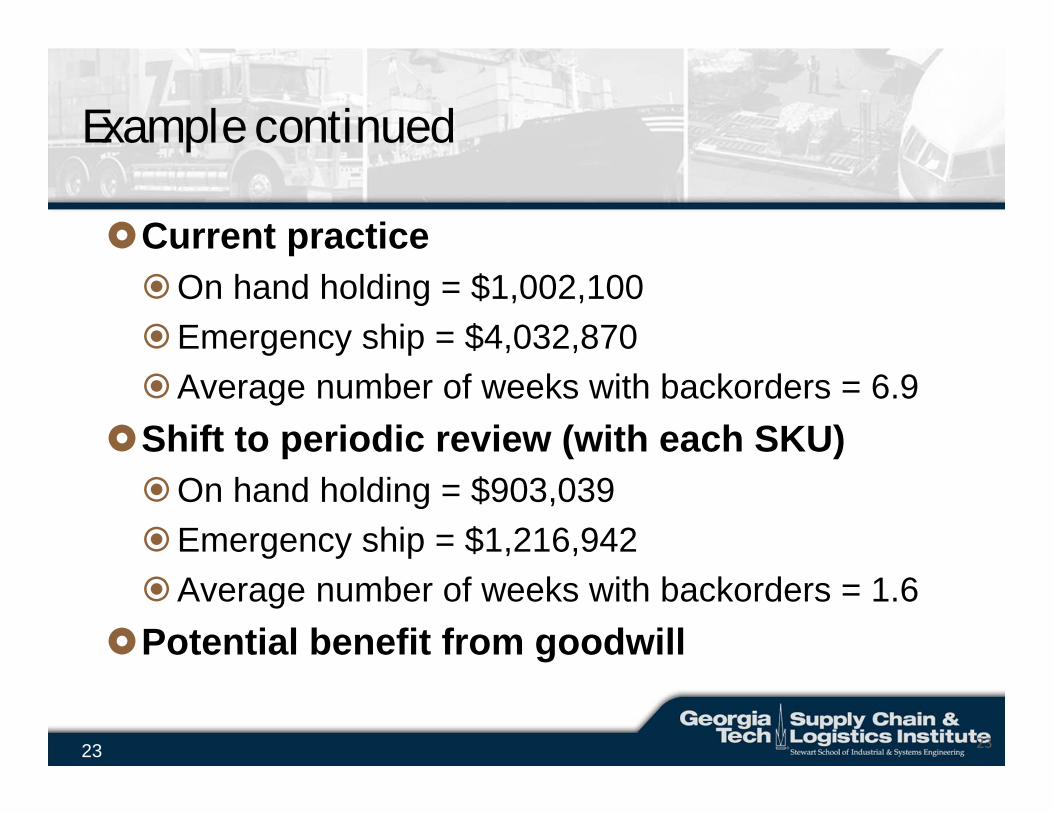
Current practiceOn hand holding = $1,002,100Emergency ship = $4,032,870Average number of weeks with backorders = 6.9
Shift to periodic review (with each SKU)On hand holding = $903,039Emergency ship = $1,216,942Average number of weeks with backorders = 1.6
Potential benefit from goodwill
Example continued
23
24
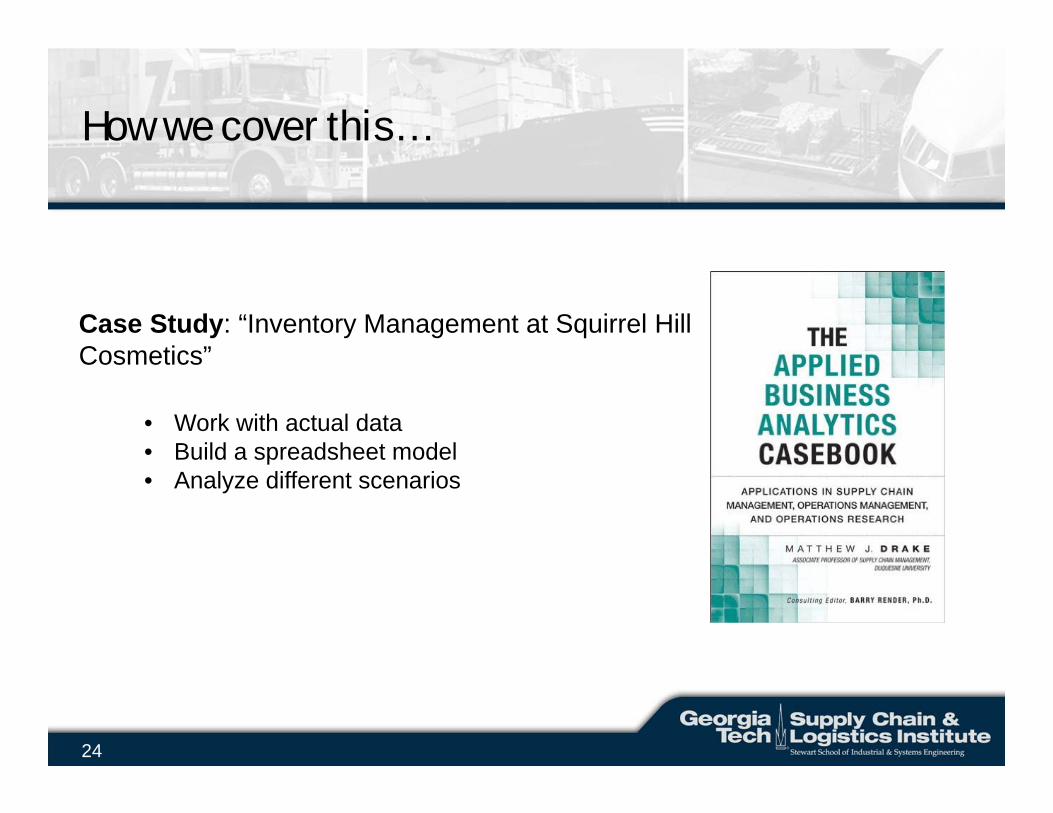
How we cover this…
Case Study: “Inventory Management at Squirrel HillCosmetics”
• Work with actual data• Build a spreadsheet model• Analyze different scenarios
25
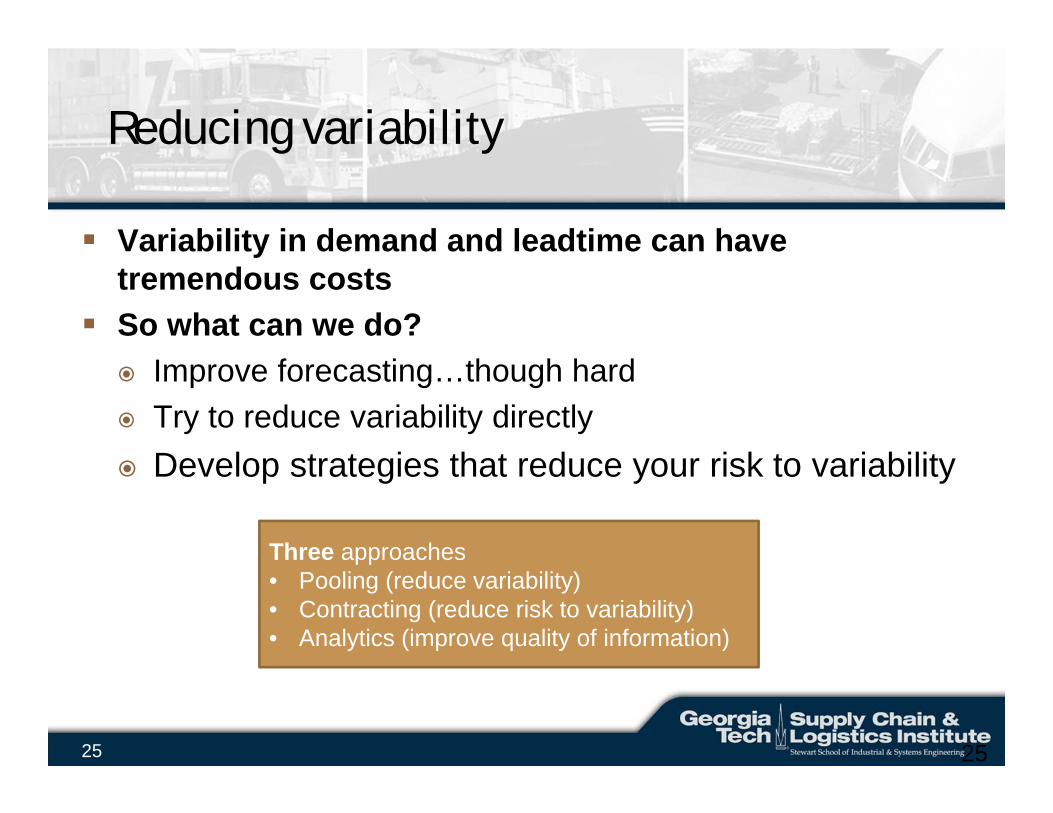
Reducing variability
Variability in demand and leadtime can have tremendous costs
So what can we do? Improve forecasting…though hard Try to reduce variability directly Develop strategies that reduce your risk to variability
25
Three approaches• Pooling (reduce variability)• Contracting (reduce risk to variability)• Analytics (improve quality of information)
26
Local firm example
Firm supplies goods to Wal-Mart, Target, CVS, and Walgreens (60% of business, 500 customers)
DC manages approximately 1000 SKUsEach of the big 4 customers have unique
packaging requirementsLeadtime to DC from China is 10 weeks (0.2
weeks packaging and 9.8 weeks transit)
27
Example continued
Incident in June for one of the SKUsCVS runs a promotion that you weren’t informed of,
and wants 30,000 more than you have in stock In response, Wal-Mart, Walgreens, and Target each
order 10,000 less than anticipatedWhat can be done?
28
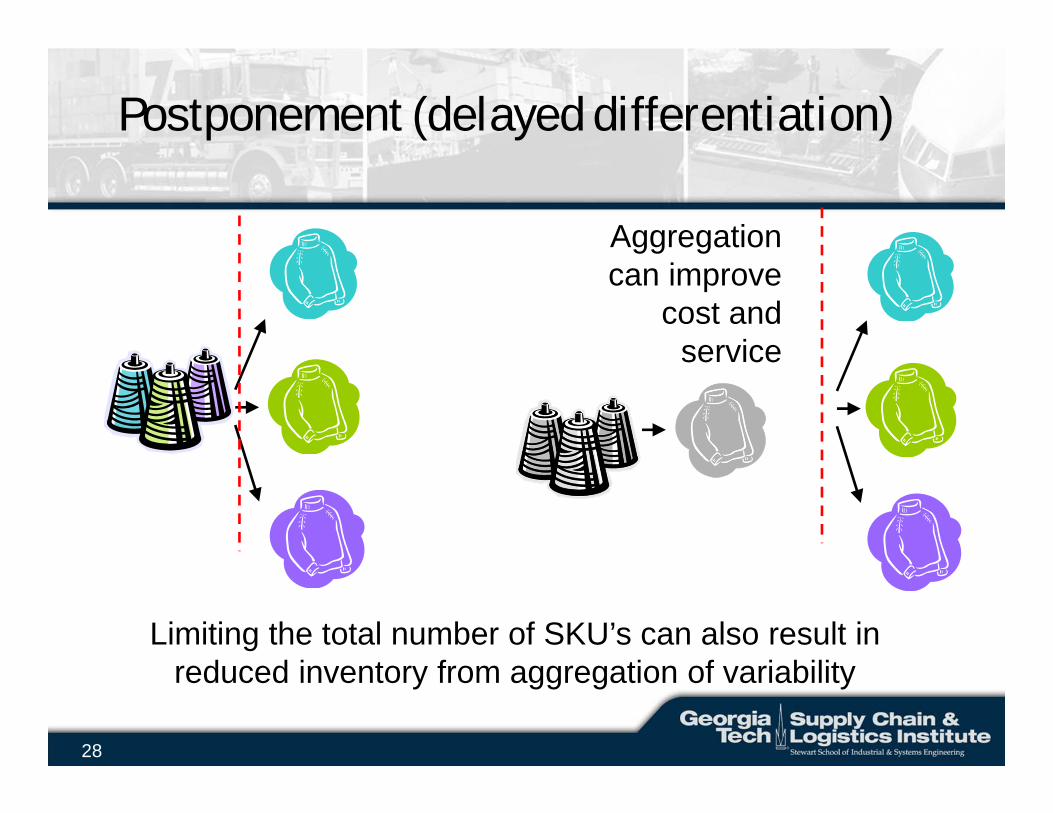
Postponement (delayed differentiation)
Aggregation can improve
cost and service
Limiting the total number of SKU’s can also result in reduced inventory from aggregation of variability
29
Question…
If we could “postpone” packaging to the DC, how much reduction in safety do you think we could achieve?
A. 0% to 25%B. 25% to 50%C. Greater than 50%
30
Example continued
If we could “postpone” packaging to the DC, there would be two effectsReduction in customer-specific leadtime (goes
from 10 weeks to 0.2 weeks)Reduction in required safety stock
We get a safety stock reduction of over 50% If there were no unique packaging, the reduction
would be 89%
31
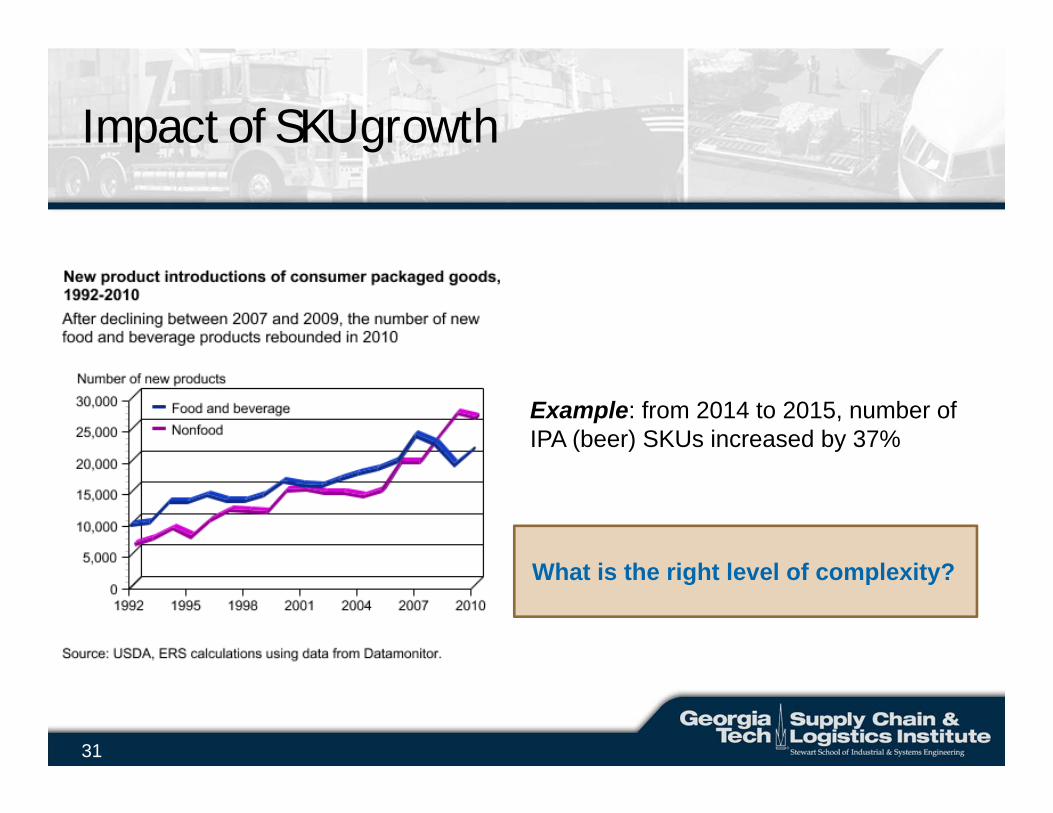
Impact of SKU growth
What is the right level of complexity?
Example: from 2014 to 2015, number ofIPA (beer) SKUs increased by 37%
32
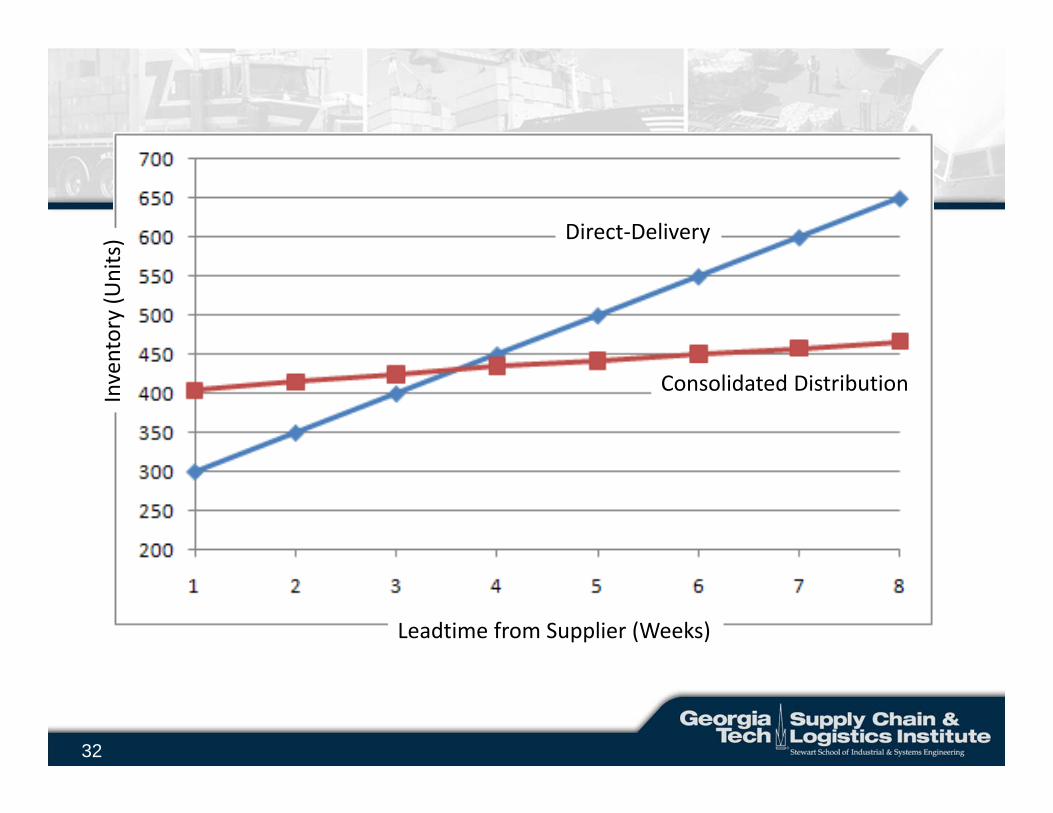
Leadtime from Supplier (Weeks)
Inventory (Units)
Consolidated Distribution
Direct‐Delivery
33
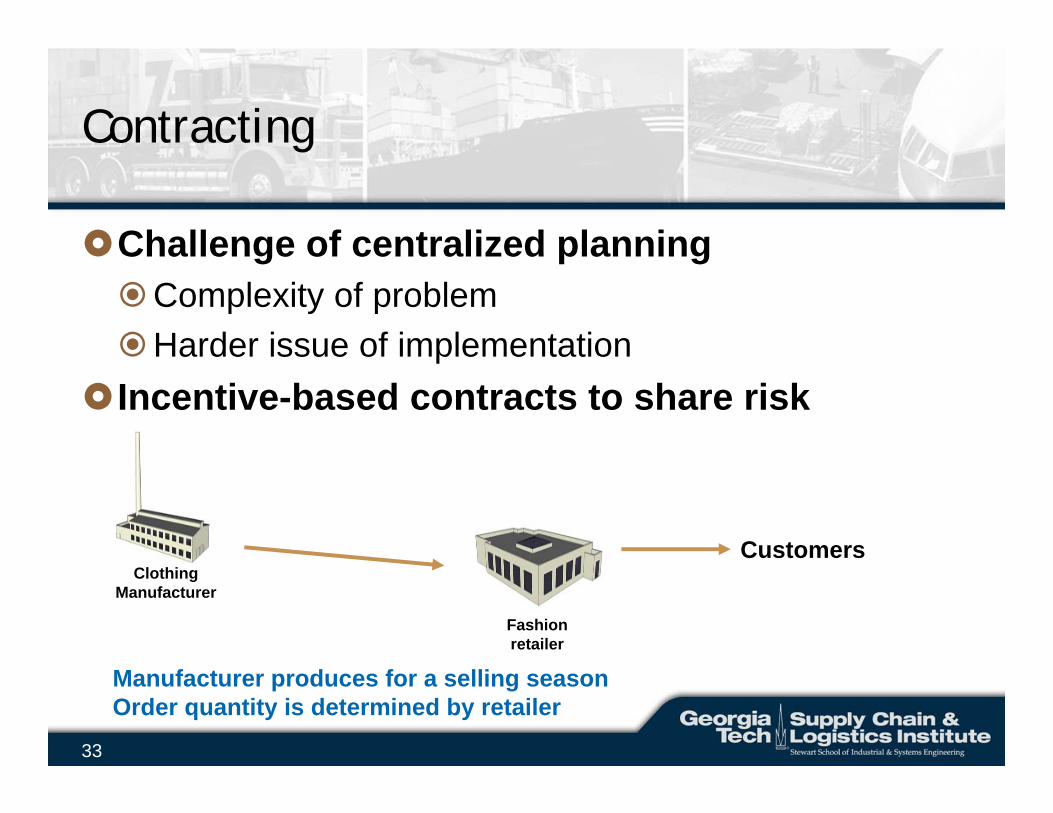
Contracting
Challenge of centralized planningComplexity of problemHarder issue of implementation
Incentive-based contracts to share risk
Fashion retailer
ClothingManufacturer
Customers
Manufacturer produces for a selling seasonOrder quantity is determined by retailer
34
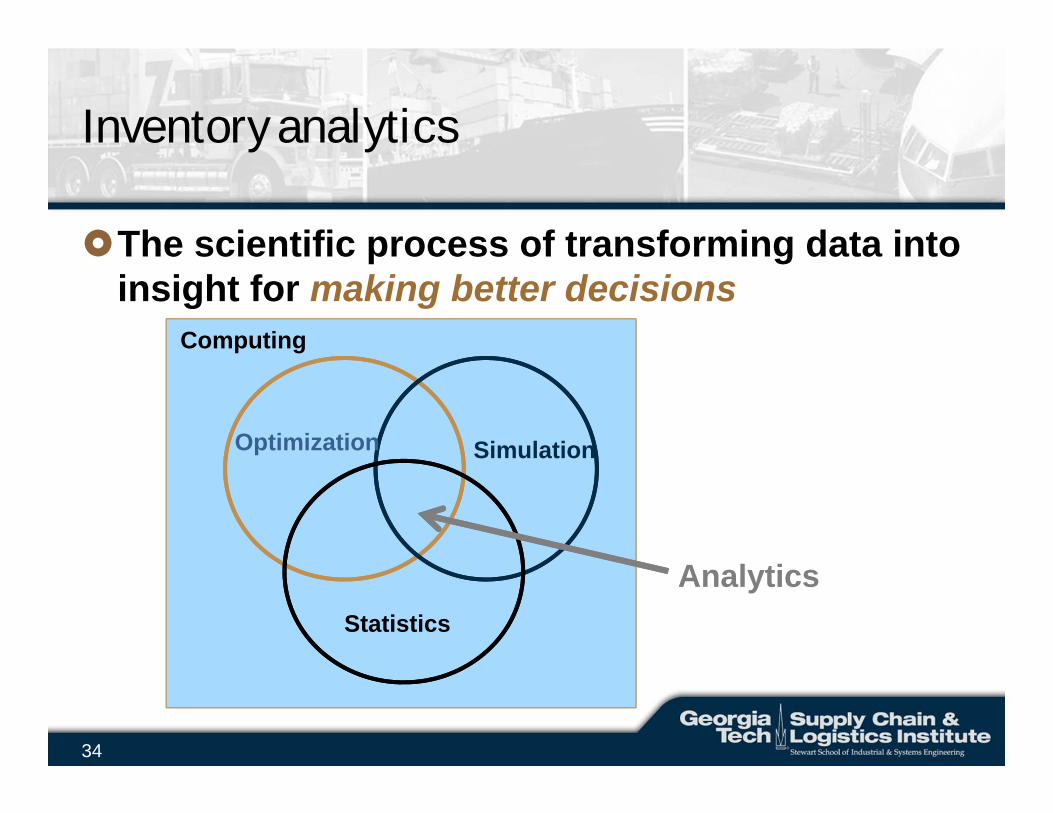
Inventory analytics
The scientific process of transforming data into insight for making better decisions
Optimization
Statistics
Simulation
Analytics
Computing
35
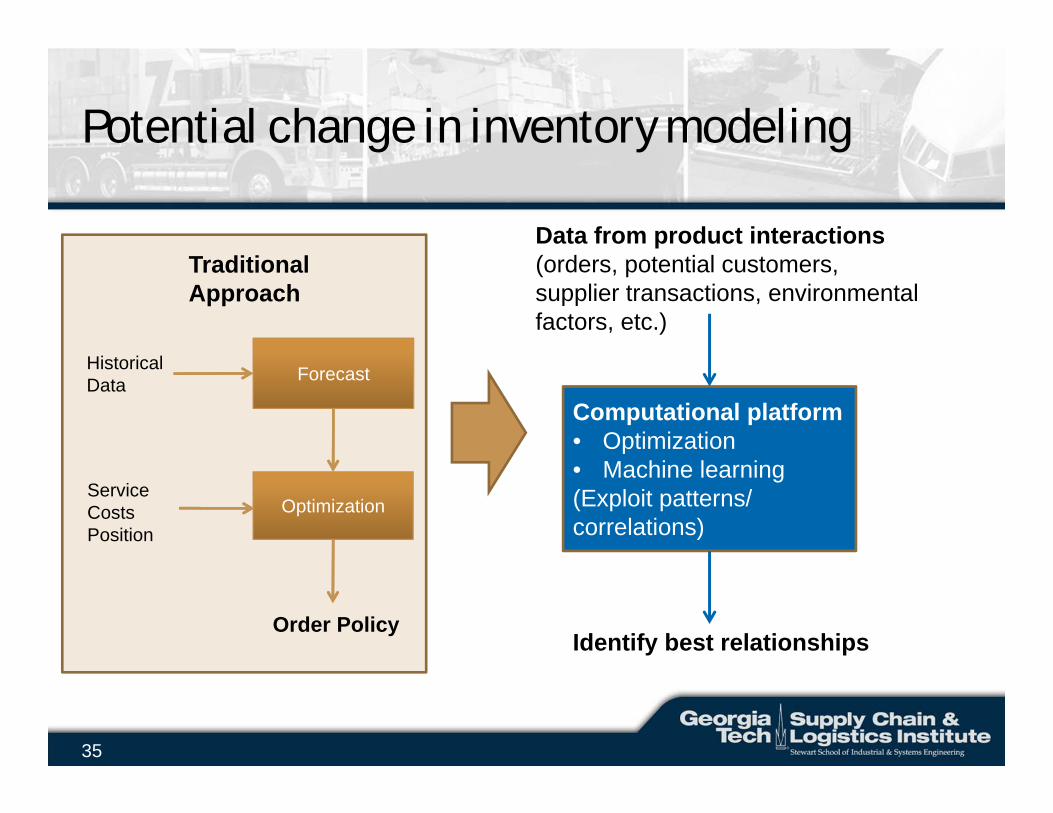
Potential change in inventory modeling
TraditionalApproach
ForecastHistoricalData
OptimizationServiceCostsPosition
Order Policy
Computational platform• Optimization• Machine learning(Exploit patterns/ correlations)
Data from product interactions(orders, potential customers, supplier transactions, environmentalfactors, etc.)
Identify best relationships
36
Potential benefits
Doesn’t completely rely on a-priori dataAbility to “learn” dynamicallyAdjusts value of information by latencyCan support multiple objectives
Currently, most applications help with visualization
37
Challenges
Lack of good dataWillingness to share data (privacy/security)Systems are complex (decisions)Computational resource requirementsVelocity of data and not just volumeWho is going to pay for the support?
Getting the underlying assumptions correctWhat are the right questions?
38
Summary
Effective inventory management involves balancing key trade-offs Reductions of safety stock (without changes in service level) can
be achieved by reducing leadtime or variability Good inventory policies require good information Relationships and technology can improve these factors
Contracting/risk sharing
Pooling/technology
Big/wide data and analytics
38

39
www.scl.gatech.edu/invmgmt
Supply Chain Management (SCM) Certificate
Sept 22-24, 2015 | GT Global Learning Ctr (Atlanta, GA)
Inventory Planning and Management
Paul GriffinProfessor, Stewart School of Industrial & Systems EngineeringLecturer, Supply Chain and Logistics Institute
Webinar: Challenges and Opportunities in Inventory Management Optimize the use of inventory throughout the Supply Chain