Embed Size (px)
Citation preview
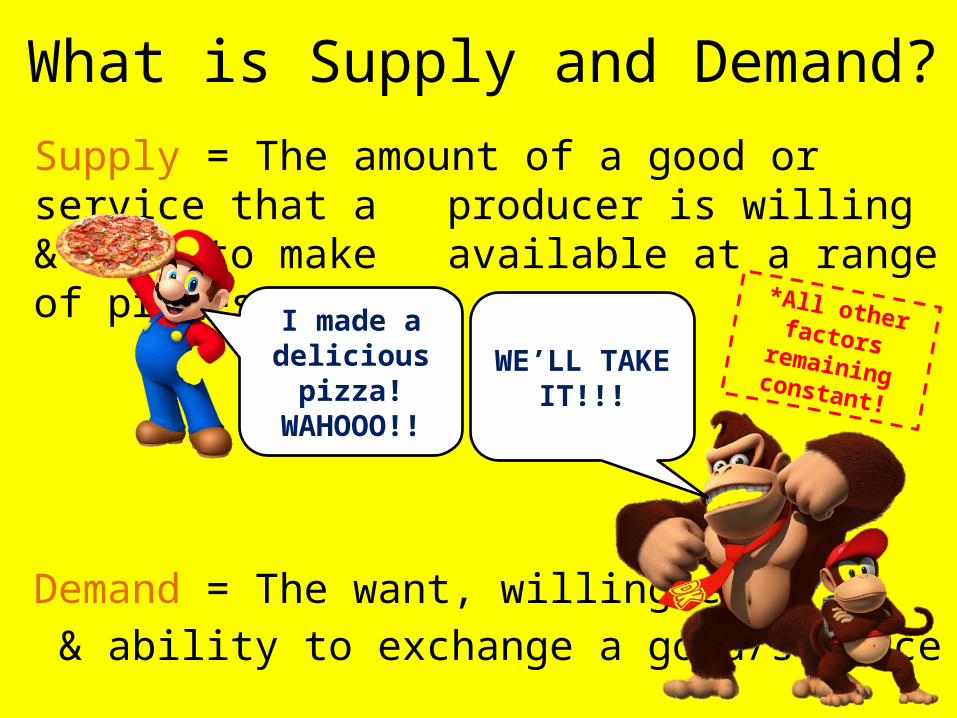
What is Supply and Demand?
Supply = The amount of a good or service that a producer is willing & able to make
available at a range of prices
Demand = The want, willingness & ability to exchange a good/service
I made a delicious pizza!
WAHOOO!!
WE’LL TAKE IT!!!
*All other factors remaining constant!

Graphing Supply and Demand
Economic charts are always graphed in this manner:
Supply
DemandPRIC
E
QUANTITY (AMOUNT)D is for down
Sup (S = up)

Balancing the BudgetIn order for buyers and sellers to be satisfied with a purchase, a balance must be made.
Equilibrium Point = The quantity of a supplied good meets the demand! (both the buyer and seller are satisfied)
My goal is to sell my pizza for as much
money as people are willing to pay
$1 is the perfect price for me! Any
more and I’ll go eat something else.
Looks like $1 is the perfect price!

Graphing Equilibrium Point
Equilibrium Supply Point
Demand
PRIC
E
QUANTITY (AMOUNT)

What Happens If…
If the price of a good is too LOW, a shortage occurs
If the price of a good is too HIGH, a surplus occurs.
I should never have charged $50 per pizza…now NOBODY will buy my food and I have all
these extra pizzas!
Come and get it! Pizza for a nickel!
We ALL want pizza since the price is so
low!Oh no, I don’t have
enough pizza for ALL these guys!

Graphing a Shortage
Equilibrium Supply Point
DemandPRIC
E
QUANTITY (AMOUNT)
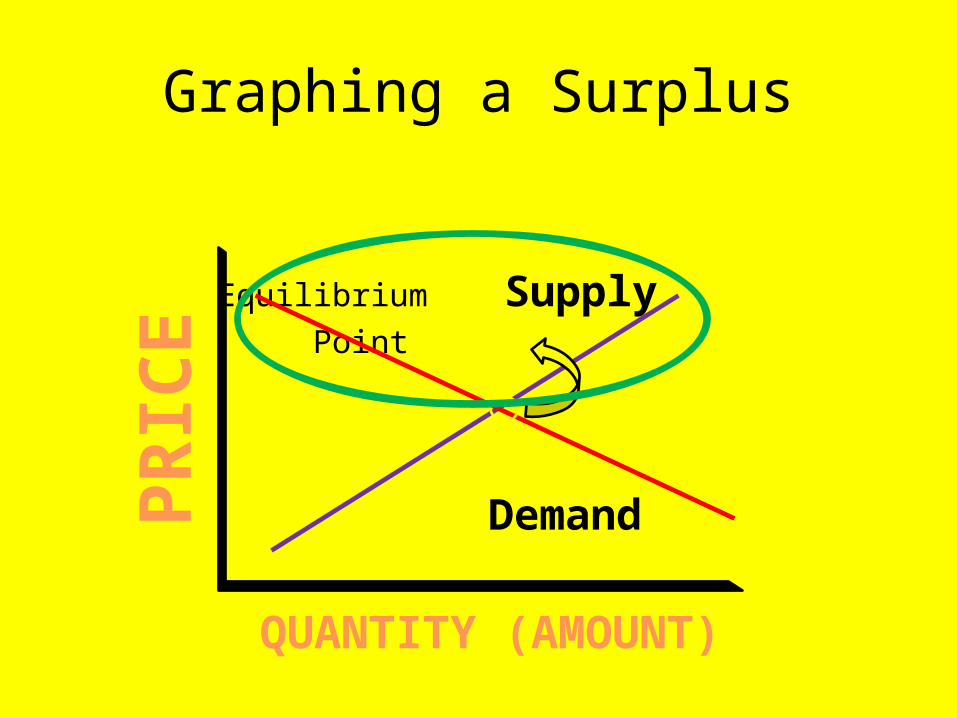
Graphing a Surplus
Equilibrium Supply Point
DemandPRIC
E
QUANTITY (AMOUNT)

Price Relationships to Know:• LAW OF DEMAND = INVERSE RELATIONSHIP– Price increase = quantity demanded decrease– Price decrease = quantity demanded increase
• Ex: you go to the store for ice cream & it’s $1 a bar. You buy 10! You go back the next day, it’s $5 a bar….. WOAH! Now, you only buy 2 (your demand is less)
• LAW OF SUPPLY = DIRECT RELATIONSHIP*put your producer hat on!*
– Price increase = quantity supplied increases– Price decrease = quantity supplied decreases
• Ex: I own a pizza place. Every other pizza place in Newtown just went from selling pizza for $10 to selling it for $20. Before people realize that’s RIDICULOUS – I want to stock up on as many pizzas as possible to sell (it’s not going to last).
What does “law” mean
?

RECOGNIZE THE DIFFERENCE!PR
ICE
QUANTITY (AMOUNT)
PRIC
E
QUANTITY (AMOUNT)
PRIC
E
QUANTITY (AMOUNT)
PRIC
E
QUANTITY (AMOUNT)
A SHIFT in demand
S
S
D
D
S S
D D
A SHIFT in supply
PRIC
E
QUANTITY (AMOUNT)
PRIC
E
QUANTITY (AMOUNT)
A change in QUANTITY demanded
S S
D D
A change in QUANTITY supplied

What Happens If…If there is an INCREASE in demand, the demand curve moves RIGHT. How do we reach a new Equilibrium Point?
Equilibrium Supply Point
D2 D1
PRIC
E
QUANTITY (AMOUNT)

What Happens If…If there is a DECREASE in demand, the demand curve moves LEFT. How do we reach a new Equilibrium Point?
Equilibrium Supply Point
D1
D2
PRIC
E
QUANTITY (AMOUNT)
The same is true for the Supply Curve!
If there is an INCREASE in supply, the supply curve moves
RIGHT.
If there is a DECREASE in supply, the supply curve moves
LEFT