Embed Size (px)
Citation preview

SUPPLY AND DEMAND: AN INTRODUCTION
Chapter 3 in Frank and Bernanke

Purpose of Lecture
• Review price formation in markets and market equilibrium through interaction of supply and demand curves
• Central Planning vs. Markets• Demand Curve• Supply Curve• Market Equilibrium• 3 Steps to Analyzing Changes in
Equilibrium

Central Planning vs. Markets
• How to organize economic activities in societies?
• Two basic options: 1. Central planning 2. Markets

• Central Planning Major economic decisions made centrally, by
individual or small group of individuals, on behalf of a larger group
The case for most of history with clans, tribes, extended families, empires
Centralized Economic Organizations• Agrarian society• Former Soviet Union• Cuba, North Korea• China• Bureaucracy

• Markets Production and distribution decisions left to
individuals interacting in private markets Market or capitalist economies
• Mixed economies• Social control over markets
Decentralized decision-making by individuals Coordination of decisions through markets Prices from the different markets signal
information and the individual choices to coordinate this decentralized behavior

• Market A market consists of all buyers and sellers of
a good or service Buyers as a group determine demand for the
product Sellers as a group determine the supply of the
product
• Competitive Market Market in which there are many buyers and
many sellers, so that each has a negligible impact on the market price

• Conservation and Management of Resources and Environment by Principle of Central Planning or Markets Command-and-control regulations vs. market-based Analogous to central planning vs. markets Market-Based
Give decentralized decision-making by economic agents involved
Economic agents more likely to face full social costs of their decisions
Give positive economic incentives
Command-and-Control Sometimes necessary

Demand
• Quantity demanded The amount of a good that buyers are willing
and able to purchase
• Law of Demand Quantity demanded is inversely related to
price, all other things equal (held constant)• As price rises, quantity demanded falls• As price falls, quantity demanded rises

• Demand Schedule Table showing the quantity of a good that
buyers wish to buy at each price
Price of Good ($/kg) Quantity of Good (kg)
---------------------------- --------------------------------
0 10
1 9
2 8
3 7

Demand CurveGraph of the relationship between the price of a good and
the quantity demanded
Figure 3.1

Demand CurveFigure 3.1
8 12 16
The buyers reservation price: The highest price the buyer would be willing to pay for a good4
2
3
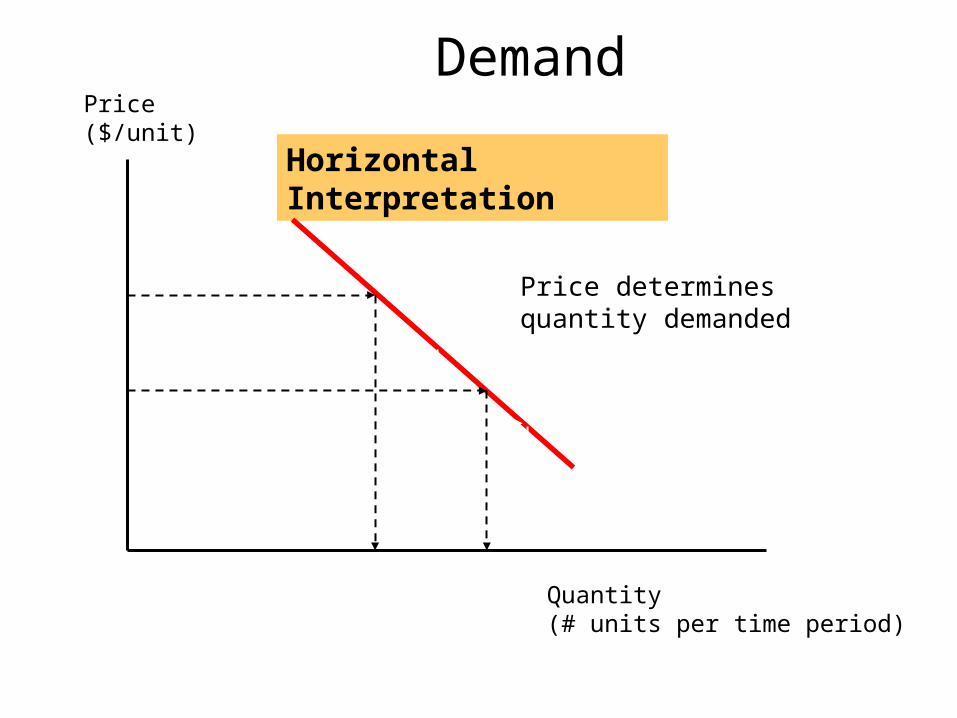
Demand
Horizontal Interpretation
Price determines quantity demanded
Price($ per slice)
4
2
3
8 12 16
Demand
Price($/unit)
Quantity(# units per time period)
Price determines quantity demanded
Price determines quantity demanded

Demand
Vertical Interpretation
Quantity measures the marginal buyer’s reservation price
Price($ per slice)
4
2
3
8 12 16
Demand
Quantity measures the marginal buyer’s reservation price
Quantity measures the marginalbuyer’s reservation price
Price($/unit)
Quantity(# units per time period)

• Distinguish Between A change in the quantity demanded
• A movement along the demand curve that occurs in response to a change in price
A change in demand• A shift of the entire demand curve• Caused by change in factors of demand that are
otherwise held constant when examine price-quantity demanded relationship

• Movements Along The Demand Curve Changes in the price of the good or service lead to movements
along the demand curvePrice ($/kg)
P0
P1
Q0 Q1 Quantity demanded (kg per time period)

• Shifts in the Demand Curve
Price ($/kg)
D1
D0
D2
Quantity demanded ($/kg)
Increase in demand
Decrease in demand
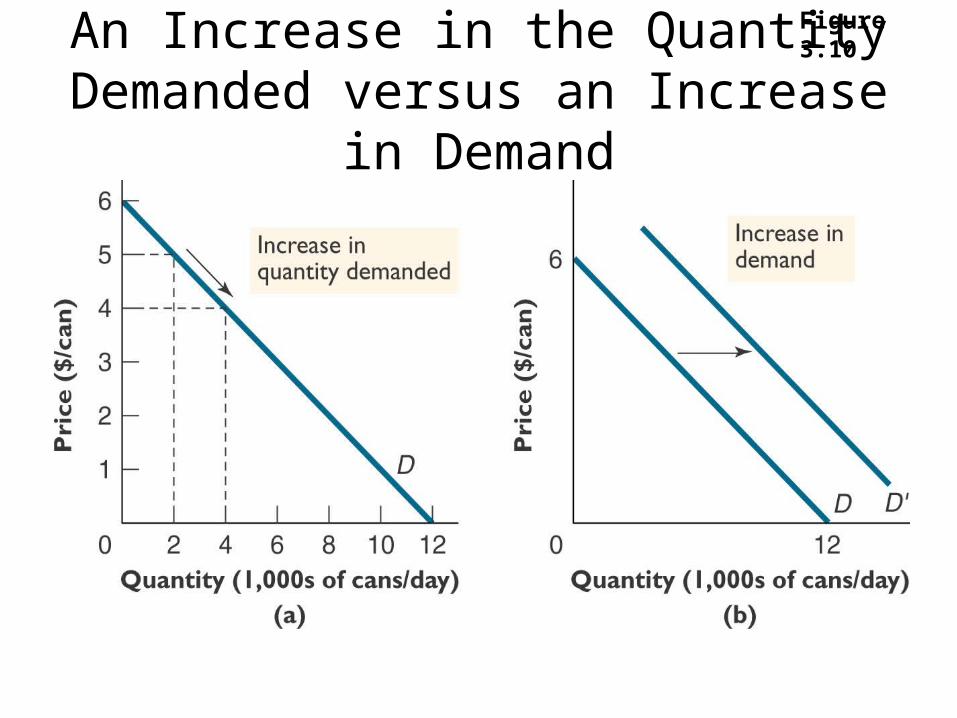
An Increase in the Quantity Demanded versus an Increase in
Demand
Figure 3.10

• Variables That Can Shift Demand Curve Income
• Normal good A good for which, other things equal, an increase in
income leads to an increase in demand
• Inferior good A good for which, other things equal, an increase in
income leads to a decrease in demand
• The Income Effect The change in the quantity demanded of a good that
results because a change in the price of a good changes the buyer’s purchasing power

• Variables That Shift Demand, Cont’d. Prices of Related Goods
• Substitutes Two goods for which an increase in the price of one
leads to an increase in the demand for the other. Substitutes are often pairs of goods that are used in
place of each other, such as coffee and tea.
• Complements Two goods for which an increase in the price of one
leads to a decrease in the demand for the other. Complements are often pairs of goods that are used
together, such as gasoline and automobiles.

Variables That Shift Demand, Cont’d.
• Variables That Shift Demand, Cont’d. Prices of Related Goods, Cont’d.
• The Substitution Effect The change in the quantity demanded of a good that
results because buyers switch to substitutes when the price of the good changes

Variables That Shift Demand, Cont’d.
• Tastes and Preferences Most obvious determinant of consumer
demand
• Expectations Expectations about future may affect
consumer demand for a good or service today
• Number of Buyers The more buyers of a good or service, the
greater the market demand.

Variables That Influence Buyers
Variable A Change in This Variable …
Price Represents a movement along the demand curve
Income Shifts the demand curve
Prices of related goods Shifts the demand curve
Tastes and preferences
Shifts the demand curve
Expectations Shifts the demand curve
Number of buyers (Population)
Shifts the demand curve

Supply
• Quantity supplied The amount of a good or service that sellers
are willing and able to sell
• Law of Supply Quantity demanded is positively related to
price, all other things equal (held constant)• As price rises, quantity supplied rises• As price falls, quantity supplied rises

• Supply Schedule A table that shows the relationship between
the price of a good and the quantity supplied
Price of Good ($/kg) Quantity of Good (kg)
---------------------------- --------------------------------
1 7
2 8
3 9
4 10
5 11

Supply CurveA graph of the relationship between the price of a good and
the quantity supplied
Figure 3.2

• Seller’s Reservation Price The smallest dollar amount for which a seller
would be willing to sell an additional unit Generally equal to marginal cost
Quantity
Price Supply
Reservation price for 10th unit
105
Reservation price for 5th unit

Supply
Price($ per slice)
4
2
3
8 12 16
Supply
Horizontal Interpretation
Shows the quantity produced
for each price
Price($/unit)
Quantity(# units per time period)

Supply
Price($ per slice)
Quantity(1000s of slices per day)
4
2
3
8 12 16
Supply
Vertical Interpretation
Shows the marginal cost (reservation
price) for producing each additional unit
Quantity(# units per time period)
Price($/unit)

• Movements Along The Supply Curve Changes in the price of the good or service lead to movements
along the supply curvePrice ($/kg)
P1
P0
Q0 Q1 Quantity supplied ($/kg)

• Shifts in the Supply CurvePrice ($/kg) S1
S0
S2
Quantity supplied (kg)
Increase in supply
Decrease in supply

• Variables That Can Shift The Supply Curve Input Prices
• Increase in price of an input raises costs and makes production less profitable, thereby lowering supply (and shifting supply curve in)
• Decrease in price of an input lowers costs and makes production more profitable, thereby increasing supply (and shifting supply curve out)
Technology• Technical progress lowers costs and makes production more
profitable, thereby increasing supply (and shifting supply curve out)
Expectations Number of Sellers

Variables That Influence Sellers
Variable A Change in This Variable …
Price Represents a movement along the supply curve
Input prices Shifts the supply curve
Technology Shifts the supply curve
Expectations Shifts the supply curve
Number of buyers Shifts the supply curve

Market Equilibrium: Supply and Demand Together
Price ($/kg)
S
D
Quantity (kg/time period)
Equilibrium price
Equilibrium quantity
Equilibrium: Quantity Demand = Quantity Supplied
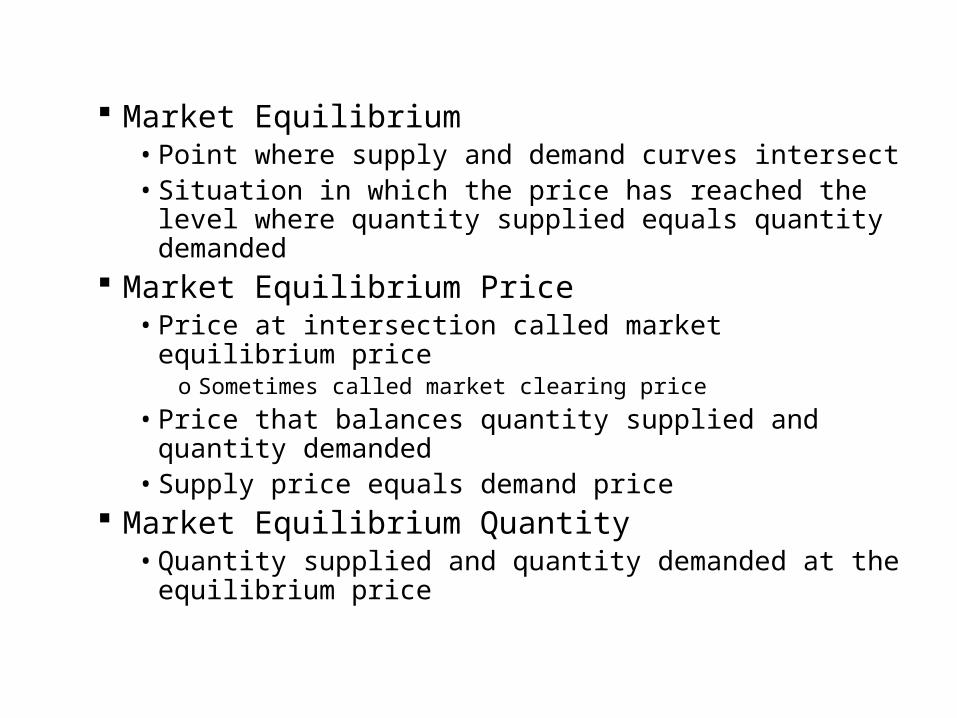
Market Equilibrium• Point where supply and demand curves intersect• Situation in which the price has reached the level
where quantity supplied equals quantity demanded Market Equilibrium Price
• Price at intersection called market equilibrium priceo Sometimes called market clearing price
• Price that balances quantity supplied and quantity demanded
• Supply price equals demand price Market Equilibrium Quantity
• Quantity supplied and quantity demanded at the equilibrium price

• Surplus or Excess Supply Excess quantity supplied at given price Suppliers unable to sell all they want at the
going price Sellers respond by cutting their prices Falling prices, in turn, increase quantity
demanded and decrease quantity supplied Prices continue to fall until the market reaches
equilibrium

• Excess Supply or Surplus Situation in which quantity supplied is greater than the
quantity demanded at given price
Price ($/kg) Supply
Demand
Quantity (kg/time period)
Excess Supply
Quantity demandedQuantity supplied
EquilibriumQuantity
EquilibriumPrice

• Excess Demand or Shortage Situation in which quantity demanded is greater than
the quantity supplied at given price
Price ($/kg) Supply
Demand
Quantity (kg/time period)
Excess Demand
Quantity demandedQuantity supplied
Equilibrium Price
Equilibrium Quantity

• Shortage or Excess Demand Excess quantity demanded at given price Buyers unable to purchase all they want at
the going price• Too many buyers chasing too few goods
Buyers respond by bidding up their prices Sellers respond to shortage by raising their
prices As price rises, quantity demanded falls,
quantity supplied rises Prices continue to rise until the market
reaches equilibrium

• Rent Controls Example of excess demand in market

An Unregulated Housing Market
Figure 3.7
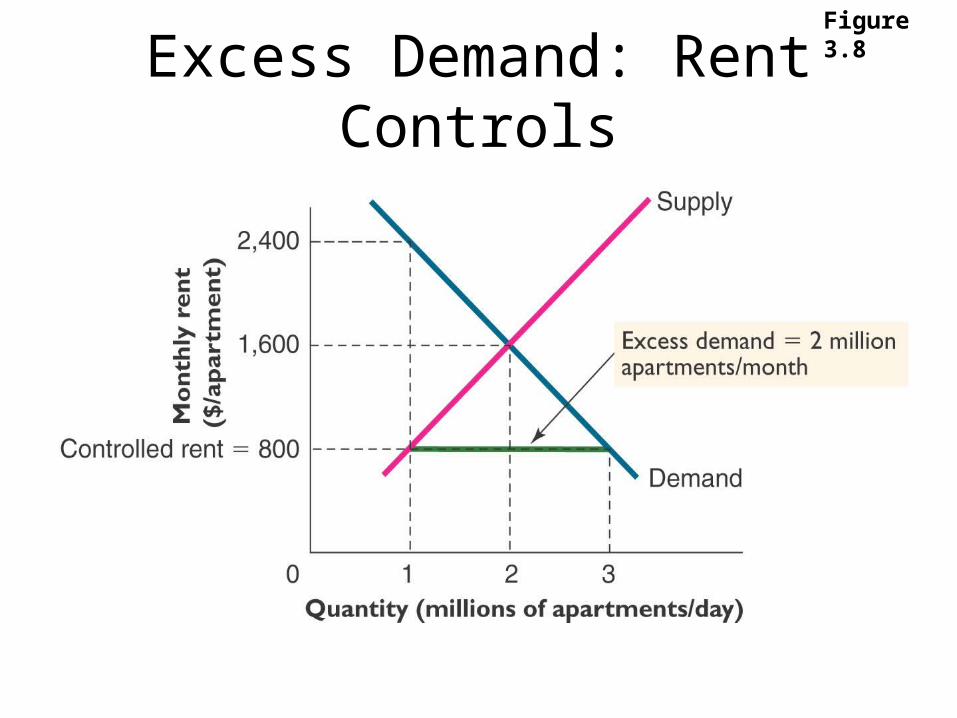
Excess Demand: Rent Controls
Figure 3.8

Example: The Effect of Minimum Wage Legislation on Employment

The Effect of Minimum Wage Legislation on Employment
Figure 13.5

• Law of Supply and Demand Price of any good adjusts to bring the quantity
supplied and quantity demanded for that good into balance

Three Steps to Analyzing Changes in Equilibrium
• 1. Decide whether the event changes supply or demand (or perhaps both)
• 2. Decide in which direction the supply or demand curve shifts
• 3. Use the supply-and-demand diagram to see how the shift changes the equilibrium price and quantity

• Increase in DemandPrice ($/kg) Supply
D1
D0
Quantity (kg)
1. Increase in demand …
2…result in a higher price…
3…and a higher quantity sold.
Initial equilibrium
New equilibrium

• Example of Shift in Demand and Complement Goods Complements Decrease in price of one
causes a rightward shift in demand curve for other
Tennis courts and tennis balls are complements
Decline in court-rental fees shifts demand curve for tennis balls rightward from D to D’

The Effect on the Market for Tennis Balls of a Decline in Court Rentals
Fees
Figure 3.11
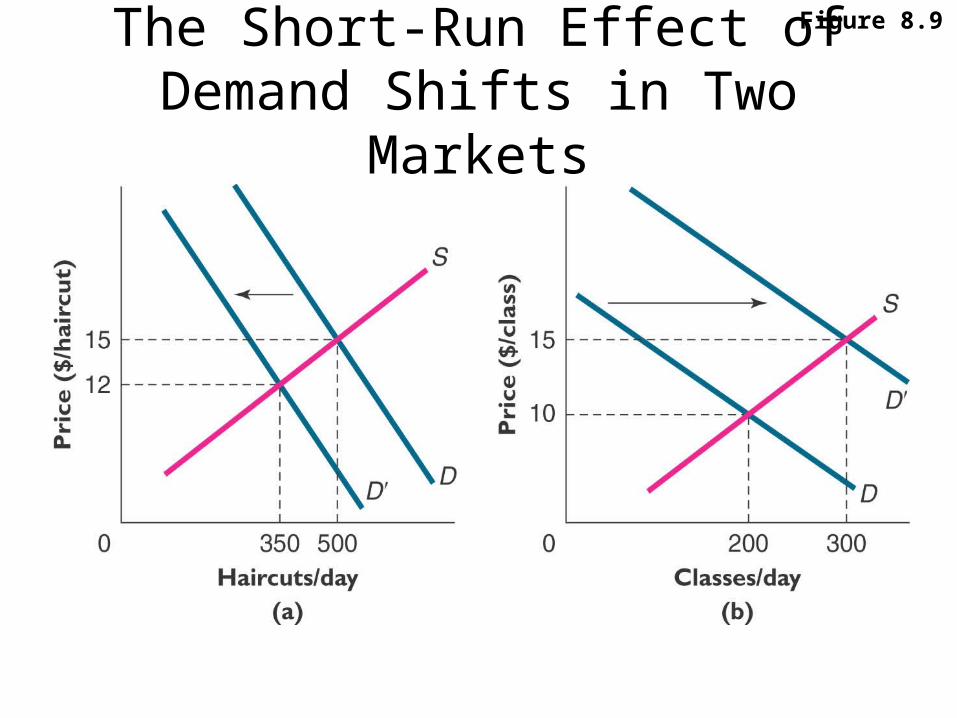
The Short-Run Effect of Demand Shifts in Two Markets
Figure 8.9
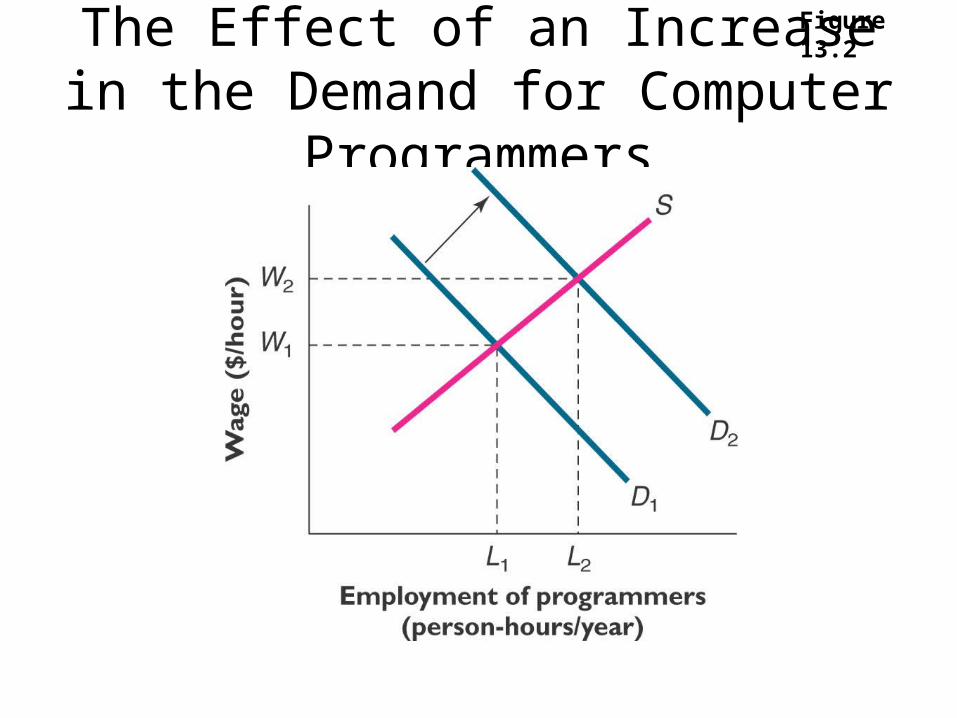
The Effect of an Increase in the Demand for Computer
Programmers
Figure 13.2

• Decrease in SupplyPrice ($/kg) S1
S0
Demand
Quantity (kg)
Initial equilibrium
New equilibrium
1. An increase in an input price reduces
the supply…
2…resulting in a higher price…
3…and a lower quantity sold
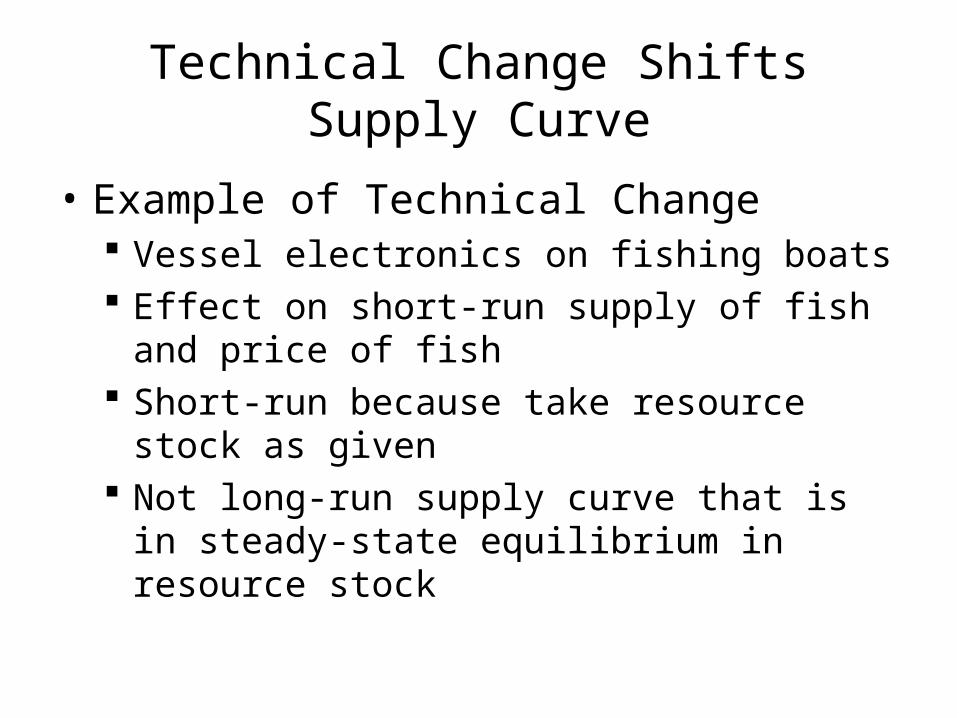
Technical Change Shifts Supply Curve
• Example of Technical Change Vessel electronics on fishing boats Effect on short-run supply of fish and price of
fish Short-run because take resource stock as
given Not long-run supply curve that is in steady-
state equilibrium in resource stock

Technical Change: Vessel Electronics
S0 Initial Supply of Fish
S1 Subsequent Supply of Fish
D
P0
P1
Q0
Price ($/unit)
Q1Quantity/time period

• Increase in Demand and Increase in Supply
Price ($/unit) S1
S0
D1
D0
Quantity (# units/time period)
Initial equilibrium
New equilibrium
P0
P1
Q0 Q1
Large increase in
demandSmall
increase in supply

• Increase in Demand and Decrease in Supply
Price ($/kg) S1
S0
D0
D1
Quantity (kg/time period)
Q0 Q1
P0
P1
New equilibrium
Initial equilibrium
Increase in demand
Decrease in supply
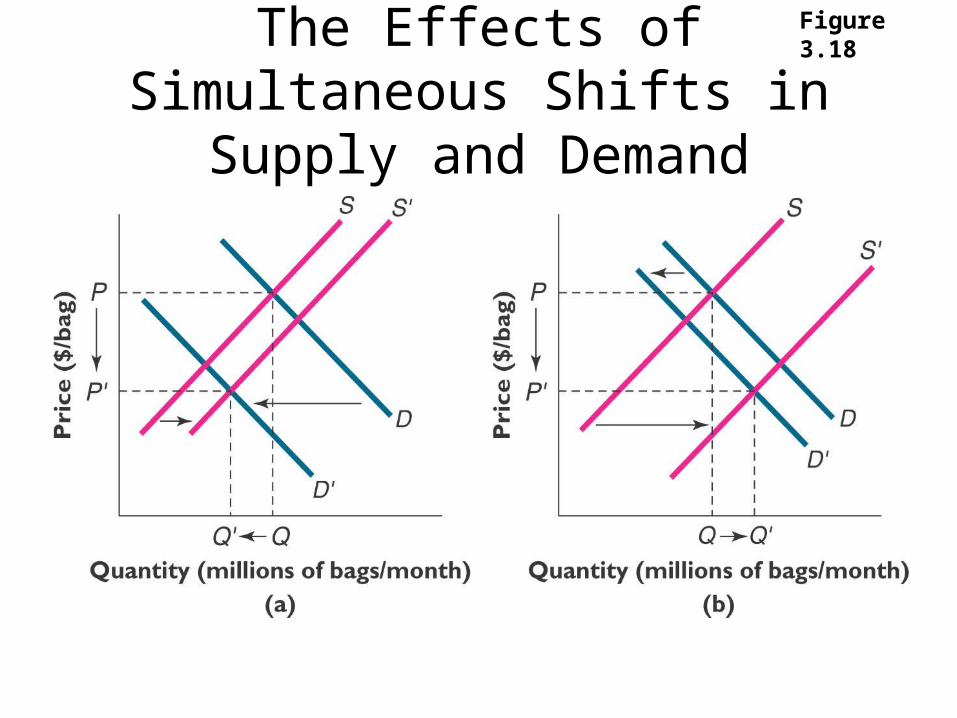
The Effects of Simultaneous Shifts in Supply and Demand
Figure 3.18

Four Rules Governing the Effects of Supply and Demand Shifts
Figure 3.17

What Happens to Price and Quantity When Supply or Demand Shifts?
No Change in Supply
An Increase in Supply
A Decrease in Supply
No Change in Demand
P same P down P up
Q same Q up Q down
An Increase in Demand
P up P ambiguous P up
Q up Q up Q ambiguous
A Decrease in Demand
P down P down P ambiguous
Q down Q ambiguous Q down