Embed Size (px)
Citation preview

lable at ScienceDirect
Nutrition 32 (2016) 1254–1267
Contents lists avai
Nutrition
journal homepage: www.nutr i t ionjrnl .com
Basic nutritional investigation
Supplementation with antioxidant-rich extra virgin olive oilprevents hepatic oxidative stress and reduction of desaturationcapacity in mice fed a high-fat diet: Effects on fatty acidcomposition in liver and extrahepatic tissues
Miguel Angel Rinc�on-Cervera Ph.D. a, Rodrigo Valenzuela Ph.D. a,b,*,Mar�ıa Catalina Hernandez-Rodas M.Sc. b, Macarena Marambio b,Alejandra Espinosa Ph.D. c, Susana Mayer b, Nalda Romero d, Cynthia Barrera, M.Sc. b,Alfonso Valenzuela a, Luis A. Videla M.Sc. e
a Lipid Center, Institute of Nutrition and Food Technology, University of Chile, Santiago, ChilebNutrition Department, Faculty of Medicine, University of Chile, Santiago, ChilecMedical Technology Department, Faculty of Medicine, University of Chile, Santiago, Chiled Faculty of Chemical Sciences and Pharmacy, Department of Food Science and Chemical Technology, University of Chile, Santiago, ChileeMolecular and Clinical Pharmacology Program, Institute of Biomedical Sciences, Faculty of Medicine, University of Chile, Santiago, Chile
a r t i c l e i n f o
Article history:Received 6 February 2016Accepted 22 April 2016
Keywords:Extra virgin olive oilAntioxidantsOxidative stressD;-5/D;-6 desaturase activitiesu-3 long-chain polyunsaturated fatty acid
This study was supported by grant (11140174) from(National) Fund for Scientific and Technological Devthors have no conflicts of interest to declare.* Corresponding author. Tel.: þ56 2 978 6014; fax:
E-mail address: [email protected] (R. V
http://dx.doi.org/10.1016/j.nut.2016.04.0060899-9007/� 2016 Elsevier Inc. All rights reserved.
a b s t r a c t
Objective: The aim of this study was to assess the effect of dietary supplementation with extravirgin olive oil (EVOO) in mice on the reduction of desaturase and antioxidant enzymatic activitiesin liver, concomitantly with long-chain polyunsaturated fatty acids (LCPUFA) profiles in liver andextrahepatic tissues induced by a high-fat diet (HFD).Methods: Male mice C57 BL/6 J were fed with a control diet (CD; 10% fat, 20% protein, 70% car-bohydrates) or an HFD (60% fat, 20% protein, 20% carbohydrates) for 12 wk. Animals were sup-plemented with 100 mg/d EVOO with different antioxidant contents (EVOO I, II, and III).Results: After the intervention, blood and several tissues were analyzed. Dietary supplementationwith EVOO with the highest antioxidant content and antioxidant capacity (EVOO III) significantlyreduced fat accumulation in liver and the plasmatic metabolic alterations caused by HFD andproduced a normalization of oxidative stress�related parameters, desaturase activities, andLCPUFA content in tissues.Conclusions: Data suggest that dietary supplementation with EVOO III may prevent oxidative stressand reduction of biosynthesis and accretion of u-3 LCPUFA in the liver of HFD-fed mice.
� 2016 Elsevier Inc. All rights reserved.
Introduction
The long-chain polyunsaturated fatty acids (LCPUFAs) fromthe u-3 family, eicosapentaenoic acid (EPA; C20:5 u-3) and do-cosahexaenoic acid (DHA; C22:6 u-3), and from u-6 familyarachidonic acid (AA; C20:4 u-6), have multiple and relevantfunctions in the organism [1,2]. EPA plays a role in vascular
the initiation FONDECYTelopment) to RV. The au-
þ56 2 978 6182.alenzuela).
homeostasis and inflammatory response resolution [3], and DHAis a structural component of nerve cells and is actively involvedin brain and visual function development [1]. DHA is also aprotective agent of neurons against neurodegenerative damageand other injuries [1]. Furthermore, EPA and DHA have a jointprotective effect of cardiovascular health [4], whereas AA plays arole in the immune response and brain physiology [5,6].
Nutritional worldwide guidelines recommend specific intakeof u-3 and n-6 LCPUFA, paying special attention to those popu-lation groups with an abnormal physiological status of thesefatty acids [7]. In humans and other mammals, EPA and DHA areobtained from the precursor a-linolenic acid (ALA; C18:3 u-3),whereas AA is obtained from linoleic acid (LA; C18:2 u-6). Both

M. A. Rinc�on-Cervera et al. / Nutrition 32 (2016) 1254–1267 1255
ALA and LA are considered essential fatty acids because theycannot be produced in the human body and therefore must beprovided by the diet [8]. LCPUFA biosynthesis takes place mainlyin the liver through the activity of elongase and desaturase en-zymes [9], which is regulated by hormones and by the finalproducts of enzymatic reactions [10]. Humans and mice withhepatic steatosis and increased systemic and hepatic oxidativestress show a drastic decrease in LCPUFA synthesis andconcomitant diminished LCPUFA accretion in different tissues[11,12].
Extra virgin olive oil (EVOO) is a typical food in the Mediter-ranean diet, and its consumption has been directly associatedwith protection of cardiovascular health protection and pre-vention of cancer and neurodegenerative disorders, which sup-port the recommendation for its consumption [13,14]. Oleic acid(OA; C18:1 u-9) is the main fatty acid found in EVOO, which alsocontains important bioactive compounds, mainly phenols [15].To date, >30 phenolic compounds have been identified in EVOO,with much variation in composition and concentration due todiverse factors such as variety, geography, cultivation techniques,maturity of the olive fruit, and processing [16]. Phenols in EVOOconstitute a complex mixture including phenolic acids, phenolicalcohols such as hydroxytyrosol and tyrosol, secoiridoids such asoleuropein, lignans, and flavonoids, all of which exhibit antiox-idant properties [17]. Such compounds give EVOO healthyproperties especially at cardiovascular level [17,18]. Prevention ofdamage by oxidative stress by EVOO has been extensively stud-ied in tissues and cells, particularly due to the protective action ofits natural antioxidants, especially hydroxytyrosol [16,19]. Withthis background, the aim of this study was to assess the pro-tective effect of EVOO with different antioxidant levels on thefollowing:
� The increase of oxidative stress parameters;� The decrease of hepatic D-5 and D-6 desaturase activities;and
� The tissue reduction of u-3 and u-6 LCPUFA accretioninduced by a high-fat diet (HFD) in mice.
Materials and methods
Ethics statement
Experimental animal protocols and animal procedures complied with theGuide for the Care and Use of Laboratory Animals (National Academy of Sciences,NIH Publication 6-23, revised 1985) and were approved by the Bioethics Com-mittee for Research in Animals, Faculty of Medicine, University of Chile (protocolsCBA#580 FMUCH and CBA#0630 FMUCH).
Animal preparation and supplementation with EVOO
Weaning male C57 BL/6 J mice weighing 12 to 14 g (Bioterio Central, ICBM,Faculty of Medicine, University of Chile) were randomly assigned to eachexperimental group and allowed free access to a control diet (CD) or an HFD. Thecomposition of CD (expressed as percent total calories) was 10% fat, 20% protein,and 70% carbohydrate, with a caloric value of 3.85 kcal/g, free of EPA and DHA.The composition of HFD was 60% fat, 20% protein, and 20% carbohydrate, with acaloric value of 5.24 kcal/g, free of EPA and DHA (Research Diet Inc, Rodent Diet,Product data D12450 K and 12492). The fatty acid composition of CD and HFDwas previously published [12]. Animals received water ad libitum and werehoused on a 12-h light/dark cycle from day 1 to 84 (12 wk).
Three types of EVOO (brands Nabali, Empeltre and Kalamata) provided byHuasco Valley (Atacama, Chile) with different antioxidant contents were used forfeeding animals during that period. Supplemented groups received 100 mg/d through oral administration, and the control groups received an isovolumetricamount of saline, thus comprising eight experimental groups: CD (control),CD þ EVOO I, CD þ EVOO II, CD þ EVOO III, HFD, HFD þ EVOO I, HFD þ EVOO II,and HFD þ EVOO III.
Weekly controls of body weight and diet intake were performed during theentire study. At the end of week 12, animals were fasted (6–8 h) and anesthetizedwith isoflurane, and blood samples were obtained by cardiac puncture for serumaspartate transaminase (AST), alanine transaminase (ALT), glucose, insulin, tri-acylglycerols (TGs), total cholesterol, low-density lipoprotein cholesterol (LDL-C),high-density lipoprotein cholesterol (HDL-C), thiobarbituric acid reactants(TBARs), and antioxidant capacity determination. Blood, liver, heart, adiposetissue, and brain samples were frozen in liquid nitrogen for the determination offatty acid (FA) profiles.
Measurements of serum parameters and fat content in liver
Serum glucose (mM), cholesterol (mg/100 mL), LDL-C (mg/100 mL), HDL-C(mg/100 mL), and TG levels (mg/dL) were measured using specific diagnostickits (Wiener Lab, Argentina). A commercial immunoassay kit for mice seruminsulin assessment (mU/mL) was used, according to the manufacturer’s in-structions (Mercodia, Uppsala, Sweden). Insulin resistance was estimated by thehomeostasis model assessment method (fasting insulin [mU/mL] � fastingglucose [mM]/22.5) [20]. Serum AST and ALT activities (units/L) were measuredusing specific diagnostic kits (Biomerieux SA, Marcy l,Etoile, France). Hepatictotal fat content (mg/g) was evaluated according to a previously describedmethod [21], and hepatic TG content (mg/g) (Wiener Lab) and hepatic free FAconcentration (mM/g) (Cayman Chemical Company, Ann Arbor, MI, USA) weremeasured using specific kits according to the manufacturer’s instructions.
Lipid extraction and fractionation
Quantitative extraction and separation of total lipids from erythrocytes, liver,heart, adipose tissue, and brain was carried out according to a previouslydescribed method [22]. Briefly, erythrocytes and tissue samples were homoge-nized in ice-cold chloroform/methanol (2:1 v/v) containing 0.01% butylatedhydroxytoluene in an Ultraturrax homogenizer (Janke & Kunkel, Stufen, Ger-many). Total lipids from erythrocytes were extracted with chloroform/iso-propanol (2:1 v/v). Phospholipids (PLs) from erythrocytes, liver, heart, adiposetissue, and brain were separated from total lipid extracts by thin layer chroma-tography on silica gel plates (aluminum sheets 20 � 20 cm, silica gel 60 F �254;Merck), using hexane/diethyl ether/acetic acid (80:20:1 v/v/v) as mobile phase.After development and solvent evaporation, lipid spots were visualized byexposing the plates to a Camag UV (250 nm) lamp designed for thin layerchromatography. The solvent system allows the separation of PLs, cholesterol,TGs, and cholesterol esters according to their relative mobility. PL spots wereextracted from the silica with chloroform/methanol (2:1 v/v) according to apreviously described method [23].
Analysis of total polyphenols, a-tocopherol, antioxidant capacity, and fatty acidprofile of EVOO and different tissues
Determination of total polyphenols content in the three tested EVOOs(Nabali, Empeltre, and Kalamata) was assessed according to a previouslydescribed method [21], and quantification of a-tocopherol was evaluated ac-cording to American Oil Chemistry Society official method [24]. Antioxidant ca-pacity was assessed by oxygen radical antioxidant capacity - fluoresceinaccording to a previously described method [25].
For FA analysis of fatty acid methyl ester (FAME) from the three EVOO (totalFA) and erythrocytes, liver, heart, adipose tissue and brain PLs were preparedwith boron trifluoride (12% methanolic solution) and sodium hydroxide solution(0.5 N) in methanol, according to a previously described method [26]. Total FAfrom different EVOO and PLs (all tissues studied) for FAME derivatization wereextracted from the silica gel spots with 15 mL of chloroform/methanol/water(10:10:1 v/v/v) and evaporated under a nitrogen stream. Samples were cooledand extracted with 0.5 mL of hexane. FAME were separated and quantified bygas-liquid chromatography in an Agilent Hewlett-Packard equipment (model7890 A, Palo Alto, CA, USA) using a capillary column (Agilent HP-88,100 m � 0.250 mm; I.D. 0.25 mm) and a flame ionization detector. The injectortemperature was set at 250�C and the flame ionization detector temperature at300�C. The oven temperature was initially set at 140�C and was programmed toincrease temperature until 220�C at a rate of 5�C/min. Hydrogen was used as thecarrier gas (35 cm/s flow rate) in the column, and the inlet split ratio was set at20:1. The identification and quantification of FAME were achieved by comparingthe retention times and the peak area values (%) of the unknown samples withthose of a commercial lipid standard (Nu-Chek Prep Inc, Elysian MN, USA). C23:0was used as internal standard (Nu-Chek Prep Inc) and a Hewlett-PackardChemstation data system was used for processing.
Assays for hepatic and plasma oxidative stress-related parameters
Livers of anesthetized animals were perfused in situ with a cold solutioncontaining 150 mM KCl and 5 mM Tris (pH 7.4) to remove blood and for

M. A. Rinc�on-Cervera et al. / Nutrition 32 (2016) 1254–12671256
glutathione (GSH) and protein carbonylation assessments. Reduced GSH andglutathione disulfide (GSSG) content were assessed with the enzymatic recyclingmethod [27]. Specific kits (Cayman Chemical Company,) were used to measurecontents of protein carbonyls, F2-isoprostanes, and TBARs in liver, TBARs inplasma, and the antioxidant capacity of plasma, all according to the manufac-turer’s instructions.
Determination of hepatic D-5 and D-6 desaturase activities
Hepatic samples (500 mg) frozen in liquid nitrogen were homogenized in abuffer solution pH 7.9 containing 10 mmol/L HEPES, 1 mmol/l EDTA, 0.6% NonidetP-40, 150 mmol/l NaCl, and protease inhibitors (1 mmol/l phenylmethylsulfonylfluoride, 1 mg/mL aprotinin, 1 mg/mL leupeptin, and 1 mmol/l orthovanadate).Hepatic homogenates were centrifuged at 4�C, first at 2000g for 30 s, followed bycentrifugation of the supernatants at 5000g for 5 min, and finally at 100 000g for60 min, to obtain the extracts for the assessment of desaturase activities. D-5Desaturase activity was determined by the amount of dihomo-g-linolenic acid(DHGLA; C20:3 u-6) being converted into AA, using albumin-bound FA pre-cursors (LA and DHGLA), whereas D-6 desaturase activity was obtained bymeasuring the amount of g-linolenic acid (GLA; C18:3 u-6) produced from LA[28].
Desaturase activity was assayed using 1mL of incubation medium containing4 mmol ATP, 0.1 mmol coenzyme-A, 1.28 mmol NADH, 2.42 mmol N-acetylcysteine,0.5 mmol nicotinamide, 5 mmol MgCl2, 62.5 mmol NaF, and 62.5 mmol phosphatebuffer pH 7, supplemented with 100 nmol with the respective albumin-bound FAprecursor and 1 mg protein of cytosolic extract in a total volume of 100 mL,incubated at 37�C for 30 min with shaking. D-5 and D-6 desaturase assays wereconducted simultaneously. The reaction was stopped by adding 6 mL of amethanol:chloroform mixture (2:1 v/v). Eptadecanoic acid (C17:0; 99%þ pure)was added (20 mg) as internal standard.
To determine the changes in the levels of products or precursors achievedafter incubation, lipids were extracted and derivatized to FAME, which wereanalyzed by gas-liquid chromatographic analysis as described previously [29].FAME peaks were identified by comparison with a FAME standard mix andquantification was carried out by comparison of each peak area with that of theinternal standard. D-5 and D-6 Desaturase activities, measured as net decrease inDHGLA production and net increase in GLA production, were calculated from gas-liquid chromatography results as differences between baseline values and thoseobtained after 30 min incubation, and results were expressed as nmol∙mgprotein∙min.
Gene expression assays
Total RNAwas isolated from hepatic samples using Trizol (Invitrogen, Paisley,United Kingdom), according to the supplier’s protocols. Purified RNA (2 mg) wasthen treated with DNAasa (DNA free kit; Ambion, Austin, TX, USA) and used togenerate first-strand cDNAwith M-MLV reverse transcriptase (Invitrogen), usingrandom hexamers (Invitrogen) and dNTP mix (Bioline, London, UK), according tothe manufacturer’s protocol. Resultant cDNAwas amplified with specific primersfor mice in a total volume of 10 mL. Gene-specific primer sequences used areshown in Supplementary Table 1. Primers were optimized to yield 95% to 100% ofreaction efficiency with polymerase chain reaction products by development inagarose gel to verify the correct amplification length. Real-time polymerase chainreaction was performed in a Strategen M�3000 P System (Agilent Technologies)following the manufacturer’s recommendation (Applied Biosystems, Foster City,CA, USA). All the expression levels of target genes under study were normalizedby the expression of b-actin as internal control (Applied Biosystems). Foldchanges between groups was calculated by the 2(�DDCt) method.
Assessment of sterol regulatory element-binding protein 1 c DNA-binding activity
Nuclear extracts from hepatic tissue (left lobe) were obtained using a com-mercial extraction kit (Cayman Chemical Company, Item 10011223). Sterol reg-ulatory element-binding protein 1 c (SREBP-1 c) DNA-binding activity wasassessed with a commercial enzyme-linked immunosorbent assay kit (CaymanChemical Company, Item 10010854) and according to the manufacturer’s in-structions. Values were expressed as percentage of SREBP-1 c DNA-binding ac-tivity with respect to a positive control provided by the kit.
Determination of hepatic catalase, superoxide dismutase, glutathione peroxidase,and glutathione reductase activities
Hepatic samples were homogenized in three volumes of 30 mM phosphatebuffer, pH 7.4, containing EDTA (1 mM) and 250 mmol sucrose. After centrifu-gation at 500g for 10 min, 4�C, one aliquot of the supernatant was used for thedetermination of both catalase (CAT) and superoxide dismutase (SOD) activities.Another aliquot was centrifuged at 100 000g for 60 min at 4�C to carry outglutathione peroxidase (GPX) and glutathione reductase (GR) assays [30]. CAT
activity was measured according to a previously described method [31]. Enzymeunit is defined as the amount of enzyme that liberates the half of the oxygen fromhydrogen peroxide solution in 100 s at 25�C.
The quantitative assessment of SOD activity was carried out with acommercial assay kit (Cayman Chemical Company) according to the manu-facturer’s instructions. The sensitivity was 0.044 U mL, and the intra- andinterassay coefficients of variations were lower than 16.8% and 13.8%,respectively. GPX activity was determined using hydrogen peroxide as sub-strate according to a previously described method [32]. The activity of theenzyme was evaluated at 340 nm by measuring the decrease in the absor-bance of NADPH. An enzyme unit is defined as the number of mmoles ofNADPH oxidized per minute at 20�C.
GR activity was determined by a previously described method [33]. In thiscase, one enzyme unit is defined as the amount of enzyme that reduces 1 mmol/min of oxidized GSH at pH 6.6 and 25�C.
Hepatic lipolitic and lipogenic enzymatic activities
Acetyl-coenzyme A carboxylase (ACC) activity was determined using a pre-viously described method [34]. Briefly, 1 g of frozen liver was homogenized in 3volumes of phosphate bicarbonate buffer pH 7.0 (70 mM KHCO3; 85 mM K2
HPO4; 9 mM KH2 PO4;1 mM dithiothreitol). The cytosolic fraction was obtainedafter centrifuging the supernatant at 100 000g for 1 h at 4�C. ACC activity wasmeasured using an NADH-linked assay [35]. The assaymedia (56mM Tris-HCl pH8.0; 10 mM MgCl2; 11 mM EDTA; 4 mM ATP; 52 mM KHCO3; 0.75 mg/mL bovineserum albumin; 0.5 mM NADH; 1.4 mM phosphoenolpyruvate) was mixed with5.6 U/mL pyruvate kinase and 5.6 U/mL lactate dehydrogenase. Baseline wasfollowed at 30�C until a constant slope was reached. For every 2.3 volumes ofmedium, 1 volume of activated homogenate was added and the reaction wasstartedwith acetyl-CoA (0.125mM final concentration). For enzymatic activation,1 volume of homogenate was incubated with 1 volume of activation buffer(20 mM citrate; 100 mM Tris-HCl pH 8.0; 1.5 mg/mL bovine serum albumin;20 mMMgCl2; 20 mM GSH [pH 7.5]) for 15 min at 37�C. Fatty acid synthase (FAS)activity was assessed in hepatic cytosolic fractions by measuring malonyl CoA-dependent NADPH oxidation at 37�C as described previously [36]. Activity ofcarnitine-palmitoyl transferase-1 (CPT-1) was determined spectrophotometri-cally using a previous method [37].
Statistical analysis
Statistical analysis was performed with GraphPad Prism 6.0 software(GraphPad Prism Software, Inc. San Diego, CA, USA). Reported values representthe mean � SEM for each experimental group. Evaluation of normality of datadistribution was performed using the Shapiro Wilk test. Assessment of the sta-tistical significance of differences between mean values was performed by two-way analysis of variance and Bonferroni posttest. P < 0.05 was consideredsignificant.
Results
Composition of EVOO
EVOO I (brand Nabali) contained 116 mg of total polyphenolsand 215 mg a-tocopherol/kg oil, with an antioxidant capacity of3.378 � 222 mmoles eq. Trolox/L. EVOO II (brand Empeltre)contained 407mg total polyphenols and 290mg a-tocopherol/kgoil and had an antioxidant capacity of 4.841 � 199 mmoles eq.Trolox/L. EVOO III (brand Kalamata) contained 859 mg totalpolyphenols and 227 mg a-tocopherol/kg oil, with an antioxi-dant capacity of 7.156 � 434 mmoles eq. Trolox/L. The FAcomposition of the different EVOOs used in the study is shown inSupplementary Table 2.
General and biochemical parameters
Data of general and biochemical parameters frommice fed CDand HFD with and without EVOO supplementation are reportedin Table 1. As expected, HFD intake significantly increased bodyweight and visceral adipose tissue regardless of EVOO supple-mentation, whereas liver weight was not affected. All studiedhepatic parameters, namely, total fat content, TG content, andfree FA concentration, were significantly increased in mice fed

Table 1General and biochemical parameters in control mice and high-fat diet fed mice receiving different EVOO supplementation*
Groups
CD HFD
Saline EVOO I EVOO II EVOO III Saline EVOO I EVOO II EVOO III
a b c d e f g h
General parametersInitial body weight (g) 14.7 � 1.6 14.7 � 1.5 14.6 � 1.8 15.0 � 1.7 14.9 � 1.3 14.0 � 1.6 14.5 � 1.8 14.8 � 1.7Final body weight (g) 33.5 � 2.9e,f,g,h 34.5 � 2.6e,f,g,h 36.5 � 2.8e,f,g,h 34.7 � 3.1e,f,g,h 44.5 � 4.5a,b,c,d 42.15 � 4.3a,b,c,d 43.2 � 3.8a,b,c,d 40.6 � 3.7a,b,c,d
Liver weight (g) 1.12 � 0.3 1.14 � 0.3 1.19 � 0.4 1.05 � 0.2 1.24 � 0.4 1.25 � 0.6 1.27 � 0.4 1.23 � 0.5Visceral adipose tissue (g) 1.10 � 0.2e,f,g,h 1.08 � 0.1e,f,g,h 1.13 � 0.2e,f,g,h 1.14 � 0.2e,f,g,h 4.9 � 1a,b,c,d 4.7 � 0.8a,b,c,d 4.8 � 0.6a,b,c,d 4.7 � 0.7a,b,c,d
Liver parametersTotal fat (mg/g liver) 37.8 � 3.6e,f,g,h 32.5 � 4.2e,f,g,h 33.5 � 3.6e,f,g,h 31.5 � 3e,f,g,h 110.5 � 9.8a,b,c,d,h 98.9 � 9.7a,b,c,d 90.6 � 8.5a,b,c,d 81.5 � 7.9a,b,c,d,e
Triacylglycerols (mg/g liver) 32.6 � 2.7e,f,g,h 30 � 2.7e,f,g,h 31.6 � 2.9e,f,g,h 29.9 � 2.6e,f,g,h 107.2 � 10.6a,b,c,d,h 94.6 � 8.6a,b,c,d 86.4 � 7.9a,b,c,d 76.5 � 7a,b,c,d,e
Free fatty acid (mM/g liver) 268.9 � 17.4e,f,g,h 254.6 � 25.6e,f,g,h 238.9 � 36.8e,f,g,h 241.2 � 20.1e,f,g,h 712.2 � 30.6a,b,c,d,h 684.9 � 27.9a,b,c,d 654.3 � 22a,b,c,d 507.3 � 26.7a,b,c,d,e
Serum parametersTriacylglycerols (mg/dL) 130.1 � 15.8e,f,g,h 128.5 � 12.9e,f,g,h 134.2 � 17.2e,f,g,h 125.6 � 15e,f,g,h 184.5 � 19.2a,b,c,d 180.5 � 17a,b,c,d 181.5 � 16.6a,b,c,d 170.4 � 17.2a,b,c,d
Total cholesterol (mg/dL) 72.4 � 8.2e,f,g,h 75.6 � 9.4e,f,g,h 71.3 � 6.8e,f,g,h 78.9 � 7.5e,f,g,h 141.5 � 22.5a,b,c,d 130.1 � 16.4a,b,c,d 125.9 � 12.3a,b,c,d 110.2 � 10.1a,b,c,d
LDL-cholesterol (mg/dL) 47.8 � 5.1e,f,g 48.6.2 � 4.4e,f,g 46.5 � 5e,f,g 40.5 � 3.1e,f,g 94.6 � 8.6a,b,c,d,h 86.5 � 6.8a,b,c,d,h 75.0 � 6.2a,b,c,d,h 50.1 � 4.8e,f,g
HDL-cholesterol (mg/dL) 23.1 � 3.2d,e,f,g,h 25.5 � 4.5d,e,f,g,h 24.1 � 2.9d,e,f,g,h 37.2 � 3a,b,c,g,h 45.2 � 3.9d,f,g,h 42.5 � 3.3d,e,g 49.5 � 4.2d,e,f 58.6 � 6.2a,b,c,d,e
Insulin resistanceFasting glucose (mg/dL) 120.4 � 15.3e,f,g,h 125.6 � 12.5e,f,g,h 119.5 � 10.4e,f,g,h 122.7 � 16.8e,f,g,h 245.5 � 29.7a,b,c,d 239.5 � 20.1a,b,c,d 230.5 � 15.6a,b,c,d 221.4 � 17.5a,b,c,d
Fasting insulin (units/mL) 5.35 � 0.8e,f,g,h 5.22 � 0.9e,f,g,h 5.10 � 0.8e,f,g,h 5.30 � 0.6e,f,g,h 17.8 � 1.9a,b,c,d,f,g,h 13.5 � 1.1a,b,c,d,e 12.6 � 1.4a,b,c,d,e 11.9 � 0.9a,b,c,d,e
HOMA 1.22 � 0.2e,f,g,h 1.19 � 0.1e,f,g,h 1.21 � 0.1e,f,g,h 1.18 � 0.2e,f,g,h 8.70 � 1.2a,b,c,d 7.55 � 0.8a,b,c,d 7.51 � 0.7a,b,c,d 6.85 � 0.8a,b,c,d
Serum transaminasesAST (U/L) 145.2 � 15.6 143.8 � 12.6 150.6 � 18.5 140.1 � 11.5 168.6 � 19.5 155.3 � 15.6 150.6 � 13.3 152.6 � 10.2ALT (U/L) 70.5 � 7.5 68.9 � 5.8 71.2 � 9.5 70.2 � 7.3 81.5 � 10.5 76.5 � 9.5 80.5 � 6.5 74.5 � 9.5
ALT, aspartate transaminase; AST, alanine transaminase; CD, control diet; EVOO, extra virgin olive oil; HDL, high-density lipoprotein; HFD, high-fat diet; HOMA, homeostasis model assessment method; LDL, low-densitylipoprotein
* Values represent means � SEM for 10 to 12 mice per experimental group. Significant differences between the groups are indicated by the superscript letter identifying each group (two-way analysis of variance andBonferroni post-test; P < 0.05).
M.A
.Rinc �on-Cerveraet
al./Nutrition
32(2016)
1254–1267
1257
M. A. Rinc�on-Cervera et al. / Nutrition 32 (2016) 1254–12671258
HFD compared with CD (Table 1). EVOO supplementation had noeffect within CD groups, whereas total fat, TGs, and free FAconcentrations were reduced by 26.2%, 28.6%, and 28.8% byEVOO III containing the highest polyphenol content, respectively,when compared with HFD þ saline group (Table 1). Despite thebeneficial effects of EVOO supplementation in HFD-fed mice,values were still higher (w2- to 2.5-fold) compared with thelevels observed for CD groups (Table 1).
Regarding serum parameters (TGs, total cholesterol, LDL-C,and HDL-C), a large increase was observed for HFD comparedwith CD group (Table 1). It can be seen that supplementationwithEVOO III raisedHDL-C levels in both CD (61% higher in CDþ EVOOIII thanCDþ saline) andHFDmice (29.6%higher inHFDþEVOO IIIthan in HFD þ saline). EVOO III also influenced serum HDL/LDLratios, as shown by enhancements from 0.48 in CD þ saline andHFD þ saline groups to 0.92 in CD þ EVOO III and 1.17 forHFDþEVOO III, an effect thatwasnotelicitedbyEVOO IorEVOO II(from Table 1). The assessment of insulin resistance parametersrevealed that HFD mice exhibited significantly higher fastingglucose, fating insulin, and homeostasis model assessmentmethod values than those in CD groups (Table 1). Furthermore, nosignificant differences were found within CD and HFD groups,
Table 2Fatty acid composition of liver phospholipids obtained from control mice and HFD-fe
Fatty acid Fatty acid composition (g/100 g FAME)
Groups
Control diet
Saline EVOO I EVOO II EVOO III
(a) (b) (c) (d)
C16:0 35.4 � 3.3e 32.1 � 2.7e 32.9 � 2.7e 31.5 � 2.8e
C 18:1 u-9 23.8 � 1.9b,c,d,e,f,g,h 30.4 � 2.5a 31.1 � 2.2a 31.5 � 2a
C18:2 u-6(LA)
12.9 � 1.2 11.8 � 1.1 11.6 � 1.3 11.5 � 0.9
C18:3 u-6 1.02 � 0.1 0.95 � 0.05 1.04 � 0.1 0.97 � 0.04C18:3 u-3
(ALA)1.16 � 0.1e,f,g 1.10 � 0.05e,f,g 1.13 � 0.06e,f,g 1.14 � 0.05e,f,g
C18:4 u-3 0.25 � 0.04e,f,g 0.26 � 0.03e,f,g 0.25 � 0.05e,f,g 0.24 � 0.04e,f,g
C20:3 u-6 0.23 � 0.04e,f 0.20 � 0.03e,f 0.21 � 0.03e,f 0.22 � 0.05e,f
C20:4 u-6(AA)
11.5 � 0.8e,f 11.3 � 0.5e,f 10.8 � 0.6e,f 11.2 � 0.4e,f
C20:4 u-3 0.15 � 0.05e,f 0.15 � 0.03e,f 0.14 � 0.02e,f 0.14 � 0.4e,f
C20:5 u-3(EPA)
1.05 � 0.1e,f,g 1.11 � 0.04e,f,g 1.03 � 0.1e,f,g 1.09 � 0.1e,f,g
C22:5 u-6(DPA u-6)
0.08 � 0.02e 0.07 � 0.02e 0.09 � 0.03e 0.08 � 0.01e
C22:5 u-3(DPA u-3)
0.10 � 0.01e,f 0.09 � 0.01e,f 0.11 � 0.02e,f 0.09 � 0.01e,f
C22:6 u-3(DHA)
4.10 � 0.3e 4.17 � 0.2e 4.14 � 0.2e 4.20 � 0.2e
Total SFA 37.9 � 3.4e 33.7 � 2.4e 34.2 � 3.1e 33.8 � 2.9e
Total MUFA 27.1 � 2.4 32.4 � 2 33.1 � 2.9 32.4 � 3.1Total PUFA 35.0 � 3.1e 33.9 � 2.6e 32.7 � 2.8e 33.8 � 2.7e
Total LCPUFA 17.2 � 1.2e,f,g 17.1 � 1.4e,f,g 16.9 � 1.1e,f,g 17.3 � 0.9e,f,g
Total u-6LCPUFA
11.7 � 0.8e,f,g 12.6 � 1e,f,g 11.2 � 0.9e,f,g 11.8 � 1e,f,g
Total u-3LCPUFA
5.50 � 0.2e,f 5.52 � 0.3e,f 5.70 � 0.2e,f 5.50 � 0.3e,f
u-6/u-3LCPUFAratio
2.13 � 0.2e,f,g 2.29 � 0.3e,f,g 1.97 � 0.3e,f,g 2.15 � 0.2e,f,g
AA, arachidonic acid; ALA, a-linolenic acid; ANOVA, analysis of variance; DHA, docosaextra virgin olive oil; FAME, fatty acid methyl ester; HFD, high-fat diet; LA, linolenic acacid; PUFA, polyunsaturated fatty acid; SFA, saturated fatty acid
* Values are expressed as g fatty acid per 100 g FAME and represent themean� SEMgroups are indicated by the letter identifying each group (two-way ANOVA and Boncorrespond to C14:1 u-7, C16:1 u-7, and C18:1 u-9. PUFAs correspond to C18:2 u-6, Cu-6 and C22:5 u-3; u-3 LCPUFA are C20:5 u-3, C22:5 u-3, and C22:6 u-3; u-6/u-3 L
with the exception of the serum levels of fasting insulin inHFDþ salinemice thatwere significantly higher thanHFD groupssupplementedwith EVOO (I, II, and III). In all experimental groupsstudied, serum AST and ALT levels were comparable.
Fatty acid composition of phospholipids from liver, erythrocyte,heart, adipose tissue, and brain
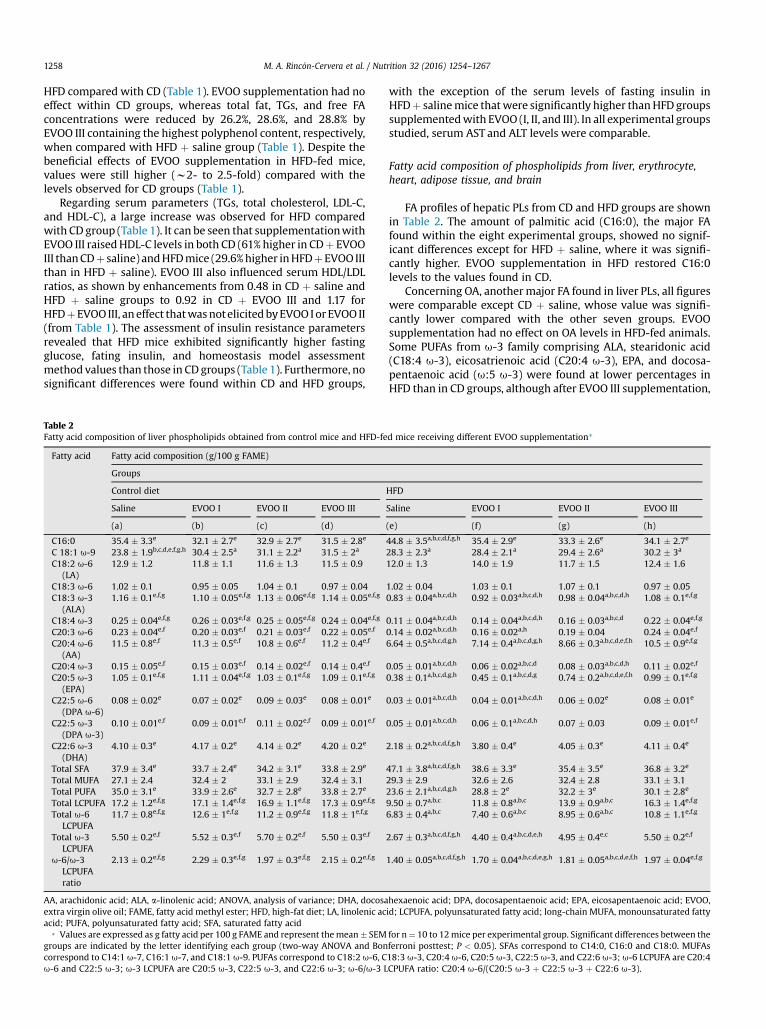
FA profiles of hepatic PLs from CD and HFD groups are shownin Table 2. The amount of palmitic acid (C16:0), the major FAfound within the eight experimental groups, showed no signif-icant differences except for HFD þ saline, where it was signifi-cantly higher. EVOO supplementation in HFD restored C16:0levels to the values found in CD.
Concerning OA, anothermajor FA found in liver PLs, all figureswere comparable except CD þ saline, whose value was signifi-cantly lower compared with the other seven groups. EVOOsupplementation had no effect on OA levels in HFD-fed animals.Some PUFAs from u-3 family comprising ALA, stearidonic acid(C18:4 u-3), eicosatrienoic acid (C20:4 u-3), EPA, and docosa-pentaenoic acid (u:5 u-3) were found at lower percentages inHFD than in CD groups, although after EVOO III supplementation,
d mice receiving different EVOO supplementation*
HFD
Saline EVOO I EVOO II EVOO III
(e) (f) (g) (h)
44.8 � 3.5a,b,c,d,f,g,h 35.4 � 2.9e 33.3 � 2.6e 34.1 � 2.7e
28.3 � 2.3a 28.4 � 2.1a 29.4 � 2.6a 30.2 � 3a
12.0 � 1.3 14.0 � 1.9 11.7 � 1.5 12.4 � 1.6
1.02 � 0.04 1.03 � 0.1 1.07 � 0.1 0.97 � 0.050.83 � 0.04a,b,c,d,h 0.92 � 0.03a,b,c,d,h 0.98 � 0.04a,b,c,d,h 1.08 � 0.1e,f,g
0.11 � 0.04a,b,c,d,h 0.14 � 0.04a,b,c,d,h 0.16 � 0.03a,b,c,d 0.22 � 0.04e,f,g
0.14 � 0.02a,b,c,d,h 0.16 � 0.02a,h 0.19 � 0.04 0.24 � 0.04e,f
6.64 � 0.5a,b,c,d,g,h 7.14 � 0.4a,b,c,d,g,h 8.66 � 0.3a,b,c,d,e,f,h 10.5 � 0.9e,f,g
0.05 � 0.01a,b,c,d,h 0.06 � 0.02a,b,c,d 0.08 � 0.03a,b,c,d,h 0.11 � 0.02e,f
0.38 � 0.1a,b,c,d,g,h 0.45 � 0.1a,b,c,d,g 0.74 � 0.2a,b,c,d,e,f,h 0.99 � 0.1e,f,g
0.03 � 0.01a,b,c,d,h 0.04 � 0.01a,b,c,d,h 0.06 � 0.02e 0.08 � 0.01e
0.05 � 0.01a,b,c,d,h 0.06 � 0.1a,b,c,d,h 0.07 � 0.03 0.09 � 0.01e,f
2.18 � 0.2a,b,c,d,f,g,h 3.80 � 0.4e 4.05 � 0.3e 4.11 � 0.4e
47.1 � 3.8a,b,c,d,f,g,h 38.6 � 3.3e 35.4 � 3.5e 36.8 � 3.2e
29.3 � 2.9 32.6 � 2.6 32.4 � 2.8 33.1 � 3.123.6 � 2.1a,b,c,d,g,h 28.8 � 2e 32.2 � 3e 30.1 � 2.8e
9.50 � 0.7a,b,c 11.8 � 0.8a,b,c 13.9 � 0.9a,b,c 16.3 � 1.4e,f,g
6.83 � 0.4a,b,c 7.40 � 0.6a,b,c 8.95 � 0.6a,b,c 10.8 � 1.1e,f,g
2.67 � 0.3a,b,c,d,f,g,h 4.40 � 0.4a,b,c,d,e,h 4.95 � 0.4e,c 5.50 � 0.2e,f
1.40 � 0.05a,b,c,d,f,g,h 1.70 � 0.04a,b,c,d,e,g,h 1.81 � 0.05a,b,c,d,e,f,h 1.97 � 0.04e,f,g
hexaenoic acid; DPA, docosapentaenoic acid; EPA, eicosapentaenoic acid; EVOO,id; LCPUFA, polyunsaturated fatty acid; long-chain MUFA, monounsaturated fatty
for n¼ 10 to 12mice per experimental group. Significant differences between theferroni posttest; P < 0.05). SFAs correspond to C14:0, C16:0 and C18:0. MUFAs18:3 u-3, C20:4 u-6, C20:5 u-3, C22:5 u-3, and C22:6 u-3; u-6 LCPUFA are C20:4CPUFA ratio: C20:4 u-6/(C20:5 u-3 þ C22:5 u-3 þ C22:6 u-3).

M. A. Rinc�on-Cervera et al. / Nutrition 32 (2016) 1254–1267 1259
values were restored. The same trendwas observed for someu-6LCPUFA such as AA and u-6 DPA (C22:5 u-6), and for total u-6and u-3 LCPUFA and u-6/u-3 LCPUFA ratio. However, no sig-nificant differences within the eight experimental groups werefound for LA, GLA, and total monounsaturated fatty acids(MUFAs).
EVOO supplementation had no effect on DHA amounts withinCD groups, and although HFD reduced significantly the DHAlevel, it was restored after EVOO (I, II, and III) intake in all cases.Differences in total saturated fatty acids (SFA) and total PUFAwere only observed for HFD þ saline, with higher and lowerlevels respectively than for the other seven experimental groups,showing that although HFD causes an imbalance between SFAand PUFA groups, EVOO intake is able to restore these pro-portions in all cases.
FA profiles of erythrocyte PLs from CD and HFD groups areshown in Table 3. No significant difference was found for any FAor FA class within the four CD groups. However, HFD causedmodifications in most FA that were normalized in some casesafter EVOO supplementation. For C16:0, the main FA found in allgroups, the highest value was shown in HFD þ saline (45.2% oftotal FA), which decreased to 38.7 % in HFD þ EVOO III. Levels ofOA, LA, ALA, and AA were comparable in all experimental con-ditions. Concerning EPA, significant lower values were found inHFD groups supplemented with saline, EVOO I, and EVOO II;however, EPA levels in HFD þ EVOO III mice were comparable tothose found in CD groups (Table 3). This trend was also observedfor u-6 DPA, u-3 DPA, DHA, and total u-3 PUFA. HFD intakeincreased the level of total SFA but EVOO II and III supplemen-tation restored the level to those found in CD. Total MUFA andtotal PUFA percentages were not affected by HFD. This diet
Table 3Fatty acid composition of erythrocyte phospholipids obtained from control mice and
Fatty acid Fatty acid composition (g/100 g FAME)
Groups
Control diet
Saline EVOO I EVOO II EVOO III
(a) (b) (c) (d)
C16:0 35.8 � 2.4e,f, 32.1 � 2.2e,f,g,h 34 � 3.1e,f 34.2 � 2.1e,f,g,h
C 18:1 u-9 22.5 � 1.9 24.3 � 2 25.2 � 2.4 27.3 � 2.5C18:2 u-6 (LA) 11.8 � 1.1 10.4 � 1.5 10.5 � 0.9 11.6 � 1.1C18:3 u-3 (ALA) 1.16 � 0.05 1.14 � 0.1 1.10 � 0.2 1.32 � 0.2C20:4 u-6 (AA) 13.6 � 1.2 14.1 � 1.5 12.5 � 1.8 12.0 � 1.6C20:5 u-3 (EPA) 2.02 � 0.4e,f,g 1.94 � 0.3e,f,g 2.01 � 0.2e,f,g 1.95 � 0.1e,f,g
C22:5 u-6(DPAu-6)
0.15 � 0.03e,f,g,h 0.14 � 0.04e,f 0.15 � 0.04e,f 0.16 � 0.05e,f
C22:5 u-6(DPAu-3)
0.84 � 0.05e,f,g 0.80 � 0.04e,f,g 0.81 � 0.05e,f,g 0.85 � 0.1e,f,g
C22:6 u-3 (DHA) 4.10 � 0.5e,f,g 4.04 � 0.6e,f,g 4.12 � 0.6e,f,g 4.14 � 0.5e,f,g
Total SFA 39.5 � 3.1e,f 37.8 � 2.9e,f 38.9 � 3e,f 37.2 � 3.2e,f
Total MUFA 26.2 � 2.2 28.9 � 2.5e 28.7 � 2.3e 29.4 � 2.9e
Total PUFA 34.3 � 3.3 33.3 � 2.8 32.4 � 3 33.4 � 3.2Total LCPUFA 20.9 � 1.7e,f 21.2 � 2e,f 19.7 � 1.6e,f 19.3 � 2.1e,f
Total u-6 LCPUFA 13.9 � 0.6h 14.3 � 0.8h 12.8 � 0.9 12.3 � 0.7Total u-3 LCPUFA 7.00 � 0.05e,f,g 6.90 � 0.1e,f,g 6.90 � 0.2e,f,g 7.00 � 0.05e,f,g
u-6/u-3 LCPUFAratio
2.00 � 0.03e,f,g 2.10 � 0.05e,f,g 1.90 � 0.1e,f,g 1.80 � 0.02e,f,g
AA, arachidonic acid; ALA, a-linolenic acid; ANOVA, analysis of variance; DHA, docosaextra virgin olive oil; FAME, fatty acid methyl ester; HFD, high-fat diet; LA, linolenic acacid; PUFA, polyunsaturated fatty acid; SFA, saturated fatty acid
* Values are expressed as g fatty acid/100 g FAME and represent the mean � SEM fogroups are indicated by the letter identifying each group (two-way ANOVA and Bonferrtheir relationships are shown in Table 2.
increased the u-6/u-3 LCPUFA ratio, the highest value found forHFDþ saline, although it a decrease after EVOO supplementationwas observed, being the value restored with HFD þ EVOO III.
FA profiles of heart tissue PLs from CD and HFD groups areshown in Table 4. No FAwas modified by EVOO supplementationin CD groups. Concerning HFD, ALA, EPA, u-6 DPA, u-3 DPA, totalPUFA, total LCPUFA, and total u-3 LCPUFA percentages werelowered, but values were restored to CD figures after EVOO IIIsupplementation. The LCPUFA u-6/u-3 ratio was higher in HFDthan in CD, but it was restored after EVOO III supplementation.For the other FAs, no changes were observed between CD andHFD.
Table 5 shows the FA profiles of adipose tissue PLs from CDand HFD groups. No significant differences were foundwithin CDgroups in any case. Higher values were found for C16:0 in HFDcompared with CD, and although EVOO supplementation had areducing effect, values were not restored to CD level in any case.In contrast, the higher percentages found after HFD intake forSFA and u-6/u-3 LCPUFA ratio were restored to CD levels aftersupplementationwith EVOO II and III. For OA, LA, and total MUFApercentages, no differences were observed among the eightexperimental groups. In the case of ALA, EPA, u-6 DPA, u-3 DPA,DHA, total PUFA, total LCPUFA, and total u-3 LCPUFA, lower fig-ureswere found in HFD comparedwith CD; EVOO increased suchpercentages to values comparable to CD figures, however, levelsof AA and u-6 LCPUFA were not restored.
In Table 6, the FA profiles of brain PLs fromCD and HFD groupsare reported. EVOO supplementation did not produce anymodification of the FA profile within CD groups. C16:0 and totalSFA percentages were increased after HFD intake, but EVOOsupplementation decreased them, and finally they were restored
HFD-fed mice receiving different EVOO supplementation*
HFD
Saline EVOO I EVOO II EVOO III
(e) (f) (g) (h)
45.2 � 3.1a,b,c,d 43.1 � 3.5a,b,c,d 40.1 � 3.2b 38.7 � 2.8b
20.1 � 1.7 21.7 � 1.7 22.5 � 2.2 25.6 � 2.610.5 � 0.8 11.1 � 0.9 10.2 � 1.5 10.1 � 1.40.96 � 0.1 1.05 � 0.05 1.09 � 0.04 1.12 � 0.0513.2 � 1.4 12.8 � 0.9 13.4 � 0.8 11.4 � 1.50.75 � 0.05a,b,c,d,f,g,h 0.97 � 0.04a,b,c,d,e,g,h 1.35 � 0.2a,b,c,d,e,f,h 1.85 � 0.2e,f,g
0.05 � 0.01a,b,c,d,g,h 0.07 � 0.01a,b,c,d,h 0.09 � 0.02a 0.13 � 0.04e,f
0.03 � 0.01a,b,c,d,f,g,h 0.11 � 0.02a,b,c,d,e,g,h 0.32 � 0.04a,b,c,d,e,f,h 0.75 � 0.1e,f,g
2.10 � 0.04a,b,c,d,g,h 2.15 � 0.06a,b,c,d,g,h 2.82 � 0.2a,b,c,d,e,f 3.72 � 0.6e,f
48.4 � 3.3a,b,c,d 46.5 � 3.4a,b,c,d 44.4 � 2.9 42.1 � 2.723.5 � 2.2b,c,d 24.6 � 2.4 25.6 � 2.4 28.4 � 2.628.1 � 2.6 28.9 � 2.3 30 � 3.5 29.5 � 2.816.3 � 0.7a,b,c,d 16.2 � 0.5a,b,c,d 18.3 � 1.4 18.1 � 1.513.4 � 0.4h 13.0 � 0.3h 13.6 � 1.1 11.6 � 0.5a,b,e,f
2.90 � 0.1a,b,c,d,g,h 3.20 � 0.1a,b,c,d,g,h 4.70 � 0.3a,b,c,d,e,f,h 6.50 � 0.3e,f,g
4.60 � 0.2a,b,c,d,g,h 4.10 � 0.2a,b,c,d,g,h 2.90 � 0.05a,b,c,d,e,f,h 1.80 � 0.05e,f,g
hexaenoic acid; DPA, docosapentaenoic acid; EPA, eicosapentaenoic acid; EVOO,id; LCPUFA, polyunsaturated fatty acid; long-chain MUFA, monounsaturated fatty
r N ¼ 10 to 12 mice per experimental group. Significant differences between theoni posttest; P< 0.05). Identification of saturated and unsaturated fatty acids and

Table 4Fatty acid composition of heart tissue phospholipids obtained from control mice and HFD-fed mice receiving different EVOO supplementation*
Fatty acid Fatty acid composition (g/100 g FAME)
Groups
Control diet HFD
Saline EVOO I EVOO II EVOO III Saline EVOO I EVOO II EVOO III
(a) (b) (c) (d) (e) (f) (g) (h)
C16:0 34.5 � 3.2 35.8 � 3.1 34.9 � 2.9 34.3 � 3.4 42.1 � 3.8 41.2 � 3.5 40.1 � 3.7 36.4 � 2.9C18:1 u-9 22.5 � 2.3 24.5 � 2.1 24.2 � 2.4 21.6 � 2 21.7 � 1.9 23.8 � 2.8 25.6 � 2.3 23.8 � 2.7C18:2 u-6 (LA) 13.5 � 1.9g 11.7 � 1.7 11.9 � 1.9 12.4 � 1.6 11.6 � 1.8 10.3 � 1.5 9.85 � 1.2a 11.5 � 1.1C18:3 u-3 (ALA) 1.25 � 0.07e,f,g 1.21 � 0.1e,f,g 1.24 � 0.09e,f,g 1.28 � 0.1e,f,g 0.85 � 0.05a,b,c,dg,h 0.88 � 0.1a,b,c,dg,h 1.05 � 0.04a,b,c,d,e,f,h 1.19 � 0.05e,f,g
C20:4 u-6 (AA) 11.2 � 1.3 10.9 � 1.4 11.7 � 1.3 11.0 � 1 11.0 � 1.5 11.3 � 1.1 10.8 � 0.9 10.7 � 0.8C20:5 u-3 (EPA) 2.75 � 0.2e,f,g 2.58 � 0.3e,f,g 2.41 � 0 .2e,f,g 2.64 � 0.3e,f,g 0.98 � 0.1a,b,c,d,f,g,h 1.25 � 0.05a,b,c,d,e,g,h 1.82 � 0.1a,b,c,d,e,f,h 2.46 � 0.3e,f,g
C22:5 u-6 (DPAu-6) 0.74 � 0.1e,f,g 0.72 � 0.05e,f 0.70 � 0.05e,f 0.73 � 0.1e,f 0.40 � 0.04a,b,c,d,g,h 0.45 � 0.03a,b,c,d,g,h 0.62 � 0.05a,e,f 0.70 � 0.05e,f
C22:5 v-6 (DPAu-3) 0.63 � 0.1e,f,g 0.60 � 0.05e,f 0.62 � 0.01e,f 0.63 � 0.05e,f 0.35 � 0.05a,b,c,d,g,h 0.47 � 0.1a,b,c,d,g,h 0.56 � 0.04a,e,f 0.55 � 0.1e,f
C22:6 u-3 (DHA) 5.05 � 0.3e,f,g 4.78 � 0.4e,f,g 4.84 � 0.3e,f,g 5.00 � 0.5e,f,g 2.25 � 0.05a,b,c,d,g,h 2.79 � 0.04a,b,c,d,g,h 3.48 � 0.2a,b,c,d,e,f 4.15 � 0.5e,f
Total SFA 39.1 � 3.1 38.7 � 3.4 37.6 � 3.5 38.9 � 3.5 46.9 � 4.1 44.5 � 3.8 42.2 � 3.6 40.1 � 3Total MUFA 25.1 � 2.2 27.8 � 2.5 27.1 � 2.5 26.2 � 2.6 24.9 � 2.2 27.3 � 2.5 28.9 � 2.5 27.5 � 2.6Total PUFA 35.8 � 3.8e,f,g 33.5 � 2.9e,f,g 35.3 � 3.3e,f,g 34.9 � 3.1e,f,g 28.2 � 2.5a,b,c,d 28.2 � 2.3a,b,c,d 28.9 � 2a,b,c,d 32.4 � 2.4Total LCPUFA 20.6 � 1.9e,f 19.9 � 2e,f 21.0 � 1.7e,f 20.2 � 1.6e,f 15.2 � 0.6a,b,c,d 16.5 � 1.7a,b,c,d 17.4 � 1.5 18.9 � 1.6e
Total u-6 LCPUFA 12.0 � 1.1 11.8 � 0.9 12.9 � 1.4 11.9 � 0.7 11.6 � 0.8 11.9 � 1.1 11.6 � 1.1 11.6 � 0.8Total u-3 LCPUFA 8.60 � 0.7e,f,g 8.10 � 0.7e,f,g 8.30 � 0.4e,f,g 8.30 � 0.6e,f,g 3.60 � 0.3a,b,c,d,g,h 4.60 � 0.3a,b,c,d,g,h 5.80 � 0.3a,b,c,d,e,f,h 7.30 � 0.5e,f,g
u-6/u-3 LCPUFAratio
1.40 � 0.1e,f,g 1.50 � 0.05e,f,g 1.55 � 0.1e,f,g 1.43 � 0.1e,f,g 3.22 � 0.4a,b,c,d,g,h 2.59 � 0.1a,b,c,d,g,h 2.00 � 0.04a,e 1.59 � 0.2e,f,g
AA, arachidonic acid; ALA, a-linolenic acid; ANOVA, analysis of variance; DHA, docosahexaenoic acid; DPA, docosapentaenoic acid; EPA, eicosapentaenoic acid; EVOO,extra virgin olive oil; FAME, fatty acid methyl ester; HFD, high-fat diet; LA, linolenic acid; LCPUFA, polyunsaturated fatty acid; long-chain MUFA, monounsaturated fattyacid; PUFA, polyunsaturated fatty acid; SFA, saturated fatty acid
* Values are expressed as g fatty acid/100 g FAME and represent the mean � SEM for N ¼ 10 to 12 mice per experimental group. Significant differences between thegroups are indicated by the letter identifying each group (two-way ANOVA and Bonferroni posttest; P< 0.05). Identification of saturated and unsaturated fatty acids andtheir relationships are shown in Table 2.
M. A. Rinc�on-Cervera et al. / Nutrition 32 (2016) 1254–12671260
to CD levels with EVOO III. For u-6 DPA, higher levels found forHFD þ saline were reduced after EVOO supplementation,without reaching CD values. Additionally, ALA, AA, u-3 DPA,DHA, total PUFA, total LCPUFA, total u-6 LCPUFA, and total u-3
Table 5Fatty acid composition of adipose tissue phospholipids obtained from control mice an
Fatty acid Fatty acid composition (g/100 g FAME)
Groups
Control diet H
Saline EVOO I EVOO II EVOO III S
(a) (b) (c) (d) (e
C16:0 37.1 � 2.9e,f,g,h 35.6 � 2.5e,f,g,h 39.8 � 2.6e,f,g,h 37.4 � 3.1e,f,g,h 5C18:1 u-9 27.8 � 2.5 31.5 � 2.8 31.8 � 2.7 31.2 � 2.9 2C18:2 u-6 (LA) 9.86 � 1.2 9.55 � 1.1 7.84 � 1.5 8.95 � 0.9 8C18:3 u-3 (ALA) 1.79 � 0.4e,f,g 1.85 � 0.5e,f,g 1.95 � 0.4e,f,g 1.83 � 0.6e,f,g 0C20:4 u-6 (AA) 8.81 � 0.4e,f,g,h 8.96 � 0.3e,f,g,h 7.90 � 0.5e,f,g,h 8.51 � 0.6e,f,g,h 5C20:5 u-3 (EPA) 1.05 � 0.07e,f,g 1.11 � 0.05e,f,g 0.99 � 0.1e,f,g 1.16 � 0.1e,f,g 0C22:5 u-6
(DPAu-6)0.10 � 0.01e,f,g 0.09 � 0.02e,f,g 0.11 � 0.1e,f,g 0.10 � 0.05e,f,g 0
C22:5 v-6(DPAu-3)
0.09 � 0.02e,f 0.08 � 0.01e,f 0.07 � 0.02e,f 0.08 � 0.02e,f 0
C22:6 u-3 (DHA) 2.58 � 0.2e,f,g 2.71 � 0.1e,f,g 2.48 � 0.2e,f,g 2.85 � 0.1e,f,g 0Total SFA 42.5 � 3.4e,f 40.6 � 3.3e,f 43.4 � 3.8e,f 41.9 � 4e,f 5Total MUFA 31.8 � 2.9 33.6 � 3.3 34.5 � 3.2 33.6 � 2.8 2Total PUFA 25.7 � 2.4e,f,g 25.8 � 2.7e,f,g 22.1 � 1.9e,f,g 24.5 � 2.1e,f,g 1Total LCPUFA 12.9 � 1.1e,f,g 13.3 � 1.2e,f,g 11.7 � 0.8e,f,g 13 � 1.3e,f,g 6Total u-6 LCPUFA 9.10 � 0.8e,f,g,h 9.11 � 0.6e,f,g,h 8.05 � 0.7e,f,g,h 8.74 � 0.7e,f,g,h 5Total u-3 LCPUFA 3.80 � 0.3e,f,g 4.19 � 0.4e,f,g 3.65 � 0.3e,f,g 4.26 � 0.5e,f,g 1u-6/u-3 LCPUFA
ratio2.40 � 0.2e,f 2.17 � 0.3e,f 2.21 � 0.2e,f 2.10 � 0.3e,f 4
AA, arachidonic acid; ALA, a-linolenic acid; ANOVA, analysis of variance; DHA, docosaextra virgin olive oil; FAME, fatty acid methyl ester; HFD, high-fat diet; LA, linolenic acacid; PUFA, polyunsaturated fatty acid; SFA, saturated fatty acid
* Values are expressed as g fatty acid/100 g FAME and represent the mean � SEM fogroups are indicated by the letter identifying each group (two-way ANOVA and Bonferrtheir relationships are shown in Table 2.
LCPUFA levels for HFDwere lower than for CD, and restored withEVOO III. There were no significant changes among the eightgroups studied for OA, LA, total MUFA, or the u-6/u-3 LCPUFAratio.
d HFD-fed mice receiving different EVOO supplementation*
FD
aline EVOO I EVOO II EVOO III
) (f) (g) (h)
4.4 � 2.3a,b,c,d,g,h 52.3 � 4a,b,c,d,g,h 47.3 � 3.9a,b,c,d,e,f 43.3 � 3.6a,b,c,d,e,f
2.4 � 1.8 25.9 � 2.6 27.8 � 2.8 29.6 � 2.4.12 � 1.3 7.95 � 1.4 8.25 � 0.8 8.01 � 1.1.51 � 0.05a,b,c,d,f,g,h 0.70 � 0.1a,b,c,d,e,g,h 0.95 � 0.05a,b,c,d,e,f,h 1.64 � 0.3e,f,g
.18 � 0.2a,b,c,d,g,h 5.47 � 0.3a,b,c,d,g,h 6.42 � 0.4a,b,c,d,e,f 6.98 � 0.5a,b,c,d,e,f
.32 � 0.03a,b,c,d,f,g,h 0.45 � 0.02a,b,c,d,e,f,h 0.88 � 0.05a,b,c,d,e,f,h 0.97 � 0.1e,f,g
.05 � 0.02a,b,c,d,h 0.06 � 0.01a,b,c,d,h 0.08 � 0.02a,b,c,d,h 0.10 � 0.05e,f,g
.03 � 0.01a,b,c,d,g,h 0.05 � 0.01a,b,c,d,h 0.07 � 0.02e 0.09 � 0.02e,f
.82 � 0.1a,b,c,d,g,h 1.15 � 0.05a,b,c,d,g,h 1.51 � 0.1a,b,c,d,e,f,g 2.18 � 0.2e,f,g
8.1 � 5.5a,b,c,d,h 54.7 � 5.1a,b,c,d 50.7 � 4.5 46.3 � 4.7e,f
6.7 � 2.2 28.9 � 2.0 30.3 � 2.7 32.7 � 2.85.2 � 1.7a,b,c,d,h 16.4 � 1.2a,b,c,d,h 19 � 1.6a,b,c,d 21.0 � 1.8e,f
.50 � 0.6a,b,c,d,g,h 7.29 � 1a,b,c,d,h 9.10 � 1.6 10.5 � 1e,f
.30 � 0.4a,b,c,d,h 5.60 � 0.6a,b,c,d,h 6.68 � 1.4a,b,c,d,h 7.20 � 0.7a,b,c,d,e,f
.20 � 0.1a,b,c,d,g 1.69 � 0.2a,b,c,d,g 2.42 � 0.6a,b,c,d,e,f 3.30 � 0.4e,f,g
.42 � 0.5a,b,c,d,g,h 3.31 � 0.4a,b,c,d,g,h 2.76 � 0.3e,f 2.20 � 0.2e,f
hexaenoic acid; DPA, docosapentaenoic acid; EPA, eicosapentaenoic acid; EVOO,id; LCPUFA, polyunsaturated fatty acid; long-chain MUFA, monounsaturated fatty
r N ¼ 10 to 12 mice per experimental group. Significant differences between theoni posttest; P< 0.05). Identification of saturated and unsaturated fatty acids and

Table 6Fatty acid composition of brain phospholipids obtained from control mice and HFD-fed mice receiving different EVOO supplementation*
Fatty acid Fatty acid composition (g/100 g FAME)
Groups
Control diet HFD
Saline EVOO I EVOO II EVOO III Saline EVOO I EVOO II EVOO III
(a) (b) (c) (d) (e) (f) (g) (h)
C16:0 37.9 � 3.3e,f,g 36.5 � 3e,f,g 35.9 � 2.9e,f,g,h 35.7 � 2.8e,f,g,h 47.1 � 3.6a,b,c,d 46.4 � 4.1a,b,c,d 45.8 � 3.8a,b,c,d 42.5 � 3.2c,d
C18:1 u-9 22.3 � 1.8 23.5 � 2.1 24.2 � 2.4e 23.4 � 2.6 19.1 � 1.9c 20.3 � 1.6 21.5 � 1.9 22.1 � 1.7C18:2 u-6 (LA) 3.78 � 0.4 4.02 � 0.3 3.92 � 0.2 4.05 � 0.3 3.89 � 0.4 3.95 � 0.3 4.01 � 0.2 3.95 � 0.4C18:3 u-3 (ALA) 1.18 � 0.3e,f 1.15 � 0.2e,f 1.19 � 0.2e,f 1.12 � 0.2e,f 0.61 � 0.05a,b,c,d,f,g,h 0.75 � 0.04a,b,c,d,e,g,h 0.84 � 0.06a,b,c,d,e,f,h 0.96 � 0.05e,f,g
C20:4 u-6 (AA) 16.4 � 1.4e,f,g 16.1 � 1.1e,f,g 15.8 � 1.7e,f,g 16.8 � 1.8e,f,g 11.5 � 0.8a,b,c,d,h 12.5 � 1.4a,b,c,d,h 12.8 � 1.8a,b,c,d,h 14.5 � 1.8e,f,g
C20:5 u-3 (EPA) 0.48 � 0.04e,f,g 0.50 � 0.03e,f,g,h 0.52 � 0.04e,f,g,h 0.56 � 0.05e,f,g,h 0.22 � 0.03a,b,c,d,f,g,h 0.31 � 0.02a,b,c,d,e,g,h 0.41 � 0.03b,c,d 0.44 � 0.02b,c,d,e,f
C22:5 u-6 (DPAu-6) 0.24 � 0.02e,f,g,h 0.26 � 0.01e,f,g,h 0.30 � 0.03e,f,g,h 0.29 � 0.04e,f,g,h 0.91 � 0.04a,b,c,d,f,g,h 0.78 � 0.04a,b,c,d,e,h 0.70 � 0.04a,b,c,d,e,h 0.60 � 0.03a,b,c,d,e,f,g
C22:5 v-6 (DPAu-3) 0.51 � 0.03e,f,g 0.46 � 0.02e,f,g 0.55 � 0.04e,f,g 0.52 � 0.05e,f,g 0.24 � 0.03a,b,c,d,f,g,h 0.33 � 0.02a,b,c,d,e,g,h 0.41 � 0.03a,b,c,d,e,f,h 0.49 � 0.04e,f,g
C22:6 u-3 (DHA) 10.5 � 1.1e,f,g 10.3 � 0.9e,f,g 10.8 � 0.8e,f,g 10.3 � 1e,f,g 7.05 � 0.4a,b,c,d,h 7.28 � 0.5a,b,c,d,h 7.82 � 0.4a,b,c,d,h 9.92 � 0.7e,f,g
Total SFA 41.5 � 3.4e,f 40.9 � 3.8e,f,g 40.5 � 3.6e,f,g 39.8 � 3.4e,f,g 51.4 � 3.8a,b,c,d,h 50.2 � 3.7a,b,c,d,h 48.6 � 3.3b,c,d 44.2 � 3.5Total MUFA 24.2 � 2.2 25.6 � 2.8 26.3 � 2.9 25.7 � 2.6 21.9 � 2.3 22.4 � 1.7 23.7 � 2.1 24.3 � 1.9Total PUFA 34.3 � 3.1e,f,g 33.5 � 2.9e,f,g 33.2 � 3.4e,f,g 34.5 � 3.2e,f,g 26.7 � 2.4a,b,c,d 27.4 � 2.6a,b,c,d 27.7 � 2.5a,b,c,d 31.5 � 3Total LCPUFA 28.6 � 2.2e,f,g 27.9 � 2.3e,f,g 27.7 � 2.5e,f,g 28.8 � 2.4e,f,g 20.8 � 1.9a,b,c,d,h 22.2 � 2a,b,c,d 22.4 � 1.7a,b,c,d 26.1 � 2.1e
Total u-6 LCPUFA 16.7 � 1.3e,f,g 16.5 � 1.2e,f,g 15.6 � 1.4e,f,g 17.2 � 1.4e,f,g 12.5 � 1.1a,b,c,d 13.4 � 1.3a,b,c,d 13.7 � 1.5a,b,c,d 15.2 � 1.4e
Total u-3 LCPUFA 11.9 � 0.8e,f,g 11.4 � 0.7e,f,g 12.1 � 0.9e,f,g 11.6 � 0.7e,f,g 8.30 � 0.6a,b,c,d,h 8.00 � 0.5a,b,c,d,h 8.70 � 0.6a,b,c,d,h 10.9 � 0.6e,f,g
u-6/u-3 LCPUFA ratio 1.40 � 0.3 1.48 � 0.4 1.29 � 0.3 1.48 � 0.5 1.51 � 0.4 1.68 � 0.3 1.57 � 0.4 1.39 � 0.3
AA, arachidonic acid; ALA, a-linolenic acid; ANOVA, analysis of variance; DHA, docosahexaenoic acid; DPA, docosapentaenoic acid; EPA, eicosapentaenoic acid; EVOO, extra virgin olive oil; FAME, fatty acid methyl ester; HFD,high-fat diet; LA, linolenic acid; LCPUFA, polyunsaturated fatty acid; long-chain MUFA, monounsaturated fatty acid; PUFA, polyunsaturated fatty acid; SFA, saturated fatty acid
* Values are expressed as g fatty acid/100 g FAME and represent the mean� SEM for N¼ 10 to 12 mice per experimental group. Significant differences between the groups are indicated by the letter identifying each group(two-way ANOVA and Bonferroni posttest; P < 0.05). Identification of saturated and unsaturated fatty acids and their relationships are shown in Table 2.
M.A
.Rinc �on-Cerveraet
al./Nutrition
32(2016)
1254–1267
1261
M. A. Rinc�on-Cervera et al. / Nutrition 32 (2016) 1254–12671262
Hepatic and plasma oxidative stress-related parameters
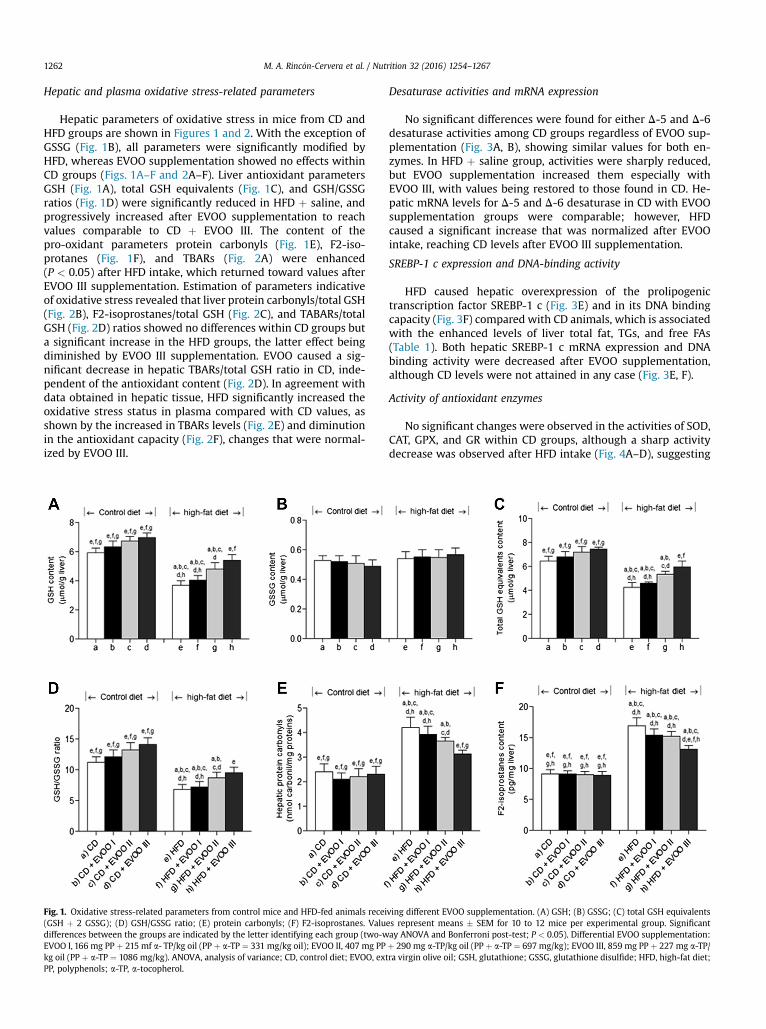
Hepatic parameters of oxidative stress in mice from CD andHFD groups are shown in Figures 1 and 2. With the exception ofGSSG (Fig. 1B), all parameters were significantly modified byHFD, whereas EVOO supplementation showed no effects withinCD groups (Figs. 1A–F and 2A–F). Liver antioxidant parametersGSH (Fig. 1A), total GSH equivalents (Fig. 1C), and GSH/GSSGratios (Fig. 1D) were significantly reduced in HFD þ saline, andprogressively increased after EVOO supplementation to reachvalues comparable to CD þ EVOO III. The content of thepro-oxidant parameters protein carbonyls (Fig. 1E), F2-iso-protanes (Fig. 1F), and TBARs (Fig. 2A) were enhanced(P < 0.05) after HFD intake, which returned toward values afterEVOO III supplementation. Estimation of parameters indicativeof oxidative stress revealed that liver protein carbonyls/total GSH(Fig. 2B), F2-isoprostanes/total GSH (Fig. 2C), and TABARs/totalGSH (Fig. 2D) ratios showed no differences within CD groups buta significant increase in the HFD groups, the latter effect beingdiminished by EVOO III supplementation. EVOO caused a sig-nificant decrease in hepatic TBARs/total GSH ratio in CD, inde-pendent of the antioxidant content (Fig. 2D). In agreement withdata obtained in hepatic tissue, HFD significantly increased theoxidative stress status in plasma compared with CD values, asshown by the increased in TBARs levels (Fig. 2E) and diminutionin the antioxidant capacity (Fig. 2F), changes that were normal-ized by EVOO III.
Fig. 1. Oxidative stress-related parameters from control mice and HFD-fed animals recei(GSH þ 2 GSSG); (D) GSH/GSSG ratio; (E) protein carbonyls; (F) F2-isoprostanes. Valudifferences between the groups are indicated by the letter identifying each group (two-wEVOO I, 166 mg PP þ 215 mf a- TP/kg oil (PP þ a-TP ¼ 331 mg/kg oil); EVOO II, 407 mg PPkg oil (PP þ a-TP ¼ 1086 mg/kg). ANOVA, analysis of variance; CD, control diet; EVOO, extPP, polyphenols; a-TP, a-tocopherol.
Desaturase activities and mRNA expression
No significant differences were found for either D-5 and D-6desaturase activities among CD groups regardless of EVOO sup-plementation (Fig. 3A, B), showing similar values for both en-zymes. In HFD þ saline group, activities were sharply reduced,but EVOO supplementation increased them especially withEVOO III, with values being restored to those found in CD. He-patic mRNA levels for D-5 and D-6 desaturase in CD with EVOOsupplementation groups were comparable; however, HFDcaused a significant increase that was normalized after EVOOintake, reaching CD levels after EVOO III supplementation.
SREBP-1 c expression and DNA-binding activity
HFD caused hepatic overexpression of the prolipogenictranscription factor SREBP-1 c (Fig. 3E) and in its DNA bindingcapacity (Fig. 3F) compared with CD animals, which is associatedwith the enhanced levels of liver total fat, TGs, and free FAs(Table 1). Both hepatic SREBP-1 c mRNA expression and DNAbinding activity were decreased after EVOO supplementation,although CD levels were not attained in any case (Fig. 3E, F).
Activity of antioxidant enzymes
No significant changes were observed in the activities of SOD,CAT, GPX, and GR within CD groups, although a sharp activitydecrease was observed after HFD intake (Fig. 4A–D), suggesting
ving different EVOO supplementation. (A) GSH; (B) GSSG; (C) total GSH equivalentses represent means � SEM for 10 to 12 mice per experimental group. Significantay ANOVA and Bonferroni post-test; P < 0.05). Differential EVOO supplementation:þ 290 mg a-TP/kg oil (PP þ a-TP ¼ 697 mg/kg); EVOO III, 859 mg PP þ 227 mg a-TP/ra virgin olive oil; GSH, glutathione; GSSG, glutathione disulfide; HFD, high-fat diet;

Fig. 2. Oxidative stress-related parameters from control mice and HFD-fed animals receiving different EVOO supplementation. (A) hepatic TBARs; (B) protein carbonyl/GSHratio; (C) F2-isoprostanes/GSH ratio; (D) hepatic TBARs/total GSH ratio; (E) plasma TBARs; (F) plasma antioxidant capacity. Values represent means � SEM for 10 to 12 miceper experimental group. Significant differences between the groups are indicated by the letter identifying each group (two-way ANOVA and Bonferroni post-test). Fordifferential EVOO supplementation see legend to Fig. 1. ANOVA, analysis of variance; CD, control diet; EVOO, extra virgin olive oil; GSH, glutathione; HFD, high-fat diet; TBARS,thiobarbituric acid reactants.
M. A. Rinc�on-Cervera et al. / Nutrition 32 (2016) 1254–1267 1263
that HFD leads to an impaired antioxidant status in the liver.However, EVOO supplementation progressively enhanced theactivity of the enzymes in HFD groups to reach CD values afterEVOO III supplementation (Fig. 4A–D).
Activity of hepatic lipogenic and lipolytic enzymes
Liver activities of the lipogenic enzymes ACC and FAS and thatof the lipolytic enzyme CPT-1 for CD and HFD groups are shownin Figure 4E–G. No enzymatic activity modificationwas observedwithin the four CD groups. HFD induced a large increase in ACCand FAS activity and a decrease in that of CPT-1, whereasEVOO supplementation contributes to regularize these changeswithout attaining CD levels.
Discussion
In agreement with previous studies in experimental animalsfed HFDs [38,39], C57 BL/6 J mice fed an HFD providing 60% ofenergy mainly as saturated fat (6.5 g of palmitic acid/100 g ofdiet) for 12 wk developed hyperlipidemia and hepatic steatosisin association with liver and plasma oxidative stress enhance-ment and insulin resistance, without progression into thesteatohepatitis phase. HFD-induced liver oxidative stress is evi-denced by a significant diminution in the content of total GSHequivalents and the GSH/GSSG ratio, with enhanced levels of thepro-oxidant indicators protein carbonyls, F2-isopostanes, andTBARs, and reduction in the activity of antioxidant enzymes. Thisredox imbalance is related to the fact that HFD provides excessSFAs, especially, palmitic acid, a condition that triggers
mitochondrial FA oxidation and reactive oxygen species pro-duction, a process known as lipotoxicity [40–42]. The excess offree SFAs in hepatic tissue would reflect a major imbalance in theredox state of nutritional origin [43,44], which also is observed inobese individuals with hepatic steatosis [45]. As a central path-ogenic mechanism, oxidative stress may trigger secondary al-terations that are relevant in the development of hepaticsteatosis, including the following:
1. u-3 LCPUFA depletion, a feature that is associated with ahigher lipid peroxidation extent of these FAs and/or lowersynthesis of u-3 LCPUFAs due to the reduction in the activityof D-5 and D-6 desaturase enzymes;
2. Endoplasmic reticulum stress development [40];3. Insulin resistance.
The prolipogenic state induced in the liver by HFD may becontributed by the following factors:
1. Palmitic acid-dependent upregulation of the mRNA expres-sion and DNA binding of transcription factor SREBP-1 c withconsequent ACC and FAS induction, thus promoting de novoFA synthesis [40,41,46]. This mechanism can be favored bythe u-3 LCPUFA depletion observed, considering that u-3LCPUFA normally inhibit the proteolytic processing ofnascent SREBP-1 c, with reduction of nuclear SREBP-1 clevels [47].
2. The alteration in the hepatic synthesis of u-3 LCPUFAs andtheir depletion may be related to the diminution in the ac-tivity of D-5 and D-6 desaturases found, the transcription of

Fig. 3. Hepatic desaturase activities and expression and hepatic SREBP-1 c expression and DNA-binding activity from control mice and HFD-fed animals receiving differentEVOO supplementation. (A) D-5 desaturase activity; (B) D-6 desaturase activity; (C) D-5 desaturase mRNA expression; (D) D-6 desaturase mRNA expression; (E) SREBP-1 cmRNA expression; (F) SREBP-1 c DNA binding activity. Values represent means � SEM for 10 to 12 mice per experimental group. Significant differences between the groupsare indicated by the letter identifying each group (two-way ANOVA and Bonferroni post-test; P < 0.05). For differential EVOO supplementation see legend to Fig. 1. ANOVA,analysis of variance; EVOO, extra virgin olive oil; HFD, high-fat diet.
M. A. Rinc�on-Cervera et al. / Nutrition 32 (2016) 1254–12671264
which may be elevated as a compensatory mechanism. Thisfinding requires further investigation in the insulin resis-tance model use, considering that insulin has a direct effecton the expression of these enzymes [10]. Loss of desaturaseactivity is associated with the induction of oxidative stress,which triggers free radical-mediated protein carbonylationthat can lead to protein misfolding and proteasomal degra-dation [48]. Interestingly, increased levels of reactive oxygenspecies–induced unfolded proteins cause endoplasmic re-ticulum stress that triggers the proteolytic cleavage ofSREBP-1 c [49], a process also stimulated by high saturatedfat diets [50], thus reinforcing the lipogenic mechanismsdiscussed in the first factor.
3. Insulin resistance triggering peripheral lipolysis withenhanced fluxes of FAs and glycerol to the liver to supportlipogenesis [43]. These observations establish an interrela-tionship between oxidative stress, endoplasmic reticulumstress, and insulin resistance leading to hepatic steatosis,which are related to a derangement in the synthesis andavailability u-3 LCPUFA in the liver and extrahepatic tissues[11,12] and SREBP-1 c upregulation.
Dietary supplementation with EVOO III, having the highestcontent of a-tocopherol and polyphenols among the threeassayed oils, produced either normalization or attenuation of theharmful effects of HFD, particularly those preventing oxidativestress or conserving tissue levels and biosynthetic capacity of n-3LCPUFA. In this regard, EVOO is considered an important dietary
component in the prevention and/or treatment of hepatic stea-tosis [51] that is capable of improving postprandial glucose levelsand the response to insulin [52]. These effects are related to itscontent of OA and antioxidants, bioactive substances that wouldregulate different cyto-protective mechanisms against an over-load of energy, such as a high intake of SFA, fructose, or sucrose[16,53].
In rats fed a prolipogenic diet (deficient in choline andmethionine) EVOO prevents hepatic TG accumulation [54],establishing that increasing hepatic antioxidant defenses wouldbe one of the main cytoprotective mechanisms of action of EVOO[16,53,55]. In the present study, only EVOO III was able to preventhepatic and systemic oxidative stress induced by HFD, withconcomitant normalization of the expression and the activity ofD-5 and D-6 desaturases. These effects were not elicited by theother two EVOO types employed, which had a lower content ofantioxidants and antioxidant capacity. Therefore, it is suggestedthat the antioxidant effect generated by the dietary supple-mentation with the antioxidant-rich EVOO III may positivelyinfluence the intracellular redox state [16], which is reflected inthe normalization of the activity of hepatic antioxidant enzymes.
Among the polyphenols present in EVOO, hydroxytyrosol isprobably the molecule having the greatest ability to regulate theintracellular redox state by increasing both the expression andthe activity of antioxidant enzymes, particularly SOD, CAT, GPX,and GR [56,57]. Additionally, hydroxytyrosol modulates theexpression of genes linked to the metabolism of xenobiotics in apositive way through activation of transcription factor Nrf2 [58].

Fig. 4. Hepatic activity of antioxidant enzymes and lipolytic and lipogenic enzymes from control mice and HFD-fed animals receiving different EVOO supplementation. (A)SOD; (B) CAT; (C) GPX; (D) GR; (E) ACC; (F) FAS; (G) CPT-1. Values represent means � SEM for 10 to 12 mice per experimental group. Significant differences between thegroups are indicated by the letter identifying each group (two-way ANOVA and Bonferroni post-test; P < 0.05). For differential EVOO supplementation see legend to Fig. 1.ACC, acetyl CoA carboxylase; ANOVA, analysis of variance; EVOO, extra virgin olive oil; FAS, fatty acid synthase; HFD, high-fat diet; CAT, catalase; CPT, carnitine-palmitoyltransferase; GPX, glutathione peroxidase; GR, glutathione reductase; SOD, superoxide dismutase.
M. A. Rinc�on-Cervera et al. / Nutrition 32 (2016) 1254–1267 1265
HFD generated an important reduction of u-3 LCPUFA tissuelevels, which was normalized by dietary supplementation withEVOO III in various tissues studied. In this regard, HFD and thesubsequent induced oxidative stress directly affected hepaticsynthesis and accretion of u-3 LCPUFA in extrahepatic tissuessuch as erythrocytes, heart, adipose tissue, and brain [12], effectsthat were prevented by antioxidant-rich EVOO III. In this context,the hepatic synthesis of u-3 LCPUFAs and their consequentstorage (e.g., in adipose tissue) and active transport of these FAsto other tissues (e.g., brain) allows maintaining physiologicallevels of u-3 LCPUFA [59]. In brain, HFD produced a significant33% reduction in the levels of DHA comparedwith CD, which wasprevented by EVOO III. Therefore, by preventing oxidative stressgenerated by HFD it was possible to maintain hepatic u-3LCPUFA synthesis, the flow of these FAs to systemic circulation,and their deposition in other tissues, particularly DHA into thebrain. In this regard, brain u-3 LCPUFA metabolism is quitecomplex [60].
Rats fed diets with very lowDHA content increased up to 100-fold the brain DHA synthesis from ALA [61], whereas feeding
with diets rich in ALA showed a significant increase in brain DHAlevels but not EPA levels [29]. The low brain content of EPA maybe due to a limited transport from the systemic circulation, pri-marily from hepatic origin, and a marginal brain synthesis [62].Brain EPA is quickly b-oxidized, elongated, and desaturated to u-3 DPA and then to DHA, but is not stored in brain phospholipids[62].
A remarkable aspect observed in all the studied tissues is thereduction in u-3 LCPUFA levels by the HFD, particularly EPA andDHA, which may be ascribed to a reduced synthesis from theprecursor due to low desaturase activity and/or increasedmetabolic utilization. This has been particularly shown in hepaticand brain tissues [12,63]. Cellular stress, particularly oxidativestress, increases the synthesis of eicosanoids from EPA anddocosanoids from DHA as a way to prevent cell damage [63].EVOO III, which prevents oxidative stress induced by HFD, is ableto maintain tissue levels of u-3 LCPUFA in different tissues,which is important in the regulation of energy metabolism andwhole-cell physiology [64]. In this context, u-3 LCPUFAs activateperoxisome-proliferator receptor-a (PPAR-a) leading to the

M. A. Rinc�on-Cervera et al. / Nutrition 32 (2016) 1254–12671266
stimulation of mitochondrial FA oxidation [65], which consti-tutes a major aspect related to the antilipogenic effects of u-3LCPUFA [66]. In the tissues studied, especially in the liver, HFDinduced a significant increase in the u-6/u-3 ratios in addition tothe reduction in the levels of u-3 LCPUFAs, a LCPUFA unbalancedirectly related to the development of hepatic steatosis [43].EVOO III was the supplement able to preserve u-3 LCPUFA tissuelevels attenuating the hepatic prolipogenic state induced by HFD.
Conclusion
Dietary supplementation with EVOO rich in antioxidants (a-tocopherol and polyphenols; EVOO III) mitigated the deleteriouseffects induced by HFD in mice in association with reduction inthe oxidative stress status, maintenance of the synthesis of u-3LCPUFA, and prevention of tissue depletion of these FAs. Theseeffects were not observed with the other EVOO types (EVOO Iand EVOO II) containing lower levels of antioxidants, thusestablishing a threshold for the antioxidant content of EVOOs toattain beneficial effects. Data presented also demonstrate theimportance of dietary interventions that consider supplemen-tation with EVOO, particularly its antioxidant potential [15,16,53]. Recently, it has been shown that administration of lowdoses of u-3 LCPUFA (EPA þ DHA) and EVOO rich in antioxidantsprevent hepatic steatosis in mice fed HFD [67], an observationthat reinforces the importance of dietary interventionsaddressing oxidative stress prevention and u-3 LCPUFAtissue-level preservation [12,38,43].
Supplementary data
Supplementary data related to this article can be found athttp://dx.doi.org/10.1016/j.nut.2016.04.006.
References
[1] Janssen CI, Kiliaan AJ. Long-chain polyunsaturated fatty acids from genesisto senescence: the influence of LCPUFA on neural development, aging, andneurodegeneration. Prog Lipid Res 2014;53:1–17.
[2] Maehre HK, Jensen IJ, Elvevoll EO, Eilertsen KE. u-3 Fatty acids and car-diovascular diseases: effects, mechanisms and dietary relevance. Int J MolSci 2015;16:22636–61.
[3] Doi M, Nosaka K, Miyoshi T, Iwamoto M, Kajiya M, Okawa K, et al. Earlyeicosapentaenoic acid treatment after percutaneous coronary interventionreduces acute inflammatory responses and ventricular arrhythmias in pa-tients with acute myocardial infarction: a randomized, controlled study. IntJ Cardiol 2014;176:577–82.
[4] Mozaffarian D, Wu JH. Fatty acids and cardiovascular health: are effects ofEPA and DHA shared or complementary? J Nutr 2012;142:614S–25S.
[5] Lee LK, Bryant KJ, Bouveret R, Lei PW, Duff AP, Harrop SJ, et al. Selectiveinhibition of human group IIA-secreted phospholipase A2 signaling revealsarachidonic acid metabolism is associated with colocalization of hGIIA tovimentin in rheumatoid synoviocytes. J Biol Chem 2013;288:15269–79.
[6] van Goor SA, Dijck-Brouwer DA, Erwich JJ, Schaafsma A, Hadders-Algra M.The influence of supplemental docosahexaenoic and arachidonic acidsduring pregnancy and lactation on neurodevelopment at eighteen months.Prostaglandins Leukot Essent Fatty Acids 2011;84:139–46.
[7] Fats and fatty acids in human nutrition. Report of an expert consultation.FAO Food Nutr Pap 2010;91:1–166.
[8] Hansen A, Wiese H, Boelsche A, Haggard M, Adam D, Davis H. Role oflinolenic acid in infant nutrition: clinical and chemical study of 428 infantsfed on milk mixtures varying in kind and amount of fat. Pediatrics1963;31:171–92.
[9] Nakamura MT, Nara TY. Structure, function, and dietary regulation ofdelta6, delta5, and delta9 desaturases. Annu Rev Nutr 2004;24:345–76.
[10] Das UN. A defect in the activity of Delta6 and Delta5 desaturases may be afactor predisposing to the development of insulin resistance syndrome.Prostaglandins Leukot Essent Fatty Acids 2005;72:343–50.
[11] Araya J, Rodrigo R, Pettinelli P, Araya AV, Poniachik J, Videla LA. Decreasedliver fatty acid delta-6 and delta-5 desaturase activity in obese patients.Obesity 2010;18:1460–3.
[12] Valenzuela R, Barrera C, Espinosa A, Llanos P, Orellana P, Videla LA.Reduction in the desaturation capacity of the liver in mice subjected tohigh fat diet: relation to LCPUFA depletion in liver and extrahepatic tissues.Prostaglandins Leukot Essent Fatty Acids 2015;98:7–14.
[13] Toledo E, Salas-Salvad�o J, Donat-Vargas C, Buil-Cosiales P, Estruch R, Ros E,et al. Mediterranean diet and invasive breast cancer risk among women athigh cardiovascular risk in the PREDIMED trial: a randomized clinical trial.JAMA Intern Med 2015;14:1–9.
[14] Qosa H, Mohamed LA, Batarseh YS, Alqahtani S, Ibrahim B, LeVine H 3rd,et al. Extra-virgin olive oil attenuates amyloid-b and tau pathologies in thebrains of TgSwDI mice. J Nutr Biochem 2015;26:1479–90.
[15] Cicerale S, Conlan XA, Barnett NW, Sinclair AJ, Keast RS. Influence of heaton biological activity and concentration of oleocanthalda natural anti-inflammatory agent in virgin olive oil. J Agric Food Chem 2009;57:1326–30.
[16] Cicerale S, Lucas LJ, Keast RS. Antimicrobial, antioxidant and anti-inflammatory phenolic activities in extra virgin olive oil. Curr Opin Bio-technol 2012;23:129–35.
[17] Scoditti E, Capurso C, Capurso A, Massaro M. Vascular effects of the Med-iterranean diet-part II: role of omega-3 fatty acids and olive oil poly-phenols. Vascul Pharmacol 2014;63:127–34.
[18] Storniolo CE, Rosell�o-Catafau J, Pint�o X, Mitjavila MT, Moreno JJ. Polyphenolfraction of extra virgin olive oil protects against endothelial dysfunctioninduced by high glucose and free fatty acids through modulation of nitricoxide and endothelin-1. Redox Biol 2014;2:971–7.
[19] Carrasco-Pancorbo A, Cerretani L, Bendini A, Segura-Carretero A, DelCarlo M, Gallina-Toschi T, et al. Evaluation of the antioxidant capacity onindividual phenolic compounds in virgin olive oil. J Agric Food Chem2005;53:8918–25.
[20] Matthews DR, Hosker JP, Rudenski AS, Naylor BA, Treacher DF, Turner RC.Homeostasis model assessment: insulin resistance and beta-cell functionfrom fasting plasma glucose and insulin concentrations in man. Dia-betologia 1985;28:412–9.
[21] Mateos R, Espartero JL, Trujillo M, R�ıos JJ, Le�on Camacho M, Alcudia F, et al.Determination of phenols, flavones, and lignans in virgin olive oils by solid-phase extraction and high-performance liquid chromatography with diodearray ultraviolet detection. J Agric Food Chem 2001;49:2185–92.
[22] Bligh EG, Dyer WJ. A rapid method of total lipid extraction and purification.Can J Biochem Physiol 1959;37:911–7.
[23] Ruiz-Gutierrez V, Cert A, Rios JJ. Determination of phospholipid fatty acidand triacylglycerol composition of rat caecal mucosa. J Chromatogr1992;575:1–6.
[24] American Oil Chemists’ Society. Official methods and recommendedpractices of the American Oil Chemists’ Society. Champaign, IL: AmericanOil Chemists’ Society; 1993.
[25] Prior RL, Hoang H, Gu L, Wu X, Bacchiocca M, Howard L, et al. Assays forhydrophilic and lipophilic antioxidant capacity (oxygen radical absorbancecapacity (ORAC(FL))) of plasma and other biological and food samples. JAgric Food Chem 2003;51:3273–9.
[26] Morrison WR, Smith LM. Preparation of fatty acid methyl esters anddimethylacetals from lipids with boron fluoridedmethanol. J Lipid Res1964;5:600–8.
[27] Rahman I, Kode A, Biswas SK. Assay for quantitative determination ofglutathione and glutathione disulfide levels using enzymatic recyclingmethod. Nat Protoc 2006;1:3159–65.
[28] Su HM, Brenna JT. Simultaneous measurement of desaturase activitiesusing stable isotope tracers or a nontracer method. Anal Biochem1998;261:43–50.
[29] Valenzuela R, Barrera C, Gonz�alez-Astorga M, Sanhueza J, Valenzuela A.Alpha linolenic acid from Rosa canina, sacha inchi and chia oils may in-crease ALA accretion and its conversion into n-3 LCPUFA in diverse tissuesof the rat. Food Funct 2014;5:1564–72.
[30] Chow CK, Reddy K, Tappel AL. Effect of dietary vitamin E on the activities ofthe glutathione peroxidase system in rat tissues. J Nutr 1973;103:618–24.
[31] L�uck H. In: Bergmeyer HU, editor. Methods of enzymatic assays. New York,NY: Academic Press; 1965. p. 885–94.
[32] Paglia DE, Valentine WN. Studies on the quantitative and qualitativecharacterization of erythrocyte glutathione peroxidase. J Lab Clin Med1967;70:158–69.
[33] Bergmeyer HU, Horn HD. Gluthathione reductase. In: Bergmeyer HU, edi-tor. Methods of enzymatic assays. New York, NY: Academic Press; 1965. p.875–9.
[34] Zimmermann R, Haemmerle G, Wagner EM, Strauss JG, Kratky D,Zechner R. Decreased fatty acid esterification compensates for the reducedlipolytic activity in hormone-sensitive lipase-deficient white adipose tis-sue. J Lipid Res 2003;44:2089–99.
[35] CohenAM,BrillerS, Shafrir E.Effectof long termsucrose feedingontheactivityof some enzymes regulating glycolysis, lipogenesis and gluconeogenesis in ratliver and adipose tissue. Biochim Biophys Acta 1972;279:129–38.
[36] Halestrap AP, Denton RM. Insulin and the regulation of adipose tissueacetyl-coenzyme A carboxylase. Biochem J 1973;132:509–17.
[37] Karlic H, Lohninger S, Koeck T, Lohninger A. Dietary l-carnitine stimulatescarnitine acyltransferases in the liver of aged rats. J Histochem Cytochem2002;50:205–12.
M. A. Rinc�on-Cervera et al. / Nutrition 32 (2016) 1254–1267 1267
[38] Valenzuela R, Espinosa A, Gonz�alez-Ma~n�an D, D’Espessailles A,Fern�andez V, Videla LA, et al. N-3 long-chain polyunsaturated fatty acidsupplementation significantly reduces liver oxidative stress in high fatinduced steatosis. PLoS One 2012;7:E46400.
[39] Wiedemann MS, Wueest S, Item F, Schoenle EJ, Konrad D. Adipose tissueinflammation contributes to short-term high-fat diet-induced hepatic in-sulin resistance. Am J Physiol Endocrinol Metab 2013;305:E388–95.
[40] Nissar AU, Sharma L, Tasduq SA. Palmitic acid induced lipotoxicity isassociated with altered lipid metabolism, enhanced CYP450 2 E1 andintracellular calcium mediated ER stress in human hepatoma cells. ToxicolRes 2015;4:1344–58.
[41] Win S, Than TA, Le BH, Garc�ıa-Ruiz C, Fernandez-Checa JC, Kaplowitz N. Sabdependence of JNK mediated inhibition of mitochondrial respiration inpalmitic acid induced hepatocyte lipotoxicity. J Hepatol 2015;62:1367–74.
[42] Satapati S, Sunny NE, Kucejova B, Fu X, He TT, M�endez-Lucas A, et al.Elevated TCA cycle function in the pathology of diet-induced hepatic in-sulin resistance and fatty liver. J Lipid Res 2012;53:1080–92.
[43] Valenzuela R, Videla LA. The importance of the long-chain polyunsaturatedfatty acid n-6/n-3 ratio in development of non-alcoholic fatty liver asso-ciated with obesity. Food Funct 2011;2:644–8.
[44] Sies H, Stahl W, Sevanian A. Nutritional, dietary and postprandial oxidativestress. J Nutr 2005;135:969–72.
[45] Videla LA, Rodrigo R, Orellana M, Fern�andez V, Tapia G, Qui~nones L, et al.Oxidative stress-related parameters in the liver of non-alcoholic fatty liverdisease patients. Clin Sci 2004;106:261–8.
[46] Horton JD, Goldstein JL, Brown MS. SREBPs: activators of the completeprogram of cholesterol and fatty acid synthesis in the liver. J Clin Invest2002;109:1125–31.
[47] Deng X, Dong Q, Bridges D, Raghow R, Park EA, Elam MB. Docosahexaenoicacid inhibits proteolytic processing of sterol regulatory element-bindingpotein-1 c via activation of AMP-activated kinase. Biochim Biophys Acta2015;1851:1521–9.
[48] Shang F, Taylor A. Ubiquitin-proteasome pathway and cellular responses tooxidative stress. Free Radic Biol Med 2011;51:5–16.
[49] Kammoun HL, Chabanon H, Hainault I, Luquet S, Magnan C, Koike T, et al.GRP78 expression inhibits insulin and ER stress-induced SREBP-1 c acti-vation and reduces hepatic steatosis in mice. J Clin Invest 2009;119:1201–15.
[50] Gentile CL, Fyye MA, Pagliassotti MJ. Fatty acids and the endoplasmic re-ticulum in nonalcoholic fatty liver disease. Biofactors 2011;37:8–16.
[51] Priore P, Cavallo A, Gnoni A, Damiano F, Gnoni GV, Siculella L. Modulationof hepatic lipid metabolism by olive oil and its phenols in nonalcoholicfatty liver disease. IUBMB Life 2015;67:9–17.
[52] Jemai H, El Feki A, Sayadi S. Antidiabetic and antioxidant effects ofhydroxytyrosol and oleuropein from olive leaves in alloxan-diabetic rats. JAgric Food Chem 2009;57:8798–804.
[53] Cicerale S, Conlan XA, Sinclair AJ, Keast RS. Chemistry and health of olive oilphenolics. Crit Rev Food Sci Nutr 2009;49:218–36.
[54] Hussein O, Grosovski M, Lasri E, Svalb S, Ravid U, Assy N. Monounsaturatedfat decreases hepatic lipid content in non-alcoholic fatty liver disease inrats. World J Gastroenterol 2007;13:361–8.
[55] Nakbi A, Tayeb W, Dabbou S, Chargui I, Issaoui M, Zakhama A, et al.Hypolipidimic and antioxidant activities of virgin olive oil and its fractionsin 2,4-diclorophenoxyacetic acid-treated rats. Nutrition 2012;28:81–91.
[56] Merra E, Calzaretti G, Bobba A, Storelli MM, Casalino E. Antioxidant role ofhydroxytyrosol on oxidative stress in cadmium-intoxicated rats: differenteffect in spleen and testes. Drug Chem Toxicol 2014;37:420–6.
[57] Vilaplana-P�erez C, Au~n�on D, Garc�ıa-Flores LA, Gil-Izquierdo A. Hydrox-ytyrosol and potential uses in cardiovascular diseases, cancer, and AIDS.Front Nutr 2014;27:1–18.
[58] Zou X, Feng Z, Li Y, Wang Y, Wertz K, Weber P, et al. Stimulation of GSHsynthesis to prevent oxidative stress-induced apoptosis by hydroxytyrosolin human retinal pigment epithelial cells: activation of Nrf2 and JNK-p62/SQSTM1 pathways. J Nutr Biochem 2012;23:994–1006.
[59] Domenichiello AF, Kitson AP, Bazinet RP. Is docosahexaenoic acid synthesisfrom a-linolenic acid sufficient to supply the adult brain? Prog Lipid Res2015;59:54–66.
[60] Chen CT, Kitson AP, Hopperton KE, Domenichiello AF, Tr�epanier MO, Lin LE,et al. Plasma non-esterified docosahexaenoic acid is the major pool sup-plying the brain. Sci Rep 2015;5:15791.
[61] Domenichiello AF, Chen CT, Trepanier MO, Stavro PM, Bazinet RP. Wholebody synthesis rates of DHA from a-linolenic acid are greater than brainDHA accretion and uptake rates in adult rats. J Lipid Res 2014;55:62–74.
[62] Bazinet RP, Lay�e S. Polyunsaturated fatty acids and their metabolites inbrain function and disease. Nat Rev Neurosci 2014;15:771–85.
[63] Serhan CN. Pro-resolving lipid mediators are leads for resolution physi-ology. Nature 2014;510:92–101.
[64] Nakamura MT, Yudell BE, Loor JJ. Regulation of energy metabolism by long-chain fatty acids. Prog Lipid Res 2014;53:124–44.
[65] Z�u~niga J, Cancino M, Medina F, Varela P, Vargas R, Tapia G, et al. N-3 PUFAsupplementation triggers PPAR-a activation and PPAR-a/NF-kB interaction:anti-inflammatory implications in liver ischemia-reperfusion injury. PLoSOne 2011;6:E28502.
[66] Tapia G, Valenzuela R, Espinosa A, Romanque P, Dossi C, Gonzalez-Ma~n�an D, et al. N-3 long-chain PUFA supplementation prevents high fatdiet induced mouse liver steatosis and inflammation in relation to PPAR-aupregulation and NF-kB DNA binding abrogation. Mol Nutr Food Res2014;58:1333–41.
[67] Valenzuela R, Espinosa A, Llanos P, Hernandez-Rodas MC, Barrera C,Vergara D, et al. Anti-steatotic effects of an n-3 LCPUFA and extra virginolive oil mixture in the liver of mice subjected to high-fat diet. Food Funct2016;7:140–50.