Embed Size (px)
Citation preview

Ant‐App‐DB: Work Flow, UML Designs, Configuration and
Calculation Steps
Supplementary to Ant‐App‐DB: A Smart Solution for
Monitoring the Arthropods’ Activities, Experimental Data
Management and Solar Calculations without GPS in
Behavioural Field Studies
Zeeshan Ahmeda1‐3, Saman Zeeshann3, Pauline Fleischmann4, Wolfgang Rössler4, Dandekar
Thomas3, 5
[1] Department of Quantitative Health Sciences, University of Massachusetts Medical School, Greater Boston, MA 01605, USA
[2] Department of Neurobiology and Genetics, Biocenter, University of Wuerzburg, 97074, Wuerzburg, Germany
[3] Department of Bioinformatics, Biocenter, University of Wuerzburg, 97074 Wuerzburg, Germany
[4] Department of Behavioral Physiology and Sociobiology, Biocenter, University of Wuerzburg, 97074 Wuerzburg, Germany
[5] EMBL, Structural and Computational Biology Unit, 69117 Heidelberg, Germany
Author notes:
Correspondence to: [a] [email protected]
The authors declare no conflict of interest.
Installation and Configuration
Ant-App-DB
The Android Application Package (APK) file of Ant-App-DB first needs to be downloaded either from the project’s web page link (http://www.neurogenetics.biozentrum.uni-wuerzburg.de/en/project/services/ant_app_db/), directly from http://www.neurogenetics.biozentrum.uni-wuerzburg.de/fileadmin/07030100/user_upload/zeeshan/antappdb/AppAntDatabase.apk, or from Zenodo at https://zenodo.org/record/13223#.VIq9CxZkwqJ.
Simply copy the “AppAntDatabase.apk” file into the Android phone’s accessible memory (internal storage or external SD card). Download and install a third party software

application i.e. App Installer (by the Google play), locate the Ant-App-DB application and then install its APK file.
Another way of loading, sharing and backing up the application using Android systems is to open the page store (from main menu of the Android smart phone or tablet), download and install the application “App Extractor”. Once it’s properly installed, running it will show all the installed applications in the smart phone. Clicking on the installed App-Ant-DB application allows users to share it with other smart phones (e.g. via Bluetooth), backup it in the form of an APK file and save it.
Android is a well reputed, open source, cheap and widely used operating system but has some limitations in comparison to the well-established, very costly and commercial smart phone system iOS. One major disadvantage of Android OS is its screen resolution and size at running one developed application in different smart phone sets of variable screen sizes and produced by different commercial companies [S. 1] (e.g. Samsung, HTC, Sony etc.). We have developed Ant-App-DB in both vertical and horizontal screens to minimize this limitation e.g. if the visibility is not very clear with vertical screen in some smart phones then the observer is recommended to try the horizontal screen of the same module. We have tested this application using the Sony Xperia Z1 smart phone device by both trained and untrained observers and with us it worked perfectly fine during in-house testing as well as in the field while doing real time experiments. The reason for choosing the Sony Xperia Z1 is to use a reliable and water proof smart phone device to avoid any problem caused by the sand, humidity and rain in the field (in our case deserts).
Dataplus
Dataplus is a very simple to use and install application but can only be configured on the Microsoft Windows platform (S-Fig. 1).
Supplementary Figure 1. Dataplus Installation Process.
We have tested the installation process on different personal computers as well as mobile devices, and found that it can be installed and used with ease and without major issues.

First download the executable file directly from the following web link: http://www.neurogenetics.biozentrum.uni-wuerzburg.de/fileadmin/07030100/user_upload/zeeshan/antappdb/Dataplus.exe or download from Zenodo (https://zenodo.org/record/13226#.VIsmgRZkwqJ).
Execute the provided setup file “Dataplus” and follow the six steps installation process (S-Fig. 1):
1. Agree to install the application (S-Fig. 1-1).
2. Read the instructions about licensing and availability of the application (S-Fig. 1-2).
3. Read and agree to the terms and conditions (S-Fig. 1-3).
4. Give the information destination folder (directory path), manually or by browsing directory (S-Fig. 1-4).
5. Installation progress (S-Fig. 1-5).
6. Notification at successful installation (S-Fig. 1-6).
Next, click on the installed application’s icon (Ant-App-DB Dataplus) on the desktop or execute application using the following sequence of steps: Start All Programs Ant-App-DB Dataplus v 1.0.0 Ant-App-DB Dataplus.
At the above mention project’ web link, one example dataset file is also provided (generated by the Ant-App-DB, using our smart phone), which can be used to test the Dataplus application. The Dataset file can also be directly downloaded from the following web link: http://www.neurogenetics.biozentrum.uni-wuerzburg.de/fileadmin/07030100/user_upload/zeeshan/antappdb/AntAppDB_2441970_7531_ExampleFile or from Zenodo (https://zenodo.org/record/13225?ln=en#.VIrSWBZkwqI).
Design Description of Ant‐App‐DB
The Ant‐App‐DB implementation follows the Butterfly paradigm (S‐Fig. 2).
Supplementary Figure 2. Butterfly: A three layered design model.

This figure shows the Butterfly software development model, consisting of three layers grey (the abstract layer), yellow (the basis for design and development), green (followed by implementation and testing by the user).
This is a well‐planned scientific solution, which was initially finalized using requirement engineering
principles, then conceptually modelled and mocked using Human Computer Interaction (HCI)
guidelines. Then it was programmed using appropriate tools and best available technologies. While
choosing the technologies environmental (extreme conditions with sand, high temperature, rain,
lack of internet and GPS etc.), usage (scientist with weak informatics background, time, data
management and solar estimations etc.) and recent technological (mobile development, hardware
devices, cost, mobility etc.) factors were considered. The end solution was tested in house by the
programmer and different scientists who will be using the system during experiments.
Ant‐App‐DB is a well designed application following Software Engineering ([S. 2], [S. 3] and UML
principles [S. 4], [S. 5] (including use case, dataflow, system sequence, class structures, activity work
flow and component diagram) and incorporating HCI [S. 6], [S. 7], [S. 8] design patterns. The
application was modeled using Astah Professional (tool to draw the UML diagrams). Ant‐App‐DB is
an impended three layered Butterfly model [S. 9], [S. 10].
Use Case
Supplementary Figure 3. Use Case Diagram of Ant‐App‐DB.

This Figure presents the designed and implemented use case diagram of the Ant-App-DB, which consists of eight direct (Experiment, Feeder, Register Ant, Ant, Quick Ant, Solar, Admin and Convert SQLite Database to Excel format) and three indirect activities (SolarTime, Azimuth and Dataplus).
Instead of making use cases for all modules of the application, this section presents an overall use case diagram (S-Fig. 3) which describes the overall options/features provided to the observers in doing the following tasks: data (experiment, feeder, ants) manipulations and management (enter, view, edit, save, delete), solar estimations (solar time and azimuth angle) and can export SQLite database from smart phone application to the personal computer and then using Dataplus to convert data into Microsoft Excel sheet format.
Dataflow
The application’s dataflow (S-Fig. 4) is organized around four previously mentioned modules (associated with different GUIs). The information about experiments is accessible via the Feeder and Register Ant modules, later then the information about the feeders and registered ants is available via the Ant module.
Supplementary Figure 4. Dataflow Diagram of Ant‐App‐DB.
This figure shows the data flow of the system. It starts with entering the Experiment details which are later used in the registration of the ants and the feeders. Furthermore, the stored (linked) information of experiments, feeders and registered ants is used during experimentation. All information is stored in the created database of the application.
System Sequence
The work flow of the application is also designed in the form of a system sequence diagram for in depth analysis and implementation. It starts with the user (actor) executing the Main. As shown (S-Fig. 5), based on the structured dataflow, the information interacts among six different process states: Experiment, Feeder, Register, Ant, Solar Calculations and Admin.
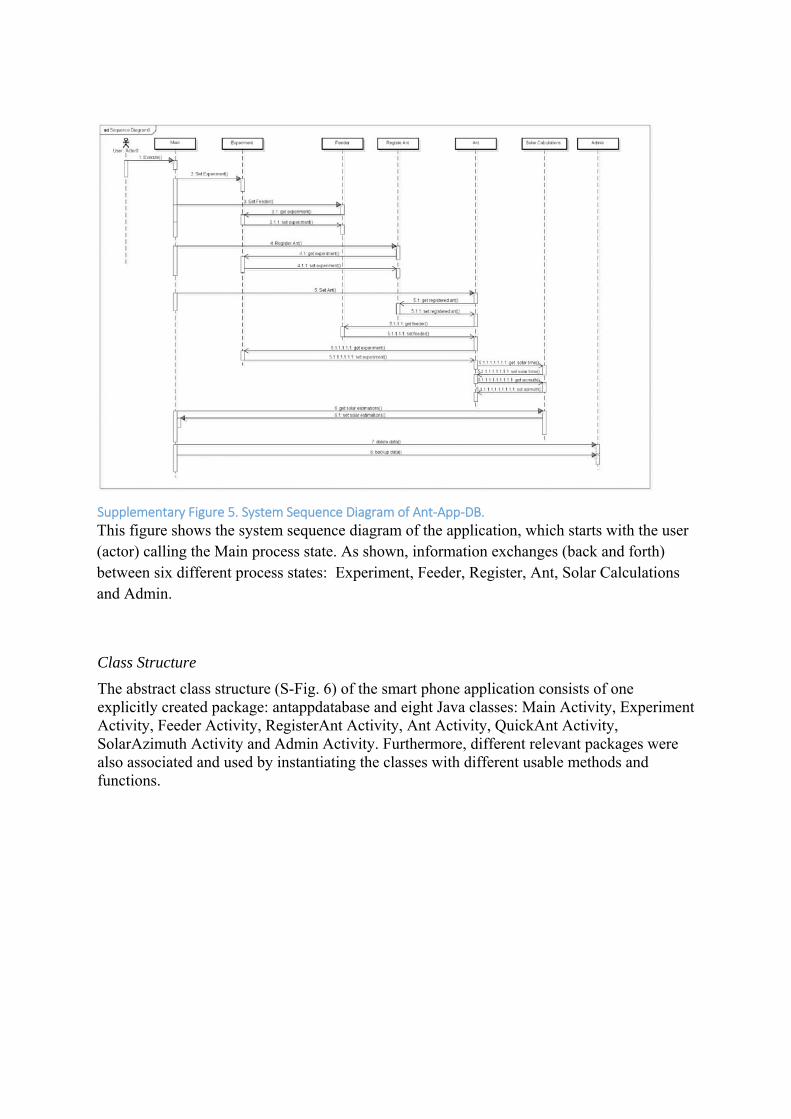
Supplementary Figure 5. System Sequence Diagram of Ant‐App‐DB.
This figure shows the system sequence diagram of the application, which starts with the user (actor) calling the Main process state. As shown, information exchanges (back and forth) between six different process states: Experiment, Feeder, Register, Ant, Solar Calculations and Admin.
Class Structure
The abstract class structure (S-Fig. 6) of the smart phone application consists of one explicitly created package: antappdatabase and eight Java classes: Main Activity, Experiment Activity, Feeder Activity, RegisterAnt Activity, Ant Activity, QuickAnt Activity, SolarAzimuth Activity and Admin Activity. Furthermore, different relevant packages were also associated and used by instantiating the classes with different usable methods and functions.

Supplementary Figure 6. Abstract Class Sequence Diagram of Ant‐App‐DB.
This figure shows the abstract class structure diagram of the application (without attributes), consisting of one explicitly created package: antappdatabase and eight object oriented classes (Java): Main Activity, Experiment Activity, Feeder Activity, RegisterAnt Activity, Ant Activity, QuickAnt Activity, SolarAzimuth Activity and Admin Activity.
Database Model
To manage the application’s data, an entity relationship model was designed and implemented (S‐
Fig. 7) in SQLite database management, which consists of four relations: Experiment, Feeder,
RegisterAnt and ExperimentAnt. As it is not possible to directly normalize the relationships using
SQLite database management system, we have manually managed the relationships (one to one /
one to many / many to many) in the source code of the application.

Supplementary Figure 7. Entity Relationship Diagram of Ant‐App‐DB.
This figure presents the designed and implemented entity–relationship model (ER model) of the Ant-App-DB. As shown, it consists of four tables: Experiment (expid, expname, expplace, expdatetime, expnote, explatitute, explongitude, exputctimezone), Feeder (feederid, expid, feedername, feederdatetime, feedernote), RegisterAnt (regterid, expid, antname, antdatetimem antnote) and ExperimentAnt (antid, registered, expid, feederid, datetime, solardatetime, azimuth).
GUI of Ant‐App‐DB
The real time work flow of the application starts with experiments (S-Fig. 9), feeders (S-Fig. 10) and registration of Ants (S-Fig. 11). Next, to record the visits of the Ants, the Quick Ant (S-Fig. 12) and the Ant interfaces (S-Fig. 13) are used. Later the recorded data is backed up using Admin (S-Fig. 14) and then using Dataplus converted into the Microsoft Excel file format “*.xlsx”. Additionally the information about solar time and Azimuth angle is calculated using interface “Approximate Solar Calculations” (S-Fig. 15).
Main
S-Fig. 8 presents the GUI of Main which consist of 6 important buttons leading to 6 different interfaces. The green computer button navigates to the Experiment’s interface (S-Fig. 9), the yellow bell button directs to the Feeder’s interface (S-Fig. 13), the orange pyramid button routes to the Ant interface (S-Fig. 14), the diamond button takes the user to the Quick Ant interface for registration (S-Fig. 16), the blue earth button proceeds to the Approximate Solar Calculations (S-Fig. 17) and the button with a man in a suit leads to the Admin interface (S-Fig. 18). Register Ant GUI (S-Fig. 15) can only be accessed using Ant GUI.

Supplementary Figure 8. GUI Ant‐App‐DB: Main.
This figure presents the graphical user interface of the Main with 6 important buttons leading to six different interfaces. The green computer button navigates to the Experiment’s interface, the yellow bell button directs to the Feeder’s interface, the orange pyramid button routes to the Ant interface, the red diamond button takes the user to the Quick Ant interface, the blue earth button proceeds to the Approximate Solar Calculations and the button with a man in a suit leads to to the Admin interface.
Experiments
The most important step is to first give the information about experiments. S-Fig. 9 presents the GUI of the Experiment, where information about the experiment can be entered, managed, deleted and viewed.
The information about the Experiment consists of the following properties: Name, Place, Data Time, Note, Latitude and Longitude of the location of the experiments (in both Degree and Minutes) and UTC Time Zone. ID will be automatically generated at the addition of a new experiment, and helpful when the user needs to update information or delete an experiment.
The provided five buttons are: Add, Update, Show, Delete and Home. After entering the data into the respective experiment’s fields, the user needs to press the button Add to add a new experiment. After giving the right ID in the respective field and the information which needs to be updated in the other respective fields, the user can update it in the database by pressing the button Update. The user can view the stored information about the experiment by clicking the button Show. The user can delete an experiment by giving its ID in the respective field and then pressing the button Delete. The home button will take the control of the application to the main page.

Supplementary Figure 9. GUI Ant‐App‐DB: Experiment.
This figure presents the graphical user interface of the Experiment, where the information about the experiment can be entered, managed, deleted and viewed.
Feeders
The next step is to add the information about feeders (S-Fig. 10). It is an optional step, the user can adopt at need. The information about feeders consists of the following properties: Feeder Name, Experiment and Note ID will be automatically generated upon the addition of a new feeder, and enables users to update information or delete feeders. The provided five buttons are: Add, Update, Show, Delete and Home. After entering the data into the respective feeder fields, the user need to press the button Add to add a new feeder. After entering the right ID into the respective field and updating information in the other respective fields, the user can update it in the database by pressing the button Update. The user can view the stored information about the feeders by clicking the button Show. The user can delete a feeder by entering its ID into the respective field and then pressing the button Delete. The home button will take the control of the application to the main page.

Supplementary Figure 10. GUI Ant‐App‐DB: Feeder.
This Figure presents the GUI of the Ant Feeder, where the information about the feeders can be entered, managed, deleted and viewed.
Ant
The information about Ant (S-Fig. 11) consists of the following properties: Ant Name, Note and Note. ID will be automatically generated upon the addition of a new ant, and enables the user s to update s information or delete an ant.
The provided seven buttons are: Add, Update, Show, Delete, Look, Register and Home. After entering the data in the respective ant’s fields, the user needs to press the button Add to add a new ant. After giving the right ID in the respective field and the information which needs to be updated in the other respective fields, the user can update it in the database by pressing the button Update. The user can delete an ant by entering its ID in the respective field and then pressing the button Delete. The Home button will take the control of the application to the main page.
The user can view the stored information about the ants by clicking the button Show. Additionally the user can search for a specific ant’s visits by first entering the name of the ant and clicking the button Look. As shown in the S-Fig. 11, the names of some ants are visible in combo list, moreover when the user clicks on the ant name field, and then the text field will display names as well. These are the registered ants, which have to be entered using the Register Ant interface by pressing the button Register. It is a mandatory step. The GUI of Register Ant can only be accessed from Ant but not from the Main interface. The information about ants consists of the following properties: Ant Name, Experiment and Note ID will be automatically generated upon the addition of a new ant, and enables user to update some information or delete ants. One important thing to mention is that, upon the registration of an ant, its first visit is automatically recorded and saved in Ants.

The provided six buttons are: Add, Update, Show, Delete, Home and Ant. After entering the data into the respective ant’s fields, the user need to press the button Add to add a new ant. After entering the right ID in the respective field and the information which needs to be updated in the other respective fields, the user can update it in the database by pressing the button Update. The user can view the stored information about the ants by clicking the button Show. The user can delete an ant by giving its ID in the respective field and then pressing the button Delete. The Home button will take the control of the application to the main page.
The user can view the stored information about the ants by clicking the button Show. Additionally the user can search for specific ant visits by first giving the name of the ant and clicking the button Look. As shown in S-Fig. 11, the names of some ants are visible in combo list, moreover when the user clicks on the ant name field, the text field will display some names as well. These are the registered ants, which have to be entered using the Register Ant interface by pressing the button Register.
Supplementary Figure 11. GUI Ant‐App‐DB: Ant.
This figure presents the GUI of Ant, where the information about the ants can be entered, managed, deleted and viewed
Register Ant
The prerequisite step of Ant is to register ants (S-Fig. 12). It is a mandatory step. The GUI of Register Ant can only be accessed from Ant but not from the Main interface. The information about ants consists of the following properties: Ant Name, Experiment and Note ID will be automatically generated upon the addition of a new ant, and enables the user to update information or delete ants. An important thing to mention is that, upon the registration of an ant, its first visit is automatically recorded and saved in the Ants.

The provided six buttons are: Add, Update, Show, Delete, Home and Ant. After giving the data in respective ant’s fields, the user needs to press the button Add to add a new ant. After giving the right ID in the respective field and the information which needs to be updated in the other respective fields, the user can update it in the database by pressing the button Update. The user can view the stored information about the ants by clicking the button Show. The user can delete some ant by entering its ID in the respective field and then pressing the button Delete. The home button will take the control of the application to the main page.
Supplementary Figure 12. GUI Ant‐App‐DB: Register Ant.
This figure presents the GUI of Register Ant, where the ants are registered and their information managed, deleted and viewed.
Quick Ant
The Quick Ant is a small interface to fasten the ant visit process (S-Fig. 13). It provides only text field to select and enter the name of the registered ant at its visit to the feeder. It provides only three buttons: Add, Show and Home. Add will enter the new visit, show will enable user to view all ant visits and home will take the control to the main of application.

Supplementary Figure 13. GUI Ant‐App‐DB: Quick Ant.
This Figure presents the graphical user interface of the Quick Ant, where the information about the Ants can only be partially entered and viewed.
Approximate Solar Calculations
Using the Approximate Solar Calculations interface (S-Fig. 14), the user can estimate the Gregorian Day Number, (Decimal Day, Decimal Day of the Year, Fractional Year), Equation of the Time, Declination, Solar Time Offset, Solar Time Solar Zenith Angle, Solar Hour Angle, Solar Azimuth Angle and Solar noon.
The user needs to give the following information: latitude and longitude in both degree and minutes (Note: in case there is not information in minutes or degree then give ‘0’ but don’t leave the field empty), date and time in specified format and UTC. After giving these details, the user needs to press the blue globe button to perform calculations and resultant values will be available in respective text fields. The Home button is also provided to take control to the main interface.

Supplementary Figure 14. GUI Ant‐App‐DB: Solar Calculations.
This figure presents the GUI of the Approximate Solar Calculations.
Admin
The GUI of the Admin (S-Fig. 15) provides seven different buttons: Clear Records – Ants, Clear Records – Registrations, Clear Records – Feeder, Clear Records – Experiments, Clear Records – All and Backup Data. At first, the user needs to give the secure key (“ant”) in the text field and by pressing the respective buttons the user can delete individual records as well as all records at once.
By clicking the button Backup Data, the user can generate a backup of the stored data in the application and can later transfer it to other smart phone devices or convert it into aMicrosoft Excel sheet format using the Dataplus application.
The name format of the backup file is “AntAppDB_Data_time” (date will be the set date in the mobile device and time will be the set time in the mobile phone), saved in the folder “AppAntDBFiles”.
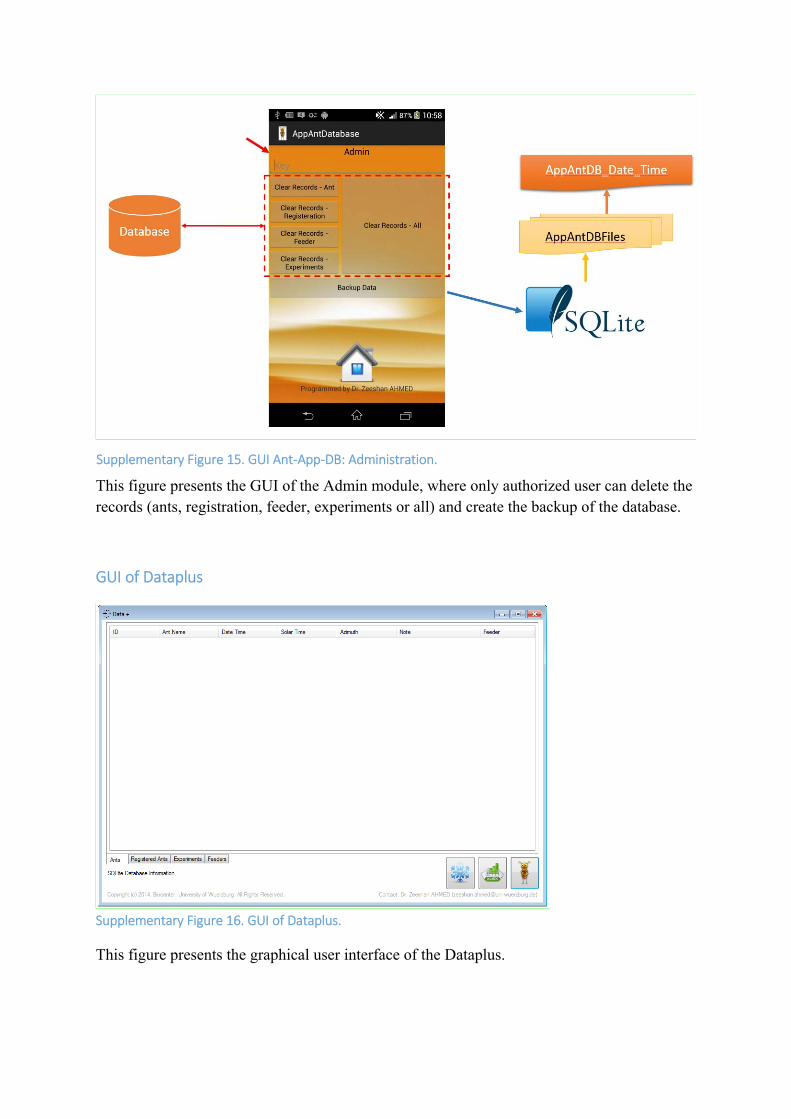
Supplementary Figure 15. GUI Ant‐App‐DB: Administration.
This figure presents the GUI of the Admin module, where only authorized user can delete the records (ants, registration, feeder, experiments or all) and create the backup of the database.
GUI of Dataplus
Supplementary Figure 16. GUI of Dataplus.
This figure presents the graphical user interface of the Dataplus.

The overall GUI of the Dataplus application (S-Fig. 16) is very simple and easy to use. It consists of three main buttons: Open Ant-App-Database File (cartoon ant icon), Update Values (Excel sheet icon) and Clear All Values (snowflake icon).
Opening the Ant-App-Database File will allow the user to browse the directory, select the backup file generated by the Ant-App-DB and load data in the list views. Update Values will convert the Ant, Register Ants, Experiments and Feeders data to the Microsoft Excel sheets. Clear All Values, as the name describes, will remove all values from the list views.
Comparison of Ant‐App‐DB with NOAA
The results produced by the approximate solar calculation module of the Ant-App-DB is also compared with an online application for the approximate solar calculations (http://www.jgiesen.de/astro/suncalc/) recommended by the NOAA (S-Fig. 17).
Supplementary Figure 17. Solar estimations using Ant‐App‐DB and comparing results with NOAA.
This figure presents the interface of Approximate Solar Calculations, where different solar timings and angles can be estimated, using any date and time. Fig 11 show the interface with some user given values (latitude in degree and minutes, longitude in degree and minutes, date from the Gregorian calendar, time and UTC time zone) and presents the obtained results (Day of the year, equation of time, declination, solar time offset, solar time, solar hour angle, altitude, azimuth angle and solar noon) after processing the user-given data using astronomical algorithms. It is a stand-alone application but the results compare of course to those from NOAA.

We inputted date (05/20/2014), time (12:00), latitude (52.51), longitude (13.41) and Universal Time Zone difference (+2h) in both applications and the observed results were very close and approximately similar as the computed solar time by the application recommended by the NOAA was 10.957h and by the Ant-App-DB was 10.96h (99.99% accuracy). Moreover the calculated Azimuth angle by the application recommended by the NOAA was 153.66 degree and by the Ant-App-DB was 153.8 degree (99.8% accuracy).
We have tried to establish the most optimum results, and have even tried to completely remove the minor difference in the results between the online application by the NOAA and the Ant-App-DB but it is so far not possible due to the following reasons:
1. Difference in the use of PI value, we are using 3.14 and we are not aware what exact value of PI (fractional limit) was used by the NOAA’s recommended application.
2. The other difference is between the decimal days of the year. 3. The results produced by the Ant-App-DB are approximate and according to the
feedback from other scientists are acceptable, but we are still working to improve accuracy.
References
[S. 1] Teacher, A. G. F., Hodgson, D. J, and Inger, R. (2013). Smartphones in ecology and evolution: a guide for the apprehensive. Ecology and Evolution, 3, 5268-5278.
[S. 2] Boehm, B. (1976). Software Engineering. IEEE Trans. On Comp., 12, 1226-1242.
[S. 3] Rook, P. (1986). Controlling software projects. Soft. Engi. J., 1, 7-16.
[S. 4] Kaur, H., and Singh, P. (2011). UML (Unified Modeling Language): Standard Language for Software Architecture Development. Proceedings of the International Symposium on Computing, Communication, and Control, 118-125.
[S. 5] Medvidovic, N., Rosenblum, D.S., Remixes, D.F., Robbins, J.E. (2002). Modeling software architectures in the Unified Modeling Language. ACM Trans. Softw. Eng. Methodol., 11, 1. doi: 10.1145/504087.504088
[S. 6] Ahmed, Z., Ganti, S. K., and Kyhlbäck, H. (2008). Design Artifact’s, Design Principles, Problems, Goals and Importance. Proceedings of Fourth International Conference of Statistical Sciences, 57-68.
[S. 7] Ahmed, Z. (2011). Designing Flexible GUI to Increase the Acceptance Rate of Product Data Management Systems in Industry. Int. J. Comp. Sci. Emerg. Tech., 2, 100-109.
[S. 8] Klemmer, S. R., and Lee, B. (2005). Notebooks that Share and Walls that Remember: Electronic Capture of Design Education Artifacts. Proceedings of ACM Symposium on User Interface Software and Technology.

[S. 9] Ahmed, Z., Zeeshan, S., and Dandekar, T. (2014). Developing sustainable software solutions for bioinformatics using the “Butterfly” paradigm. F1000Res., 3, 71.
[S. 10] Ahmed, Z., and Zeeshan, S. (2014). Cultivating Software Solutions Development in the Scientific Academia. Rec Pat Comp Sci., 7, 52-66.