Embed Size (px)
Citation preview

1
Supplementary Report:
Performance of Drug and Biologics Firms in Conducting Postmarketing Requirements (PMRs) and
Postmarketing Commitments (PMCs)
(FY 2013 and FY 2014)

2
Executive Summary
Under the Federal Food, Drug, and Cosmetic Act (FD&C Act), the Food and Drug Administration (FDA or Agency) is required to report annually in the Federal Register on the status of postmarketing requirements (PMRs) and postmarketing commitments (PMCs) required of, or agreed upon by, holders of approved drug and biological products (applicants). This report supplements the Federal Register report for fiscal year 2013 and 2014 that was published in 2016. The published Federal Register report summarizes the status of PMRs and PMCs for fiscal year (FY) 2013 (i.e., as of September 30, 2013) and FY 2014 (i.e., as of September 30, 2014). Specifically, the published Federal Register report provides information on the status of all open PMRs/PMCs through the end of the fiscal year, and the status of those PMRs/PMCs that were closed in the fiscal year. The Federal Register report reflects combined PMR and PMC data from the FDA’s Center for Biologics Evaluation and Research (CBER) and Center for Drug Evaluation and Research (CDER).
This supplemental report also describes an internal quality assessment initiated by CDER in 2013. The purpose of the evaluation (audit) was to determine the accuracy of the data on the status of a sample of PMRs and PMCs in order to inform our understanding of the accuracy of the overall PMR/PMC status information in CDER’s database. The conduct and findings from the internal assessment are described in detail in this report. Based upon the findings of the audit, CDER has improved PMR/PMC procedures and is evaluating potential changes to improve available informatics tools. These efforts are intended to improve the timeliness and accuracy of its data on the status of PMRs/PMCs.
This supplemental report also provides summaries of the statuses of PMRs and PMCs for CBER and CDER separately. While a yearly comparison of the statuses of PMRs and PMCs is generally not appropriate because the number of on- and off-schedule PMRs/PMCs can vary from year to year, a comparison of the data for FY2013 and FY2014 may be helpful in understanding the impact of CDER’s 2013 audit. The data show that as of September 30, 2013, and September 30, 2014, the number of applicants and unique applications with PMRs/PMCs did not change significantly between the end of FY 2013 and the end of FY 2014, and the overall number of open PMRs and PMCs also remained consistent. Most applicants were meeting their obligation to report annually on the status of PMRs/PMCs.
The majority of PMRs/PMCs are associated with new drug applications (NDAs) compared to biologics license applications (BLAs). More than half of the PMRs issued were under the Agency’s authorities as provided by the Pediatric Research Equity Act (PREA) (PMRs to study certain new drugs for pediatric populations), or as provided by the Food and Drug

3
Administration Amendments Act of 2007 (FDAAA) authorities (PMRs to assess a known or potential serious risk).
As of September 30, 2013, and September 30, 2014, the majority of PMRs/PMCs in both CBER and CDER were progressing on schedule. PMRs/PMCs that are on schedule are largely in pending or ongoing status. Comparatively fewer PMRs/PMCs are off schedule because they are delayed. PMRs/PMCs that were closed were predominantly ones that were fulfilled.
The data show that over time, PMRs and PMCs are progressively completed and fulfilled.

4
Table of Contents
Introduction .................................................................................................................................................. 8
Overview: Postmarketing Requirements and Commitments ................................................................... 8
Information Presented in This Supplemental Report ............................................................................. 12
CDER’s 2013-2014 Evaluation of its Data on PMRs and PMCs ................................................................... 14
Purpose of the Evaluation ....................................................................................................................... 14
Methods .................................................................................................................................................. 16
Findings ................................................................................................................................................... 18
CDER: Status of PMRs/PMCs (FY 2013 and FY 2014) .................................................................................. 22
Applicants and Applications with Open PMRs/PMCs ............................................................................. 22
Annual Status Reports (ASRs) Received .................................................................................................. 23
PMRs and PMCs by Application Type ..................................................................................................... 25
PMRs by Requiring Authority .................................................................................................................. 26
Overview of PMR and PMC Status .......................................................................................................... 26
Open PMRs and PMCs, by Application Type ........................................................................................... 27
Open and On-Schedule PMRs ................................................................................................................. 28
Open and Off-Schedule PMRs ................................................................................................................. 30
Open PMCs .............................................................................................................................................. 32
Closed PMRs and PMCs........................................................................................................................... 33
Distribution of the Statuses of PMRs and PMCs ..................................................................................... 34
CBER: Status of PMRs/PMCs (FY 2013 and FY 2014) .................................................................................. 39
Applicants and Applications with Open PMRs/PMCs ............................................................................. 39
Annual Status Reports (ASRs) Received .................................................................................................. 39
PMRs by Requiring Authority .................................................................................................................. 40
Overview of PMR and PMC Statuses ...................................................................................................... 41
5
Open PMRs and PMCs ............................................................................................................................ 43
Open and On-Schedule PMRs ................................................................................................................. 43
Open and Off-Schedule PMRs ................................................................................................................. 45
Open PMCs .............................................................................................................................................. 46
Closed PMRs and PMCs........................................................................................................................... 47
Distribution of the Statuses of PMRs and PMCs ..................................................................................... 47
Figures
Figure 1. PMR/PMC Lifecycle ....................................................................................................................... 9
Figure 2. Methodological Approach to CDER’s Internal Evaluation of its PMR/PMC Data ....................... 16
Figure 3. CDER: PMR/PMC Cohort ............................................................................................................ 18
Figure 4. CDER: PMR/PMC Cohort by Type ............................................................................................... 19
Figure 5. CDER: Comparison of PMR/PMC Cohort Status .......................................................................... 20
Figure 6. CDER: Annual Status Reports Received (NDAs and BLAs combined) ......................................... 24
Figure 7. CDER: PMRs by Application Type ............................................................................................... 25
Figure 8. CDER: PMCs by Application Type ............................................................................................... 25
Figure 9. CDER: PMRs by Requiring Authority (NDAs and BLAs combined) .............................................. 26
Figure 10. CDER: Distribution of PMR Statuses, as of FY 2013 and FY 2014 (NDAs and BLAs combined) 27
Figure 11. CDER: Distribution of PMC Statuses, as of FY 2013 and FY 2014 (NDAs and BLAs combined) 27
Figure 12. CDER: Summary of On- and Off-Schedule Postmarketing Requirements and Commitments (NDAs and BLAs combined) ........................................................................................................................ 28
Figure 13. CDER: Status of Open and On-Schedule PMRs (NDAs and BLAs combined)............................ 30
Figure 14. CDER: Delayed PMRs, by PMR Type (NDAs and BLAs combined) ............................................ 32
Figure 15. CDER: Distribution of PMR Statuses as of the End of FY 2014, by Year of PMR Establishment .................................................................................................................................................................... 35
Figure 16. CDER: Distribution of FDAAA PMR Statuses as of the End of FY 2014, by Year of PMR Establishment.............................................................................................................................................. 36

6
Figure 17. CDER: Distribution of PREA PMR Statuses as of the End of FY 2014, by Year of PMR Establishment.............................................................................................................................................. 36
Figure 18. CDER: Distribution of Accelerated Approval PMR Statuses as of the End of FY 2014, by Year of PMR Establishment ..................................................................................................................................... 37
Figure 19. Distribution of PMC Statuses as of the End of FY 2014, by Year of PMC Establishment .......... 38
Figure 20. CBER: Annual Status Reports Received .................................................................................... 40
Figure 21. CBER: PMRs by Requiring Authority (NDAs and BLAs combined) ............................................ 41
Figure 22. CBER: Distribution of PMR Statuses, as of FY 2013 and FY 2014 (NDAs and BLAs combined) 42
Figure 23. CBER: Distribution of PMC Statuses, as of FY 2013 and FY 2014 (NDAs and BLAs combined) 42
Figure 24. CBER: Summary of On- and Off-Schedule Postmarketing Requirements and Commitments (NDAs and BLAs combined) ........................................................................................................................ 43
Figure 25. CBER: Statuses of Open and On-Schedule PMRs (NDAs and BLAs combined) ........................ 44
Figure 26. CBER: Distribution of PMR Statuses as of the End of FY 2014, by Year of PMR establishment .................................................................................................................................................................... 49
Figure 27. CBER: Distribution of PREA PMR Statuses as of the End of FY 2014, by Year of PMR Establishment.............................................................................................................................................. 50
Figure 28. CBER: Distribution of FDAAA PMR Statuses as of the End of FY 2014, by Year of PMR Establishment.............................................................................................................................................. 50
Figure 29. CBER: Distribution of Accelerated Approval PMR Statuses as of the End of FY 2014, by Year of PMR Establishment ..................................................................................................................................... 51
Figure 30. CBER: Distribution of PMC Statuses as of the End of FY 2014, by Year of PMC Establishment .................................................................................................................................................................... 52
Tables
Table 1. PMR/PMC Status Categories ........................................................................................................ 10
Table 2. Pattern of PMR/PMC Status Changes .......................................................................................... 21
Table 3. CDER: Applicants and Applications (NDA/BLA) With Open Postmarketing Requirements and Commitments ............................................................................................................................................. 23
Table 4. CDER: Annual Status Reports Received ....................................................................................... 24

7
Table 5. CDER: Summary of On- and Off-Schedule Postmarketing Requirements and Commitments .... 28
Table 6. CDER: Summary of Open and On-Schedule Postmarketing Requirements ................................ 29
Table 7. CDER: Summary of Open and Off-Schedule Postmarketing Requirements ................................ 31
Table 8. CDER: Summary of Open Postmarketing Commitments (PMCs) ................................................ 32
Table 9. CDER: Summary of Closed* Postmarketing Requirements and Commitments .......................... 33
Table 10. CDER: Distribution of PMR Statuses as of the End of FY 2014, by Year of PMR Establishment 34
Table 11. - CDER: Distribution of PMC Statuses as of the End of FY 2014, by Year of PMR Establishment .................................................................................................................................................................... 38
Table 12. CBER: Applicants and Applications (NDA/BLA) With Open Postmarketing Requirements and Commitments ............................................................................................................................................. 39
Table 13. CBER: Annual Status Reports Received ..................................................................................... 40
Table 14. CBER: PMRs by Requiring Authority (NDAs and BLAs combined) ............................................. 41
Table 15. CBER: Summary of On- and Off-Schedule Postmarketing Requirements and Commitments (NDAs and BLAs combined) ........................................................................................................................ 43
Table 16. CBER: Summary of Open and On-Schedule Postmarketing Requirements (NDAs and BLAs combined) ................................................................................................................................................... 45
Table 17 – CBER: Summary of Open and Off-Schedule Postmarketing Requirements ............................. 46
Table 18. CBER: Summary of Open Postmarketing Commitments (PMCs) .............................................. 46
Table 19. CBER: Summary of Closed* Postmarketing Requirements and Commitments ........................ 47
Table 20. CBER: Distribution of PMR Statuses as of the End of FY 2014, by Year of PMR Establishment 48
Table 21. CBER: Distribution of PMC Statuses as of the End of FY 2014, by Year of PMC Establishment 51

8
Introduction
Overview: Postmarketing Requirements and Commitments A postmarketing requirement (PMR) is a study or clinical trial of a drug1 that an applicant is required by statute or regulation to conduct after the drug is approved. A postmarketing commitment (PMC) is a post-approval study or clinical trial to which a sponsor agrees to conduct in writing, but that is not required by statute or regulation. PMRs and PMCs can be issued upon approval of a drug or post-approval, if warranted.
FDA can require applicants to conduct postmarketing studies and clinical trials:
• To assess a known serious risk, assess signals of serious risk, or identify an unexpected serious risk (when available data indicates the potential for a serious risk) related to the use of a drug product (section 505(o)(3) of the Food, Drug and Cosmetic Act (FD&C Act), as added by the Food and Drug Administration Amendments Act of 2007 (FDAAA)).
• Under the Pediatric Research and Equity Act (PREA), to study certain new drugs for pediatric populations, when these drugs are not adequately labeled for children. Under section 505B(a)(3) of the FD&C Act, the initiation of these studies may be deferred until required safety information from other studies in adults has first been submitted and reviewed.
• To verify and describe the predicted effect or other clinical benefit for drugs approved in accordance with the accelerated approval provisions in section 506(c)(2)(A) of the FD&C Act (21 CFR 314.510 and 601.41).
• For a drug that was approved on the basis of animal efficacy data because human efficacy trials are not ethical or feasible (21 CFR 314.610(b)(1) and 601.91(b)(1)). PMRs for drug products approved under the animal efficacy rule2 can be conducted only when the product is used for its indication and when an exigency (or event/need) arises. In the absence of a public health emergency, these studies/clinical trials will remain pending indefinitely.
1 For the purposes of this report, references to drugs include drugs approved under the FD&C Act and biological products licensed under the Public Health Service Act (PHS Act), other than biological products that also meet the definition of a device in section 201(h) of the FD&C Act (21 U.S.C. 321(h)). 2 21 CFR 314.600 for drugs; 21 CFR 601.90 for biological products.
9
PMR/PMC Lifecycle
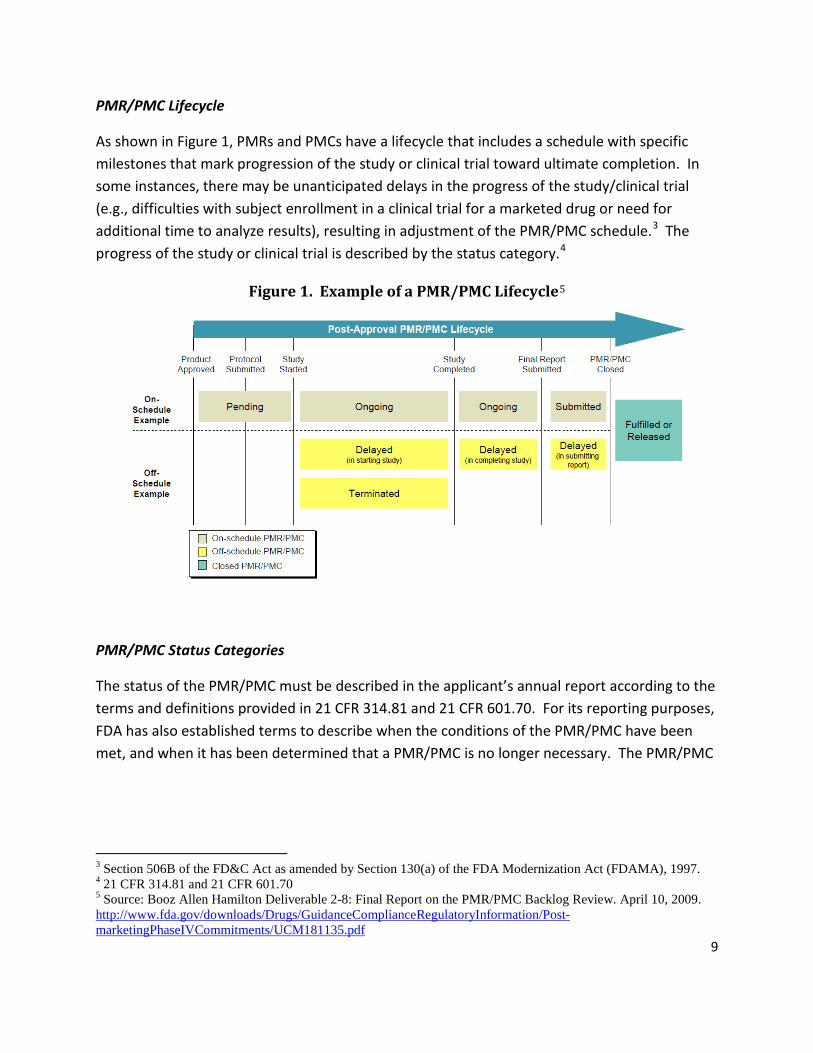
As shown in Figure 1, PMRs and PMCs have a lifecycle that includes a schedule with specific milestones that mark progression of the study or clinical trial toward ultimate completion. In some instances, there may be unanticipated delays in the progress of the study/clinical trial (e.g., difficulties with subject enrollment in a clinical trial for a marketed drug or need for additional time to analyze results), resulting in adjustment of the PMR/PMC schedule.3 The progress of the study or clinical trial is described by the status category.4
Figure 1. Example of a PMR/PMC Lifecycle 5
PMR/PMC Status Categories
The status of the PMR/PMC must be described in the applicant’s annual report according to the terms and definitions provided in 21 CFR 314.81 and 21 CFR 601.70. For its reporting purposes, FDA has also established terms to describe when the conditions of the PMR/PMC have been met, and when it has been determined that a PMR/PMC is no longer necessary. The PMR/PMC
3 Section 506B of the FD&C Act as amended by Section 130(a) of the FDA Modernization Act (FDAMA), 1997. 4 21 CFR 314.81 and 21 CFR 601.70 5 Source: Booz Allen Hamilton Deliverable 2-8: Final Report on the PMR/PMC Backlog Review. April 10, 2009. http://www.fda.gov/downloads/Drugs/GuidanceComplianceRegulatoryInformation/Post-marketingPhaseIVCommitments/UCM181135.pdf
10
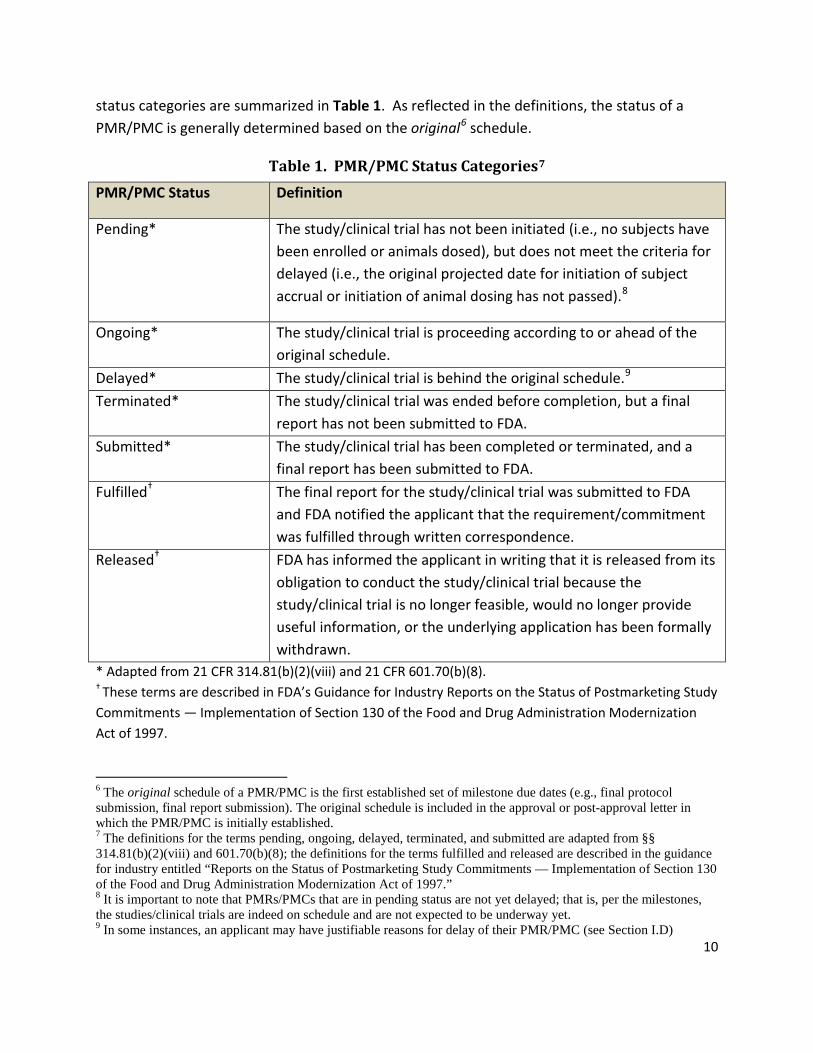
status categories are summarized in Table 1. As reflected in the definitions, the status of a PMR/PMC is generally determined based on the original6 schedule.
Table 1. PMR/PMC Status Categories7 PMR/PMC Status Definition
Pending* The study/clinical trial has not been initiated (i.e., no subjects have been enrolled or animals dosed), but does not meet the criteria for delayed (i.e., the original projected date for initiation of subject accrual or initiation of animal dosing has not passed).8
Ongoing* The study/clinical trial is proceeding according to or ahead of the original schedule.
Delayed* The study/clinical trial is behind the original schedule.9 Terminated* The study/clinical trial was ended before completion, but a final
report has not been submitted to FDA. Submitted* The study/clinical trial has been completed or terminated, and a
final report has been submitted to FDA. Fulfilled† The final report for the study/clinical trial was submitted to FDA
and FDA notified the applicant that the requirement/commitment was fulfilled through written correspondence.
Released† FDA has informed the applicant in writing that it is released from its obligation to conduct the study/clinical trial because the study/clinical trial is no longer feasible, would no longer provide useful information, or the underlying application has been formally withdrawn.
* Adapted from 21 CFR 314.81(b)(2)(viii) and 21 CFR 601.70(b)(8). † These terms are described in FDA’s Guidance for Industry Reports on the Status of Postmarketing Study Commitments — Implementation of Section 130 of the Food and Drug Administration Modernization Act of 1997.
6 The original schedule of a PMR/PMC is the first established set of milestone due dates (e.g., final protocol submission, final report submission). The original schedule is included in the approval or post-approval letter in which the PMR/PMC is initially established. 7 The definitions for the terms pending, ongoing, delayed, terminated, and submitted are adapted from §§ 314.81(b)(2)(viii) and 601.70(b)(8); the definitions for the terms fulfilled and released are described in the guidance for industry entitled “Reports on the Status of Postmarketing Study Commitments — Implementation of Section 130 of the Food and Drug Administration Modernization Act of 1997.” 8 It is important to note that PMRs/PMCs that are in pending status are not yet delayed; that is, per the milestones, the studies/clinical trials are indeed on schedule and are not expected to be underway yet. 9 In some instances, an applicant may have justifiable reasons for delay of their PMR/PMC (see Section I.D)

11
In addition to the above statuses, PMRs/PMCs may also be characterized as closed or open. Open PMRs/PMCs comprise those that are pending, ongoing, delayed, submitted or terminated; whereas closed PMRs/PMCs are either fulfilled or released. Open PMRs are also described by whether they are on- or off-schedule. On-schedule PMRs/PMCs are those that are pending, ongoing or submitted. Off-schedule PMRs/PMCs are those that have missed one of the milestone dates in the original schedule and are categorized as either delayed or terminated.
PMR/PMC Reporting Requirements
Under the regulations (21 CFR 314.81(b)(2)(vii) and 601.70), applicants of approved drugs are required to submit annually a report on the status of each clinical safety, clinical efficacy, clinical pharmacology, and nonclinical toxicology study/clinical trial either required by the FDA or that they have committed to conduct, either at the time of approval or after approval of their New Drug Application (NDA), Abbreviated New Drug Application (ANDA), or Biologics License Application (BLA). Applicants are required to report to FDA on these requirements and commitments made for NDAs and ANDAs under 21 CFR 314.81(b)(2)(vii) and for BLAs under 21 CFR 601.70.
Furthermore, section 505(o)(3)(E) of the FD&C Act requires that applicants report periodically on the status of each required study/clinical trial and each study/clinical trial “otherwise undertaken …to investigate a safety issue….” FDA will consider this periodic reporting obligation to be met by submission of the annual report under 21 CFR 314.81(b)(2)(vii) and 21 CFR 601.70, provided that the report includes all of the required elements listed in 505(o) and 21 CFR 314.81(b)(2)(vii) and 21 CFR 601.70.
An applicant must report on the progress of the PMR/PMC within sixty days of the anniversary of the product’s approval until the PMR/PMC is completed or terminated and FDA determines that the PMR/PMC has been fulfilled or that the PMR/PMC is released because it is either no longer feasible or would no longer provide useful information. The annual status report (ASR) must include a description of the PMR/PMC, a schedule for completing the PMR/PMC, and a characterization of the current status of the PMR/PMC. The report must also provide an explanation of the PMR/PMC status by describing briefly the progress of the PMR/PMC. A PMR/PMC schedule is expected to include the actual or projected dates for the following: (1) submission of the final protocol to FDA; (2) completion of the study/clinical trial; and (3) submission of the final report to FDA.
Under section 506B of the FD&C Act, the FDA is required to report annually in the Federal Register on the status of postmarketing requirements and commitments required of, or agreed

12
upon by, holders of approved drug and biological products. FDA determines the status of a PMR/PMC primarily through the following PMR/PMC-related submissions: annual reports; protocols; correspondence; and final reports. Based on its review of these submissions and the PMR/PMC status categories (see Table 1), FDA will update the status of a PMR/PMC in its database. FDA has established policies and procedures that staff follow to track and monitor the status of PMRs/PMCs, including procedures to ensure timely and appropriate review of PMR/PMC-related submissions. 10,11,12,13,14,15 These procedures facilitate FDA’s annual reporting on PMRs and PMCs.
Information Presented in This Supplemental Report This report presents additional information and analyses on the status of PMRs and PMCs to supplement the information contained in the Federal Register report published in 2016. Both this supplemental report and the Federal Register report provide information on PMRs/PMCs as of September 30, 2013 (i.e., for fiscal year (FY) 2013) and September 30, 2014 (i.e., for FY 2014). Both reports summarize the status of all open PMRs/PMCs at the end of the fiscal year, and the status of only those PMRs/PMCs that were closed in the fiscal year. Additionally, this report presents data from CBER and CDER separately, whereas the Federal Register report reflects combined data from the two Centers.
Information summarized in this supplemental report includes the following:
(1) The number of applicants with open PMRs/PMCs;
(2) The number of open PMRs/PMCs;
10 CDER MAPP 6010.9. Procedures and Responsibilities for Developing Postmarketing Requirements and Commitments. Available at http://www.fda.gov/downloads/AboutFDA/CentersOffices/CDER/ManualofPoliciesProcedures/ucm120877.pdf 11 CDER MAPP 6004.2. Procedures for Completing and Processing the Form “Annual Status Report Review Form: PMR and PMC Summary.” Available at http://www.fda.gov/downloads/AboutFDA/ReportsManualsForms/StaffPoliciesandProcedures/ucm079938.pdf 12 CDER MAPP 6030.9. Good Review Practice: Good Review Management Principles and Practices for Effective IND Development and Review. Available at http://www.fda.gov/downloads/AboutFDA/CentersOffices/OfficeofMedicalProductsandTobacco/CDER/ManualofPoliciesProcedures/UCM349907.pdf 13 CDER MAPP 6010.2. Responsibilities for Tracking and Communicating the Status of Postmarketing Requirements and Commitments. Available at http://www.fda.gov/downloads/AboutFDA/CentersOffices/CDER/ManualofPoliciesProcedures/UCM174552.pdf. 14 CBER SOPP 8415: Procedures for Developing Postmarketing Requirements and Commitments. Available at: http://www.fda.gov/BiologicsBloodVaccines/GuidanceComplianceRegulatoryInformation/ProceduresSOPPs/ucm073519.htm 15 CBER SOPP 8413: Postmarketing Commitment Related Submissions - Administrative Handling, Review, and CBER Reporting. Available at http://www.fda.gov/BiologicsBloodVaccines/GuidanceComplianceRegulatoryInformation/ProceduresSOPPs/ucm223772.htm

13
(3) The number of applications for which an ASR was expected, but was not submitted within 60 days of the anniversary date of U.S. approval or an alternate reporting date that was granted by FDA;
(4) FDA-verified status of open PMRs/PMCs;
(5) The status of closed PMRs/PMCs; and
(6) The distribution of the status of open PMRs and PMCs or those closed as of the end of FY 2014, by the fiscal year each PMR/PMC was established (FY 2008 to FY 2014).
Note that for this analysis, the data for closed (fulfilled or released) PMRs and PMCs is for all PMRs/PMCs that were closed as of FY 2014. Therefore data for PMRs and PMCs that were closed in prior fiscal years are included.
The tables and figures in this report distinguish between PMRs and PMCs, PMRs and PMCs for NDAs and BLAs, and on-schedule and off-schedule PMRs and PMCs, according to the original schedule milestones. Due to rounding, the percentages in the tables may not add up to 100 percent.
This report also summarizes findings from an internal evaluation (audit) by FDA’s Center for Drug Evaluation and Research (CDER) to assess and address the accuracy of the Center’s data on the status of PMRs and PMCs.
Although this report presents data for two fiscal years, it is important to note that a comparison of the number of open and on-schedule or off-schedule PMRs/PMCs over time can be misleading because it does not take into account that the cohort of open PMRs/PMCs is not static from year to year. New PMRs/PMCs are continually being established for studies and clinical trials with varying start dates and durations; and other PMRs/PMCs are closed because they are either fulfilled or released. Also, ongoing PMRs/PMCs are carried forward into the subsequent fiscal year. Therefore, the number of on- and off-schedule PMRs/PMCs can vary from year to year, and a year-to-year comparison of on- or off-schedule PMRs (e.g., to assess for a potential trend) is not appropriate.16
16 Additionally, numbers published in this supplemental report and in the Federal Register Notice that the report accompanies cannot be compared with the numbers resulting from searches of the publicly accessible and downloadable database on the FDA Web site. This supplemental report and the Federal Register Notice incorporate data for all PMRs/PMCs in FDA databases as of the end of the fiscal year. The publicly accessible and downloadable database includes a subset of PMRs/PMCs, specifically those that, at the time of data retrieval, either had an open status or were closed within the past 12 months. In addition, the status information in this report is updated annually while the downloadable database is updated quarterly (i.e., in January, April, July, and October).

14
While a comparison of the number of open and on-schedule or off-schedule PMRs/PMCs over time is not appropriate for the aforementioned reasons, a comparison of CDER’s data for FY 2013 and FY 2014 may be helpful in understanding the impact of CDER’s 2013 audit. As described above, these differences are considered to be reflective of the natural progress of postmarketing studies and clinical trials over time. However, they are also considered to reflect the results of CDER’s efforts to update the information on the statuses of PMRs and PMCs following the internal audit of the data for a sample of PMRs/PMCs.
CDER’s 2013-2014 Evaluation of its Data on PMRs and PMCs
Purpose of the Evaluation FDA has continually worked to improve its ability to maintain accurate and timely data on the status of PMRs and PMCs. The accuracy of FDA’s data is not only vital for the purposes of reliable reporting by the Agency on the status of PMRs/PMCs, but is also integral to FDA’s ability to take action against application holders who are non-compliant with their PMRs.
Previous evaluations have identified limitations in FDA’s monitoring of PMRs/PMCs, and there has been concern about the extent to which FDA appropriately monitors and tracks the status of PMRs and PMCs.17,18,19 In 2007, as part of FDAAA, the FDA was required to “on an annual basis, review the entire backlog of postmarketing safety commitments to determine which commitments require revision or should be eliminated, report to the Congress on these determinations, and assign start dates and estimated completion dates for such commitments”.20 The “backlog” consists of all PMRs and PMCs that were open (not yet released or fulfilled) as of the date of enactment of FDAAA.21
17 Department of Health and Human Services (HHS), Office of Inspector General (OIG) report – FDA’s Monitoring of Postmarketing Study Commitments. (OEI-01-04-00390, June 2006). Available at http://oig.hhs.gov/oei/reports/oei-01-04-00390.pdf 18 U.S. Government Accountability Office (GAO) Report – FDA Needs to Enhance its Oversight of Drugs Approved on the Basis of Surrogate Endpoints (GAO-09-866; September 2009). Available at http://www.gao.gov/assets/300/295762.pdf 19 Institute of Medicine. The future of drug safety: promoting and protecting the health of the public. http://www.nap.edu/catalog.php?record_id=11750. 20 Section 505(k) of the Federal Food, Drug, and Cosmetic Act (FD&C Act), as amended by the Food and Drug Administration Amendments Act of 2007 (FDAAA). 21 FDAAA was enacted on September 27, 2007 and became effective on March 25, 2008. FDAAA’s requirement that the FDA review the entire backlog of PMRs and PMCs resulted in certain changes to the FDA’s establishment and monitoring of PMRs and PMCs. The internal audit was intended to evaluate data for a sample of the PMRs and PMCs that had been established after FDAAA took effect.

15
The FDA contracted with Booz Allen Hamilton (BAH) to conduct the first and second annual backlog reviews.22 A fundamental aspect of BAH’s work was to determine the actual status of PMRs/PMCs in the backlog cohort. Through this work, BAH identified several issues with FDA’s PMR/PMC data and tracking system. For example, in its initial, review, BAH found that of those PMRs/PMCs reviewed, the status listed in the database was verified as accurate for 42 percent of the PMRs/PMCs and was inaccurate and required an update for 51 percent of the PMRs/PMCs.23 Following the update, the distribution of backlog PMR/PMC statuses changed significantly. For example, the percentage of PMR/PMCs categorized as pending decreased from 62 percent to 19 percent following the BAH review.24 The BAH reports also identified a number of areas for improvement that the FDA should consider in its PMR/PMC monitoring processes. Many of BAH’s suggested improvements were also included in the recommendations from the 2006 OIG report and the 2009 GAO report25.
The FDA is committed to ensuring an efficient process for monitoring PMR/PMCs and having a database that accurately reflects the status of PMR/PMCs. CBER has a comprehensive module in its BLA database system for tracking PMRs/PMCs. Information from the system is extracted monthly and quarterly, and is subjected to quality control processes external to the review offices for Center and FDA reports. Similarly, CDER has established policies and procedures to help ensure that its data on PMRs/PMCs are current and accurate. CDER has actively followed up on the recommendations from BAH as well as the 2006 OIG, and 2009 GAO reports, and has implemented many of these through the establishment of Manuals of Policies and Procedures (MAPPs), specifically intended to improve the processes by which FDA collects PMR/PMC information and tracks the status of PMRs and PMCs. 10, 11, 13
In 2013, as an internal quality assessment initiative, CDER initiated an evaluation (audit) of a sample of PMRs and PMCs that had been established26 after March 25, 2008. The purpose of
22 Reports available at FDA’s Web site http://www.fda.gov/Drugs/GuidanceComplianceRegulatoryInformation/Post-marketingPhaseIVCommitments/ucm064436.htm. 23 The remaining 7% of PMRs/PMCs were not reviewed or not completely reviewed because they were on schedule and an annual status report had not been received or the most recent annual reports were unavailable. 24 2009 BAH Report: http://www.fda.gov/downloads/Drugs/GuidanceComplianceRegulatoryInformation/Post-marketingPhaseIVCommitments/UCM181135.pdf 25 In 2015, GAO issued the report, Drug Safety: FDA Expedites Many Applications, But Data for Postapproval Oversight Need Improvement (GAO-16-192; December 20015). The 2015 GAO report concluded that "FDA lacks reliable, readily accessible data on tracked safety issues and postmarket studies needed to meet certain postmarket safety reporting responsibilities and to conduct systematic oversight” and recommended that FDA develop plans to correct the problems with its postmarket data and ensure that these data can be sued for oversight. The Department of Health and Human Services (DHHS) and FDA agreed with GAO’s recommendations and provided additional information on FDA’s postmarket safety efforts. The 2015 GAO report, which includes the DHHS response, is available at: http://www.gao.gov/assets/680/674183.pdf. 26 The establishment date was defined as the date that the PMR/PMC was officially issued by FDA to the applicant.

16
the evaluation was to determine accuracy of the data on the status of a sample of PMRs and PMCs. The findings from the audit would inform our understanding of the accuracy of the overall PMR/PMC status information in CDER’s database.
Methods CDER identified a cohort of 1464 PMRs and PMCs that were established27 on or after March 25, 2008, and through September 30, 2013, and that were subject to reporting requirements under Section 506B of the FD&C Act. The evaluation included four distinct phases with three separate analyses conducted in 2014, as shown in Figure 2.
Figure 2. Methodological Approach to CDER’s Internal Evaluation of its PMR/PMC Data
Phase 1: Initial Audit
The data for the 1464 PMRs and PMCs in the cohort of interest were locked on September 30, 2013. The initial audit assessed various characteristics of the PMRs and PMCs, including their status (as of the data lock date). In addition, CDER conducted analyses to assess the accuracy and timeliness of the PMR/PMC status data. The specific endpoints of interest were:
• Number of open PMRs and PMCs
• Number of open PMCs, and PMRs (by type of PMR)
• Status of the PMRs and PMCs (as of September 30, 2013) 27 The establishment date is the date of the formal FDA communication to the applicant which included the final FDA required (PMR) or requested (PMC) postmarketing study or clinical trial.

17
• Time since last PMR/PMC status update in FDA’s database
• Number of PMRs/PMCs whose milestone dates had passed (i.e., were delayed) but were recorded in FDA’s database as pending or ongoing
• Number of submitted Annual Status Reports (ASRs) and Final Reports for which the FDA’s review was overdue.28
Phase 2: Update and Correction of PMR/PMC Data
Following the initial audit and as informed by its results, CDER staff updated the statuses of the PMRs and PMCs in the cohort. To do so, staff reviewed all ASRs and Final Report submissions for which CDER’s review was still pending, and then updated the statuses of the PMRs and PMCs in the cohort. The goal date for completion of this process was July 30, 2014.
Phase 3: First Post-Audit Analysis
The data for the 1464 PMRs and PMCs in the cohort of interest were again locked on July 30, 2014, and then analyzed to ascertain the impact of data update and correction effort, to identify potential causes of any outdated or inaccurate data, as well as to identify solutions to resolve issues impacting data accuracy and currency. This evaluation comprised the same analyses performed in the initial audit.
Phase 4: Second Post-Audit Analysis
Between September 30, 2013, and July 30, 2014, data for PMRs and PMCs associated with BLAs regulated by CDER were transitioned from one data system to another. In addition, new statutory requirements affecting the determination of the status of PREA PMRs began to be implemented.29 These factors impacted CDER’s ability to fully and appropriately update the PMR/PMC status data for all the PMRs/PMCs in the cohort by July 30, 2014. Consequently, CDER continued its data update and corrections efforts through September 30, 2014. The data for the PMR/PMC cohort were again locked on this date, and then re-evaluated using the same analyses performed in the initial audit.
28 FDA intends to review ASRs within 3 months of receipt. Final Reports submitted as part of a supplemental application will be reviewed under timelines established by the Prescription Drug User Fee Act (PDUFA). Final reports submitted outside of a supplemental application will typically be reviewed within 1 year of receipt. See the Guidance For Industry "Reports on the Status of Postmarketing Study Commitments - Implementation of Section 130 of the Food and Drug Administration Modernization Act of 1997. 29 Section 505B of the FD&C Act, as amended by the FDA Safety and Innovation Act of 2012 (FDASIA), authorizes FDA to grant an extension of deferral of pediatric assessments that are required under PREA if certain applicable PREA criteria for deferral are met and the applicant submits certain materials in support of the extension. Such a deferral would extend the date for submission of the final report.

18
Findings The key findings of the initial audit and second post-audit analysis are presented in the following sections.
PMR/PMC Cohort Characterization
The cohort of 1464 PMRs and PMCs (hereafter referred to as “PMRs/PMCs”) that was evaluated for the initial audit included 1204 PMRs and 260 PMCs. Of the total cohort, there were 1237 NDA PMRs/PMCs and 227 BLA PMRs/PMCs.
Figure 3. CDER: PMR/PMC Cohort (N = 1464)
As shown in Figure 3, PMRs (i.e., required studies and trials) comprised the majority (82 percent) of the cohort. Altogether, 48 percent of the PMRs/PMCs in the cohort were established under the FDAAA provisions, 31 percent under the PREA provisions, and 3 percent under the Accelerated Approval provisions (Figure 4).

19
Figure 4. CDER: PMR/PMC Cohort by Type (N = 1464)
PMR/PMC Status Updates
Status updates to the PMR/PMC database are typically made through one of three ways: completing and archiving reviews of submitted ASRs, notifying the PMR/PMC Tracking Coordinator of submissions received (e.g., Final Protocol submissions), or issuing PMR/PMC fulfillment or release letters to applicants after review of the Final Report. The initial audit found that, as of September 30, 2013, the largest segment of the PMRs/PMCs in the cohort was categorized as pending30 (47 percent), followed by fulfilled (17 percent), ongoing, (15 percent), released (8 percent), delayed (7 percent), and submitted (8 percent) (Figure 5).
During the second phase of CDER’s evaluation, the most commonly identified reason for inaccurate recorded status in the PMR/PMC database was that ASRs had not been reviewed or the corresponding annual status updates entered into FDA’s data system within the specified timeframes. It was also determined that current PMR/PMC submission procedures do not readily facilitate notification of Regulatory Project Managers (RPMs) about received final protocol and final report submissions, which also contributes to delayed status updates. Another significant reason for non-timely or inaccurate status information in the PMR/PMC database is that the process for data entry is largely manual – lack of an automated process for
30 It is important to note that PMRs/PMCs that are in pending status are not yet delayed; that is, per the milestones, the studies/clinical trials are indeed on schedule and are not expected to be underway yet. See Table 1.

20
data capture can introduce opportunities for failures in accuracy or timeliness of status updates. Phase 2 of CDER’s evaluation also found that 14 of the PMRs/PMCs in the cohort did not meet inclusion criteria31 and therefore should be excluded. Therefore, there were 1450 PMRs/PMCs that were included in the second post-audit analysis.
The second post-audit analysis showed that, as of September 30, 2014, the distribution of status categories had changed. The largest segment of the PMRs/PMCs in the cohort remained those categorized as pending; however, the percentage of pending PMRs/PMCs had decreased to 29 percent. This category was followed by fulfilled (26 percent), ongoing (20 percent), released (11 percent), delayed (8 percent), and submitted (6 percent) (Figure 5). Therefore the most notable changes were to the percentages of pending and fulfilled PMRs/PMCs. The proportion of PMRs/PMCs that was categorized as delayed remained approximately the same. This pattern change is noteworthy because the initial audit findings suggested that almost half of the studies/clinical trials had not yet been initiated. However, the updated statuses show that most PMRs/PMCs had been initiated, and approximately half of them had been submitted with the final study/clinical trial report, fulfilled or released (as of September 30, 2014).
Figure 5. CDER: Comparison of PMR/PMC Cohort Status
Second Post-Audit Cohort (N = 1450) (Status as of 09/30/2014)
Initial Audit Cohort (N = 1464) (Status as of 09/30/2013)
31 Altogether, 14 of the PMRs/PMCs in the initial cohort were not subject to the reporting requirements under Section 506B of the FD&C Act.

21
The status changes impacted 27 percent (395/1450) of the PMRs/PMCs in the cohort. As shown in Table 2, most status changes occurred among the PMRs/PMCs that were initially categorized as pending. Out of the 670 initially pending PMRs/PMCs, 16 percent (107/670) were categorized as ongoing after the second post-audit analysis; 9 percent (59/670) were categorized as fulfilled; 6 percent (41/670) were categorized as delayed; 4 percent (26/670) were categorized as released, and 3 percent (23/670) were categorized as submitted. Out of the 70 PMRs/PMCs initially categorized as submitted, 46 percent (32/70) were categorized as fulfilled after the second post-audit analysis. These results suggest that a larger proportion of the initial cohort was actually in submitted or fulfilled status, and support the finding that a common reason for inaccurate recorded status in the PMR/PMC database was that applicants’ submitted Final Reports had not been reviewed and the status updates entered within the specified timeframes.
Table 2. Pattern of PMR/PMC Status Changes
PMR/PMC Status After Data Updates (status as of 09/30/2014) Initial PMR/PMC Status (as of 09/30/2013) Pending Ongoing Delayed Terminated Submitted Fulfilled Released TOTAL
Pending 413 107 41 1 23 59 26 670
Ongoing 0 169 9 1 17 25 7 228
Delayed 5 14 58 0 9 7 7 100
Terminated 0 0 0 1 0 1 0 2
Submitted 1 3 0 0 34 32 0 70 Total Open PMRs/PMCs with Status Change 6 124 50 2 49 124 40 395
It is important to note that the initial and subsequent audits ascertained the actual status of the sample PMRs and PMCs at the selected time points. The audits did not evaluate what the PMR/PMC status should have been at those time points. Therefore the second post-audit

22
analysis reflected the status of the PMRs/PMCs as of September 30, 2014. Consequently the observed status changes could be reflective of:
• The expected progress of the PMRs/PMCs over time, with ensuing status changes;32 or • Corrections of true errors in categorization of the PMR/PMC status in the database.
Outcomes of CDER’s Evaluation
Based on its self-initiated evaluation, CDER is implementing new, and improving existing, PMR/PMC procedures in order to streamline data entry, minimize data entry errors, and ensure timeliness of the data on PMR/PMC status. CDER is exploring avenues to improve the quality, content and review of applicant submitted annual status reports. CDER is also evaluating potential changes to improve its available informatics tools to maximize oversight and tracking capabilities as well as to automate data capture, which would further improve the timeliness and accuracy of its data on the status of PMRs/PMCs.
CDER: Status of PMRs/PMCs (FY 2013 and FY 2014) The following sections present information that supplements the Federal Register report on the status of PMRs and PMCs as of FY 2013 and FY 2014. The data presented are for PMRs and PMCs that are managed by CDER. Due to rounding, the percentages in the tables may not add up to 100 percent.
Applicants and Applications with Open PMRs/PMCs An applicant may have multiple approved drug products, and an approved drug product may have multiple PMRs and/or PMCs. Table 3 shows that as of September 30, 2013, there were 219 unique applicants with open PMRs/PMCs under 557 unique NDAs and BLAs. As of September 30, 2014, there were 219 unique applicants with open PMRs/PMCs under 575 unique NDAs and BLAs.
32 See Figure 1, PMR/PMC Lifecycle

23
Table 3. CDER: Applicants and Applications (NDA/BLA) With Open Postmarketing Requirements and Commitments
FY 2013 NDA BLA TOTAL Number of unique applicants with open
PMRs/PMCs 182 37 219
Number of applications with open PMRs/PMCs 494 63 557 FY 2014 NDA BLA TOTAL
Number of unique applicants with open PMRs/PMCs
180 39 219
Number of applications with open PMRs/PMCs 509 66 575
Annual Status Reports (ASRs) Received Applicants must submit an annual report on the progress of each open PMR/PMC within 60 days of the anniversary date of U.S. approval of the original application or an alternate reporting date that was granted by FDA.33 Table 4 shows that in FY 2013, there were 484 NDAs and BLAs with an ASR due in FY 2013 (428 NDAs and 56 BLAs). Table 4 and Figure 6 show that of the NDA ASRs due in that fiscal year, 60 percent (256/428) were received on time, 21 percent (90/428) were received, but not on time, and 19 percent (82/428) were not received during FY 2013. There were 56 BLAs with an ASR due in FY 2013. Of the BLA ASRs due, 75 percent (42/56) were received on time, 18 percent (10/56) were received, but not on time, and 7 percent (4/56) were not received during FY 2013.34
There were 514 NDAs and BLAs with an ASR due in FY 2014 (452 NDAs and 62 BLAs). Of the 452 NDA ASRs due in that fiscal year, 58 percent (264/452) were received on time, 19 percent (88/452) were received, but not on time, and 22 percent (100/452) were not received during FY 2014. Of the 62 BLA ASRs due, 73 percent (45/62) were received on time, 11 percent (7/62) were received, but not on time, and 16 percent (10/62) were not received during FY 2014.
33 Section 506B of the FD&C Act; 21 CFR 314.81 and 21 CFR 601.70. An applicant must submit an ASR on the progress of each open PMR/PMC within 60 days of the anniversary date of U.S. approval of the original application or on an alternate reporting date that was granted by FDA in writing. Some applicants have requested and been granted by FDA alternate annual reporting dates to facilitate harmonized reporting across multiple applications. 34 FDA intends to issue letters notifying applicants of overdue ASR submissions. See CDER MAPP 6010.2. Responsibilities for Tracking and Communicating the Status of Postmarketing Requirements and Commitments. Available at http://www.fda.gov/downloads/AboutFDA/CentersOffices/CDER/ManualofPoliciesProcedures/UCM174552.pdf.

24
Table 4. CDER: Annual Status Reports Received Expected1 Received, On
Time2 (% of Expected)
Received, Not on Time3
(% of Expected)
Expected but Not Received
(% of Expected) FY 2013 N N (%) N (%) N (%)
NDA 428 256 (60%) 90 (21%) 82 (19%) BLA 56 42 (75%) 10 (18%) 4 (7%)
Total 484 298 (62%) 100 (21%) 86 (18%) FY 2014
NDA 452 264 (58%) 88 (19%) 100 (22%) BLA 62 45 (73%) 7 (11%) 10 (16%)
Total 514 309 (60%) 95 (18%) 110 (21%) 1 ASR expected during fiscal year (within 60 days (before or after) of the anniversary of original approval date or alternate agreed-upon date). 2 ASR was received within 60 days (before or after) of the anniversary of the original approval date or alternate agreed-upon date. 3 ASR was received, but not within 60 days (before or after) of the anniversary of the original approval date or alternate agreed-upon date.
Figure 6. CDER: Annual Status Reports Received (NDAs and BLAs combined)
60%
62%
18%
21%
21%
18%
0% 20% 40% 60% 80% 100%
FY 14
FY 13
Received, on-time Received, not on-time Not received

25
PMRs and PMCs by Application Type As of FY 2013, there were 1158 PMRs (88 percent (1019/1158) NDA PMRs and 12 percent (139/1158) BLA PMRs); and 516 PMCs (61 percent (317/516) NDA PMCs and 39 percent (199/516) BLA PMCs). As of FY 2014, there were 1294 PMRs of which the majority were associated with NDAs (87 percent (1129/1294)); and 505 PMCs of which 60 percent (303/505) were associated with NDAs (Figures 7 and 8).
Figure 7. CDER: PMRs by Application Type
88%87%
12% 13%0
200
400
600
800
1000
1200
FY 13 FY 14
Num
ber o
f PM
Rs
NDA BLA
Figure 8. CDER: PMCs by Application Type
61% 60%39% 40%
0
200
400
600
800
1000
1200
FY 13 FY 14
Num
ber o
f PM
Cs
NDA BLA

PMRs by Requiring Authority PMRs required under the PREA and FDAAA authorities comprise the majority of required postmarketing studies and clinical trials. As displayed in Figure 9, as of September 30, 2013, PREA PMRs and FDAAA PMRs each comprised 48 percent of all 1158 PMRs. As of the next fiscal year, PREA PMRs comprised 49 percent of PMRs, and FDAAA PMRs comprised 45 percent of all 1294 PMRs.
Figure 9. CDER: PMRs by Requiring Authority (NDAs and BLAs combined)
5 (<1%)
5 (<1%)
62 (5%)
43 (4%)
587 (45%)
558 (48%)
640 (49%)
552 (48%)
0 100 200 300 400 500 600 700
FY 14
FY 13
FDAAA Safety PREA Accelerated Approval Animal Efficacy
Number (%) of Open and Closed PMRs
Overview of PMR and PMC Status Figure 10 and Figure 11 show the distribution of PMR and PMC statuses, as of FY 2013 and FY 2014. Pending PMRs were the largest category of PMRs at the end of each fiscal year (51 percent and 39 percent, respectively). Higher proportions of PMRs were categorized as ongoing and fulfilled in FY 2014 (27 percent and 12 percent, respectively) than in FY 2013 (18 percent and 6 percent, respectively) (Figure 10). Fewer PMCs were categorized as pending in FY 2014 compared to FY 2013 (19 percent and 31 percent, respectively), and more PMCs were categorized as fulfilled in FY 2014 compared to FY 2013 (27 percent and 12 percent, respectively) (Figure 11).
26

27
Figure 10. CDER: Distribution of PMR Statuses, as of FY 2013 and FY 2014 (NDAs and BLAs combined)
589 (51%)
208 (18%)
61 (5%)
156 (13%)
5 (<1%)75 (6%) 64 (6%)
502 (39%)
355 (27%)
76 (6%)134 (10%)
11 (1%)
157 (12%)
59 (5%)
0
100
200
300
400
500
600
Pending Ongoing Submitted Delayed Terminated Fulfilled Released*
On-Schedule Open PMRs Off-Schedule Open PMRs Closed PMRs
FY 13FY 14
Total CDER PMRs= 1,158= 1,294
* Includes PMRs that were released and replaced with a new requirement.
Figure 11. CDER: Distribution of PMC Statuses, as of FY 2013 and FY 2014 (NDAs and BLAs combined)
161 (31%) 99
(19%) 79(15%)
9318% 7
(1%)
62(12%) 15
(3%)
96 (19%)
103 (20%) 52
(10%)
89(18%)
5(1%)
137(27%)
23(5%)
0
100
200
300
400
500
600
Pending Ongoing Submitted Delayed Terminated Fulfilled Released*
On-Schedule Open PMCs Off-Schedule Open PMCs Closed PMCs
FY13FY14
Total PMCs= 516= 505
* Includes PMCs that were released and replaced with a new requirement.
Open PMRs and PMCs, by Application Type As displayed in Table 5 and Figure 12, as of September 30, 2013, most open CDER PMRs (84 percent for NDAs and 87 percent for BLAs) and most open PMCs (77 percent for NDAs and 78 percent for BLAs) were progressing on schedule (i.e., were not delayed or terminated). Similarly, as of September 30, 2014, most open PMRs (87 percent for NDAs and 86 percent for BLAs) and most open PMCs (68 percent for NDAs and 80 percent for BLAs) were progressing on schedule.

28
Table 5. CDER: Summary of On- and Off-Schedule Postmarketing Requirements and Commitments
FY 2013
Open PMRs N = 1019
Open PMCs N = 439
NDA (% of Open NDA
PMRs)
BLA (% of Open BLA
PMRs)
NDA (% of Open NDA
PMCs)
BLA (% of Open BLA
PMCs) On-schedule 742 (84%) 116 (87%) 203 (77%) 136 (78%) Off-schedule 143(16%) 18 (13%) 61 (23%) 39 (22%)
Total 885 134 264 175
FY 2014
Open PMRs N = 1078
Open PMCs N = 345
NDA (% of Open NDA
PMRs)
BLA (% of Open BLA
PMRs)
NDA (% of Open NDA
PMCs)
BLA (% of Open BLA
PMCs) On-schedule 816 (87%) 117 (86%) 141 (68%) 110 (80%) Off-schedule 126 (13%) 19 (14%) 66 (32%) 28 (20%)
Total 942 136 207 138
Figure 12. CDER: Summary of On- and Off-Schedule Postmarketing Requirements and Commitments (NDAs and BLAs combined)
13%
16%
87%
84%
0 200 400 600 800 1000
FY 14
FY 13
Number (%) of Open PMRs
CDER Open PMRsOn-Schedule
Off-Schedule
27%
23%
73%
77%
0 200 400 600 800 1000
FY 14
FY 13
Number (%) of Open PMCs
CDER Open PMCsOn-Schedule
Off-Schedule
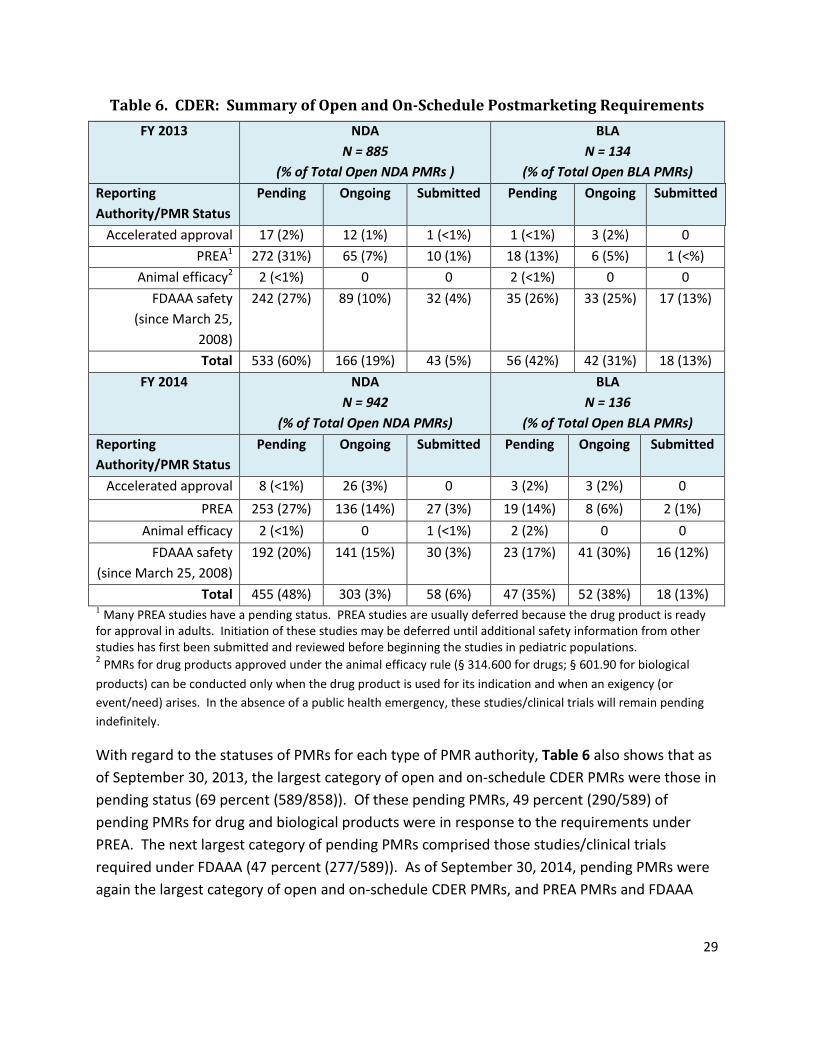
Open and On-Schedule PMRs Table 6 shows that as of September 30, 2013, the majority of open CDER PMRs were pending (72 percent (533/742) of open NDA PMRs; and 48 percent (56/116) of open BLA PMRs). As of September 30, 2014, 56 percent (455/816) of open NDA PMRs were pending. Additionally, the proportion of open NDA PMRs that were categorized as ongoing increased from 22 percent (166/742) at the end of FY 2013 to 37 percent (303/816) at the end of FY 2014. Similar changes were observed for BLA PMRs in that fiscal year.
29
Table 6. CDER: Summary of Open and On-Schedule Postmarketing Requirements FY 2013 NDA
N = 885 (% of Total Open NDA PMRs )
BLA N = 134
(% of Total Open BLA PMRs) Reporting Authority/PMR Status
Pending Ongoing Submitted Pending Ongoing Submitted
Accelerated approval 17 (2%) 12 (1%) 1 (<1%) 1 (<1%) 3 (2%) 0 PREA1 272 (31%) 65 (7%) 10 (1%) 18 (13%) 6 (5%) 1 (<%)
Animal efficacy2 2 (<1%) 0 0 2 (<1%) 0 0 FDAAA safety
(since March 25, 2008)
242 (27%) 89 (10%) 32 (4%) 35 (26%) 33 (25%) 17 (13%)
Total 533 (60%) 166 (19%) 43 (5%) 56 (42%) 42 (31%) 18 (13%) FY 2014 NDA
N = 942 (% of Total Open NDA PMRs)
BLA N = 136
(% of Total Open BLA PMRs) Reporting Authority/PMR Status
Pending Ongoing Submitted Pending Ongoing Submitted
Accelerated approval 8 (<1%) 26 (3%) 0 3 (2%) 3 (2%) 0 PREA 253 (27%) 136 (14%) 27 (3%) 19 (14%) 8 (6%) 2 (1%)
Animal efficacy 2 (<1%) 0 1 (<1%) 2 (2%) 0 0 FDAAA safety
(since March 25, 2008) 192 (20%) 141 (15%) 30 (3%) 23 (17%) 41 (30%) 16 (12%)
Total 455 (48%) 303 (3%) 58 (6%) 47 (35%) 52 (38%) 18 (13%) 1 Many PREA studies have a pending status. PREA studies are usually deferred because the drug product is ready for approval in adults. Initiation of these studies may be deferred until additional safety information from other studies has first been submitted and reviewed before beginning the studies in pediatric populations. 2 PMRs for drug products approved under the animal efficacy rule (§ 314.600 for drugs; § 601.90 for biological products) can be conducted only when the drug product is used for its indication and when an exigency (or event/need) arises. In the absence of a public health emergency, these studies/clinical trials will remain pending indefinitely.
With regard to the statuses of PMRs for each type of PMR authority, Table 6 also shows that as of September 30, 2013, the largest category of open and on-schedule CDER PMRs were those in pending status (69 percent (589/858)). Of these pending PMRs, 49 percent (290/589) of pending PMRs for drug and biological products were in response to the requirements under PREA. The next largest category of pending PMRs comprised those studies/clinical trials required under FDAAA (47 percent (277/589)). As of September 30, 2014, pending PMRs were again the largest category of open and on-schedule CDER PMRs, and PREA PMRs and FDAAA

30
PMRs comprised 54 percent (272/502) and 43 percent (215/502) of pending PMRs, respectively.
Figure 13 displays the status of CDER’s open and on-schedule PMRs for NDAs and BLAs combined. Similar to Table 6, this figure shows that the majority of open-and on-schedule PMRs in FY 2013 and FY 2014 were those categorized as pending.
Figure 13. CDER: Status of Open and On-Schedule PMRs (NDAs and BLAs combined)
76 (8%)
61 (7%)
355 (38%)
208 (24%)
502 (54%)
589 (67%)
0 100 200 300 400 500 600
FY 14
FY 13
Number (%) of On-Schedule Open PMRs
Pending
Ongoing
Submitted
Open and Off-Schedule PMRs Table 7 provides additional information on the status of open and off-schedule (i.e., delayed and terminated) PMRs. At the end of FY 2013, 19 percent (140/742) of the open NDA PMRs were delayed and less than 1 percent (3/742) were terminated. At the end of that same fiscal year, 14 percent (16/116) of the open BLA PMRs were delayed and 2 percent (2/116) were terminated. As of the end of FY 2014, the percentage of delayed open NDA PMRs had decreased to 14 percent (118/816) and the percentage of delayed BLA PMRs was unchanged. Altogether, as of FY 2013, delayed PREA PMRs comprised 11 percent (100/868) of all open PMRs; and 7 percent (72/933) of all open PMRs as of FY 2014.

31
Table 7. CDER: Summary of Open and Off-Schedule Postmarketing Requirements FY 2013 NDA
N = 885 (% of Total Open NDA PMRs)
BLA N = 134
(% of Total Open BLA PMRs)
Reporting Authority/PMR Status
Delayed Terminated Delayed Terminated
Accelerated approval 7 (<1%) 1 (<1%) 1 (<1%) 0 PREA 94 (11%) 2 (<1%) 6 (4%) 2 (2%)
Animal efficacy 1 (<1%) 0 0 0 FDAAA safety
(since March 25, 2008) 38 (4%) 0 9 (7%) 0
Total 140 (16%) 3 (<1%) 16 (12%) 2 (2%) FY 2014 NDA
N = 942 (% of Total Open NDA PMRs)
BLA N = 136
(% of Total Open BLA PMRs)
Reporting Authority/PMR Status
Delayed Terminated Delayed Terminated
Accelerated approval 6 (<1%) 2 (<1%) 0 0 PREA 67 (7%) 2 (<1%) 5 (4%) 3 (2%)
Animal efficacy 0 0 0 0 FDAAA safety
(since March 25, 2008) 45 (5%) 4 (<1%) 11 (8%) 0
Total 118 (13%) 8 (1%) 16 (12%) 3 (2%)
Figure 14 displays data for delayed PMRs only (NDA and BLA PMRs combined). Altogether, there were 156 PMRs and 134 PMRs that were delayed, as of FY 2013 and FY 2014 respectively. Consistent with the distribution of types of PMRs (see Figure 9), the majority of PMRs that were delayed were PREA PMRs (64 percent (100/156) in FY 2013 and 54 percent (72/134) in FY 2014).

32
Figure 14. CDER: Delayed PMRs, by PMR Type (NDAs and BLAs combined)
1 (1%)
6 (4%)
8 (5%)
56 (42%)
47 (30%)
72 (54%)
100 (64%)
0 20 40 60 80 100 120
FY 14
FY 13
Number (%) Delayed PMRs
PREA FDAAA Safety Accelerated Approval Animal Efficacy
Open PMCs Pending NDA PMCs comprised the largest category of all open and on-schedule NDA PMCs as of September 30, 2013 (48 percent; 97/203), and September 30, 2014 (43 percent; 61/141). For all open and on-schedule BLA PMCs, the largest category as of September 30, 2013 was pending; as of September 30, 2014, the largest category was ongoing (Table 8).
Table 8. CDER: Summary of Open Postmarketing Commitments (PMCs)
Open Postmarketing Commitments (PMCs)
FY 2013 FY 2014
NDA N = 264
(% of Open PMCs)
BLA N= 175
(% of Open PMCs)
NDA N = 207
(% of Open PMCs)
BLA N = 138
(% of Open PMCs) On-Schedule
Pending 97 (37%) 64 (37%) 61 (30%) 35 (25%) Ongoing 61 (23%) 38 (22%) 49 (24%) 54 (39%)
Submitted 45 (18%) 34 (19%) 31 (15%) 21 (15%) Total On-Schedule 203 106 141 110 Off-Schedule
Delayed 56 (21%) 37 (21%) 63 (30%) 26 (19%) Terminated 5 (2%) 2 (1%) 3 (2%) 2 (2%)
Total Off-Schedule 61 39 66 28

33
Closed PMRs and PMCs Table 9 provides details about CDER’s PMRs and PMCs that were closed (released or fulfilled) within FY 2013 and FY 2014. The majority of closed PMRs were fulfilled (53 percent of NDA PMRs and 80 percent of BLA PMRs within FY 2013; 72 percent of NDA PMRs and 76 percent of BLA PMRs at the end of FY 2014). Similarly, the majority of closed PMCs within FY 2013 and FY 2014 were fulfilled.
Table 9. CDER: Summary of Closed* Postmarketing Requirements and Commitments
Postmarketing Requirements
FY 2013
FY 2014
NDA N = 134
BLA N = 5
NDA N = 187
BLA N = 29
Closed PMRs
(% of Closed PMRs)
(% of Closed PMRs)
(% of Closed PMRs)
(% of Closed PMRs)
Requirement met (fulfilled)
71 (53%) 4 (80%) 135 (72%) 22 (76%)
Requirement not met (released and new revised
requirement issued)
27 (20%) 0 (6%) 14 (7%) 3 (10%)
Requirement no longer feasible or drug product
withdrawn (released)
36 (27%) 1 (20%) 38 (20%) 4 (14%)
Postmarketing Commitments
FY 2013
FY 2014
NDA N = 53
BLA N = 24
NDA N = 96
BLA N = 64
Closed PMCs (% of Closed PMRs)
(% of Closed PMRs)
(% of Closed PMRs)
(% of Closed PMRs)
Requirement met (fulfilled)
42 (79%) 20 (83%) 84 (88%) 53 (81%)
Requirement not met (released and new revised
requirement issued)
0 0 0 1 (2%)
Requirement no longer feasible or drug product
withdrawn (released)
11 (21%) 4 (17%) 12 (13%) 10 (16%)
* The table shows data for only those PMRs and PMCs that were closed (fulfilled or released) within the fiscal year. Data for PMRs and PMCs that were closed in prior fiscal years are not included.

34
Distribution of the Statuses of PMRs and PMCs This section presents data showing the distribution of the statuses of all CDER PMRs and PMCs, as of September 30, 2014, presented by the year that the PMR/PMC was established35 (FY 2008 to FY 2014). Note that the data for closed (fulfilled or released) PMRs and PMCs is for all PMRs/PMCs established in FY 2008 through FY 2014 that were closed as of FY 2014. Therefore data for PMRs and PMCs that were closed in prior fiscal years (i.e., FY 2008 – FY 2013) are included.
As shown in Table 10 and Figure 15, most PMRs that were established in the earlier years were either fulfilled or released. For example, as of September 30, 2014, 45 percent of the PMRs that were established in FY 2008 were fulfilled, 21 percent were released, and 17 percent were ongoing. The majority of PMRs that were established in more recent years were either pending (i.e., not yet underway) or ongoing (i.e., still in progress and on schedule). For example, as of September 30, 2014, 87 percent of the PMRs established in FY 2014 were pending, and 9 percent were ongoing.
Table 10. CDER: Distribution of PMR statuses as of the end of FY 2014, by year of PMR establishment
PMR Status
as of Sep 30, 2014
Fiscal Year (FY) PMR Established Number (%) PMRs
FY 2008 N=121
FY 2009 N=236
FY 2010 N=211
FY 2011 N=251
FY 2012 N=200
FY 2013 N=242
FY 2014 N=249
Pending 11 (9%) 156 (6 %) 28 (13%) 41 (16%) 58 (29 %) 114 (47%) 217 (87%)
Ongoing 20 (17%) 50 (21%) 47 (22 %) 72 (29%) 57 (29%) 59 (24%) 23 (9%)
Submitted 1 (1%) 8 (3%) 19 (9%) 8 (3%) 13 (7%) 16 (7%) 1 (<1%)
Delayed 10 (8%) 24 (10 %) 16 (8 %) 19 (8%) 18 (9%) 19 (8%) 0
Terminated 0 2 (1%) 0 0 1 (1%) 3 (1%) 1 (<1%)
Released 25 (21%) 51 (22%) 19 (9%) 43 (17%) 20 (10%) 8 (3%) 1 (<1%)
Fulfilled 54 (45%) 86 (36%) 82 (39 %) 68 (27%) 33 (17%) 23 (10%) 6 (2%)
35 The establishment date is the date of the formal FDA communication to the applicant which included the final FDA required (PMR) or requested (PMC) postmarketing study or clinical trial.

35
Figure 15. CDER: Distribution of PMR Statuses as of the End of FY 2014, by Year of PMR Establishment
87%
47%
29%
16%
13%
6%
9%
9%
24%
29%
29%
22%
21%
17%
7%
7%
3%
9%
3%
1%
8%
9%
8%
8%
10%
8%
1%
1%
3%
10%
17%
9%
22%
21%
2%
10%
17%
27%
39%
36%
45%
2014
2013
2012
2011
2010
2009
2008
PMR
Esta
blis
hed
Fisc
al Y
ear Pending
Ongoing
Submitted
Delayed
Terminated
Released
Fulfilled
Submitted, Terminated, and Released each is <1%
Similar patterns of distribution were observed with FDAAA PMRs (Figure 16) and PREA PMRs (Figure 17) specifically. That is, most PMRs that were established in the earlier years were either fulfilled or released, and fewer were ongoing. Additionally, the majority of PMRs that were established in more recent years were either pending (i.e., not yet underway) or were ongoing.

36
Figure 16. CDER: Distribution of FDAAA PMR Statuses as of the End of FY 2014, by Year of FDAAA PMR Establishment
88%
38%
22%
8%
10% 1%
6%
29%
33%
27%
19%
20%
10%
1%
8%
5%
3%
11%
5%
7%
10%
9%
6%
7%
8%
1%
2%
1%
1%
3%
8%
3%
18%
27%
4%
15%
26%
44%
50%
50%
55%
2014
2013
2012
2011
2010
2009
2008
FDAA
A Sa
fety
PM
R Es
tabl
ishe
d Fi
scal
Yea
r
Pending
Ongoing
Submitted
Delayed
Terminated
Released
Fulfilled
Figure 17. CDER: Distribution of PREA PMR Statuses as of the End of FY 2014, by Year of PREA PMR Establishment
94%
60%
39%
29%
21%
15%
15%
6%
17%
20%
28%
27%
23%
22%
6%
9%
3%
5%
1%
2%
10%
7%
6%
13%
15%
9%
2%
6%
22%
31%
22%
28%
17%
1%
3%
3%
13%
16%
35%
2014
2013
2012
2011
2010
2009
2008
PREA
PM
R Es
tabl
ishe
d Fi
scal
Yea
r
Pending
Ongoing
Submitted
Delayed
Terminated
Released
Fulfilled

37
As shown in Figure 18, with respect to Accelerated Approval PMRs, as of September 30, 2014, the majority of PMRs that were established in FY 2008 and FY 2009 were fulfilled (57 percent and 60 percent, respectively). At least half of the Accelerated Approval PMRs that were established since FY 2009 were ongoing as of September 30, 2014. For example, of the Accelerated Approval PMRs that were established in FY 2010 and FY 2013, 63 percent and 50 percent, respectively, were ongoing as of September 30, 2014. With the exception of Accelerated Approval PMRs that were established in FY 2009 and FY 2012, as of September 30, 2014, none of the Accelerated Approval PMRs were delayed.
Figure 18. CDER: Distribution of Accelerated Approval PMR statuses as of the End of FY 2014, by Year of Accelerated Approval PMR Establishment
31%
14%
25%
13%
14%
56%
50%
50%
63%
50%
20%
14%
25%
10%
7%
6%
13%
10%
14%
6%
29%
13%
50%
60%
57%
2014
2013
2012
2011
2010
2009
2008
Acce
lera
ted
Appr
oval
PM
R Es
tabl
ishe
d Fi
scal
Yea
r Pending
Ongoing
Submitted
Delayed
Terminated
Released
Fulfilled
Table 11 and Figure 19 display the distribution of all PMCs in a similar manner as Table 10 and Figure 15, and shows similar results for all PMCs as those for all PMRs, as described above.

38
Table 11. CDER: Distribution of PMC Statuses as of the End of FY 2014, by Year of PMC Establishment
PMC Status as of Sep 30, 2014
Fiscal Year (FY) PMC Established Number (%) PMCs
FY 2008 N=107
FY 2009 N=41
FY 2010 N=55
FY 2011 N=69
FY 2012 N=48
FY 2013 N=34
FY 2014 N=36
Pending 1 (1%) 2 (5%) 2 (4%) 11 (16%) 8 (17%) 12 (35%) 31 (86%)
Ongoing 10 (9%) 4 (10%) 9 (16%) 22 (32%) 16 (33%) 12 (35%) 5 (14%)
Submitted 1 (1%) 5 (12%) 6 (11%) 2 (3%) 5 (10%) 4 (12%) 0
Delayed 7 (7%) 7 (17%) 7 (13%) 4 (6%) 5 (10%) 2 (6%) 0
Terminated 0 1 (2%) 0 0 0 0 0
Released 12 (11%) 3 (7%) 4 (7%) 5 (7%) 0 0 0
Fulfilled 76 (71%) 19 (46%) 27 (49%) 25 (36%) 14 (29%) 4 (12%) 0
Figure 19. Distribution of PMC Statuses as of the End of FY 2014, by Year of PMC Establishment
86%
35%
17%
16%
4%
5% 1%
14%
35%
33%
32%
16%
10%
9%
12%
10%
3%
11%
12%
1%
6%
10%
6%
13%
17%
7%
2%
7%
7%
7%
11%
12%
29%
36%
49%
46%
71%
2014
2013
2012
2011
2010
2009
2008
PMC
Esta
blis
hed
Fisc
al Y
ear Pending
Ongoing
Submitted
Delayed
Terminated
Released
Fulfilled

39
CBER: Status of PMRs/PMCs (FY 2013 and FY 2014) The following sections present information that supplements the FDA’s most recent annual Federal Register report on the status of PMRs and PMCs. The data presented here are for PMRs and PMCs that are managed by FDA’s Center for Biologics Evaluation and Research (CBER). Of note, the data include two NDAs managed by CBER that have associated PMRs and PMCs. Due to the comparatively small number of NDA with PMRs/PMCs, this section reflects combined NDA and BLA data (except where otherwise noted). Due to rounding, the percentages in the tables may not add up to 100 percent.
Applicants and Applications with Open PMRs/PMCs Table 12 shows that as of September 30, 2013, there were 37 unique applicants with open PMRs/PMCs under 56 unique NDAs and BLAs. As of September 30, 2014, there were 38 unique applicants with open PMRs/PMCs under 64 unique NDAs and BLAs.
Table 12. CBER: Applicants and Applications (NDA/BLA) With Open Postmarketing Requirements and Commitments
FY 2013 NDA BLA Number of unique applicants with open
PMRs/PMCs 2 35
Number of applications with open PMRs/PMCs 2 54 FY 2014 NDA BLA
Number of unique applicants with open PMRs/PMCs
1 37
Number of applications with open PMRs/PMCs 1 63
Annual Status Reports (ASRs) Received In FY 2013, 62 percent (28/45) of the expected ASRs were received on time, 22 percent (10/45) were received but not on time, and 16 percent (7/45) were not received. In FY 2014, 53 percent (28/53) ASRs were received on time, 25 percent (13/53) were received but not on time, and 23 percent (12/53) were not received (Table 13 and Figure 20).36
36 FDA intends to issue letters notifying applicants of overdue ASR submissions. See CBER SOPP 8413: Postmarketing Commitment Related Submissions - Administrative Handling, Review, and CBER Reporting. Available at http://www.fda.gov/BiologicsBloodVaccines/GuidanceComplianceRegulatoryInformation/ProceduresSOPPs/ucm223772.htm

40
Table 13. CBER: Annual Status Reports Received Expected1 Received, On Time2
(% of Expected) Received, Not on
Time3 (% of Expected)
Expected but Not Received
(% of Expected) FY 134 45 28 (62%) 10 (22%) 7 (16%)
FY 144 53 28 (53%) 13 (25%) 12 (23%) 1 ASR expected during fiscal year (within 60 days (before or after) of the anniversary of original approval date or alternate agreed-upon date). 2 ASR was received within 60 days (before or after) of the anniversary of the original approval date or alternate agreed-upon date. 3 ASR was received, but not within 60 days (before or after) of the anniversary of the original approval date or alternate agreed-upon date. 4 Includes one NDA associated with PMRs/PMCs.
Figure 20. CBER: Annual Status Reports Received
53%
62%
25%
22%
23%
16%
0% 20% 40% 60% 80% 100%
FY 2014
FY 2013
Received, on-time Received, not on-time Not received
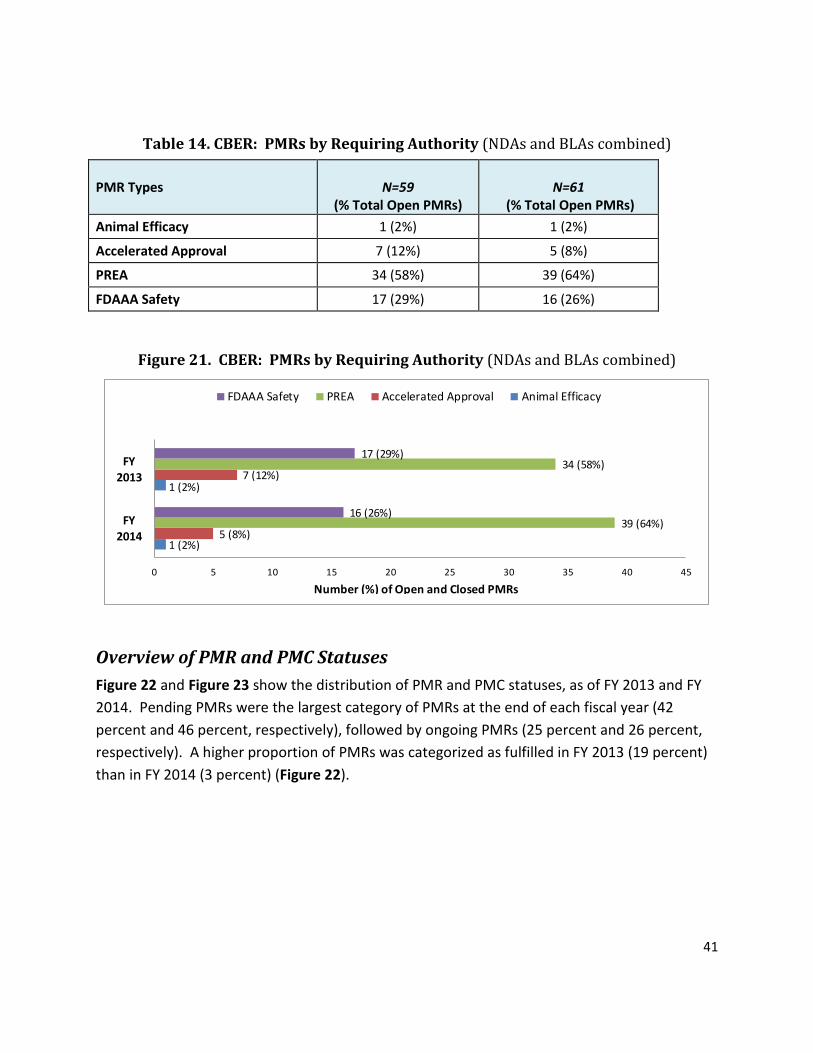
PMRs by Requiring Authority PREA and FDAAA PMRs comprise the majority of CBER’s required postmarketing studies and clinical trials. As displayed in Table 14 and Figure 21, as of September 30, 2013, PREA PMRs comprised 58 percent and FDAAA PMRs comprised 29 percent of all open CBER PMRs. As of the next fiscal year, PREA PMRs comprised 64 percent of PMRs, and FDAAA PMRs comprised 26 percent.
41
Table 14. CBER: PMRs by Requiring Authority 13
(NDAs and BLAs comb ) FY 20 FY 2014
ined
PMR Types N=59 (% Total Open PMRs)
N=61 (% Total Open PMRs)
Animal Efficacy 1 (2%) 1 (2%)
Accelerated Approval 7 (12%) 5 (8%)
PREA 34 (58%) 39 (64%)
FDAAA Safety 17 (29%) 16 (26%)
Figure 21. CBER: PMRs by Requiring Authority (NDAs and BLAs combined)
1 (2%)
1 (2%)
5 (8%)
7 (12%)
39 (64%)
34 (58%)
16 (26%)
17 (29%)
0 5 10 15 20 25 30 35 40 45
FY2014
FY2013
FDAAA Safety PREA Accelerated Approval Animal Efficacy
Number (%) of Open and Closed PMRs
Overview of PMR and PMC Statuses Figure 22 and Figure 23 show the distribution of PMR and PMC statuses, as of FY 2013 and FY 2014. Pending PMRs were the largest category of PMRs at the end of each fiscal year (42 percent and 46 percent, respectively), followed by ongoing PMRs (25 percent and 26 percent, respectively). A higher proportion of PMRs was categorized as fulfilled in FY 2013 (19 percent) than in FY 2014 (3 percent) (Figure 22).

42
Figure 22. CBER: Distribution of PMR Statuses, as of FY 2013 and FY 2014 (NDAs and BLAs combined)
25(42%)
15(25%)
5(8%) 2
(3%) 0%
11(19%)
1(2%)
28(46%)
16(26%) 10
(16%) 5(8%)
0%
2(3%) 0%
0
10
20
30
40
50
60
Pending Ongoing Submitted Delayed Terminated Fulfilled Released*
On-Schedule Open PMRs Off-Schedule Open PMRs Closed PMRs
FY 13FY 14
Total CBER PMRs= 59= 61
* Includes PMRs that were released and a new revised requirement issued
In both FY 2013 and FY 2014, most PMCs were in pending (28 percent and 35 percent, respectively), delayed (31 percent and 26 percent, respectively), and ongoing status (27 percent and 23 percent respectively) (Figure 23).
Figure 23. CBER: Distribution of PMC Statuses, as of FY 2013 and FY 2014 (NDAs and BLAs combined)
24(28%)
23(27%)
3(4%)
26(31%)
0%
8(9%) 1
(1%)
34(35%)
22(23%)
9(9%)
25(26%)
0%
4(4%)
2(2%)
0
10
20
30
40
50
60
Pending Ongoing Submitted Delayed Terminated Fulfilled Released*
On-Schedule Open PMCs Off-Schedule Open PMCs Closed PMCs
FY13FY14
Total CBER PMCs= 85= 96
* Includes PMCs that were released and a new revised commitment issued

43
Open PMRs and PMCs As displayed in Table 15 and Figure 24, as of September 30, 2013, thePMRs (96 percent) were progressing on schedule (i.e., were not delay
majority of open CBER ed or terminated). As of
September 30, 2014, 92 percent of open PMRs were progressing on schedule. Similarly, the majority of CBER PMCs were progressing on schedule.
Table 15. CBER: Summary of On- and Off-Schedule Postmarketing Requirements and Commitments (NDAs and BLAs combined)
FY 2013 Open PMRs
% Total Open PMRs Open PMCs
% Total Open PMCs On-schedule 45 (96%) 50 (66%) Off-schedule 2 (4%) 26 (34%)
Total 47 76
FY 2014 Open PMRs
% Total Open PMRs Open PMCs
% Total Open PMCs On-schedule 54 (92%) 65 (72%) Off-schedule 5 (8%) 25 (28%)
Total 59 90
Figure 24. CBER: Summary of On- and Off-Schedule Postmarketing Requirements and Commitments (NDAs and BLAs combined)
5 (8%)
2 (4%)
54 (92%)
45 (96%)
0 10 20 30 40 50 60 70 80
FY 14
FY 13
Number (%) of Open PMRs
CBER Open PMRsOn-Schedule
Off-Schedule
25 (28%)
26 (34%)
65 (72%)
50 (66%)
0 10 20 30 40 50 60 70 80
FY 14
FY 13
Number (%) of Open PMCs
CBER Open PMCsOn-Schedule
Off-Schedule
Open and On-Schedule PMRs As of FY 2013, of the PMRs that were on schedule, 56 percent (25/45) were pending, 33 percent (15/45) were ongoing, and 11 percent (5/45) were submitted. As of FY 2014, of the PMRs that were on schedule, 52 percent (28/54) were pending, 30 percent (16/54) were ongoing, and 19 percent (10/54) were submitted (Figure 25).
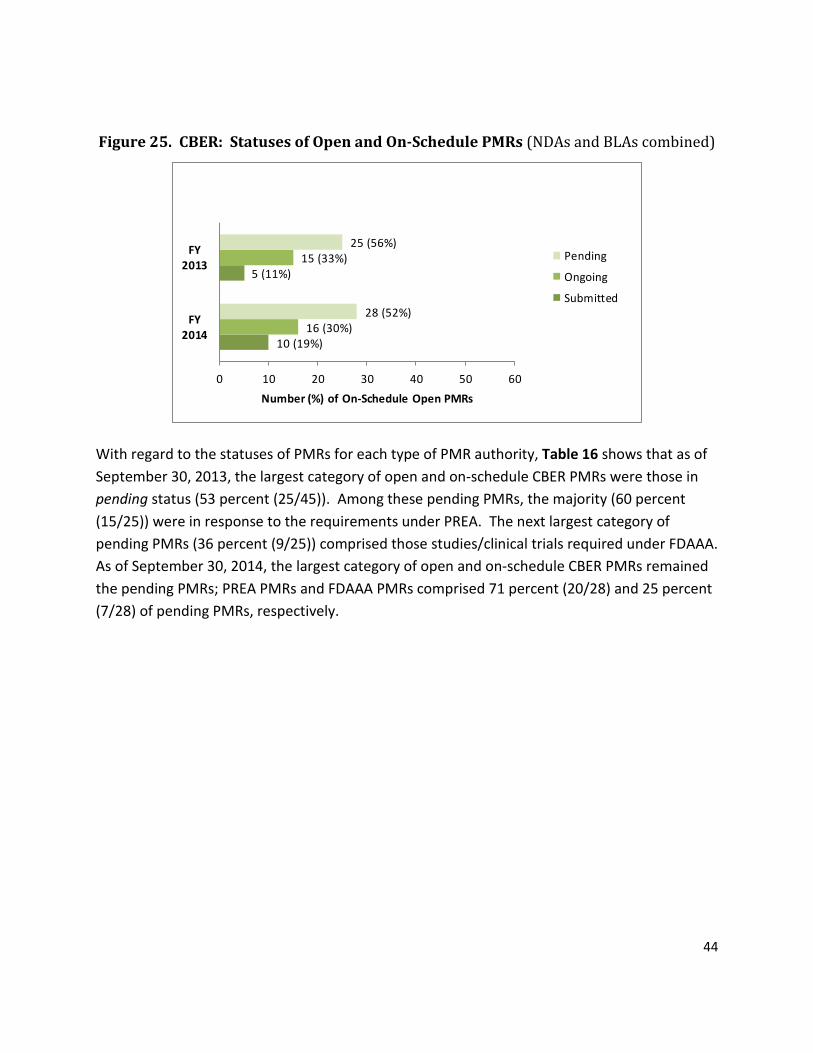
44
Figure 25. CBER: Statuses of Open and On-Schedule PMRs (NDAs and BLAs combined)
10 (19%)
5 (11%)
16 (30%)
15 (33%)
28 (52%)
25 (56%)
0 10 20 30 40 50 60
FY2014
FY2013
Number (%) of On-Schedule Open PMRs
Pending
Ongoing
Submitted
With regard to the statuses of PMRs for each type of PMR authority, Table 16 shows that as of September 30, 2013, the largest category of open and on-schedule CBER PMRs were those in pending status (53 percent (25/45)). Among these pending PMRs, the majority (60 percent (15/25)) were in response to the requirements under PREA. The next largest category of pending PMRs (36 percent (9/25)) comprised those studies/clinical trials required under FDAAA. As of September 30, 2014, the largest category of open and on-schedule CBER PMRs remained the pending PMRs; PREA PMRs and FDAAA PMRs comprised 71 percent (20/28) and 25 percent (7/28) of pending PMRs, respectively.

45
Table 16. CBER: Summary of Open and On-Schedule Postmarketing Requirements (NDAs and BLAs combined)
FY 2013 NDA and BLA
N = 47 (% of Total Open PMRs )
Reporting Authority/PMR Status Pending Ongoing Submitted Accelerated approval 0 5 (11%) 0
PREA1 15 (32%) 7 (15%) 3 (6%) Animal efficacy2 1 (2%) 0 0
FDAAA safety (since March 25, 2008) 93 (19%) 3 (6%) 23 (4%)
Total 25 (53%) 15 (32%) 5 (11%)
FY 2014 NDA3 and BLA
N = 59 (% of Total Open PMRs)
Reporting Authority/PMR Status Pending Ongoing Submitted Accelerated approval 0 1 (2%) 2 (3%)
PREA 20 (34%) 12 (20%) 6 (10%) Animal efficacy 1 (2%) 0 0
FDAAA safety (since March 25, 2008) 73 (12%) 3 (5%) 2 (3%)
Total 28 (47%) 16 (27%) 10 (17%)
1 Many PREA studies have a pending status. PREA studies are usually deferred because the drug product is ready for approval in adults. Initiation of these studies may be deferred until additional safety information from other studies has first been submitted and reviewed before beginning the studies in pediatric populations. 2 PMRs for drug products approved under the animal efficacy rule (§ 314.600 for drugs; § 601.90 for biological products) can be conducted only when the drug product is used for its indication and when an exigency (or event/need) arises. In the absence of a public health emergency, these studies/clinical trials will remain pending indefinitely. 3 Includes one PMR for an NDA.
Open and Off-Schedule PMRs Altogether, at the end of FY 2013, there were 2 PMRs that were off schedule (i.e., delayed or terminated). Both were FDAAA PMRs, and both were off schedule because they were delayed. As of FY 2014, there were 5 PMRs that were off schedule (delayed): 3 FDAAA PMRs and 2 Accelerated Approval PMRs (Table 17).

46
Table 17. CBER: Summary of Open and Off-Schedule Postmarketing Requirements (NDAs and BLAs combined)
CBER
FY 2013 FY 2014 NDA1 and BLA
N = 2 (% of total off-schedule PMRs)
NDA1 and BLA
N = 5 (% of total off-schedule PMRs)
Reporting Authority/PMR Status
Delayed Terminated Delayed Terminated
Accelerated Approval 0 0 2 (40%) 0 PREA 0 0 0 0
Animal Efficacy 0 0 0 0 FDAAA Safety
(since March 25, 2008) 2 (100%) 0 3 (60%) 0
Total 2 (100%) 0 5 (100%) 0 1 There were no PMRs associated with an NDA that were off-schedule.
Open PMCs Table 18 shows that pending PMCs comprised the largest category of all open PMCs as of September 30, 2013 (48 percent; 24/50), and September 30, 2014 (52 percent; 34/65). In both fiscal years, all of the open and off-schedule PMCs were off schedule because they were delayed.
Table 18. CBER: Summary of Open Postmarketing Commitments (PMCs) (NDAs and BLAs combined)
Open Postmarketing Commitments (PMCs)
FY 2013
NDA1 and BLA
FY 2014
NDA2 and BLA
On-Schedule
N = 50
(% of Total Open PMCs)
N = 65
(% of Total Open PMCs) Pending 24 (48%) 34 (52%) Ongoing 23 (46%) 22 (34%)
Submitted 3 (6%) 9 (14%) Off-Schedule
NDA and BLA
N = 26 (% of Total Open PMCs)
NDA and BLA
N = 25 (% of Total Open PMCs)
Delayed 26 (100%) 25 (100%) Terminated 0 0
1 Includes two PMRs, each PMR is associated with a single NDA 2 Includes one PMR for an NDA

47
Closed PMRs and PMCs Table 19 provides details about CBER’s PMRs and PMCs that were closed (released or fulfilled) within FY 2013 and FY 2014. The majority of closed PMRs were fulfilled (92 percent within FY 2013; 100 percent within FY 2014). Similarly, the majority of closed PMCs within FY 2013 and FY 2014 were fulfilled (89 percent and 67 percent, respectively).
Table 19. – CBER: Summary of Closed* Postmarketing Requirements and Commitments (NDAs and BLAs combined)
FY 2013 FY 2014
Postmarketing Requirements NDA and BLA NDA1 and BLA Closed PMRs
N = 12 (% of Total Closed PMCs)
N = 2 (% of Total Closed PMCs)
Requirement met (fulfilled) 11 (92%) 2 (100%)
Requirement not met (released and new revised requirement issued)
0 0
Requirement no longer feasible or drug product withdrawn (released)
1 (8%) 0
Postmarketing Commitments NDA and BLA NDA and BLA
Closed PMCs
N = 9 (% of Total Closed PMCs)
N = 6 (% of Total Closed PMCs)
Requirement met (fulfilled) 8 (89%) 4 (67%)
Requirement not met (released and new revised requirement issued)
0 1 (17%)
Requirement no longer feasible or drug product withdrawn (released)
1 (11%) 1 (17%)
* The table shows data for only those PMRs and PMCs that were closed (fulfilled or released) within the fiscal year. Data for PMRs and PMCs that were closed in prior fiscal years are not included 1 Includes one PMR for an NDA
Distribution of the Statuses of PMRs and PMCs This section presents data showing the distribution of the statuses of all CBER PMRs and PMCs, as of September 30, 2014, presented by the year that the PMR/PMC was established37 (FY 2008 to FY 2014). Note that the data for closed (fulfilled or released) PMRs and PMCs is for all PMRs/PMCs established in FY 2008 through FY 2014) that were closed as of FY 2014. Therefore
37 The establishment date is the date of the formal FDA communication to the applicant which included the final FDA required (PMR) or requested (PMC) postmarketing study or clinical trial.

48
data for PMRs and PMCs that were closed in prior fiscal years (i.e., FY 2008 – FY 2013 are included.
Table 20 and Figure 26 show that, in general, the majority of PMRs that were established in the earlier years were fulfilled. For example, as of September 30, 2014, 43 percent of the PMRs that were established in FY 2008 were fulfilled. The majority of PMRs that were established in more recent years were pending (i.e., not yet underway). For example, as of September 30, 2014, 82 percent of the PMRs established in FY 2014 were pending, and 18 percent were fulfilled.
Table 20. CBER: Distribution of PMR Statuses as of the End of FY 2014, by Year of PMR Establishment (NDAs and BLAs combined)
PMR Status as of Sep 30, 2014
Fiscal Year (FY) PMR Established Number (%) PMRs
FY 2008 N = 7
FY 2009 N = 8
FY 2010 N = 20
FY 2011 N = 8
FY 2012 N = 5
FY 2013 N = 20
FY 2014 N = 11
Pending 0 0 1 (5%) 2 (25%) 2 (40 %) 14 (70%) 9 (82%)
Ongoing 0 1 (13%) 2 (10%) 2 (25%) 1 (20 %) 3 (15%) 0
Submitted 0 3 (38%) 2 (10%) 0 2 (40%) 3 (15%) 0
Delayed 1 (14%) 2 (25%) 2 (10%) 0 0 0 0
Terminated 0 0 0 0 0 0 0
Released 3 (43%) 0 3 (15%) 0 0 0 0
Fulfilled 3 (43%) 2 (25%) 10 (50%) 4 (50%) 0 0 2 (18%)
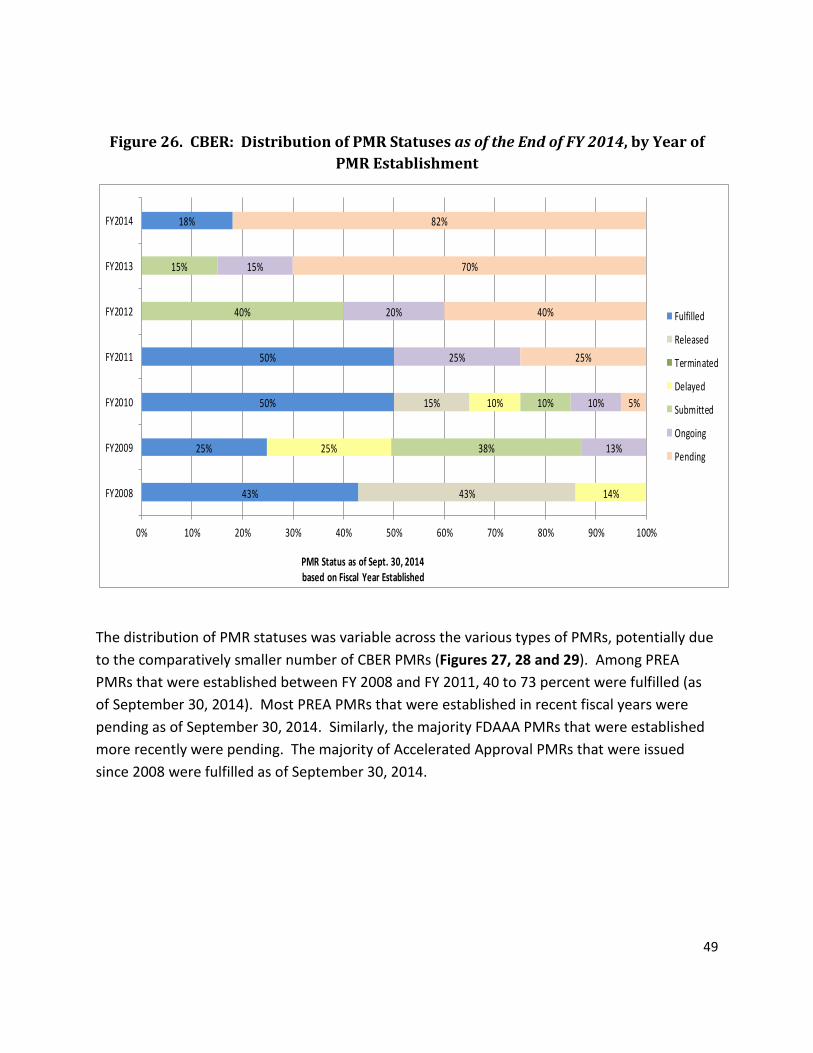
49
Figure 26. CBER: Distribution of PMR Statuses as of the End of FY 2014, by Year of PMR Establishment
43%
25%
50%
50%
18%
43%
15%
14%
25%
10%
38%
10%
40%
15%
13%
10%
25%
20%
15%
5%
25%
40%
70%
82%
0% 10% 20% 30% 40% 50% 60% 70% 80% 90% 100%
FY2008
FY2009
FY2010
FY2011
FY2012
FY2013
FY2014
PMR Status as of Sept. 30, 2014 based on Fiscal Year Established
Fulfilled
Released
Terminated
Delayed
Submitted
Ongoing
Pending
The distribution of PMR statuses was variable across the various types of PMRs, potentially due to the comparatively smaller number of CBER PMRs (Figures 27, 28 and 29). Among PREA PMRs that were established between FY 2008 and FY 2011, 40 to 73 percent were fulfilled (as of September 30, 2014). Most PREA PMRs that were established in recent fiscal years were pending as of September 30, 2014. Similarly, the majority FDAAA PMRs that were established more recently were pending. The majority of Accelerated Approval PMRs that were issued since 2008 were fulfilled as of September 30, 2014.

50
Figure 27. CBER: Distribution of PREA PMR Statuses as of the End of FY 2014, by Year of PREA PMR Establishment
40%
50%
73%
40%
11%
60%
50%
18%
14%
40%
50%
21%
9%
20%
50%
64%
89%
0% 20% 40% 60% 80% 100%
FY2008
FY2009
FY2010
FY2011
FY2012
FY2013
FY2014
PREA PMR Status of of Sept. 30, 2014 based on Fiscal Year Established
FulfilledReleasedTerminatedDelayedSubmittedOngoingPending
Figure 28. CBER: Distribution of FDAAA PMR Statuses as of the End of FY 2014, by Year of FDAAA PMR Establishment
14%
50%
29%
100%
29%
50%
20%
50%
29%
100%
100%
80%
50%
0% 10% 20% 30% 40% 50% 60% 70% 80% 90% 100%
FY2008
FY2009
FY2010
FY2011
FY2012
FY2013
FY2014
FDAAA Safety PMR Status as of Sept. 30, 2014 based on Fiscal Year Established
Fulfilled
Released
Terminated
Delayed
Submitted
Ongoing
Pending

51
Figure 29. CBER: Distribution of Accelerated Approval PMR Statuses as of the End of FY 2014, by Year of Accelerated Approval PMR Establishment
100%
50%
100%
50%
100%
100%
0% 10% 20% 30% 40% 50% 60% 70% 80% 90% 100%
FY2008
FY2009
FY2010
FY2011
FY2012
FY2013
FY2014
Accelerated Approval PMR Status as of Sept. 30, 2014 based on Fiscal Year Established
Fulfilled
Released
Terminated
Delayed
Submitted
Ongoing
Pending
Table 21 and Figure 30 display the distribution of all CBER PMCs and show that 83 percent of PMCs established in FY 2008 were fulfilled as of September 30, 2014, and the majority of PMCs that were established in more recent years were pending.
Table 21, CBER: Distribution of PMC Statuses as of the End of FY 2014, by Year of PMC Establishment (NDAs and BLAs combined)
Fiscal Year (FY) PMC Established Number (%) PMCs
PMC status as of Sep 30, 2014
FY 2008 N = 12
FY 2009 N = 6
FY 2010 N = 35
FY 2011 N = 13
FY 2012 N = 5
FY 2013 N = 15
FY 2014 N = 21
Pending 0 2 (33%) 1 (3%) 0 4 (80%) 10 (67%) 16 (76%) Ongoing 1 (8%) 1 (17%) 7 (20%) 3 (23%) 0 2 (13%) 4 (19%) Submitted 0 1 (17%) 3 (9%) 0 0 2 (13%) 0 Delayed 1 (8%) 1 (17%) 9 (26%) 4 (31%) 1 (20%) 1 (7%) 0 Terminated 0 0 0 0 0 0 0 Released 0 0 2 (6%) 2 (15%) 0 0 0 Fulfilled 10 (83%) 1 (17%) 13 (37%) 4 (31%) 0 0 1 (5%)

52
Figure 30 - CBER: Distribution of PMC statuses as of the end of FY 2014, by year of PMC establishment
83%
17%
37%
31%
5%
6%
15%
8%
17%
26%
31%
20%
7%
17%
9%
13%
8%
17%
20%
23%
13%
19%
33%
3%
80%
67%
76%
0% 10% 20% 30% 40% 50% 60% 70% 80% 90% 100%
FY2008
FY2009
FY2010
FY2011
FY2012
FY2013
FY2014
PMC Status as of Sept. 30, 2014 based on Fiscal Year Established
Fulfilled
Released
Terminated
Delayed
Submitted
Ongoing
Pending