Embed Size (px)
Citation preview

advances.sciencemag.org/cgi/content/full/3/6/e1603301/DC1
Supplementary Materials for
Increasing the revenue from lignocellulosic biomass: Maximizing
feedstock utilization
David Martin Alonso, Sikander H. Hakim, Shengfei Zhou, Wangyun Won, Omid Hosseinaei,
Jingming Tao, Valerie Garcia-Negron, Ali Hussain Motagamwala, Max A. Mellmer, Kefeng Huang,
Carl J. Houtman, Nicole Labbé, David P. Harper, Christos T. Maravelias, Troy Runge, James A. Dumesic
Published 19 May 2017, Sci. Adv. 3, e1603301 (2017)
DOI: 10.1126/sciadv.1603301
This PDF file includes:
Supplementary Materials and Methods
section S1. Biomass fractionation
section S2. Liquid/solid separation
section S3. High-purity cellulose production for dissolving pulp
section S4. Lignin recovery and precipitation experiments
section S5. Lignin recovery for carbon foam and battery anode production
section S6. Lignin characterization
section S7. Carbon foam production
section S8. Furfural production
section S9. Solvent stability study
section S10. Techno-economic model
fig. S1. Fractionation of white birch.
fig. S2. Lignin produced from white birch fractionation.
fig. S3. Lignin produced from white birch fractionation.
fig. S4. Thermal decomposition of lignin samples produced from white birch
fractionation at 70:30 GVL/water, 125°C, 3 hours, and 0.1 M sulfuric acid and
80:20 GVL/water, 130°C, 1 hour, and 0.1 M sulfuric acid.
fig. S5. Aromatic (left) and side chain (right) region of the 13C-1H (HSQC) spectra
of white birch, lignin samples produced from white birch fractionated at 70:30
GVL/water, 125°C, 3 hours, and 0.1 M sulfuric acid and 80:20 GVL/water,
130°C, 1 hour, and 0.1 M sulfuric acid.
fig. S6. X-ray diffraction patterns of carbonized and passivated GVL lignin
compared to the original lignin (top).

fig. S7. Carbon foam produced from lignin (initial white birch fractionation
conditions: 80:20 GVL/water, 130°C, 1 hour, and 0.1 M sulfuric acid).
fig. S8. Production of furfural in a batch reactor using 10 wt % xylose as
feedstock.
fig. S9. Production of furfural in a continuous flow reactor using xylose as
feedstock.
fig. S10. Gas chromatography–mass spectrometry (GC-MS) chromatogram of
GVL (top), tetrahydrofuran (THF) (middle), and ethanol (bottom) after 12 hours
at 130°C.
fig. S11. GC-MS chromatogram of GVL (top), THF (middle), and ethanol
(bottom) after 12 hours at 130°C.
table S1. White birch fractionation optimization.
table S2. Properties of bleached high-purity cellulose sample from white birch
wood chips to produce dissolving pulp.
table S3. Lignin solubility in GVL/water mixtures at room temperature.
table S4. Effect of water/GVL ratio on lignin precipitation.
table S5. Chemical composition and molecular weight of lignin samples.
table S6. Thermal properties of lignin samples.
table S7. Summary of NMR analysis of lignin samples.
table S8. Hydroxyl group content of lignin sample (70:30 GVL/water, 125°C, 3
hours, and 0.1 M sulfuric acid) obtained by quantitative 31P NMR spectroscopy
(mmol/g).
table S9. Liquid composition after 12 hours at 130°C.
table S10. Liquid composition after 12 hours at 130°C.
table S11. List of economic parameters and assumptions.
table S12. Mass and energy balances (basis: 2000 tons of white birch per day).
table S13. Energy requirements before and after heat integration (basis: 2000 tons
of white birch per day).
table S14. Capital and operating costs (basis: 2000 tons of white birch per day).
table S15. Process model development details.
References (32–43)

Supplementary Materials and Methods
section S1. Biomass fractionation
White birch chips (approximately 2.54 × 2.54 × 0.65 cm) were acquired from Flambeau
River Papers (Park Falls, WI). These chips are the same as used in their process to
produce paper pulp. The chips have a moisture content of ≈30% and were stored at −20
°C. These chips were used as-received for the large-scale fractionation. Smaller chips
were created for the 100 g scale fractionation to allow for more homogeneity. These
chips were produced using a DR model CST1450-CHP knife mill fitted with a 0.32 cm
screen after further drying to ~10% moisture. The chips were then screened with an 8 mm
sieve screen to remove large pieces.
The initial study to determine the optimal process conditions to fractionate white birch
chips was performed in a rotating digester with 3 stainless steel bombs placed inside (1 L
each). The reactor was externally heated to the desired temperature by saturated steam,
and mixing was achieved by rotating the reactor at 2 rpm for the first 30 minutes. At the
end of the fractionation, the steam supply was stopped, and the steam in the digester was
released to quench the reaction. The digester was opened and the bombs were further
cooled by immersion in cool water. After cooling, the pulping liquor was filtered from
the pulp solids using 42 grade Whatman filter paper in a Büchner funnel under vacuum
generated by a Welch 2511 Dry Vacuum Pump (Welch Vacuum Technology, Niles, IL).
The pulp solids were then removed and mixed with a solution of GVL/water (80/20) at
80°C to simulate solvent washing. Because the reactor effluent was cooled before the
washing step, the washing was repeated 3 times using a liquid:solid mass ratio of 4, 3, 3
using mixing times of 30, 20, 20 min, respectively. After solvent washing, the cake was
washed 2 more times using DI water at 80°C with a liquid:solid mass ratio of 5 using a
15 min mixing time. This washing procedure was designed to avoid any interference of
the washing step in the final cellulose purity.
The screened pulp moisture content was determined by placing the sample in an oven at
105°C following TAPPI-T258 om-02. Kappa numbers were measured using TAPPI
Standard Test Method TAPPI-UM246 (Micro kappa number), and the cellulose chain
lengths in the pulps were approximated by measuring CED viscosity using TAPPI-T230
om-04 (Viscosity of pulp (capillary viscometer method)). Alpha cellulose content of the
bleached pulp was measured by TAPPI-T203 (Alpha-, beta- and gamma-cellulose in
pulp). The chemical composition of the solid residue was analyzed following the
NREL/TP-510-42618, Determination of Structural Carbohydrates and Lignin in Biomass.
Experimental results are summarized in table S1.
section S2. Liquid/solid separation
Experiments to produce samples to study the liquid/solid separation step were carried out
in 60 mL high pressure glass reactors (Chemglass) placed in an oil bath. To fit the wood

chips inside the reactor, the size was reduced using a DR model CST1450-CHP knife
mill fitted with a 0.32 cm screen after further drying to ~10% moisture. The chips were
then screened with an 8 mm screen to remove large pieces. The final moisture content of
the white birch feedstock was ~5%.
In a typical experiment, 6 g of grinded white birch and 24 g of a liquid solution of
GVL/water 70/30 by weight and 0.1 M sulfuric acid were added to the reactor and heated
at 125°C for 3 hours. At the end of the reaction, the liquid was separated from the solid at
~80°C using a centrifuge filter or vacuum filtration. The remaining cellulose was washed
with an additional 24 g fresh GVL/water solution with the same composition as the one
used for the reaction to recover additional carbohydrates and lignin solubilized in the
liquid retained by the cellulose (i.e., solid cellulose containing 60-65 wt% liquid). After
15 minutes the liquid was separated from the cellulose using a centrifuge filter or vacuum
filtration. The cellulose was finally washed with water and analyzed to determinate its
chemical composition following the NREL/TP-510-42618 protocol, Determination of
Structural Carbohydrates and Lignin in Biomass. The liquid fraction was used to perform
a second fractionation. The liquid fraction from the second liquid/solid separation step
was used to treat 6 g of fresh white birch at the same conditions as indicated above. At
the end of the reaction, the liquid was separated from the solid at ~80°C using a
centrifuge filter or vacuum filtration. The remaining cellulose was washed with an
additional 24 g of fresh GVL/water solution. After 15 minutes the liquid was separated
from the cellulose using a centrifuge filter or vacuum filtration. The cellulose was finally
washed with water and analyzed as mentioned above. The liquid fraction was used to
perform another fractionation. The recycling was repeated 4 times.
The liquid fraction was analyzed by High Performance Liquid Chromatography (Waters
2695 system with a Bio-Rad Aminex HPX-87H column) equipped with an RI 410
detector (for carbohydrates, organic acids, GVL) and a UV detector (for furfural and
HMF). In addition, to convert soluble oligomeric carbohydrates into monomers, a
protocol similar to NREL/TP-510-42618 was followed. A portion of the liquid was
diluted 10 times with 4.4 wt% sulfuric acid and heated at 120°C for 1 hour. The sample
was analyzed by HPLC as mentioned above.
The results obtained using the recycled GVL/water solution were similar to those
obtained using fresh GVL/water (less than 5% difference), indicating that the presence of
biomass derived impurities, low concentrations of lignin, and/or carbohydrates do not
affect the fractionation process significantly (see fig. S1). By combining these two
solid/liquid separation stages we maximize the recovery of soluble C5 carbohydrates and
the lignin (>95%). The liquid fraction from the first stage contains the soluble C5 sugars
and lignin, and this stream is transferred to the lignin recovery step. Results from these
experiments were used in the technoeconomic model.
section S3. High-purity cellulose production for dissolving pulp
After optimizing the reaction conditions, a larger scale fractionation experiment was
performed in a 20 L twin-digester reactor to produce high purity cellulose for dissolving
pulp application, high purity lignin for carbon foam and battery anodes production, and
for furfural production. 2.5 kg of moist white birch chips were loaded in the reactor and
covered with a mixture of GVL/water (70/30 by weight) and 0.1 M sulfuric acid. The
excess of liquid was re-circulated for 3 h at 125°C. At the end of the reaction, the liquid
was collected to recover the lignin and to produce furfural. The cellulose was washed
inside the reactor 3 times with a hot GVL/water mixture and 2 additional times with hot
water. Before washing the cellulose, the reactor was cooled and depressurized. The
cellulose was then taken out of the reactor and screened. The final yield of the pulp was
42% and the kappa number before the bleaching step was equal to 20.
The bleaching method used was a modified version of the standard OD(EP)D sequence.
The first step was an acid treatment using 1 wt% sodium chlorite along with acetic acid
(0.33 mL acetic acid/g NaClO2). This treatment was performed at a solid consistency of
3% under effective mixing. A slow reaction was carried out at room temperature under
stirring for about 3-4 hours, after which, the liquid was drained and the pulp was
dewatered using a bladder press to obtain a dried pulp with 26% solid content.
In the second step, NaOH was added to water to obtain a pH solution of 11. During this
NaOH treatment, the temperature was kept above 50°C. Fluffed pulp was added under
stirring, and the reaction was carried out for an additional 2 hours. After the reaction, the
liquid was drained and the bleached pulp was washed multiple times with fresh water
until neutral pH was reached. The pulp was dewatered using a bladder press to obtain a
dried pulp with 26% solid content.
In the third and final step (D), chlorine dioxide bleaching was performed using heat-seal
plastic bags in a water bath. Chlorine dioxide was prepared through sulfuric acid
acidification of sodium chlorite and sodium hydroxide.
The final bleached pulp was characterized for physical properties, including solids
analysis, alpha cellulose content, pentosan content, ash content, acid insoluble lignin
content, viscosity, brightness and kappa number. The results are summarized in table S2.
section S4. Lignin recovery and precipitation experiments
Lignin solubility studies in GVL/water mixtures were performed in a flow-through
reactor. In a typical experiment, 8.5 g of dried white birch powder was placed inside of
an 1/2" stainless steel tubing. The biomass was heated to 130°C and a solution of
GVL/water and 0.15 M sulfuric acid was passed through the reactor at 0.13 ml/min and
1.4 MPa to saturate the liquid with lignin. To the first 5 g of liquid, collected at room
temperature, 45 g of water was added to precipitate the lignin. The precipitated lignin was
separated from the liquid by centrifugation, thoroughly washed with water to remove any
remaining impurities, and dried in a vacuum oven overnight at 40°C. Results are shown
in table S3. Up to 14.3 wt% lignin was soluble in a 60/40 GVL/water and 0.15M sulfuric
acid solution.

The lignin precipitation study was performed using a GVL/water hydrolysate solution
produced in a 20 L twin-digester reactor. 2855 g moist white birch (2000 g dry) and 9092
g of liquid (biomass loading 18.2 wt%) were loaded into the reactor. The liquid was
80/20 wt% GVL/water and 0.1 M sulfuric acid. The reaction time was 60 minutes at
130°C and 30-35 psi, during which the liquid was recirculated through the white birch
chips to achieve mixing. At the end of the reaction, the liquid was drained and was used
to precipitate the solubilized lignin. Table S4 shows that simple addition of water is
sufficient to cause the precipitation of the lignin when the water/GVL mass ratio is above
1.5. At this ratio, lignin precipitates in small particles, and only 50% of the lignin
solubilized in the liquid is recovered by centrifugation. Also, the lignin contains high
amounts of GVL, and is recovered as a black dense viscous paste that can cause fouling
problems. After washing and drying, the recovered lignin still had a dark brown color
(fig. S2). Increasing the water/GVL ratio over 3 improves the lignin recovered to 80%.
Further increasing the water/GVL ratio does not increase the percentage of lignin
recovered, but decreases the amount of GVL retained by the lignin. The lignin
precipitation can be accelerated if the pH of the solution is below 1.5.
section S5. Lignin recovery for carbon foam and battery anode production
The liquid collected from the large-scale fractionation experiment (see section 3 of
supplementary materials) was utilized to recover the solubilized lignin. To 100 g of GVL
solution, 450 g of water were added to induce the precipitation of lignin (ratio water/GVL
≈8). The lignin was separated from the liquid by centrifugation. The liquid phase,
containing soluble C5 carbohydrates, was collected for further experiments (furfural
production). The lignin was washed 4 times with hot water (2 times the amount of lignin)
to simulate a countercurrent washing and dried under vacuum at 40°C. The lignin was
recovered as a light brown fine powder (fig. S3).
section S6. Lignin characterization
Two samples of lignin were characterized. Both samples were produced from white birch
chips as described in section 5. The difference between the samples was the reaction
conditions used during the biomass fractionation. The first sample was produced by
fractionating white birch chips at 125°C for 3 hours using a 70/30 GVL/water and 0.1 M
sulfuric acid solution, and the second sample was produced at 130°C for 1 hour using a
80/20 GVL/water and 0.1 M sulfuric acid solution.
a. Chemical composition and molecular weight
The chemical composition of the lignin was analyzed following the NREL/TP-510-42618
protocol. The molecular weight was analyzed after an acetobromination derivatization
procedure was applied. Approximately 2.5 ml of a mixture composed of 8 parts of acetyl
bromide and 92 parts (v/v) of glacial acetic acid were added to approximately 10 mg of
lignin. The sample was sealed and placed in a sand bath at 50°C for 2 h with continuous
magnetic stirring. The solvent was evaporated in a rotary evaporator connected to a high
vacuum pump and a cold trap. The residue was then dissolved in 5 ml of tetrahydrofuran
(THF) and analyzed by a size exclusion chromatography (SEC) system (Tosoh ECO

SEC) equipped with a UV detector (265 nm). The analysis was performed with THF as
the eluent at a rate of 0.32 mL per min with a Tosoh TSK gel Super Multipore HZ-M
column preceded with a TSK gel Super Multipore HZ-M guard column and calibrated
against polystyrene standards. The carbon, hydrogen and nitrogen contents of the sample
produced at 70/30 GVL/water ratio were measured in triplicate using a PerkinElmer
2400II CHNS/O combustion elemental analyzer.
The results are summarized in the table S5. Both samples have similar lignin purity
(>96%) which is expected as both samples were produced from the same feedstock and
using a similar recovery method. The sample produced at 125°C for 3 hours has a slightly
lower molecular weight than the sample produced at 130°C for 1 hour indicating that
reaction temperature and time influenced the lignin depolymerization.
b. Thermal properties
The glass transition temperature (Tg) was determined using a PerkinElmer Diamond
differential scanning calorimeter. Experiments were conducted under nitrogen
atmosphere using approximately 2 mg of lignin samples in triplicates. The lignin was first
heated from 25 to 140°C at a heating rate of 100°C/min and held at that temperature until
the change in thermal energy from the sample was zero to expel any moisture and erase
thermal history of the sample. The sample was then cooled and reheated to 200°C at the
same heating rate to calculate Tg.
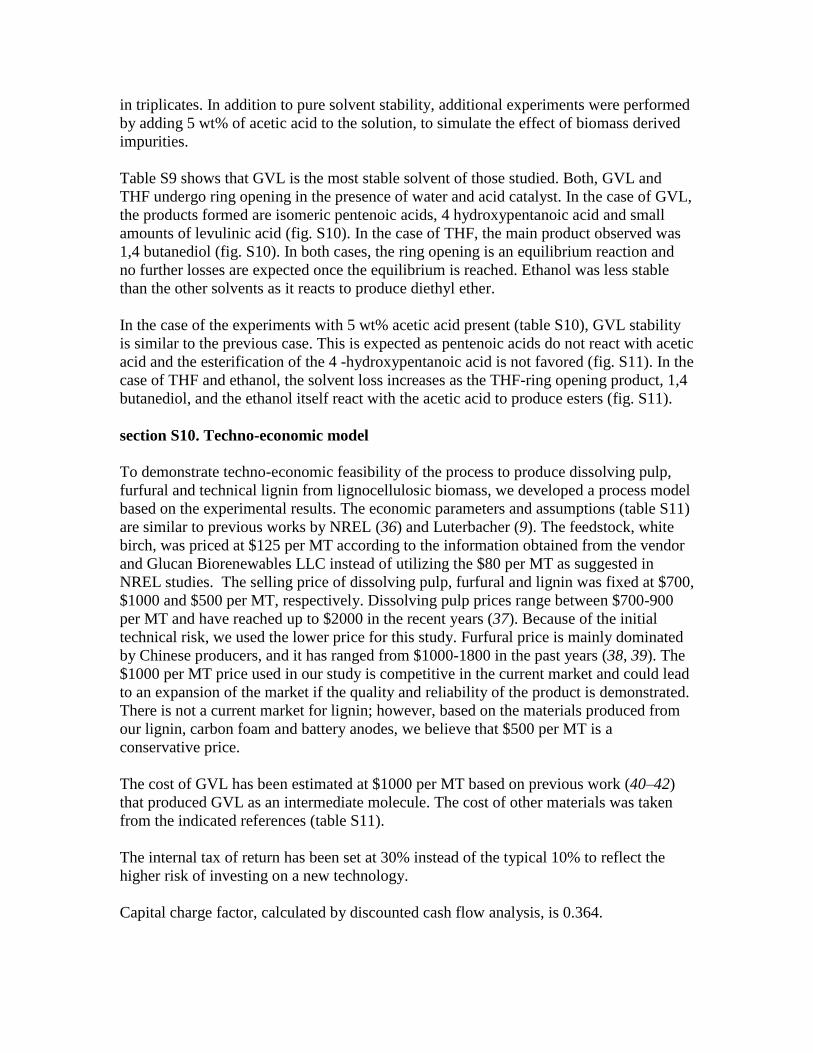
Thermal decomposition of lignin samples was measured using a PerkinElmer Pyris 1
thermogravimetric analyzer. Experiments were conducted in duplicate using
approximately 5 mg specimens, heated from 20 to 105°C under a nitrogen atmosphere at
a rate of 10°C/min, and held for 10 min to remove moisture. The sample was then heated
to 950°C at the same heating rate.
The thermal properties are presented in the table S6. Both samples have similar properties
which can be attributed to the low degradation suffered by the lignin during the
fractionation. The samples have a high glass transition temperature, which is beneficial
for further processing. Thermal decomposition experiments (fig. S4) show a high thermal
stability with a small weight loss (2%) before 200°C.
c. NMR analysis
Pre-fractionated white birch was prepared as a gel for 2D HSQC NMR analysis following
the method of originally described by Mansfield et al. (32). Briefly, white birch was
milled to 40 mesh and extracted following the NREL method (33). The extractives-free
white birch sample was then ball milled and transferred to a 5 mm NMR tube. Dimethyl
sulfoxide-d6/ pyridine-d5 (4:1) was then added to NMR tube. After sonicating at 40°C
for 5 hrs, a gel was formed of the white birch cell wall. Bruker AV-II spectrometer
operating at 600.13 MHz was used to analyze the gel white birch sample.

Liquid state NMR analyses were carried out on a Varian 400-MR spectrometer. For 2D
(HSQC) spectroscopy, 100 mg of lignin was dissolved in 0.75 mL d6-DMSO, and all
samples were fully soluble. The NMR spectra were recorded at 25°C using the
(HC)bsgHSQCAD pulse program. The experiment collecting 32 transients and 512 time
increments in the 13C dimension. DMSO was used as an internal reference. The analysis
of the data was performed using Mnova version 10.0.1. HSQC cross-signals were
assigned by correlation with literature databases. Semi-quantitative analysis of volume
integrals was performed and interunit linkages were calculated as percentage of total side
chains. In the aromatic region, the relative abundance of syringyl (S), α-oxidized syringyl
unit (Sox) and guaiacyl (G) units were estimated from their C−H correlations.
As shown in Fig. 5S (top), the β-O-4 linkage (designated A) was the major lignin side-
chain interunit linkage present in the white birch prior to fractionation. NMR of the white
birch produced less pronounced lignin signals than those of solution NMR (Fig. 5S
middle, bottom). After GVL fractionated process, a qualititative analysis shows that GVL
fractionated lignin retains the majority β-O-4 linkages present in white birch.
Quantification of hydroxyl groups in lignin was carried out with 31P NMR by initial
derivatization with 100 µL of 2-chloro-4,4,5,5-tetramethyl-1,3,2-dioxaphospholane
(TMDP). The derivatized samples (30 mg) were dissolved in 0.75 mL of pyridine and
deuterated chloroform (1.6:1 v/v) and mixed with 100 μL of a solution of N-Hydroxy-5-
norbornene-2,3-dicarboxylic acid imide (10 mg/mL) and chromium(III) acetylacetonate
(5 mg/mL) as internal standard and relaxation agent, respectively. 31P NMR spectra were
acquired using an inverse-gated decoupling pulse sequence with a 90° pulse angle, 25 s
relaxation delay and 256 scans.
Table S7 summarizes the NMR analysis of the lignin samples. In both cases, the isolated
lignin retained most of the β-O-4' bonds present in the native lignin, indicating a low
level of degradation. The NMR spectra are included in fig. S5.
Table S8 summarizes the hydroxyl group content of lignin sample (70/30 GVL/Water
125°C 3h 0.1 M SA) obtained by quantitative 31P NMR spectroscopy (mmol/g).
section S7. Carbon foam production
Carbon foam and nano-graphitic carbon-carbon composites were produced from the
lignin produced in section 5 and characterized in section 6 and denoted as GVL-lignin.
The dry GVL-lignin powder was exposed through a series of heat and processing
treatments for making a highly graphitic structure. The heating steps included a combined
thermal stabilization/pyrolysis step followed by passivation. A tube furnace (Thermo
Scientific Lindberg Blue M model) setup with inert gas conditions contained the lignin
powder in a ceramic crucible. During carbonization, lignin undergoes an irreversible
phase change and produces a rich carbon content material. The thermal stabilization step
increases oxygen (O) and carbon contents while decreases hydrogen (H2). Carbon content

continues to increase throughout the pyrolysis treatment. Finally, passivation stabilizes
the material with the introduction of hydrogen and removal of oxygen.
First, GVL-lignin powder was exposed to nitrogen (N2) with water vapor (H2O), in a tube
furnace for thermal stabilization and pyrolysis. The inert gas, N2, passed through a
bubbler at room temperature and fed into the furnace at a volumetric flow rate of 3 L min-
1. During the thermal stabilization and pyrolysis step, the furnace was heated from 30 to
1000°C at a rate of 10°C min-1 and then held at 1000°C for one hour producing a carbon
foam. Thermochemical decomposition of the organic material started at approximately
200°C. The effluent gases, which include steam, nitric oxide (NO), carbon monoxide
(CO), carbon dioxide (CO2) and sulfur oxides (SOx), were released from the system and
trapped for odor control. To increase surface area and improve resulting structure, the
foam was broken up into smaller pieces in two steps. First, the carbon foam was
grounded into a micro powder with a blender for five minutes. Second, the carbon
material was milled with a planetary ball mill (PM100 RETSCH model), resulting in
particle sizes in the nanometer range. The ball-milling process used a stainless-steel
grinding container with a mixture of 2 and 10 mm diameter stainless steel balls. One-
third of the container was filled with sample and grounded at 350 revolutions per minute
(rpm) for three hours, composed of alternating 15 minute periods of ball milling and
holds at ambient temperature for cooling. After ball milling, the material was sieved to
separate the grinding balls from carbon material. The furnace is setup with an argon-
hydrogen (Ar-H2) gas mixture (3 L min-1) for the passivation step. Passivation is
conducted by heating at 10°C min-1 to a temperature of 1050°C with a one hour hold
prior to cooling.
To identify the degree of crystallinity in the processed lignin carbon, x-ray diffraction
(XRD) scans were performed at room temperature using a PANalytical Empyrean
diffractometer. XRD scans with Cu-kα (λ = 0.154 nm) ranged from 5 to 115 two theta
degrees with a continuous step size of 0.013 at 45 kV and 40 mA. Using Highscore Plus
software (34), the scanned data was refined based on peak fitting to obtain the full-width
at half-maximum and the interlayer spacing (or d-spacing). The crystal size was
determined using the Debye-Scherrer equation (35). Crystallographic planes (hkl) were
indexed for a graphite standard pattern based on carbon graphite with a hexagonal
structure, i.e., a non-cubic system. Thermal treatments show the evolution of lignin to
form graphene sheets at 1000°C to graphitic content after passivation (fig. S6).
Figure S7 shows light microscopy and SEM images of the carbon foam produced from
lignin. The fractionation conditions were 80/20 GVL/water; 130 °C; 1 h; 0.1 M sulfuric
acid.
section S8. Furfural production
Initial experiments to study the production of furfural in GVL/water solution were
performed in 10 mL high pressure glass reactors (Alltech). The reactors were loaded with
a solution of 80/20 GVL/water, commercial xylose and the catalyst. The reactors were

mixed with a magnetic bar and heated to the reaction temperature in an oil bath. After the
indicated time, the reactor was taken out of the oil bath and cooled to room temperature
in a water bath. The liquid was analyzed by HPLC (Waters 2695 system with a Bio-Rad
Aminex HPX-87H column, RI 410 detector (carbohydrates, organic acids, GVL) and a
UV detector (furfural and HMF).
Figure S8 shows that the maximum furfural yield achieved using sulfuric acid as catalyst
at 170°C is 65%. The furfural yield can be increased to 80% if HCl is used as catalyst or
KCl is added to the system. In addition, the reaction time to obtain the maximum yield is
reduced from 30 min to 15 min when Cl- ions are introduced in the system, indicating
that the presence of Cl- ions not only increases the selectivity but also increases the
reaction rate.
The continuous production of furfural was studied in an up-flow reactor. A 0.635 cm
tubular stainless steel reactor was completely filled with fused SiO2 to fill the reactor
volume and improve heat and mass transfer. The reactor was mounted inside an
aluminum block heated by a heating tape. The reaction temperature was monitored at the
reactor wall by a Type K thermocouple (Omega) mounted within the aluminum block
and controlled by a Series 4B temperature controller (Love Controls). The pressure was
kept at 2.07 MPa to prevent water vaporization. The liquid feed was introduced in the
reactor using an HPLC pump (Lab Alliance Series I). The effluent was analyzed by
HPLC (Waters 2695 system with a Bio-Rad Aminex HPX-87H column, RI 410 detector
(carbohydrates, organic acids, GVL) and a UV detector (furfural and HMF).
Using a continuous reactor operating at 225°C, furfural yields over 80% can be achieved
with 0.05 M sulfuric acid as catalyst (feed is 2 wt% xylose in a GVL/water 80/20
solution). If the catalyst is replaced by HCl, yields over 95% can be achieved with a
similar feedtstock, indicating that the presence of Cl- ions reduces the degradation of the
furfural. If the xylose concentration is increased to 10 wt% the furfural yield decreases
slightly (fig. S9).
The liquid solution recovered after the lignin precipitation (see section 6) was
concentrated by evaporating the water to a ratio GVL/water of 80/20. This liquid contains
soluble C5 carbohydrates that were converted to furfural at 90% yield (225°C for 1 min).
The catalyst was the residual sulfuric acid from the fractionation step.
section S9. Solvent stability study
Experiments to study the solvent stability during the fractionation step were performed in
10 mL high pressure glass reactors (Alltech) placed in an oil bath. Three solvents were
used for the study: gamma-valerolactone (GVL), tetrahydrofuran (THF), and ethanol
(EtOH). Glycerol was initially considered for the study; however, it degraded
significantly, producing large quantities of black carbon deposit and no further studies
were performed. All the solvents were analytical grade from Sigma-Aldrich and were
used without further purification. The conditions used for the study were: solvent/water
(w/w) 80/20, 0.1 M sulfuric acid, 130°C and 12 hours. The experiments were performed
in triplicates. In addition to pure solvent stability, additional experiments were performed
by adding 5 wt% of acetic acid to the solution, to simulate the effect of biomass derived
impurities.
Table S9 shows that GVL is the most stable solvent of those studied. Both, GVL and
THF undergo ring opening in the presence of water and acid catalyst. In the case of GVL,
the products formed are isomeric pentenoic acids, 4 hydroxypentanoic acid and small
amounts of levulinic acid (fig. S10). In the case of THF, the main product observed was
1,4 butanediol (fig. S10). In both cases, the ring opening is an equilibrium reaction and
no further losses are expected once the equilibrium is reached. Ethanol was less stable
than the other solvents as it reacts to produce diethyl ether.
In the case of the experiments with 5 wt% acetic acid present (table S10), GVL stability
is similar to the previous case. This is expected as pentenoic acids do not react with acetic
acid and the esterification of the 4 -hydroxypentanoic acid is not favored (fig. S11). In the
case of THF and ethanol, the solvent loss increases as the THF-ring opening product, 1,4
butanediol, and the ethanol itself react with the acetic acid to produce esters (fig. S11).
section S10. Techno-economic model
To demonstrate techno-economic feasibility of the process to produce dissolving pulp,
furfural and technical lignin from lignocellulosic biomass, we developed a process model
based on the experimental results. The economic parameters and assumptions (table S11)
are similar to previous works by NREL (36) and Luterbacher (9). The feedstock, white
birch, was priced at $125 per MT according to the information obtained from the vendor
and Glucan Biorenewables LLC instead of utilizing the $80 per MT as suggested in
NREL studies. The selling price of dissolving pulp, furfural and lignin was fixed at $700,
$1000 and $500 per MT, respectively. Dissolving pulp prices range between $700-900
per MT and have reached up to $2000 in the recent years (37). Because of the initial
technical risk, we used the lower price for this study. Furfural price is mainly dominated
by Chinese producers, and it has ranged from $1000-1800 in the past years (38, 39). The
$1000 per MT price used in our study is competitive in the current market and could lead
to an expansion of the market if the quality and reliability of the product is demonstrated.
There is not a current market for lignin; however, based on the materials produced from
our lignin, carbon foam and battery anodes, we believe that $500 per MT is a
conservative price.
The cost of GVL has been estimated at $1000 per MT based on previous work (40–42)
that produced GVL as an intermediate molecule. The cost of other materials was taken
from the indicated references (table S11).
The internal tax of return has been set at 30% instead of the typical 10% to reflect the
higher risk of investing on a new technology.
Capital charge factor, calculated by discounted cash flow analysis, is 0.364.

Our techno-economic analysis follows three steps. The first step is the design of the
process that has been divided in 5 sections as shown in Fig. 2: 1) biomass fractionation,
2) lignin recovery, 3) furfural production, 4) pulp cleaning and bleaching and 5) heat and
power generation. The process models of these sections were developed using ASPEN
Plus Process Simulator (V7.3 Aspen Technology) based on the experimental data. The
storage, utilities and wastewater treatment, were scaled based on the NREL model (30).
The mass and energy balances for the main streams are presented in table S12.
The second step is the heat integration to optimize energy use using Aspen Energy
Analyzer (V7.3 Aspen Technology). Our process has heating requirements (536.1 MW)
mainly due to the evaporation of water after the lignin precipitation and the evaporation
of GVL during the GVL-recovery step. After heat integration, we obtained significant
energy recovery, thereby reducing the heating requirements of the process to 40.5 MW
(table S13). The remaining heating requirements are satisfied by the heat generated from
the combustion of the biomass residues (lignin and humins) along with natural gas. In
addition to thermal fluid heating, hot combustion gases are also used to produce
superheated steam for power generation, which meets electricity requirements of the
process (14.6 MW). The cooling requirements of the process are estimated to be 81.4
MW after the heat integration. The remaining cooling requirements are satisfied by using
cooling water.
The third step we performed was the equipment sizing and cost analysis using Aspen
Process Economic Analyzer (V7.3 Aspen Technology) based on the simulation results.
The capital and operating costs of the wastewater treatment, storage, and utilities sections
were scaled based on the NREL model (30). Table S14 shows the capital costs and
operating costs for all processing sections. Total project investment is estimated to be
$539.4 million. The total operating costs is $130.2 million.

fig. S1. Fractionation of white birch. 20 wt% biomass loading, 125°C, 3h 70/30
GVL/water by weight, 0.1 M sulfuric acid. The soluble products were analyzed after
treating the sample at 120°C for 1 h in 4.4 wt% aqueous sulfuric acid as indicated by
NREL (NREL/TP-510-42618). XMGA stands for the combination of xylose, mannose,
galactose, and arabinose monomers; LA for levulinic acid and HMF for 5-
hydroxymethylfurfural.
fig. S2. Lignin produced from white birch fractionation. 20 wt% biomass loading,
125°C, 3 h, 70/30 GVL/water by weight, 0.1 M sulfuric acid. The lignin was precipitated
by adding water at a water/GVL ratio = 3 and separated by centrifugation.
Fresh GVL/water Reutilization 1 Reutilization 4 0
10
20
30
40
50
60
70
80
90
100
Yie
ld (
%)
XMGA Furfural Glucose LA+HMF
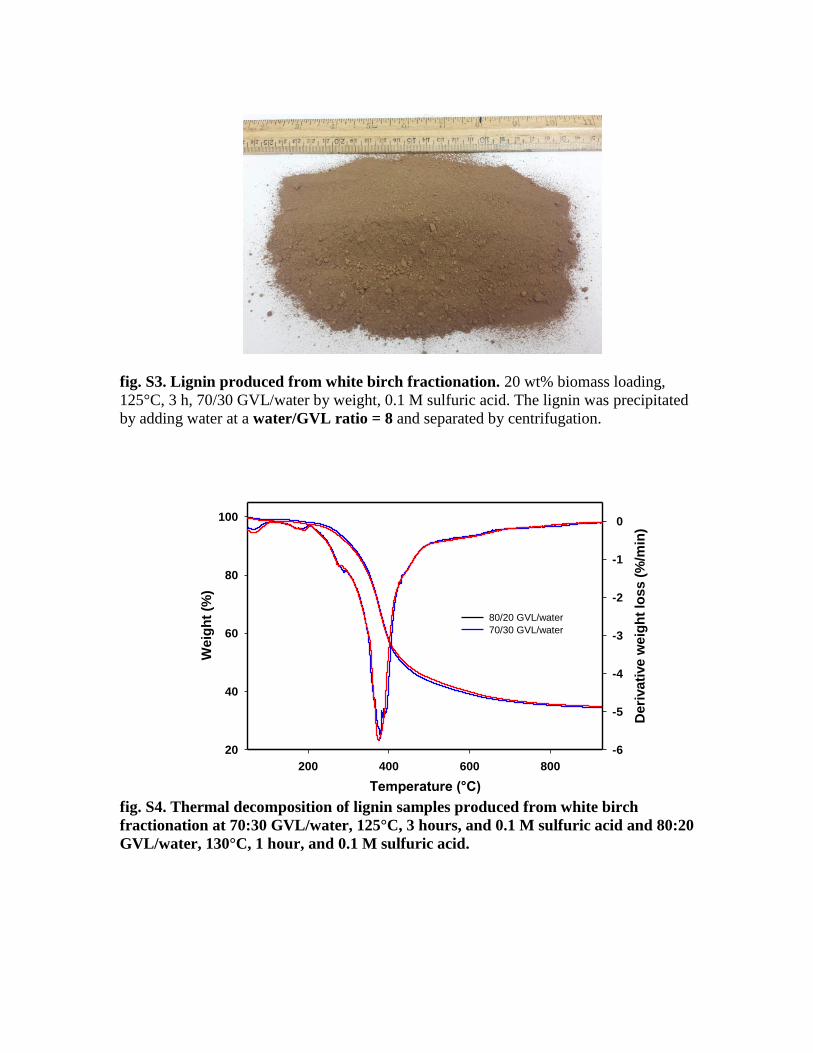
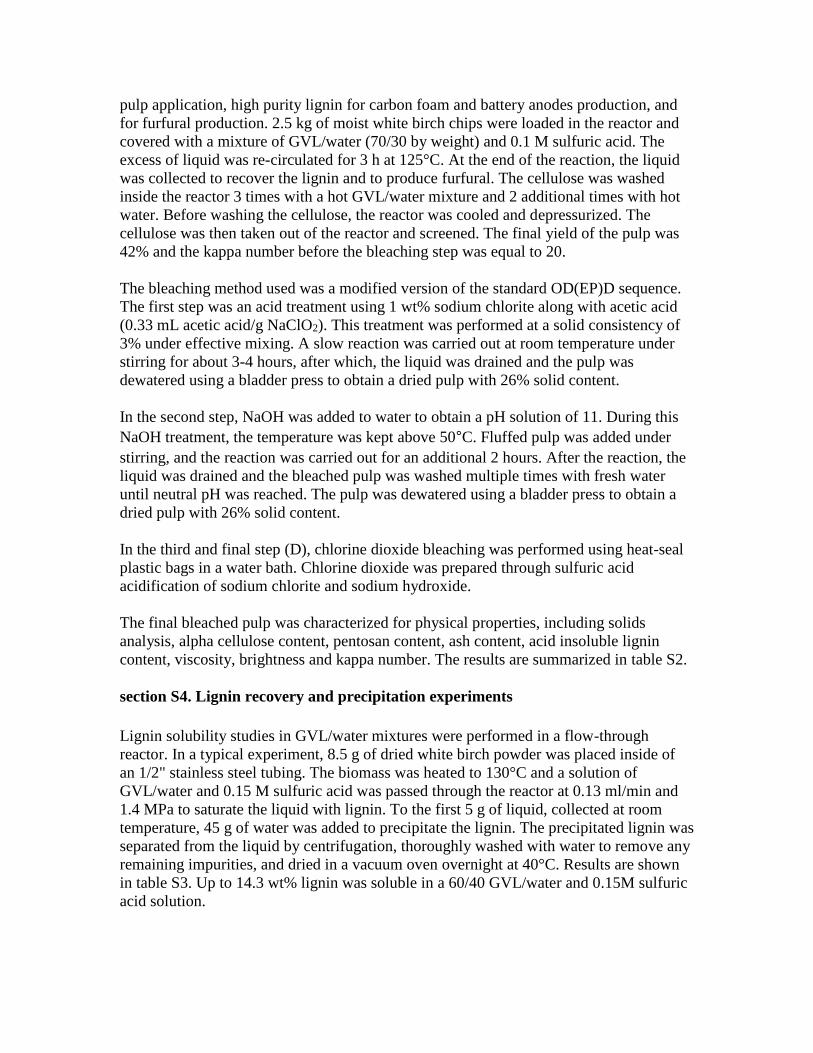
fig. S3. Lignin produced from white birch fractionation. 20 wt% biomass loading,
125°C, 3 h, 70/30 GVL/water by weight, 0.1 M sulfuric acid. The lignin was precipitated
by adding water at a water/GVL ratio = 8 and separated by centrifugation.
fig. S4. Thermal decomposition of lignin samples produced from white birch
fractionation at 70:30 GVL/water, 125°C, 3 hours, and 0.1 M sulfuric acid and 80:20
GVL/water, 130°C, 1 hour, and 0.1 M sulfuric acid.
Temperature (°C)
200 400 600 800
Weig
ht
(%)
20
40
60
80
100
Deri
vati
ve w
eig
ht
loss (
%/m
in)
-6
-5
-4
-3
-2
-1
0
80/20 GVL/water
70/30 GVL/water

fig. S5. Aromatic (left) and side chain (right) region of the 13C-1H (HSQC) spectra of white
birch, lignin samples produced from white birch fractionated at 70:30 GVL/water, 125°C,
3 hours, and 0.1 M sulfuric acid and 80:20 GVL/water, 130°C, 1 hour, and 0.1 M sulfuric
acid. (A) β–O–4ʹ aryl ether linkages; (B) phenylcoumaran; (C) resinol; (D) spirodienone; (E)
dibenzodioxocine; (OMe) methoxyl groups; (S) syringyl; (G) guaiacyl; (Sox) α-oxidized syringyl;
(Gox) α-oxidized guaiacyl; (H) p-hydroxyphenyl.
OMe
Aα
Cα Polysaccharides
Polysaccharide
anomeric region
S2,6
S
(ox)2,6
G2
G5
G6
Aγ
Pyridine
Pyridine Whole biomass
S
2,6
S(ox)2,6
G2
G5
G6
G(ox)2
H2,6
OMe
Aγ
Cγ C
γ
Aα
Aβ
Dα E
α (?)
Bα C
α
S2,6
S2,6
S(ox)2,6
S(ox)2,6
G(ox)2
G(ox)2
G2
G2 G
5
G5
G6
G6
H2,6
OMe
OMe
Aγ
Aγ
Cγ C
γ
Cγ C
γ
Aα
Aα
Aβ
Aβ
Cα
Cα
Dα
Dα
Bα
Bα
80/20 GVL/Water (GB_WB_Cent._L1)
70/30 GVL/Water
80/20 GVL/Water (second batch)
H2,6

fig. S6. X-ray diffraction patterns of carbonized and passivated GVL lignin
compared to the original lignin (top). Thermal treatments show the evolution of lignin
to form graphene sheets at 1000°C to graphitic content after passivation. The original
lignin was produced from white birch fractionation at 70/30 GVL/Water, 125°C, 3 h, 0.1
M sulfuric acid.

fig. S7. Carbon foam produced from lignin (initial white birch fractionation
conditions: 80:20 GVL/water, 130°C, 1 hour, and 0.1 M sulfuric acid).

fig. S8. Production of furfural in a batch reactor using 10 wt % xylose as feedstock.
Reaction temperature: 170°C. (■) 0.05 M HCl, (▲) 0.05 M H2SO4, (●) 0.05 M H2SO4 +
0.25 M KCl.
fig. S9. Production of furfural in a continuous flow reactor using xylose as feedstock.
Reaction temperature: 225°C. (■) 0.05 M HCl, 2 wt% xylose; (●) 0.05 M H2SO4, 2 wt%
xylose; (▲) 0.05 M H2SO4, 10 wt% xylose.
0 5 10 15 20 25 30 35 40 45 50 55 60 650
10
20
30
40
50
60
70
80
90
100
0.05 M HCl 0.05 M SA 0.05 M SA + 0.25 M KCl
Furf
ura
l yie
ld (
%)
Reaction time (min)
0 20 40 60 80 100 120 1400
10
20
30
40
50
60
70
80
90
100
Furf
ura
l yie
ld (
mo
lar
%)
Reaction time (seconds)

fig. S10. Gas chromatography–mass spectrometry (GC-MS) chromatogram of GVL
(top), tetrahydrofuran (THF) (middle), and ethanol (bottom) after 12 hours at
130°C

fig. S11. GC-MS chromatogram of GVL (top), THF (middle), and ethanol (bottom)
after 12 hours at 130°C. Solvent/water mass ratio 80/20. Catalyst: 0.1 M sulfuric acid.
Acetic acid concentration 5 wt%.

table S1. White birch fractionation optimization. Effect of process conditions on solid
yield, purity and degree of polymerization.
Entry T
(°C)
GVL/
Water
ratio
Reaction
time
(h)
Liquid/
Solid
ratio
Yield
(wt%)
Hexosan
(wt%)
Pentosan
(wt%)
Kappa #/
Lignin+ash
(wt%)
Degree of
polymerization
1* 125 70/30 2 4 46.3 88.1 6.8 26.4/4.8 421
2* 125 70/30 3 4 44.1 90.6 4.8 17.5/2.5 1178
3* 125 80/20 2 4 44.3 20.9 540
4* 125 80/20 3 4 42.8 89.8 5.6 20.4/3.1 763
5† 125 80/20 3 4 35.3 33.5 1354
6† 125 80/20 3 4 33.5 43.8 1343
7* 125 90/10 3 4 41.8 25.3 642
8* 125 95/5 3 4 37.8 38.5 294
9* 130 80/20 2 4 41.7 88.3 4.6 11.3/1.7 447
10* 130 80/20 3 4 41.9 14.8 562
11* 140 80/20 2 4 35.7 94.5 1.3 19.1/2.9 139
12* 150 80/20 2 4 30.4 93.6 0.7 23.3/3.5 <100
13† 125 70/30 3 6 37.6 26.2 1152
14† 125 80/20 3 6 40.9 47.4 1732
* chipped, † wood chips. Initial composition of white birch (dry weight): hexosan = 43.5 wt%, pentosan =
23.9 wt%, lignin+ash = 22.0 wt%
table S2. Properties of bleached high-purity cellulose sample from white birch wood
chips to produce dissolving pulp.
Pulp Property
Alpha Cellulose
(Tappi 203) 91.2%
Hemicellulose
(Tappi 203) 3.9%
Pentosans
(NREL/TP-510-
42618)
3.1%
Acid Insoluble n/d or zero
Ash n/d or zero
Viscosity
(Tappi T230) 15.08 ± 0.08 cps
Brightness
(%ISO) 90
Kappa number n/d or zero
n/d = not detected

table S3. Lignin solubility in GVL/water mixtures at room temperature.
GVL/water ratio
(0.15 M sulfuric acid) Lignin solubility (wt%)
80/20 9.8
60/40 14.3
table S4. Effect of water/GVL ratio on lignin precipitation.
Water/GVL mass ratio Amount of soluble lignin
precipitated (wt%)
GVL retained in the
lignin (wt%)
0.5 No precipitation
1 No precipitation
1.5 50 20
3 79 20
6 82 15
8 80 12
14 80 8

table S5. Chemical composition and molecular weight of lignin samples.
Fractionation conditions 70/30 GVL/Water,
125°C, 3h, 0.1 M SA
80/20 GVL/water,
130°C, 1h, 0.1 M SA
Lignin purity (wt%) 96.6 96.2
Acid soluble lignin (wt%) 1.3 1.5
Acid insoluble lignin
(wt%) 95.3 94.7
Cellulose (wt%) < 0.05 0.7
Hemicellulose (wt%) 0.5 0.4
Ash (wt%) 0.2 0.01
GVL (wt%) 0.9 0.3
Mn (g/mol) 1144 970
Mw (g/mol) 7212 8431
PDI 6.3 8.7
Carbon (%) 64.1 −
Hydrogen (%) 6.16 −
Nitrogen (%) 0.18 −
table S6. Thermal properties of lignin samples.
Fractionation
conditions
70/30 GVL/Water, 125°C,
3h, 0.1 M SA
80/20 GVL/water, 130°C,
1h, 0.1 M SA
Tg (°C) 148 144
Delta Cp (J/g °C) 0.43 0.32
DTG peak temperature
(°C) 377 375
DTG Peak value
(%/min) −5.54 −5.77
Mass at 200°C (%) 98.1 97.5
Temperature at 5%
mass loss (°C) 270 261
Temperature at 10%
mass loss (°C) 308 304
Char (%) 34.5 34.9

table S7. Summary of NMR analysis of lignin samples.
S/G Sox/S
Lignin interunit linkages* (%)
A (β-O-4') B (β-5') C (β-β') D (β-1')
70/30 GVL/Water, 125°C,
3 h, 0.1 M SA 6.24 0.08 47.6 8.10 36.6 7.65
80/20 GVL/Water, 130°C,
1 h, 0.1 M SA 5.20 0.13 47.6 8.35 34.8 9.29
* Percentage of total interunit linkages involved.
table S8. Hydroxyl group content of lignin sample (70:30 GVL/water, 125°C, 3
hours, and 0.1 M sulfuric acid) obtained by quantitative 31P NMR spectroscopy
(mmol/g).
Carboxylic
acid OH
(COOH)
Phenolic OH Total
phenolic
OH
Aliphatic
OH p-
Hydroxyphenyl
C5
Substituted Guaiacyl Syringyl
0.14 0.02 0.30 0.44 1.85 2.61 2.48
table S9. Liquid composition after 12 hours at 130°C. Solvent/water mass ratio 80/20.
Catalyst 0.1 M sulfuric acid.
GVL THF Ethanol
Solvent 99.40 ± 0.08 % 97.98 ± 1.15% 95.12 ± 1.00%
Pentenoic acid 0.03 ± 0.0077%
4-Hydroxy pentanoic acid
+ Levulinic acid 0.27 ±0.013 %
Butanediol
1.49 ± 0.07%
Other products 0.31 ± 0.26% 0.53 ± 1.08% 4.88 ± 1.00%

table S10. Liquid composition after 12 hours at 130°C. Solvent/water mass ratio
80/20. Catalyst: 0.1 M sulfuric acid, 5 wt% acetic acid.
5% Acetic Acid GVL THF Ethanol
Solvent 99.16 ± 0.51% 91.40 ± 0.56% 93.18 ± 0.43%
Pentenoic acid 0.04 ± 0.0140%
4-Hydroxy pentanoic acid
+ levulinic acid 0.35 ± 0.019%
Butanediol
1.48 ± 0.08%
Other products 0.46 ± 0.48%
Esters + Others
7.12 ± 0.49%
Ethyl Acetate
10.34 ± 1.80%
table S11. List of economic parameters and assumptions.
White birch price ($ per ton)* 125.0
Sulfuric acid ($ per ton) (30) 22.6
Gamma-valerolactone price ($ per ton)* 1000.0
Sodium Chloride price ($ per ton) (43) 182.0
Disposal of ash cost ($ per ton) (30) 35.4
Boiler chemicals ($ per ton) (30) 1260.4
Flue gas desulfurization lime ($ per ton) (30) 50.3
Wastewater treatment nutrients ($ per ton) (9) 7953.4
Dissolving pulp price ($ per ton)* 700.0
Lignin price ($ per ton)* 500.0
Furfural price ($ per ton)* 1000.0
Natural gas price ($ per ton) (36) 239.0
Cooling tower chemicals ($ per ton) (30) 755.4
Internal rate of return (%)* 30.0
Tax rate (%)(30) 35.0
Depreciation period (years) (30) 7.0
Assumptions:
Capital investment is spread over 3 years at a rate of 8%,
60%, and 32% in the first, second, and third years,
respectively.
Working capital is 5% of fixed capital investment.
Capital charge factor, calculated by discounted cash flow
analysis, is 0.364.
* Value provided by Glucan Biorenewables LLC

table S12. Mass and energy balances (basis: 2000 tons of white birch per day).
Major Process Step Stream
Number
Mass Flow
(ton/h)
Pressure
(atm)
Temp.
(°C)
Energy
Requirement
(MW)
Biomass
fractionation 1 292.4 3.4 125.0
Electricity:
0.02
2 292.4 3.4 125.0
3 92.7 3.4 144.8
4 54.1 1.0 153.6
22 2.0 1.0 25.0
23 163.5 3.4 125.0
Lignin separation 8 199.0 3.4 125.0
Cooling: 34.9
Electricity:
14.5
9 17.0 4.5 149.8
10 13.0 3.4 140.7
11 1009.8 4.5 149.8
13 843.6 3.4 138.8
Furfural production 12 166.2 4.5 149.8 Heating: 40.5
Cooling: 46.4
Electricity: 0.1
16 166.8 20.4 225.0
18 11.5 1.2 167.7
20 107.4 1.0 210.1
Pulp
cleaning/bleaching 7 33.5 1.0 194.7
Heat and power
gen. 19 10.5 1.0 208.0
21 9.3 1.0 194.7
table S13. Energy requirements before and after heat integration (basis: 2000 tons
of white birch per day).
Energy required (MW) Before After
Heating 536.1 40.5
Cooling 576.9 81.4

table S14. Capital and operating costs (basis: 2000 tons of white birch per day).
Process step Capital cost (MM$) Operating cost
(MM$/yr)
Biomass Fractionation *, † 163.0 98.1
Furfural Production *, † 28.6 2.4
Lignin Separation *, † 155.7 0.4
Pulp Cleaning/Bleaching ‡ 39.0 9.4
Wastewater Treatment * 34.2 0.7
Storage * 14.2 0.0
Heat and Power Generation * 95.9 4.3
Utilities * 8.9 0.0
Fixed cost * 14.9
Total installed equipment
cost 284.4
Total capital investment 539.4
Total operating cost 130.2
Operating cost of each process step includes raw material cost (e.g., sulfuric acid,
natural gas), cooling utility cost (i.e., cooling water), waste disposal cost (e.g., ash
disposal), and fixed cost (e.g., salaries, property insurance).
*Estimated based on value reported in Davis et al. (30)
† Determined using Aspen Process Economic Analyzer (V8.8 Aspen
Technology).
‡ Estimated based on value obtained from Troy Runge (2016).

table S15. Process model development details.
Process step Equipment Design basis
Biomass
Fractionation
Biomass
Fractionation
Reactor
Experimental Results (Section 1 in SM). 20 wt% biomass
loading, 70/30 GVL/water 0.1 M SA. 3h at 125°C.
Biomass composition: C6 carbohydrate (45 wt%), C5
carbohydrate (25.3 wt%), lignin (21.7%) and others (8
wt%). Fractionation results using recycled GVL (see
Section 2 in SM): C6 carbohydrate yield (5.8%), C5
carbohydrate yield (80.1%), furfural yield (10.8%),
levulinic acid yield (0.8%), HMF yield (0.2%). Acetic
acid yield: 6.08 kg /100 kg of biomass. Formic acid
yield: 1.9 kg/ 100 kg of biomass. Model assumes 30 wt%
biomass loading.
Liquid/Solid
Separator
Washing based on experimental Results (Section 2 in
SM). Solid cake assumes: 40% solids/60% moisture.
Overall product recovery in this step is 95%
Furfural
Production
Furfural Reactor Experimental Results (Section 8 in SM). Furfural yield:
90%. Obtained at 225°C, 30 second residence time using
C5 sugars obtained from the biomass fractionation after
precipitating the lignin and concentrating the solution.
Furfural yield without removing the lignin was 86%.
Furfural
Distillation
The technoeconomic analysis has used Aspen Plus
database to design the distillation. We have distilled
furfural in the lab to >99% purity.
GVL Recovery Aspen Plus database (99% GVL recovery based on
simulated distillation). Lab experiments indicate GVL
stability >99.5%).
Lignin
Recovery
Lignin
Precipitation
Experimental Results (Section 4 in SM). 8 kg-of-
water/kg-of-GVL. 80% of lignin precipitated.
Concentrator Aspen Plus database.
Lignin Washing Experimental Results (Section 5 in SM). The lignin
contains 11 wt% GVL before washing and 0.8 wt% after
the washing step. 2 kg of water per kg of lignin were
used to wash the lignin.
Pulp
Cleaning
/Bleaching
Cellulose
Washing
Experimental Results (Section 2-3 in SM). After
evaporating the GVL, the cellulose contains 3wt% GVL.
Pulp Bleaching Experimental Results (Section 3 in SM).


![3M oardmont ocetmultimedia.3m.com/mws/media/22500O/3mtm-boardmount-skt-100-100x-100... · 3M ™ oardmont ocet ... .100 ± .003 [ 2.54 ].100 [ 2.54 ] (A) C. Important Notice All statements,](https://img.dokumen.tips/doc/110x75/5e8784461cf08e44ce1d0c3e/3m-oardmont-ocetmultimedia3mcommwsmedia22500o3mtm-boardmount-skt-100-100x-100.jpg)