Embed Size (px)
Citation preview
www.sciencemag.org/content/351/6268/74/suppl/DC1
Supplementary Materials for
Self-photosensitization of nonphotosynthetic bacteria for solar-to-chemical production
Kelsey K. Sakimoto, Andrew Barnabas Wong, Peidong Yang*
*Corresponding author. E-mail: [email protected] Published 1 January 2016, Science 351, 74 (2016)
DOI: 10.1126/science.aad3317
This PDF file includes:
Materials and Methods Supplementary Text Figs. S1 to S9

2
Materials and Methods
Growth of Moorella thermoacetica/Cadmium Sulfide: Anaerobic media was prepared with three formulations in deionized (DI) water:
undefined precipitation medium (UPM), defined photosynthesis medium (DPM) and undefined solid media (USM) as given below:
Component UPM (g L-1) DPM (g L-1) USM (g L-1) Salt Mix: NaCl 0.40 0.40 0.40 NH4Cl 0.40 0.40 0.40 MgSO4·7H2O 0.33 0.33 0.33 CaCl 0.05 0.05 0.05 KCl 0.25 0.25 0.25 Phosphorus Source: K2HPO4 -- 0.64 0.64 β-glycerophosphate·2Na·xH2O 0.80 -- -- Buffer: NaHCO3 2.50 2.50 2.50 Supplemental Components: Wolfe’s Vitamin Mix* 10 mL 10 mL 10 mL Trace Mineral Mix** 10 mL 10 mL 10 mL Yeast Extract 0.50 -- 2.00 Tryptone 0.50 -- 2.00 Agar -- -- 20.00
*From filter sterilized stock solution containing (mg L-1 DI):
Pyridoxine·HCl 10.0 Thiamine·HCl 5.0 Riboflavin 5.0 Nicotinic acid 5.0 Calcium D-(+)-pantothenate 5.0 Thioctic acid 5.0 Biotin 2.0 Folic acid 2.0 Vitamin B12 0.1
**From filter sterilized stock solution containing (mg L-1 DI): Nitriloacetic acid 2000.0 MnSO4·H2O 1000.0 Fe(SO4)2(NH4)2·6H2O 800.0 CoCl2·6H2O 200.0 ZnSO4·7H2O 0.2 CuCl2·2H2O 20.0 NiCl2·6H2O 20.0 Na2MoO4·2H2O 20.0 Na2SeO4 20.0 Na2WO4 20.0

3
Yeast extract, tryptone, and agar were obtained from BD Biosciences, all other reagents were obtained through Sigma-Aldrich.
All gases were passed through two in-line oxygen traps (Agilent Technologies) to
render anoxic prior to use. Media (UPM, DPM, USM) were prepared by boiling an appropriate volume (100-
500 mL) of DI water, salt mix, and trace mineral mix for 5 min under a continuously purged N2 atmosphere. An additional 10 vol.% of DI was added to account for evaporation losses during boiling. The solution was then cooled to room temperature in an ice bath, and the atmosphere was switched to an 80:20 mixture of N2:CO2. The phosphorus source, buffer, and supplemental components were then added, and the media was allowed to purge and equilibrate at room temperature for 20 min. No adjustment of pH was necessary. Anaerobic media was then dispensed under the same atmosphere into 18 x 150 mm Balch-type anaerobic culture tubes (Chemglass Life Sciences) with butyl stoppers and aluminum crimp seals. Media was then autoclaved for 15 min at 121°C.
Stock solutions of 1 M glucose as a carbon source, 5.0 wt.% Cys·HCl as a reducing
agent and sulfur source, and 100 mM Cd(NO3)2 as a cadmium source were prepared by boiling DI water for 5 min under N2, cooling to room temperature, dissolving the respective solutes, and sealing under N2 in 200 mL serum bottles with butyl stoppers and aluminum crimp seals. Stock solutions of glucose and Cys were autoclaved for 15 min at 121°C prior to use. All concentrations of glucose, Cys, and cadmium are given nominally, calculated from the initial volume of the media.
The Hungate technique or an anaerobic chamber (Coy Laboratory Products, Inc.)
was employed in all operations to prevent exposure of the anaerobic bacteria to oxygen. The initial inoculum of Moorella thermoacetica ATCC 39073 was graciously
obtained from the laboratory of Prof. Michelle C.Y. Chang and recultured in UPM supplemented with 50 mM glucose and 0.1 wt.% cysteine. Late log cultures were cryopreserved in liquid nitrogen with 10% dimethylsulfoxide as a cryoprotectant.
To prepare M. thermoacetica/CdS hybrids, 20 mL UPM supplemented with 25 mM
glucose and 0.1 wt.% cysteine was inoculated from the thawed cryopreserved stock at 5 vol.% and incubated with occasional agitation at 52°C. The headspace of each tube was pressurized to 150 kPag with 80:20 N2:CO2.
After 3 days of growth (OD600 = 0.16), the culture was reinoculated at 5 vol.% into
fresh UPM (50 mM glucose, 0.1 wt.% cysteine), and incubated at 52°C. After 24 hours, 1 mM Cd(NO3)2 was added to the tubes. Each tube was returned to incubation and placed in an in-house fabricated rotator that slowly inverted each tube at a continuous rate of 4.5 min-1. The suspension turned initially opaque white due to the formation of quantum confined CdS nanoparticles, and eventually ripened into an opaque yellow suspension (Fig. S8).

4
After an additional 2 days (3 days total growth), each tube was centrifuged at 2500 rpm for 30 min, washed and resuspended in an equivalent volume of DPM supplemented with 0.1 wt.% cysteine. A volume of 10mL of the suspension was distributed into clean anaerobic tubes equipped with a magnetic stir bar (sealed and autoclaved as previously described). Each tube was pressurized with 150 kPag of 80:20 H2:CO2 and incubated for 12-24 hours at 52 °C to promote autotrophic respiration. Material Characterization of M. thermoacetica/CdS:
The UV-Vis spectra of M. thermoacetica/CdS suspensions were obtained with a Shimadzu UV3101PC UV-Vis-NIR Spectrophotometer with an integrating sphere. Suspensions were diluted 8 in DI for measurements to ensure linearity under the Beer-Lambert law assumption. Band gap measurements were generated from Tauc plots assuming a 1 cm path length for each cuvette and a direct band gap transition for CdS.
Samples for XRD were prepared by drop casting M. thermoacetica/CdS suspensions
onto quartz chips and air drying. XRD patterns were measured with a Bruker AXS D8 Advance Diffractometer with a Co Kα source. Electron Microscopy:
Samples of M. thermoacetica/CdS were prepared for electron microscopy by fixing overnight in a solution of 5 vol.% glutaraldehyde in DPM at a 50:50 ratio of DPM/glutaraldehyde:M.thermoacetica/CdS suspension. Fixed samples were prepared for SEM by vacuum filtering onto 0.1 μm Isopore polycarbonate membrane filters (EMD Millipore) previously sputtered with ~6 nm of gold. Samples were washed by increasing concentrations of ethanol in DI water (0%, 25%, 50%, 75%, 90%, 100%, ~10 mL or 10 min each). Membrane filters were finally transferred into hexamethyldisilazane for 1 hour, then air dried overnight. An additional ~3 nm of gold was sputtered onto the samples prior to SEM mounting and imaging at 5 kV by field emission SEM (JEOL FSM6430).
Samples of fixed M. thermoacetica/CdS were prepared for STEM by dropping the
fixed suspension onto Formvar coated Ultrathin Carbon Cu TEM grids, settling for 1 hour, and washing briefly in DI water. Grids were air dried overnight. STEM imaging and EDS mapping was performed at 80 kV with an FEI Titan microscope at the National Center for Electron Microscopy (NCEM). The EDS signal was acquired via a FEI Super-X Quad windowless detector based on silicon drift technology that was controlled by Bruker Esprit software. Photosynthesis Measurements:
All photosynthesis measurements were conducted with the suspensions prepared as previously specified. Prior to photosynthesis, an additional 0.1 wt.% cysteine was added to each tube (total 0.2 wt.%, nominal) in part to act as a sacrificial reducing agent. Each tube was stirred magnetically at 150 rpm and heated to a measured temperature of 55 °C by means of a stirring hot plate and shallow sand bath (< 1 cm). Three illumination sources were employed: for high-throughput measurements: 1) an in-house fabricated circular LED array composed of 405±5 nm violet LEDs with a measured photon flux of
5
5x1018 cm-2 s-1, for blue light measurements, 2) a collimated Nikon C-HGFI Intensilight mercury lamp with a 435-485 nm filter (Fig. S9), and for simulated sunlight measurements, 3) a collimated 75 W Xenon lamp (Newport, Corp.) with an AM 1.5G filter. All light intensities were calibrated by a silicon photodiode (Hamamatsu S1787-04).
Concentrations of photosynthesis products were measured by1H-qNMR with sodium
3-(trimethylsilyl)-2,2’,3,3’-tetradeuteropropionate (TMSP-d4, Cambridge Isotope Laboratories, Inc.) as the internal standard in D2O. Spectra were processed using Mnova NMR.
Headspace gas was periodically monitored by gas chromatography with an Agilent
3000A Micro GC (Ar carrier gas, molecular sieve column, thermal conductivity detector).
Colony Forming Unit Assay:
Colony Forming Unit Assays were performed by sampling and inoculating 0.1 mL of the M. thermoacetica/CdS photosynthesis suspension into 5 mL of molten (T > 50 °C) USM supplemented with 40 mM glucose and 0.1 wt.% cysteine. After thorough mixing, molten agar anaerobic tubes were quickly spun horizontally in ice water to set a thin layer of agar on the sidewalls of the anaerobic tubes. Assay tubes were pressurized to 150 kPag with 80:20 N2:CO2 and incubated vertically at 52 °C. After 3.5 days of growth, visible white, circular colonies were counted to determine the CFU mL-1 as a measure of cell number and viability. In parallel, cell mL-1 values were determined by manual counting with a Petroff-Hauser counting chamber.
Calculations:
Photosynthetic acetic acid yields and efficiencies were calculated based on Eq. 6. The 0.2 wt.% Cys·HCl (MW = 157.62g mol-1) used in photosynthesis measurements, corresponds to 12.2 mM Cys. With the above stoichiometry, this leads to a maximum acetic acid yield of 1.53 mM CH3COOH. Acetic acid yield is then defined as:
%10053.1
)((%)
mM
mMCYield a
a
where Ca is the concentration of acetic acid. The quantum yield was determined by comparison of the initial rate of acetic acid
production with the measured photon flux. The reduction of two CO2 molecules to one acetic acid molecule requires 8 electrons, giving the following quantum yield (QY) equation:
ph
Aa NVAt
C
QY
8(%)

6
where t is the reaction time to produce Ca, A is the area of illumination, V is the volume of the M. thermoacetica/CdS suspension, Φph is the measured photon flux (photons cm-2 s-1), NA is Avogadro’s Number (6.022 x 10²³). For a lower limit of the efficiency, and to account for the possibility of scattering and reflections due to the curved sidewalls of the tubular reactor, A was assumed to be the entire surface of the reactor, or 25.4 cm2 for a suspension volume of 10 mL.
All reported error bars represent one standard deviation from the mean average obtained from each experiment run in triplicate. All error bars on calculated values obtained after averaging were determined by the standard propagation of errors methodology.
Supplementary Text
M. thermoacetica/CdS Reaction Equations: CdS precipitation by M. thermoacetica:
Cd2+ + Cys icathermoacetM . CdS + NH3 + pyruvic acid + 2 H+ Electron-hole pair photogeneration:
hν CdS e- + h+ Reducing equivalent generation:
2 H+ + 2 e- CdSicathermoacetM /. 2 [H]
CO2 reduction to acetic acid: 2 CO2 + 8 [H] CdSicathermoacetM /. CH3COOH + 2 H2O
Cys oxidation to CySS:
2 Cys + 2 h+ CdSicathermoacetM /. CySS + 2 H+ Overall photosynthetic reaction:
2 CO2 + 8 Cys + 8 hν CdSicathermoacetM /.CH3COOH + 2 H2O + 4 CySS
Discussion of M. thermoacetica/CdS growth and bioprecipitation:
Attempts to establish M. thermoacetica/CdS under different growth substrates yielded mixed results. In the same media, M. thermoacetica failed to produce CdS precipitates when grown purely on a mixture of H2:CO2 (80:20), the normal autotrophic growth substrate. When grown on a combination of H2:CO2 and glucose, formation of opaque yellow CdS occurred at a slower rate. These observations suggest that the precipitation of CdS depends heavily on the metabolic rate, pathway (fermentative glycolysis versus autotrophic respiration), protein expression under different growth substrates, or a combination of several factors. The influences of the growth substrate and the biological/chemical factors governing the formation of CdS bear further investigation to shed light on the nature of bioprecipitation processes.
Experiments in which dilute suspensions (~10-50% regular cell density) were supplemented with Cd2+ ions and subjected to illumination, a white precipitate was observed (which did not fully ripen to the opaque yellow suspension), suggesting

7
photosynthetic precipitation of CdS. This contrasts sharply with the previous observation that Cd2+ precipitation did not occur during autotrophic growth (H2:CO2), the presumed pathway for photosynthetic acetic acid synthesis. The difference in biologically-induced precipitation behavior between autotrophic and photosynthetic metabolism bears further investigation.
Discussion of CFU Assays, Viability, and Self-replication:
As noted in the main text, CFU assays suggested that the photosynthetic production of acetic acid was sufficient to produce cell-replication, as evidenced by the increase in CFU mL-1. It is important to note that CFU assays are not definitive, and the observed increase could be an artifact of culturing and growth conditions. To address these issues, we have cross correlated this observation with manual cell counting (Petroff-Hauser counting chamber). The rough doubling measured by CFU mL-1 (167±2% after the first day) correlates reasonably well with the parallel cell count (191±57% after the first day). While the CFU mL-1 begins to plateau after the second day, so does the cells mL-1 (Fig. S7). While the CFU mL-1 begins to decline on the third day, the cells mL-1 does not decline until the fourth day. This is likely due to the initial cell death, followed gradually later by the photooxidative degradation (Fig. S7), which would result in an apparent decrease in the CFU mL-1 and then cells mL-1, respectively.
This cross-correlation serves to rule out a few possibilities and artifacts. Firstly, no sporulation was observed at any time, suggesting that the formation of a light or nutrient-deficit triggered dormant state did not occur. While this may still imply the formation of resting cells normal in appearance, which may result in an apparent increase in CFU mL-
1, this would also appear as a constant cells mL-1, which was not observed. Conversely, an apparent rise in cells mL-1 could be attributable to simply the counting of dead cells (cell staining with propidium iodide was unable to differentiate between healthy cells and ethanol killed cells). However, this would give a constant CFU mL-1, which was also not observed.
It is possible that the observed cell doubling is simply due to the facile division of cells poised at the end of their division cycle. However, in order to observe the doubling seen here, that would require that nearly every cell had already doubled in cell length (but not yet divided) before illumination. We observed no such features, with a vast majority of cells existing as single cells over all time points. This suggests that cell wall biosynthesis had to predominantly occur under illumination, where light was required for acetic acid metabolism (Fig. 3, A and B).
While the growth is not robust (as would be suggested by several doubling cycles), our observations suggest a direct correlation between M. thermoacetica/CdS illumination and their apparent increase in both cell number and cell viability. In experiments inoculated with 50% the normal M. thermoacetica/CdS loading (2 diluted), cell numbers tripled over the first 24 hours (292±69%). It is possible that the initially high concentration of bacteria quickly exhausts a limiting nutrient in the defined photosynthesis medium, allowing only one cell doubling. As noted previously, photosynthesis was not sufficient to produce fully ripened (yellow) CdS nanoparticles. It is possible the upper limit on doubling cycles is set by the CdS loading amount, in which each doubling cycle halves the average nanoparticle cell-1 loading. These initial insights

8
demonstrate that a fully self-replicating hybrid organism may be possible, but will require significant optimization to fully understand and rigorously demonstrate the process.
Headspace Gas Analysis During Photosynthesis:
One of the possible electron transfer mechanisms presented in Fig. S1 denotes that the formation of molecular hydrogen, H2, may be generated at the CdS surface. Gas chromatographic analysis of headspace gas during photosynthesis does detect trace amounts of H2 roughly in the range of 1-10 ppm. While it is difficult to conclude the prevalence of this reaction pathway (as H2 may be generated at CdS, but immediately consumed by M. thermoacetica before it escapes to the headspace), it demonstrates that this pathway is present to some extent.

9
Fig. S1.
Hypothesized Electron Transfer Pathways for M. thermoacetica/CdS. (A) Hydrogen generation at the semiconductor surface, followed by diffusion into the cell. (B) Electron transfer directly from semiconductor to surface/membrane bound hydrogenase. (C) Electron transfer to membrane bound cytochromes. (D) Secretion of a soluble redox mediator. The proposed full and balanced reaction pathway is depicted in Fig. 1B.

10
Fig. S2
Growth Kinetics for M. thermoacetica/CdS. Growth kinetics obtained by manual cell count for M. thermoacetica grown on 50mM glucose with and without Cd2+ addition at 24 hours.

11
Fig. S3
Electron Microscopy of M. thermoacetica/CdS Hybrids. (A) Additional SEM images of M. thermoacetica/CdS hybrids showing (B) larger particles obtained after additional ripening. (C) A CdS free cell for reference. (A) Compared with the HAADF micrograph, the cell body can be distinguished by the presence of biologically common elements such as (B) carbon (C) nitrogen (D) phosphorous (E) oxygen (F) chlorine and (G) sulfur. Of note is the formation of nanoparticle clusters with bright Z-contrast on the bacteria composed largely of (H) cadmium and (G) sulfur. (D, G and H) Additionally, a few particles composed of phosphorus, oxygen and cadmium are observed, suggesting the presence of small amounts of Cd3(PO4)2. Scale bars (A toC) 1μM, (D to K) 100 nm.

12
Fig. S4
Characterization of CdS Nanoparticles. (A) UV-Vis Spectrum of M. thermoacetica/CdS hybrids demonstrating a band gap, Eg, of 2.51±0.05 eV. (B) XRD reveals peaks assignable to the pattern of wurtzite CdS (reference peaks from JCPDS data card No. 00-041-1049 given as drop lines). These peaks appear broad due to the small size of the nanoparticles.

13
Fig. S5 1H-NMR Spectrum of Photosynthetic Products. (A) Full spectrum shows a prominent solvent peak (H2O). No significant products detected at chemical shifts larger than the solvent peak. (B) Inset of (A) shows the primary product detected is acetic acid (CH3COOH), with a collection of peaks assignable to Cys/CySS. Trace peaks assignable to ethanol are occasionally observed, but these arise from residual amounts remaining from sterilization techniques.

14
Fig. S6
CFU and Cell Counts for M. thermoacetica/CdS During Photosynthesis. Data was obtained by the CFU assay and manual counting with a Petroff-Hauser counting chamber as detailed in the Methods section. Measurements were performed in parallel with the data presented in Fig. 4A and B. Both an increase in CFU mL-1 and cells were observed under illumination. All values are the mean and error propagated standard deviation of triplicate experiments.

15
Fig. S7
SEM of Photooxidative Damage to M. thermoacetica/CdS. All scale bars 1 μm.
16
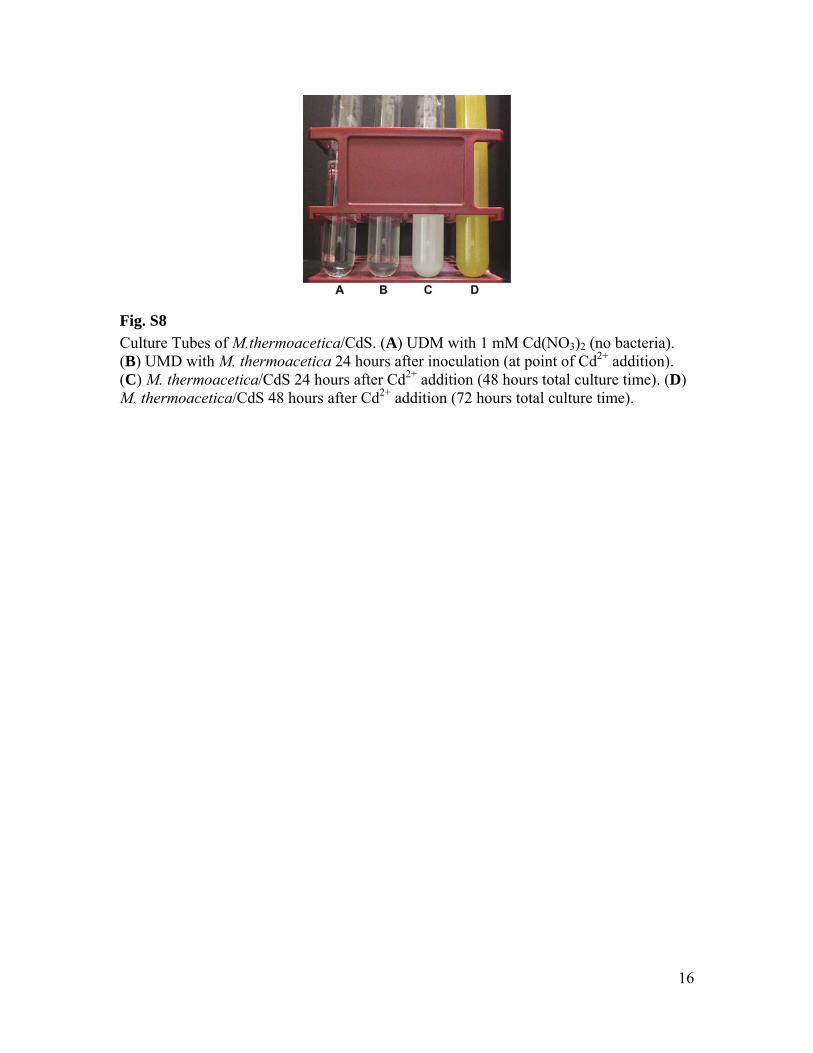
Fig. S8
Culture Tubes of M.thermoacetica/CdS. (A) UDM with 1 mM Cd(NO3)2 (no bacteria). (B) UMD with M. thermoacetica 24 hours after inoculation (at point of Cd2+ addition). (C) M. thermoacetica/CdS 24 hours after Cd2+ addition (48 hours total culture time). (D) M. thermoacetica/CdS 48 hours after Cd2+ addition (72 hours total culture time).

17
Fig. S9
Spectrum of Blue Light Illumination Source. A Nikon C-HGFI Intensilight mercury lamp with a 435-485 nm filter was used for blue light photosynthesis quantum yield measurements.