Embed Size (px)
Citation preview
S1
SUPPLEMENTARY MATERIAL
Phase behavior of palmitoyl and egg sphingomyelin
Zoran Arsov*1, Emilio J. González-Ramírez*
2, Felix M. Goñi
2,
Stephanie Tristram-Nagle3
and John F. Nagle3,+
1Department of Condensed Matter Physics, Laboratory of Biophysics, Jozef Stefan Institute,
1000 Ljubljana, Slovenia
2Instituto Biofísika (CSIC, UPV/EHU)) and Departamento de Bioquímica, Universidad del País
Vasco, 48080 Bilbao, Spain
3Biological Physics Group, Physics Department, Carnegie Mellon University, 5000 Forbes
Avenue, Pittsburgh, Pennsylvania 15213
*Contributed equally as first co-authors
+Corresponding author
The figures on pages S2-6 are 2D CCD images of hydrated, oriented egg sphingomyelin
(ESM) collected as a function of temperature using the Rigaku RUH3R with Xenocs focusing
collimator as described in the Materials and Methods in the main paper. These data are the
evidence that ESM remains in the ripple phase at all temperatures between 3 and 35 oC, since all
of the images contain off-specular reflections characteristic of the ripple phase as shown in Fig. 1
in the main paper. While Fig. S1 is a summary figure of all of the ESM data images, Figs. S2-8
are individual 2D CCD images at each temperature for viewing at higher resolution. Units on
images are detector pixels, q of 1.0 Å-1 ≈ 650 pixels.

S2
Figure S1. 2D CCD X-ray scattering data from oriented, hydrated ESM collected at the
following temperatures: Ripple phase A. 20 oC, after annealing at 60
oC for 2 hours, B. 15
oC,
upon cooling from 20 oC, C. 10
oC, upon cooling from 15
oC, D. 3
oC, upon cooling from 10
oC,
E. 30 oC, upon heating from 3
oC, F. 35
oC, upon heating from 30
oC, Fluid phase G. 45
oC, after
annealing at 60 oC for 2 hours. Red pixels indicate negative intensity after background
subtraction.

S3
LAXS WAXS
Figure S2. Oriented ESM at 20 oC in the ripple phase, collected after annealing at 60
oC for 2
hours. D-spacing is 64.9 ± 0.9 Å.
LAXS WAXS
Figure S3. Oriented ESM at 15 oC in the ripple phase, collected after cooling from 20
oC. D-
spacing is 60.8 ± 0.8 Å.

S4
LAXS WAXS
Figure S4. Oriented ESM at 10 oC in the ripple phase, collected after cooling from 15
oC. D-
spacing is 60.8 ± 0.8 Å.
LAXS WAXS
Figure S5. Oriented ESM at 3 oC in the ripple phase, collected after cooling from 10
oC. D-
spacing is 60 ± 0.2 Å.

S5
LAXS WAXS
Figure S6. Oriented ESM at 30 oC in the ripple phase, collected after heating from 3
oC.
D-spacing is 65 Å. The light, diffuse scattering in the upper right hand corner of the WAXS
image is due to excess water on the sample.
LAXS WAXS
Figure S7. Oriented ESM at 35 oC in the ripple phase, collected after heating from 30
oC. D-
spacing is 65.8 ± 1.2 Å.

S6
LAXS WAXS
Figure S8. Oriented ESM at 45 oC in the fluid phase, collected after annealing at 60
oC for 2
hours. At 45 oC, SPM is in the fluid phase, as evidenced by the absence of ripple reflections in
LAXS and broad, diffuse scattering in WAXS. D-spacing is 62.7 ± 1.1 Å.

S7
The figures on pages S7-10 are 2D CCD images of hydrated, oriented palmitoyl
sphingomyelin (PSM) collected as a function of temperature using the Rigaku RUH3R with
Xenocs focusing collimator as described in the Materials and Methods in the main paper. These
data are the evidence that PSM undergoes a phase transition from the gel phase to the ripple
phase between 24 and 30 oC and then melts into the fluid phase between 37 and 45
oC as
evidenced by reflections characteristic of these three phases. While Fig. S9 is a summary figure
of all of the PSM data images, Figs. S10-15 are individual 2D CCD images at each temperature
for viewing at higher resolution.
Figure S9. 2D CCD X-ray scattering data from oriented, hydrated PSM collected at the
following temperatures: Gel phase: A. 3 oC, upon cooling from 37
oC and equilibrating
overnight at 3 oC, B. 15
oC, upon heating from 3
oC, C. 24
oC, upon heating from 15
oC, Ripple
phase: D. 30 oC, upon heating from 24
oC, E. 37
oC, upon heating from 24
oC, Fluid phase: F.
45 oC, upon heating from 37
oC.

S8
Figure S10. Oriented PSM at 3 oC in the gel phase, collected after cooling from 37
oC and
equilibrating overnight at 3 oC. D-spacing is 60 ± 0.2 Å.
Figure S11. Oriented PSM at 15 oC in the gel phase, collected after heating from 3
oC. D-
spacing is 60.6 ± 0.3 Å.
S9
Figure S12. Oriented PSM at 24 oC gel phase with incipient ripple phase, collected after heating
from 15 oC. D-spacing is 61 ± 0.3 Å.
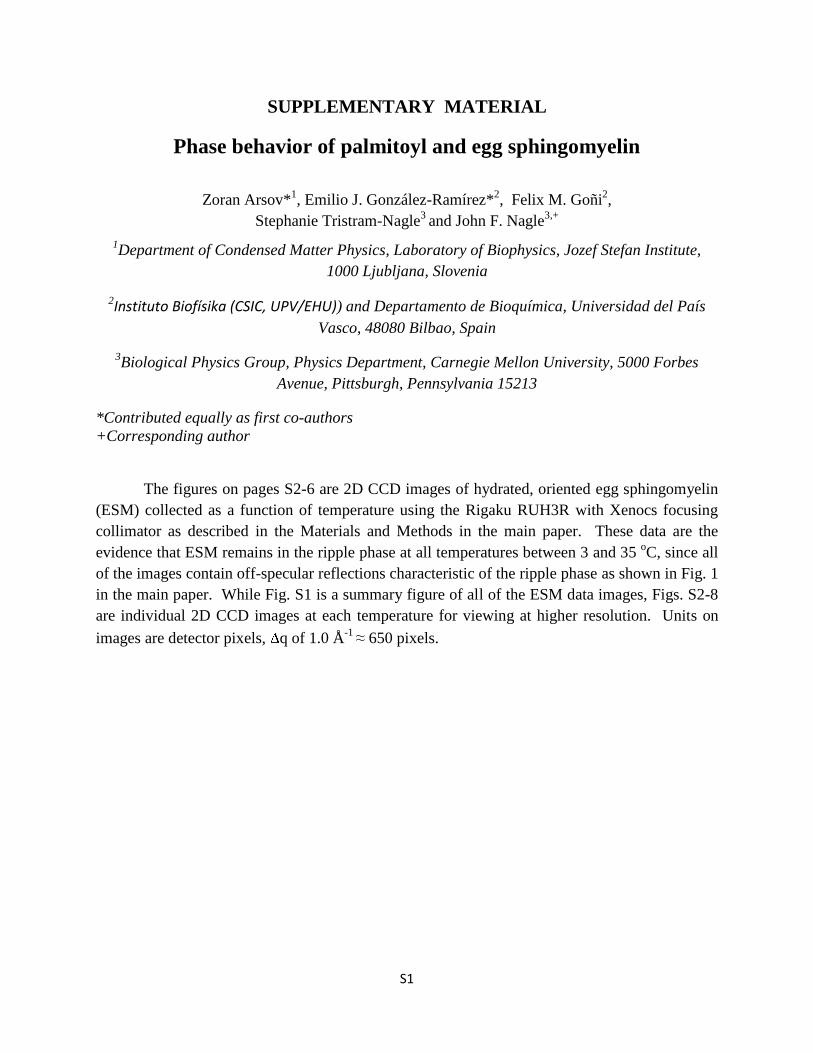
Figure S13. Oriented PSM at 30 oC in the ripple phase, collected after heating from 24
oC.
D-spacing is 63.2 ± 0.2 Å.
S10
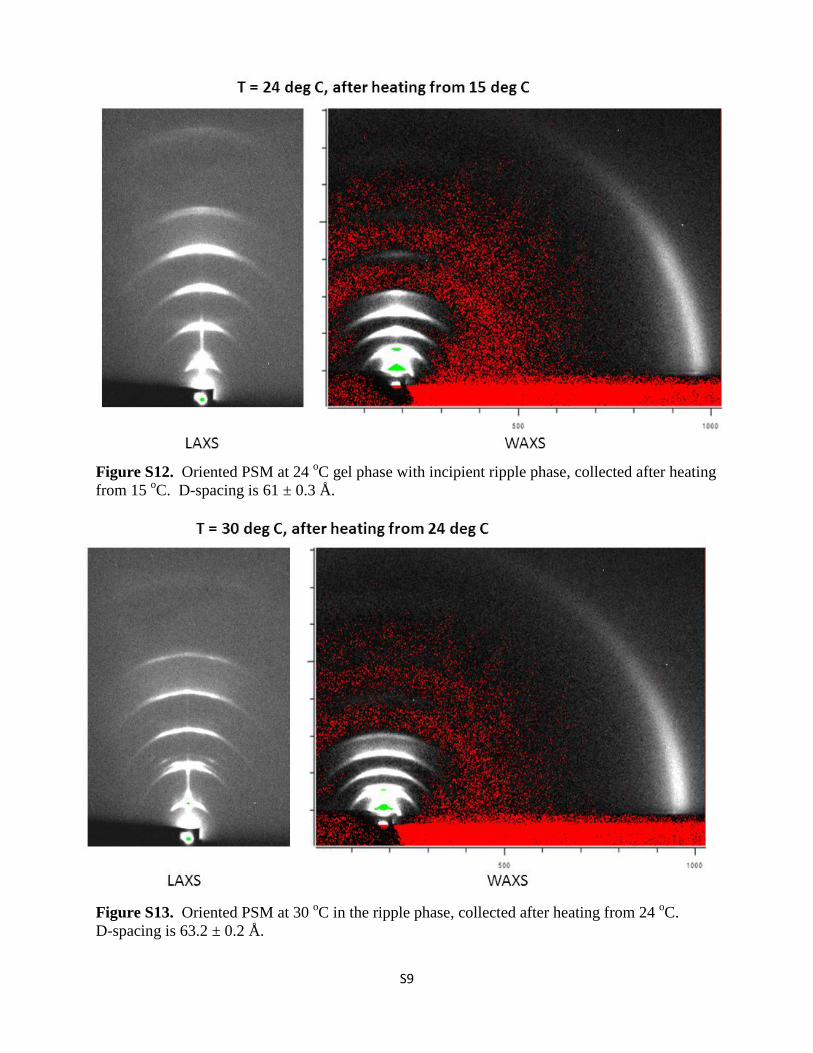
Figure S14. Oriented PSM at 37 oC in the ripple phase, collected after heating from 30
oC. D-
spacing is 63.6 ± 0.8 Å.
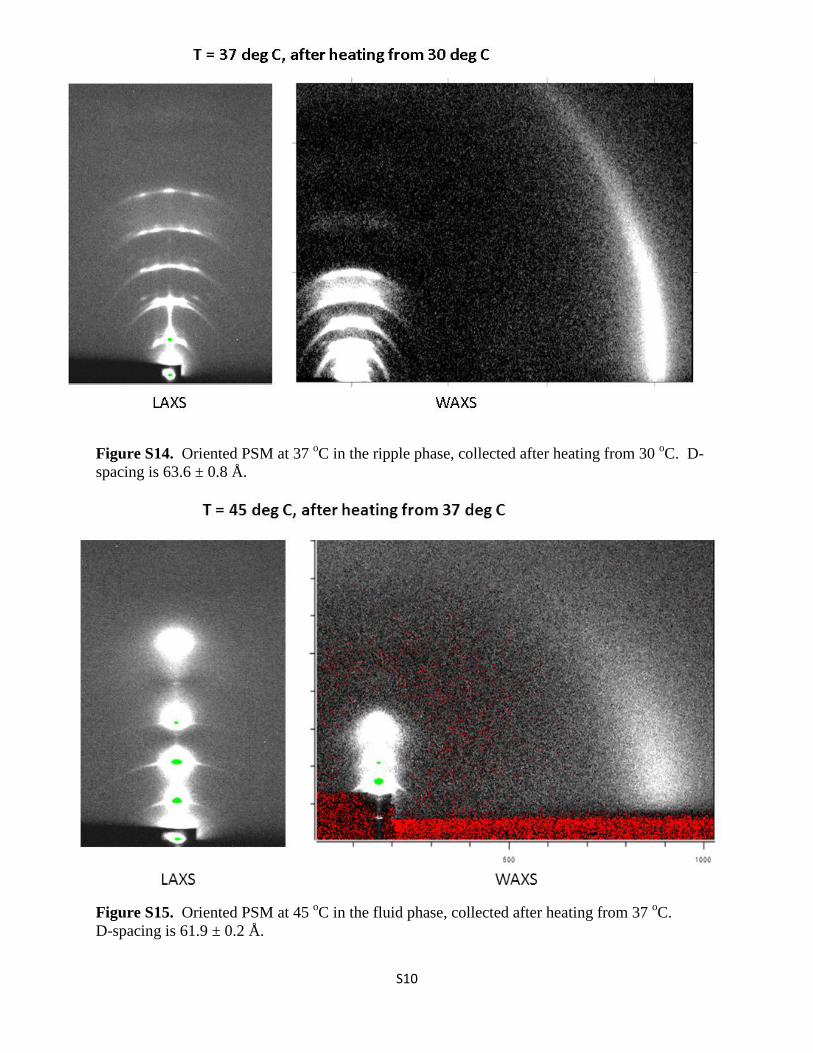
Figure S15. Oriented PSM at 45 oC in the fluid phase, collected after heating from 37
oC.
D-spacing is 61.9 ± 0.2 Å.

S11
Figure S16. Capillary D-spacings from literature: PSM, open black squares (Calhoun and
Shipley, 1979a), open red circles (Maulik and Shipley, 1996), open black stars (ThisWork,
2018); ESM, solid green inverted triangles (Chachaty et al., 2005), solid blue triangles (Quinn
and Wolf, 2009), solid cyan hexagons (Chemin et al., 2008), solid magenta star (Shaw et al.,
2012), solid black squares (ThisWork, 2018) .

S12
Figure S17. Form factor data obtained from x-ray diffuse scattering used to obtain the EDPs
shown in Fig. 11 in the main paper.
S13
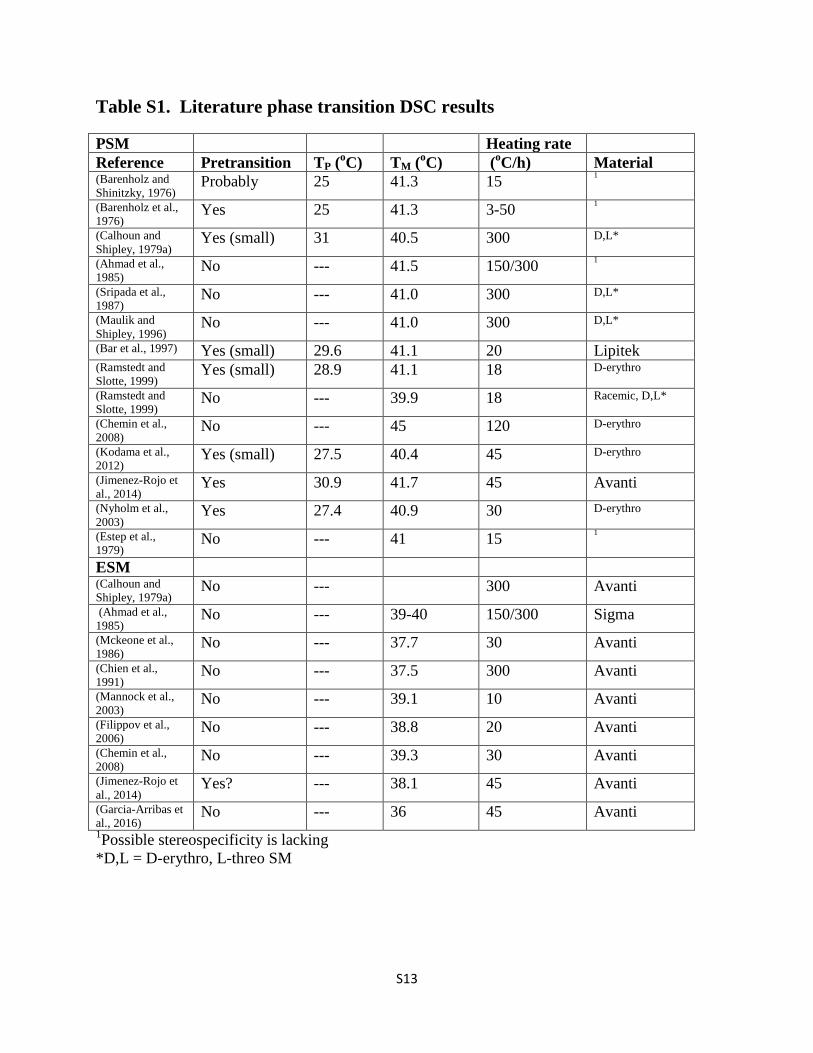
Table S1. Literature phase transition DSC results
PSM Heating rate
Reference Pretransition TP (oC) TM (
oC) (
oC/h) Material
(Barenholz and
Shinitzky, 1976) Probably 25 41.3 15
1
(Barenholz et al.,
1976) Yes 25 41.3 3-50
1
(Calhoun and
Shipley, 1979a) Yes (small) 31 40.5 300 D,L*
(Ahmad et al.,
1985) No --- 41.5 150/300
1
(Sripada et al.,
1987) No --- 41.0 300 D,L*
(Maulik and
Shipley, 1996) No --- 41.0 300 D,L*
(Bar et al., 1997) Yes (small) 29.6 41.1 20 Lipitek (Ramstedt and
Slotte, 1999) Yes (small) 28.9 41.1 18 D-erythro
(Ramstedt and
Slotte, 1999) No --- 39.9 18 Racemic, D,L*
(Chemin et al.,
2008) No --- 45 120 D-erythro
(Kodama et al.,
2012) Yes (small) 27.5 40.4 45 D-erythro
(Jimenez-Rojo et
al., 2014) Yes 30.9 41.7 45 Avanti
(Nyholm et al.,
2003) Yes 27.4 40.9 30 D-erythro
(Estep et al.,
1979) No --- 41 15
1
ESM (Calhoun and
Shipley, 1979a) No --- 300 Avanti
(Ahmad et al.,
1985) No --- 39-40 150/300 Sigma
(Mckeone et al.,
1986) No --- 37.7 30 Avanti
(Chien et al.,
1991) No --- 37.5 300 Avanti
(Mannock et al.,
2003) No --- 39.1 10 Avanti
(Filippov et al.,
2006) No --- 38.8 20 Avanti
(Chemin et al.,
2008) No --- 39.3 30 Avanti
(Jimenez-Rojo et
al., 2014) Yes? --- 38.1 45 Avanti
(Garcia-Arribas et
al., 2016) No --- 36 45 Avanti
1Possible stereospecificity is lacking
*D,L = D-erythro, L-threo SM

S14
Table S2. Summary of structural parameters from PSM experiments
*Some assumptions, or calculated from other quantities, +Assumed tilt = 0 degrees.
Table S3. Summary of structural parameters from ESM experiments
+Assumed tilt = 0 degrees.
T (°C) DPP
(Å)
AL (Å2) Volume
(Å3)
DB
(Å)
DC
(Å)
Tilt (°) d-space
(Å)
<SCD>
(Calhoun and
Shipley, 1979b) 10 54.8* 38.4* 47* 4.14
50 59.4* 35.4* 4.6 (Maulik et al.,
1986) 50 36.5 64.3* 1173*
(Maulik and
Shipley, 1996) 29 48 41* 1103* 54* 4.2
55 42 46* 1181* 51* 4.6 (Li et al., 2000)
(monolayer) 10 46.3
(Mehnert et al.,
2006) < 30 0
48 0.258
48 0.214
(DPPC) 3
(DPPC)
--- 47.0
(DPPC)
1128
(DPPC)
48
(DPPC)
--- 34
(DPPC)
4.27(d20)
4.03(d11)
(DPPC)
(Guler et al.,
2009) 48
(DPPC)
64
(DPPC)
1229
(DPPC)
38.4
(DPPC)
(Bunge et al.,
2008) 40 16.2* 0.221
(Bartels et al.,
2008)
20 43.8+ 19.8
30 19.1
45 16.2 ~0.25
60 14.9 ~0.22 (ThisWork,
2018) 3 --- 44.5 1099* 49.4 --- 30.4 3.95(d20)
4.14(d11)
(ThisWork,
2018) 45 37.6 64 1172* 36.6 13.3
T
(°C)
DPP (Å) AL (Å2) Volume
(Å3)
DB
(Å)
DC
(Å)
Tilt
(°)
d-space
(Å)
<SCH>
(Chachaty et
al., 2005) 20 4.2
50 4.6 (Chemin et al.,
2008) 20 40.2+ 4.17
55 ~48 (Quinn and
Wolf, 2009) 20 42.1(ave) 0 4.21
50 39.6(ave) 17.3
(Leftin et al.,
2014) 48 53.2
(ave)
49.9(DB')
(ave)
17.0
(ave)
~0.32
(ThisWork,
2018) 45 38.6 64 1187 37.1 13.6

S15
References for Supplementary Material
Ahmad, T.Y., Sparrow, J.T., Morrisett, J.D., 1985. Fluorine-labeled, pyrene-labeled, and nitroxide-labeled sphingomyelin - Semi-synthesis and thermotropic properties. J Lipid Res 26, 1160-1165. Bar, L.K., Barenholz, Y., Thompson, T.E., 1997. Effect of sphingomyelin composition on the phase structure of phosphatidylcholine-sphingomyelin bilayers. Biochemistry-Us 36, 2507-2516. Barenholz, Y., Shinitzky, M., 1976. Effect of Sphingomyelin Level on Membrane Dynamics. Israel J Med Sci 12, 1362-1363. Barenholz, Y., Suurkuusk, J., Mountcastle, D., Thompson, T.E., Biltonen, R.L., 1976. A calorimetric study of thermotropic behavior of aqueous dispersions of natural and synthetic sphingomyelins. Biochemistry-Us 15, 2441-2447. Bartels, T., Lankalapalli, R.S., Bittman, R., Beyer, K., Brown, M.F., 2008. Raftlike mixtures of sphingomyelin and cholesterol investigated by solid-state H-2 NMR spectroscopy. J Am Chem Soc 130, 14521-14532. Bunge, A., Muller, P., Stockl, M., Herrmann, A., Huster, D., 2008. Characterization of the ternary mixture of sphingomyelin, POPC, and cholesterol: Support for an inhomogeneous lipid distribution at high temperatures. Biophys J 94, 2680-2690. Calhoun, W.I., Shipley, G.G., 1979a. Fatty-acid composition and thermal-behavior of natural sphingomyelins. Biochimica et biophysica acta 555, 436-441. Calhoun, W.I., Shipley, G.G., 1979b. Sphingomyelin-lecithin bilayers and their interaction with cholesterol. Biochemistry-Us 18, 1717-1722. Chachaty, C., Rainteau, D., Tessier, C., Quinn, P.J., Wolf, C., 2005. Building up of the liquid-ordered phase formed by sphingomyelin and cholesterol. Biophys J 88, 4032-4044. Chemin, C., Bourgaux, C., Pean, J.M., Pabst, G., Wuthrich, P., Couvreur, P., Ollivon, M., 2008. Consequences of ions and pH on the supramolecular organization of sphingomyelin and sphingomyelin/cholesterol bilayers. Chem Phys Lipids 153, 119-129. Chien, K.Y., Huang, W.N., Jean, J.H., Wu, W.G., 1991. Fusion of sphingomyelin vesicles induced by proteins from Taiwan cobra (Naja-Naja Atra) venom - Interactions of zwitterionic phospholipids with cardiotoxin analogs. J Biol Chem 266, 3252-3259. Estep, T.N., Mountcastle, D.B., Barenholz, Y., Biltonen, R.L., Thompson, T.E., 1979. Thermal-behavior of synthetic sphingomyelin-cholesterol dispersions. Biochemistry-Us 18, 2112-2117. Filippov, A., Oradd, G., Lindblom, G., 2006. Sphingomyelin structure influences the lateral diffusion and raft formation in lipid bilayers. Biophys J 90, 2086-2092. Garcia-Arribas, A.B., Axpe, E., Mujika, J.I., Merida, D., Busto, J.V., Sot, J., Alonso, A., Lopez, X., Garcia, J.A., Ugalde, J.M., Plazaola, F., Goni, F.M., 2016. Cholesterol-ceramide interactions in phospholipid and sphingolipid bilayers as observed by positron annihilation lifetime spectroscopy and molecular dynamics simulations. Langmuir : the ACS journal of surfaces and colloids 32, 5434-5444. Guler, S.D., Ghosh, D.D., Pan, J., Mathai, J.C., Zeidel, M.L., Nagle, J.F., Tristram-Nagle, S., 2009. Effects of ether vs. ester linkage on lipid bilayer structure and water permeability. Chem Phys Lipids 160, 33-44. Jimenez-Rojo, N., Garcia-Arribas, A.B., Sot, J., Alonso, A., Goni, F.M., 2014. Lipid bilayers containing sphingomyelins and ceramides of varying N-acyl lengths: a glimpse into sphingolipid complexity. Biochimica et biophysica acta 1838, 456-464. Kodama, M., Kawasaki, Y., Ohtaka, H., 2012. The main transition enthalpy of the gel-to-liquid crystal phases for a series of asymmetric chain length D-erythro (2S, 3R) sphingomyelins. Thermochim Acta 532, 22-27. Leftin, A., Molugu, T.R., Job, C., Beyer, K., Brown, M.F., 2014. Area per lipid and cholesterol interactions in membranes from separated local-field C-13 NMR spectroscopy. Biophys J 107, 2274-2286.

S16
Li, X.M., Smaby, J.M., Momsen, M.M., Brockman, H.L., Brown, R.E., 2000. Sphingomyelin interfacial behavior: The impact of changing acyl chain composition. Biophys J 78, 1921-1931. Mannock, D.A., McIntosh, T.J., Jiang, X., Covey, D.F., McElhaney, R.N., 2003. Effects of natural and enantiomeric cholesterol on the thermotropic phase behavior and structure of egg sphingomyelin bilayer membranes. Biophys J 84, 1038-1046. Maulik, P.R., Atkinson, D., Shipley, G.G., 1986. X-ray-scattering of vesicles of N-acyl sphingomyelins - Determination of bilayer thickness. Biophys J 50, 1071-1077. Maulik, P.R., Shipley, G.G., 1996. N-palmitoyl sphingomyelin bilayers: Structure and interactions with cholesterol and dipalmitoylphosphatidylcholine. Biochemistry-Us 35, 8025-8034. Mckeone, B.J., Pownall, H.J., Massey, J.B., 1986. Ether phosphatidylcholines - Comparison of miscibility with ester phosphatidylcholines and sphingomyelin, vesicle fusion, and association with apolipoprotein-a-I. Biochemistry-Us 25, 7711-7716. Mehnert, T., Jacob, K., Bittman, R., Beyer, K., 2006. Structure and lipid interaction of N-palmitoylsphingomyelin in bilayer membranes as revealed by H-2-NMR spectroscopy. Biophys J 90, 939-946. Nyholm, T.K.M., Nylund, M., Slotte, J.P., 2003. A calorimetric study of binary mixtures of dihydrosphingomyelin and sterols, sphingomyelin, or phosphatidylcholine. Biophys J 84, 3138-3146. Quinn, P.J., Wolf, C., 2009. Thermotropic and structural evaluation of the interaction of natural sphingomyelins with cholesterol. Biochimica et biophysica acta 1788, 1877-1889. Ramstedt, B., Slotte, J.P., 1999. Comparison of the biophysical properties of racemic and d-erythro-N-acyl sphingomyelins. Biophys J 77, 1498-1506. Shaw, K.P., Brooks, N.J., Clarke, J.A., Ces, O., Seddon, J.M., Law, R.V., 2012. Pressure-temperature phase behaviour of natural sphingomyelin extracts. Soft matter 8, 1070-1078. Sripada, P.K., Maulik, P.R., Hamilton, J.A., Shipley, G.G., 1987. Partial synthesis and properties of a series of N-acyl sphingomyelins. J Lipid Res 28, 710-718. ThisWork, 2018.