Embed Size (px)
Citation preview
Supplementary Information
A mucosal imprint left by prior Escherichia coli bladder infection sensitizes to recurrent disease
Valerie P. O’Brien1, Thomas J. Hannan1,2, Lu Yu1, Jonathan Livny3, Elisha D.O. Roberson4,5, Drew J. Schwartz1, Spenser Souza6, Cathy L. Mendelsohn6, Marco Colonna2, Amanda L. Lewis1,7 and Scott J. Hultgren1*.
Affiliations: 1Department of Molecular Microbiology and Center for Women’s Infectious Disease Research, Washington University School of Medicine, St. Louis, MO, USA. 2Department of Pathology and Immunology, Washington University School of Medicine, St. Louis, MO, USA. 3The Broad Institute of Massachusetts Institute of Technology and Harvard University, Cambridge, MA, USA. 4Internal Medicine, Division of Rheumatology, Washington University School of Medicine, St. Louis, MO, USA. 5Department of Genetics, Washington University School of Medicine, St. Louis, MO, USA. 6Departments of Urology and Genetics & Development, Columbia University, New York, NY, USA. 7Department of Obstetrics and Gynecology, Washington University School of Medicine, St. Louis, MO, USA.
*Correspondence to: [email protected].
© 2016 Macmillan Publishers Limited, part of Springer Nature. All rights reserved.
SUPPLEMENTARY INFORMATIONARTICLE NUMBER: 16196 | DOI: 10.1038/NMICROBIOL.2016.196
NATURE MICROBIOLOGY | www.nature.com/naturemicrobiology 1

Supplementary Figures
Supplementary Figure 1. Sensitized mice have long-lasting susceptibility to recurrent UTI.
In this experiment the convalescent period in C3H/HeN mice was extended for seven months
after the initiation of sterilizing antibiotic therapy. Shown is the incidence of chronic cystitis 28
dpi after challenge with 107 CFU UTI89. The # of mice per group is shown at the top of each
bar; few mice were used because of the length of the experiments. ND, not determined. A 108
CFU dose was used in Fig. 1b because nulliparous C3H/HeN mice become resistant to UTI with
age1.

Supplementary Figure 2. Timeline of sensitization experiment in C57BL/6 mice shown in
Fig. 1c. This inbred mouse strain is resistant to developing chronic cystitis upon infection with
one dose of UPEC, but superinfection with two doses of 107 CFU UTI89 24 hours apart induces
chronic cystitis (evidenced by persistent bacteriuria >104 CFU/ml for four weeks) in 30-35% of
mice2, denoted here as “Superinfected, Chronic.” The 65-70% of mice that spontaneously
resolve the superinfection are denoted here as “Superinfected, Resolved.” As controls, mice
initially were given one dose of UPEC (“Single, Resolved”), which all mice spontaneously
resolved, or PBS (“Adult Naive”). Four weeks after the initial infection, all mice received
antibiotics. Four weeks after the initiation of antibiotics, all mice were challenged with one dose
of 107 CFU UTI89 and sacrificed after two weeks. Open circles indicate urine collection to
monitor infection status.

Supplementary Figure 3. Type 1 pilus expression in a panel of clinical E. coli isolates. Shown are the mean guinea pig red blood cell hemagglutination (HA) titers of indicated bacterial
strains. Samples were tested in duplicate and N=2 replicate were performed; error bars indicate
standard error of the mean.
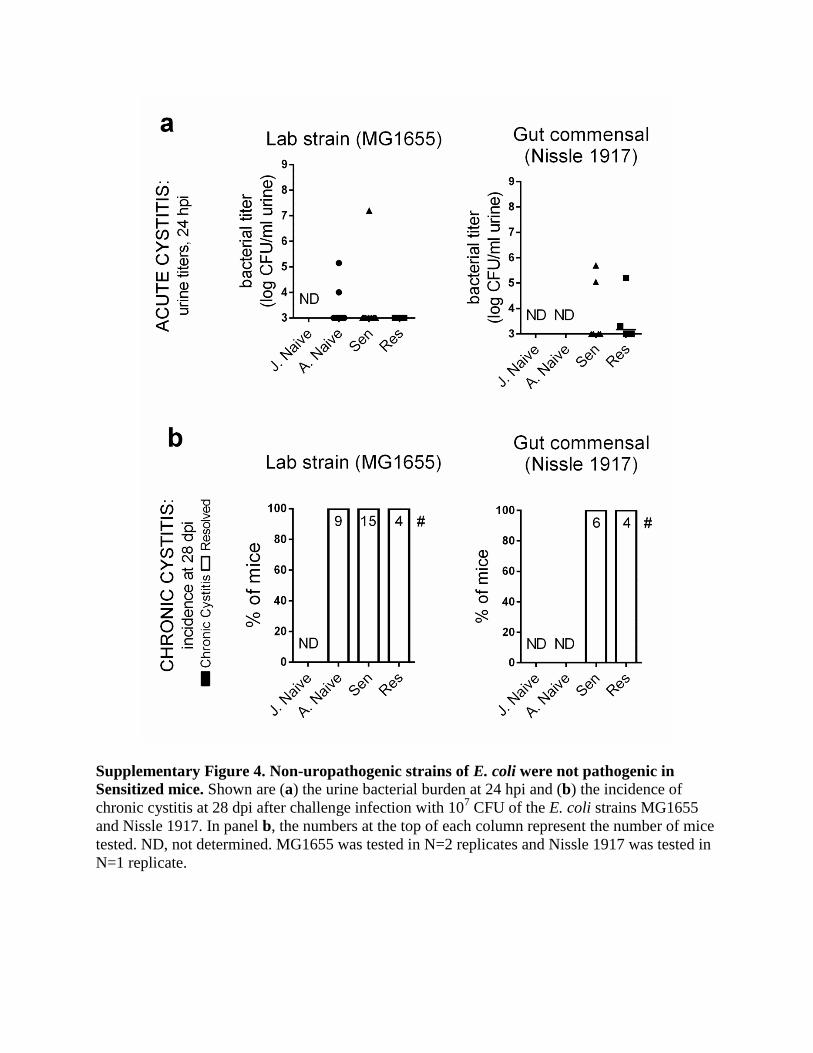
Supplementary Figure 4. Non-uropathogenic strains of E. coli were not pathogenic in
Sensitized mice. Shown are (a) the urine bacterial burden at 24 hpi and (b) the incidence of
chronic cystitis at 28 dpi after challenge infection with 107 CFU of the E. coli strains MG1655
and Nissle 1917. In panel b, the numbers at the top of each column represent the number of mice
tested. ND, not determined. MG1655 was tested in N=2 replicates and Nissle 1917 was tested in
N=1 replicate.

Supplementary Figure 5. Infection history impacts bladder cell size during convalescence. Shown is the average urothelial cell size (pixels
2) in convalescent mice sacrificed at one month
after the initiation of ten days of oral trimethoprim-sulfamethoxazole antibiotics. Cell sizes were
measured in ImageJ. Five 500x magnification scanning electron micrographs were taken per
bladder half (total of ten images per mouse) and every cell that was completely contained within
the image was measured. Data points represent the average of all measurements for a given
mouse. * P < 0.05, Mann-Whitney U test.


Supplementary Figure 6. Few superficial cells in Sensitized mice were binucleate. (a)
Representative images of DAPI-stained whole mounted bladders visualized by epifluorescence
microscopy show more binucleate cells (arrows indicate examples) in Adult Naive and Resolved
bladders than Sensitized bladders (N=1 replicate with n=3 bladders per group). Scale bars are
100 µm. Images in the first row are slightly overexposed to facilitate the visualization of
individual cells. (b) Paraffin-embedded bladder sections were stained for keratin 20 (white), E-
cadherin (green), Trp63 (red), and nuclei (blue) and visualized by fluorescence microscopy.
Boxes denote examples of binucleate superficial cells (keratin 20+, Trp 63-, with a basolateral
layer of E-cadherin). Scale bars are 50 µm. Representative images are shown from N=3
experiments with sections from n=3 Adult Naive and Resolved and n=6 Sensitized mice. (c)
Nuclei were enumerated in all superficial cells (TRP63-, keratin 5
-, uroplakin IIIa
+, keratin 20
+
[weak/patchy staining observed in Sensitized mice], with a basolateral band of E-cadherin) in
stained bladder sections from the experiment in panel b, and the percentage of binucleate cells
was calculated. Only 5.3% of luminal cells in Sensitized mice were binucleate, compared to
23.4% and 23.3% of superficial cells in Adult Naive and Resolved mice, respectively. Shown is
the average percentage of binucleate superficial cells among all bladders from a given group of
mice; error bars represent standard error of the means; *** P < 0.001, Fisher’s exact test. Note
the smaller superficial cell size in Sensitized and Resolved mice relative to Adult Naive mice.

Supplementary Figure 7. Masson’s trichrome staining for collagen deposition did not
reveal fibrosis in convalescent mice. Shown are representative brightfield images of whole
bladder sections at 20x magnification from n=3-7 mice per group (N=2). Keratin and muscle
stain purple and collagen stains blue by this method3; in a blinded analysis, there was no
difference in collagen deposition among the mice.


Supplementary Figure 8. Whole bladder RNA-seq findings are in concordance with the
previously published urothelial membrane proteome. Of the 156 most significantly enriched
or depleted proteins in the Sensitized urothelial proteome4 (Padjusted < 0.01), 22 were also
significantly differentially expressed by RNA-seq (Padjusted < 0.05) (a) and the majority were
changed in the same direction (b), demonstrating that urothelial remodeling is at least partially
controlled at the transcriptional level. The 22 genes were among the most enriched/depleted
proteins from the proteomic analysis, and include cytoskeleton-associated proteins like keratin
14 (Krt14), septin-1 (Sept1) and formin-like protein-1 (Fmnl1); extracellular matrix-associated
proteins like collagen (Col6a1); cell death-associated proteins such as caspase 1 and gasdermins
Gsdmc2 and Gsdmc3; and the polymeric immunoglobulin receptor Pigr. See Supplementary
Table 2 for P values and fold changes. Proteomics data are from N=1 experiment with n=3 mice
per group4
and RNA-seq data are from N=1 experiment with n=7 Sensitized and n=6 Resolved
mice.


Supplementary Figure 9. UTI history impacted host responses at 6 hpi. Additional
representative scanning electron micrographs of the luminal surface of bladders at 6 hpi with 108
CFU UTI89 are shown. N=2 experiments with n=3-4 bladders per group. Curved arrows show
bacteria; arrowheads show neutrophils; “E” denotes regions of exfoliation. All scale bars are 10
µm; Adult Naive images are shown at a higher magnification (1000x) than Sensitized and
Resolved mice (500x) to facilitate the visualization of bacterial filaments. One rod-shaped
bacterium (denoted by a box) was detected in a Resolved bladder and is shown at 5000x
magnification directly underneath the lower magnification image.

Supplementary Figure 10. Intracellular bacterial communities (IBCs) were not detected in
Sensitized mice by a β-galactosidase activity assay. Mice were challenged with 107 CFU
UTI89 and sacrificed at 6 hpi. After X-gal staining for β-galactosidase activity, IBCs were
visualized using a dissection microscope. ** P < 0.01, *** P < 0.001, Mann-Whitney U test.
Data are from N=2 experiments performed in parallel by two separate investigators. Data points
represent actual values for each individual mouse.

Supplementary Figure 11. Intracellular bacterial communities (IBCs) were not detected in
Sensitized mice by immunofluorescence. Mice were challenged with 108 CFU UTI89 and
bladders were fixed in methacarn at 6 or 24 hpi, embedded in paraffin and sectioned.
Deparaffinized bladder sections were stained for E. coli (green) and uroplakin IIIa (red) and
visualized by epifluorescence. Shown are representative images at the same magnification from
n=3-5 bladders per mouse per time point from N=1 experiment. Scale bar is 200 µm.

Supplementary Figure 12. During convalescence, UTI history did not influence expression
of the COX-2 gene, Ptgs2. qRT-PCR was used to assess bladder Ptgs2 expression relative to
18S expression in mock-infected Adult Naive, Sensitized and Resolved bladders. Data points
represent actual values for each individual mouse, bars indicate median values and whiskers are
min to max values.
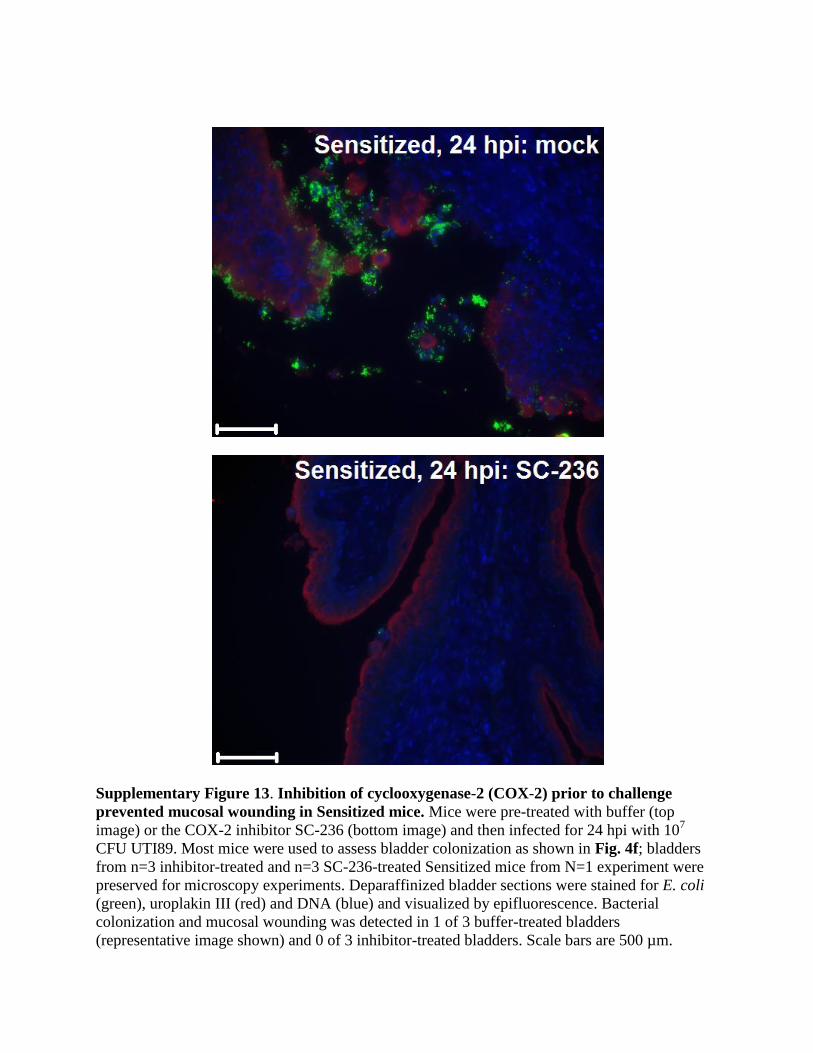
Supplementary Figure 13. Inhibition of cyclooxygenase-2 (COX-2) prior to challenge
prevented mucosal wounding in Sensitized mice. Mice were pre-treated with buffer (top
image) or the COX-2 inhibitor SC-236 (bottom image) and then infected for 24 hpi with 107
CFU UTI89. Most mice were used to assess bladder colonization as shown in Fig. 4f; bladders
from n=3 inhibitor-treated and n=3 SC-236-treated Sensitized mice from N=1 experiment were
preserved for microscopy experiments. Deparaffinized bladder sections were stained for E. coli
(green), uroplakin III (red) and DNA (blue) and visualized by epifluorescence. Bacterial
colonization and mucosal wounding was detected in 1 of 3 buffer-treated bladders
(representative image shown) and 0 of 3 inhibitor-treated bladders. Scale bars are 500 µm.

Supplementary Figure 14. Time course of FimH vaccination experiments in Sensitized
mice. The initial infection with 108 CFU UTI89 was shortened to two weeks, which is sufficient
to cause sensitization5. After antibiotic-induced convalescence, mice were vaccinated
subcutaneously with 15 μg FimCH (FimH adhesin in complex with its chaperone protein FimC)
emulsified 1:1 with Complete Freund’s Adjuvant (CFA) for the primary vaccine or Incomplete
Freund’s Adjuvant (IFA) for the boost. For negative controls, mice received buffer and
CFA/IFA, or 15 μg of the FimC chaperone protein alone and CFA/IFA. FimC was previously
shown not to be protective against UTI6. The buffer and FimC groups are combined and
presented as “mock” in Figure 4e and 4f as they were statistically indistinguishable. Five weeks
after boosting, mice were challenged with 107 CFU UTI89. Open circles indicate urine collection
to monitor infection status.

Supplementary Tables
Supplementary Table 1: Gene list from whole-bladder RNA-seq experiment, in which gene
expression was compared between Sensitized and Resolved mice during convalescence (four
weeks after the initiation of antibiotics). Significantly differentially expressed genes are shown in
green. Significance was determined using a Wald test and adjusted for multiple comparisons
using the Benjamini-Hochberg false-discovery rate correction, with Padjusted < 0.05 deemed
significantly differentially expressed. RNA-seq data has been deposited at NCBI under the
BioProject ID number PRJNA327807.
Supplementary Table 2: The fold changes in gene expression from whole-bladder RNA-seq,
compared to the fold enrichment/depletion of the most significantly enriched/depleted proteins
(Padjusted < 0.01) from a previously published analysis of the urothelial proteome enriched for
membrane-associated glycoproteins4 (grey columns). Genes/proteins that were significant in both
analyses are shown in green. N/A, not applicable (due to all samples in a group having no
counts).
Supplementary Table 3: Pathway analysis showing the canonical pathways enriched in the
differentially expressed genes in the RNA-seq experiment. See Legend in the second tab.
Supplementary Table 4: Broad meta-pathways assembled by Ingenuity IPA from the specific
enriched pathways given in Supplementary Table 3. In the histogram in Fig. 2e, the smallest P
value from the range of P values in column B is reported.

Supplementary References
1 Kline, K. A., Schwartz, D. J., Gilbert, N. M. & Lewis, A. L. Impact of host age and parity
on susceptibility to severe urinary tract infection in a murine model. PLoS One 9, e97798,
doi:10.1371/journal.pone.0097798 (2014).
2 Schwartz, D. J., Conover, M. S., Hannan, T. J. & Hultgren, S. J. Uropathogenic
Escherichia coli superinfection enhances the severity of mouse bladder infection. PLoS
Pathog 11, e1004599, doi:10.1371/journal.ppat.1004599 (2015).
3 Metcalfe, P. D. et al. Bladder outlet obstruction: progression from inflammation to
fibrosis. BJU international 106, 1686-1694, doi:10.1111/j.1464-410X.2010.09445.x
(2010).
4 Hannan, T. J. et al. Inhibition of Cyclooxygenase-2 Prevents Chronic and Recurrent
Cystitis. EBioMedicine 1, 46-57, doi:10.1016/j.ebiom.2014.10.011 (2014).
5 Hannan, T. J., Mysorekar, I. U., Hung, C. S., Isaacson-Schmid, M. L. & Hultgren, S. J.
Early severe inflammatory responses to uropathogenic E. coli predispose to chronic and
recurrent urinary tract infection. PLoS Pathog 6, e1001042,
doi:10.1371/journal.ppat.1001042 (2010).
6 Langermann, S. et al. Prevention of mucosal Escherichia coli infection by FimH-adhesin-
based systemic vaccination. Science 276, 607-611 (1997).