Embed Size (px)
Citation preview
1
Supplementary Information
Porous, functional, poly(styrene-co-divinylbenzene) monoliths synthesized by RAFT
Polymerization
Kristine J. Barlow (née Tan),* Xiaojuan Hao. Timothy C. Hughes, Oliver E. Hutt, Anastasios
Polyzos, Kathleen A. Turner and Graeme Moad*
CSIRO Materials Science & Engineering, Locked Bag 10, Clayton South, VIC 3169, Australia.
Email: [email protected], [email protected]
Contents 1. Kinetic investigations....................................................................................................................... 2
2. Characterisation of monoliths made in NMR tubes ......................................................................... 3
2.1. EDX mapping ............................................................................................................................ 3
2.2. Nitrogen adsorption ................................................................................................................... 4
2.3. Mercury intrusion porosimetry.................................................................................................. 5
3. Monoliths made in 10 mm i.d. columns for flow ............................................................................ 5
3.1. Characterisation in the dry state ................................................................................................ 5
3.1.1. EDX Mapping .................................................................................................................... 5
3.1.2. Nitrogen Adsorption .......................................................................................................... 6
3.2. Repeated backpressure measurements: run-to-run reproducibility ........................................... 7
3.3. Repeated monolith synthesis: batch-to-batch reproducibility ................................................... 8
3.4. Reaction of hydrazine with RAFT-containing monolith......................................................... 10
3.5. Expected degree of polymerization in post-grafting reaction solution ................................... 11
3.6. Characterisation of surface-grafted monoliths ........................................................................ 12
3.6.1. Elemental analysis ........................................................................................................... 12
3.6.2. X-ray photoelectron spectroscopy ................................................................................... 14
3.6.3. Analysis by 13C solid state NMR spectroscopy ............................................................... 15
4. References ...................................................................................................................................... 16
Electronic Supplementary Material (ESI) for Polymer ChemistryThis journal is © The Royal Society of Chemistry 2013
2
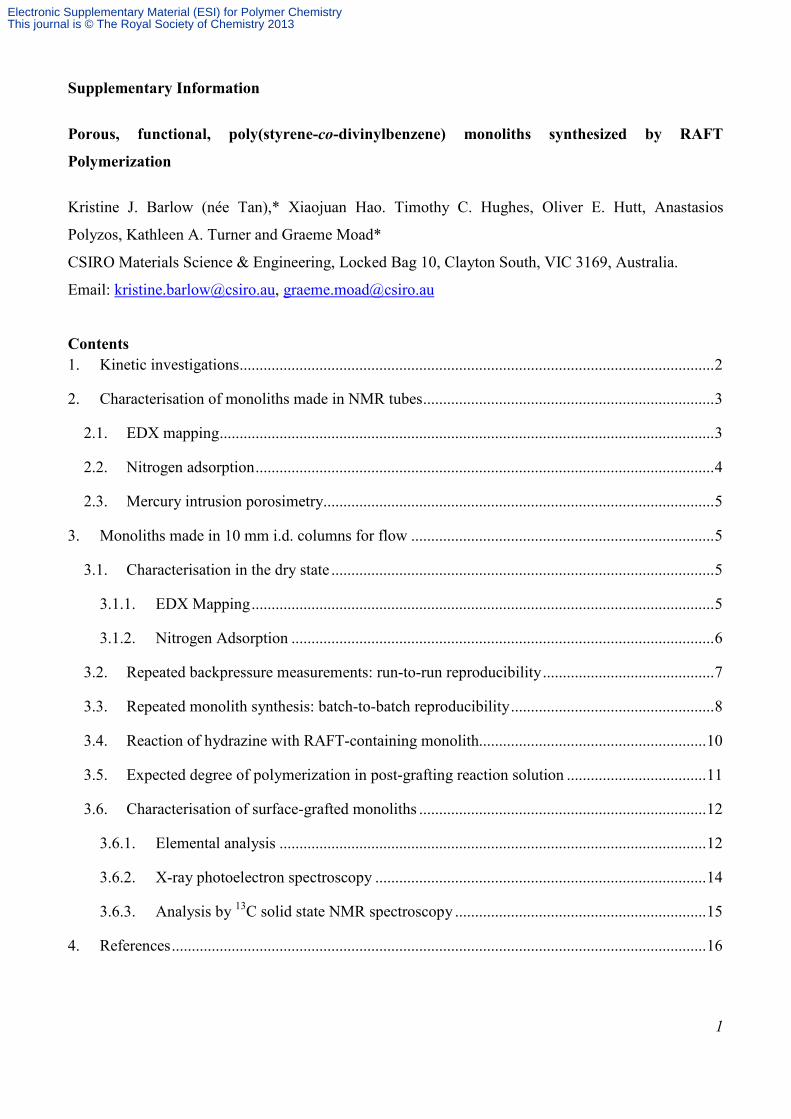
1. Kinetic investigations
Concentrations of monomer, initiator and RAFT compound used for in situ NMR kinetic studies are
shown in Table S1. In all experiments, the relative concentration of 2-cyano-2-propyl dodecyl
trithiocarbonate, [CPDTC]r, was varied, while the concentrations of azo(bisisobutyronitrile) (AIBN)
and monomers were constant.
Table S1: Concentrations of monomer, AIBN and RAFT compound used for kinetic studies and appearance after reaction. Volume used in NMR tube = 0.6 mL
Monomer solution
Concentrations used (mol/L) Appearance after 60 oC reaction for > 14 h, cooled
to RT Styrene Ethyl-styrene DVB AIBN CPDTC
A No DVB, a no CPDTC
3.98 0 0 0.0279 0 Viscous liquid with a solid plug
B No DVB, a [CPDTC]r = 2
3.98 0 0 0.0277 0.0554 Viscous, biphasic mixture
C b No CPDTC 2.61 0.257 1.12 0.0281 0 White solid
D b [CPDTC]r = 0.4
2.61 0.257 1.12 0.0276 0.0111 Pale yellow solid
E b [CPDTC]r = 1
2.61 0.257 1.12 0.0278 0.0277 Pale yellow solid
F b [CPDTC]r = 2
2.61 0.257 1.12 0.0280 0.0556 Yellow solid
G b [CPDTC]r = 10
2.61 0.257 1.12 0.0279 0.277 Bright yellow gel a Total monomer concentration (3.98 M) kept constant with respect to monolith conditions (entry C), by adding small excess of dodecanol. Vol ratios: styrene 46 vol%, dodecanol 49 vol%, benzene 5 vol%. b Concentrations of monomer and initiator: [Styrenes] = 2.87 M, [DVB] = 1.12 M, [AIBN] = 0.028 M.
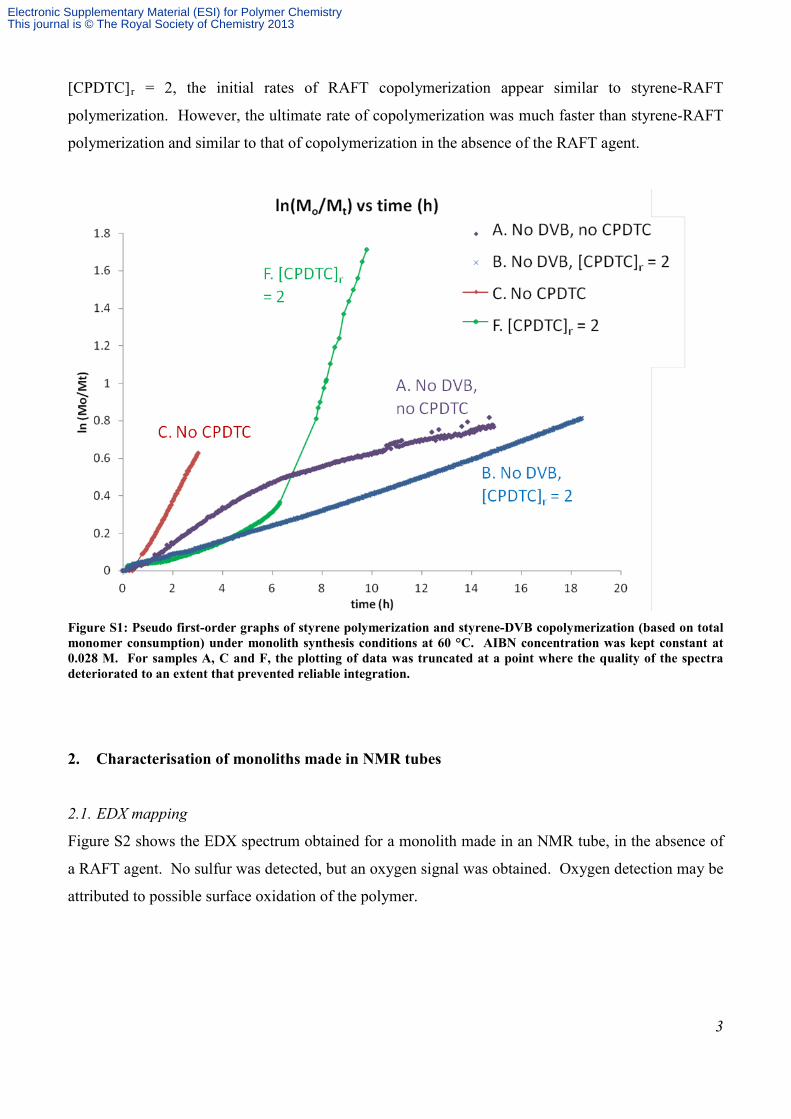
Pseudo first-order rate graphs of ln(Mo/Mt) against reaction time for entries A, B, C and F (Table S1)
are shown in Figure S1. The rate profile for conventional homopolymerization of styrene (absence of
the RAFT agent and DVB) is typical and displays acceleration due to the Trommsdorff effect (entry
A). Addition of CPDTC ([CPDTC]r = 2, entry B) to the polymerization mixture resulted in removal
or lessening of the Trommsdorf effect. Reaction at 60 °C for 14 h resulted in solidification of some
polymer in the reaction without the RAFT agent, and a biphasic mixture for the corresponding sample
with [CPDTC]r = 2. In spite of this phase separation, the RAFT compound had successfully regulated
the rate of styrene consumption. Comparing the gradients of the graphs resulting from styrene-DVB
copolymerization (Figure S1, entry F) and styrene homopolymerization (entry B), both obtained with
Electronic Supplementary Material (ESI) for Polymer ChemistryThis journal is © The Royal Society of Chemistry 2013
3
[CPDTC]r = 2, the initial rates of RAFT copolymerization appear similar to styrene-RAFT
polymerization. However, the ultimate rate of copolymerization was much faster than styrene-RAFT
polymerization and similar to that of copolymerization in the absence of the RAFT agent.
Figure S1: Pseudo first-order graphs of styrene polymerization and styrene-DVB copolymerization (based on total monomer consumption) under monolith synthesis conditions at 60 °C. AIBN concentration was kept constant at 0.028 M. For samples A, C and F, the plotting of data was truncated at a point where the quality of the spectra deteriorated to an extent that prevented reliable integration.
2. Characterisation of monoliths made in NMR tubes
2.1. EDX mapping
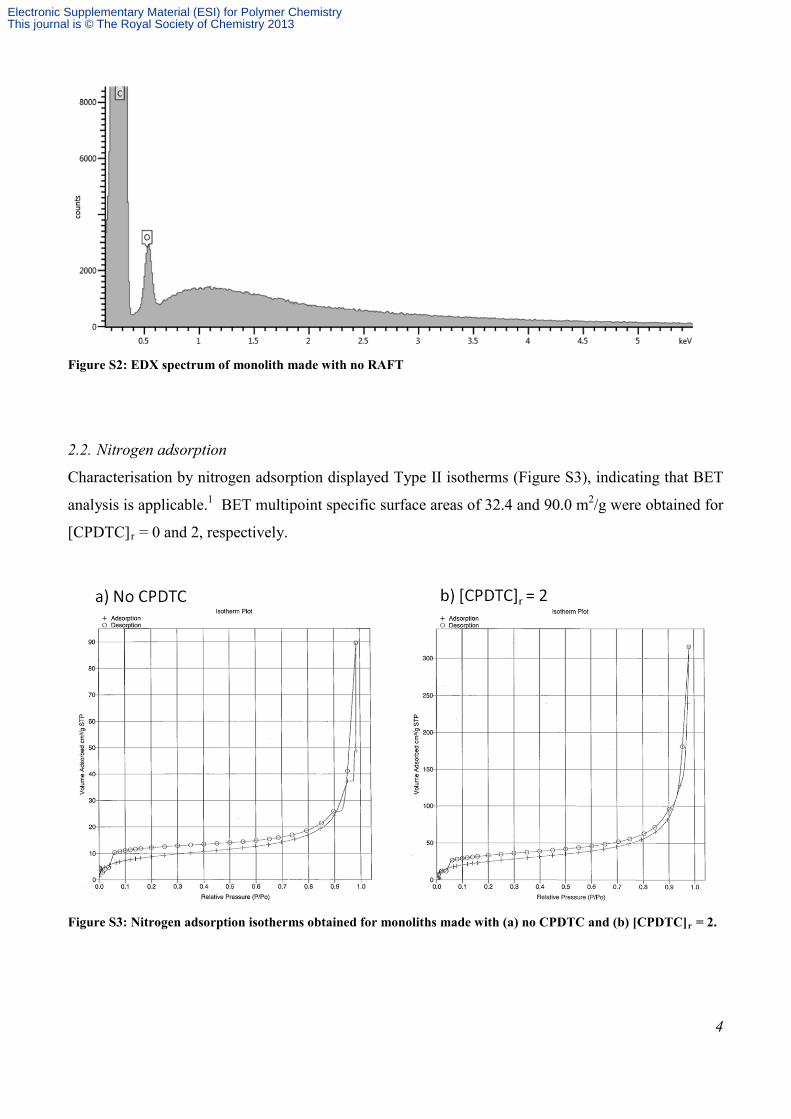
Figure S2 shows the EDX spectrum obtained for a monolith made in an NMR tube, in the absence of
a RAFT agent. No sulfur was detected, but an oxygen signal was obtained. Oxygen detection may be
attributed to possible surface oxidation of the polymer.
Electronic Supplementary Material (ESI) for Polymer ChemistryThis journal is © The Royal Society of Chemistry 2013
4
Figure S2: EDX spectrum of monolith made with no RAFT
2.2. Nitrogen adsorption
Characterisation by nitrogen adsorption displayed Type II isotherms (Figure S3), indicating that BET
analysis is applicable.1 BET multipoint specific surface areas of 32.4 and 90.0 m2/g were obtained for
[CPDTC]r = 0 and 2, respectively.
Figure S3: Nitrogen adsorption isotherms obtained for monoliths made with (a) no CPDTC and (b) [CPDTC]r = 2.
Electronic Supplementary Material (ESI) for Polymer ChemistryThis journal is © The Royal Society of Chemistry 2013
5
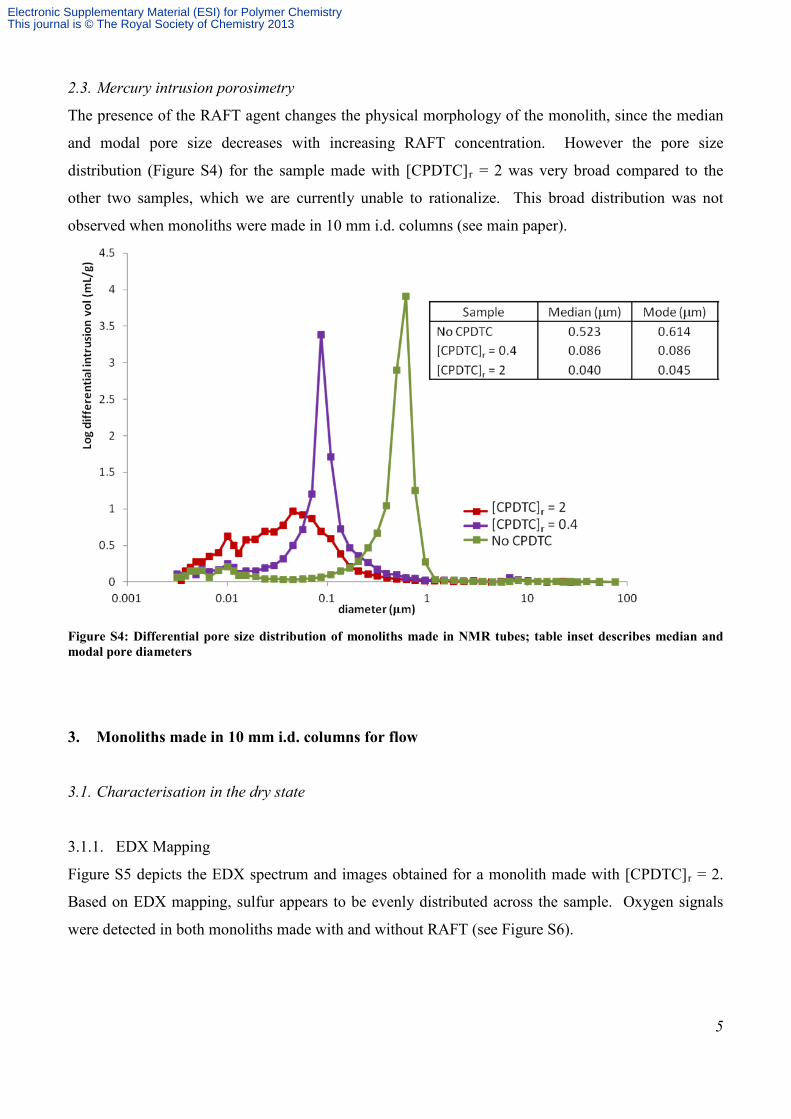
2.3. Mercury intrusion porosimetry
The presence of the RAFT agent changes the physical morphology of the monolith, since the median
and modal pore size decreases with increasing RAFT concentration. However the pore size
distribution (Figure S4) for the sample made with [CPDTC]r = 2 was very broad compared to the
other two samples, which we are currently unable to rationalize. This broad distribution was not
observed when monoliths were made in 10 mm i.d. columns (see main paper).
Figure S4: Differential pore size distribution of monoliths made in NMR tubes; table inset describes median and modal pore diameters
3. Monoliths made in 10 mm i.d. columns for flow
3.1. Characterisation in the dry state
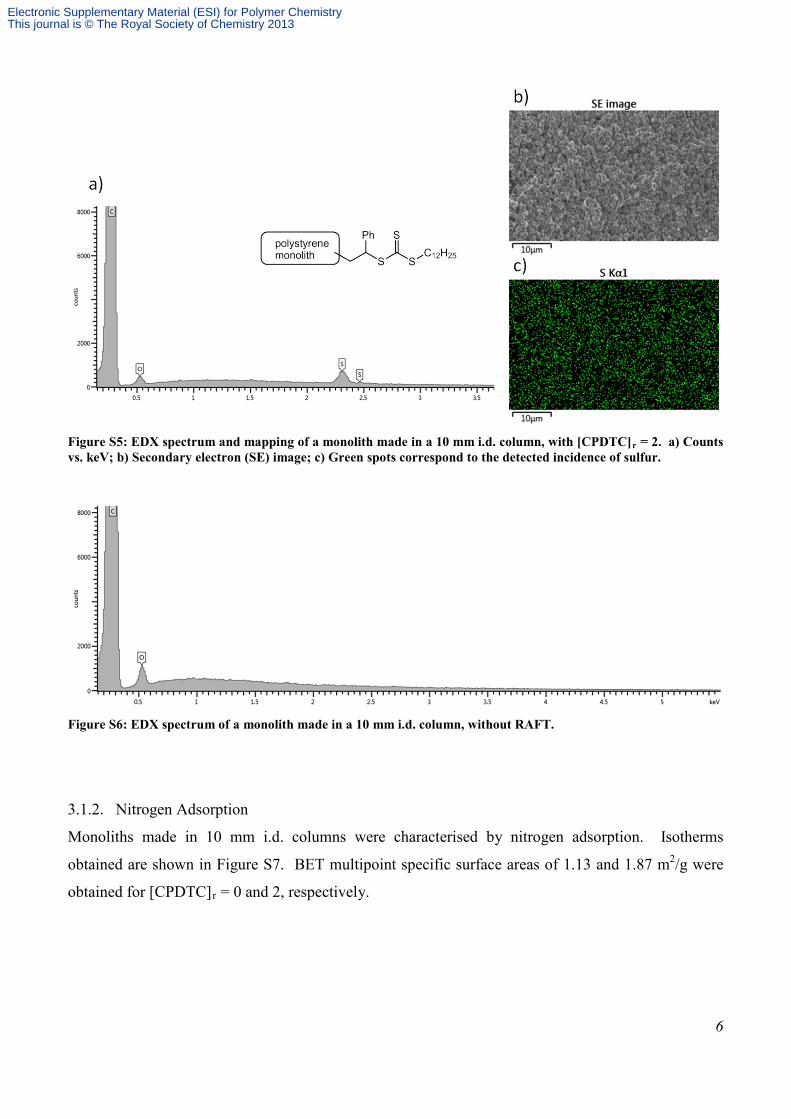
3.1.1. EDX Mapping
Figure S5 depicts the EDX spectrum and images obtained for a monolith made with [CPDTC]r = 2.
Based on EDX mapping, sulfur appears to be evenly distributed across the sample. Oxygen signals
were detected in both monoliths made with and without RAFT (see Figure S6).
Electronic Supplementary Material (ESI) for Polymer ChemistryThis journal is © The Royal Society of Chemistry 2013
6
Figure S5: EDX spectrum and mapping of a monolith made in a 10 mm i.d. column, with [CPDTC]r = 2. a) Counts vs. keV; b) Secondary electron (SE) image; c) Green spots correspond to the detected incidence of sulfur.
Figure S6: EDX spectrum of a monolith made in a 10 mm i.d. column, without RAFT.
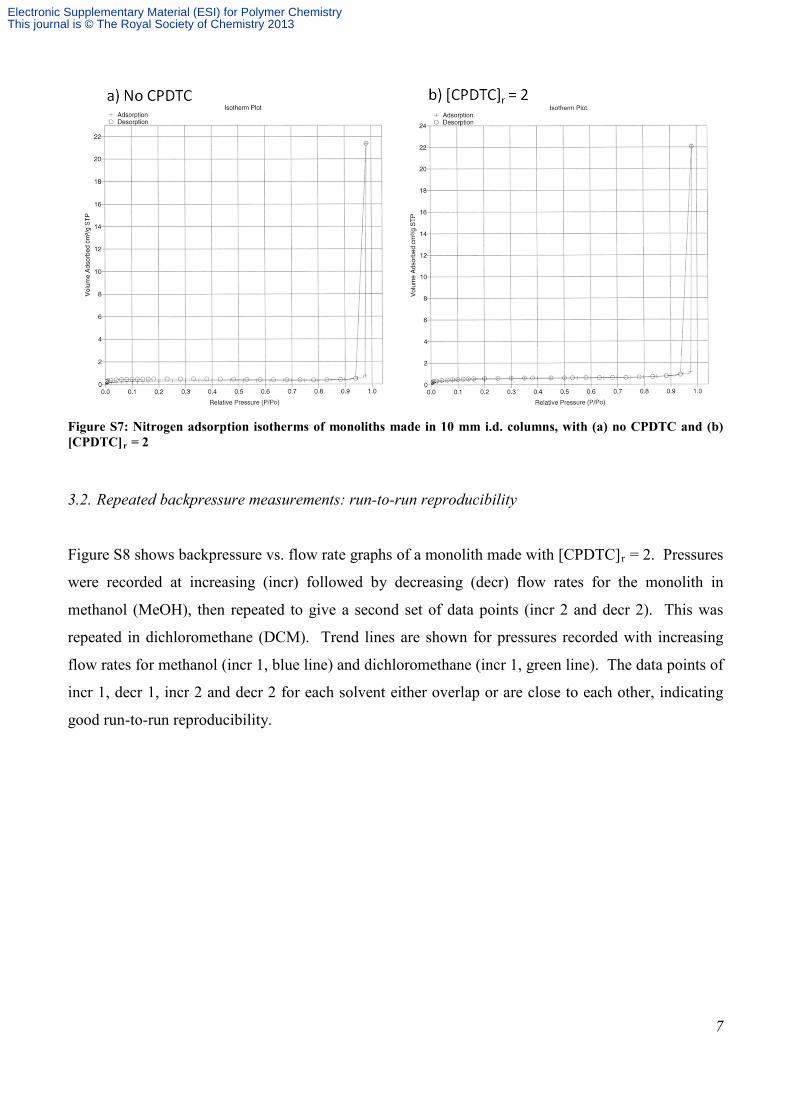
3.1.2. Nitrogen Adsorption
Monoliths made in 10 mm i.d. columns were characterised by nitrogen adsorption. Isotherms
obtained are shown in Figure S7. BET multipoint specific surface areas of 1.13 and 1.87 m2/g were
obtained for [CPDTC]r = 0 and 2, respectively.
Electronic Supplementary Material (ESI) for Polymer ChemistryThis journal is © The Royal Society of Chemistry 2013
7
Figure S7: Nitrogen adsorption isotherms of monoliths made in 10 mm i.d. columns, with (a) no CPDTC and (b) [CPDTC]r = 2
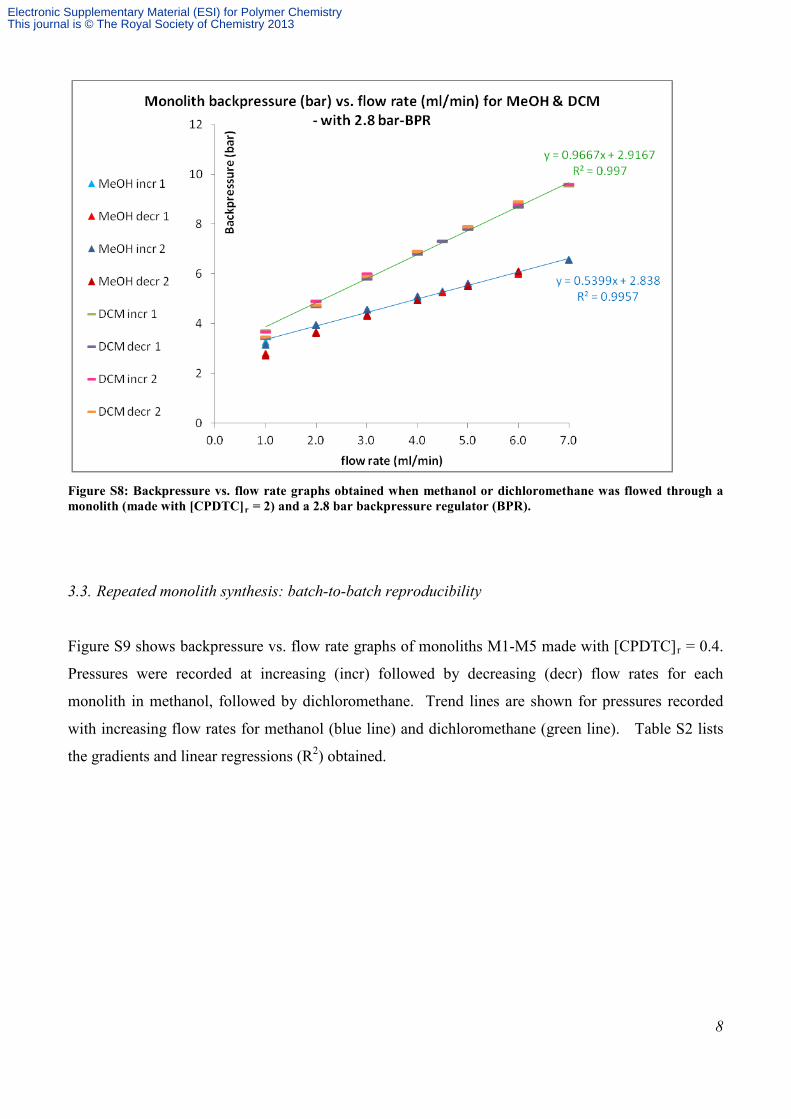
3.2. Repeated backpressure measurements: run-to-run reproducibility
Figure S8 shows backpressure vs. flow rate graphs of a monolith made with [CPDTC]r = 2. Pressures
were recorded at increasing (incr) followed by decreasing (decr) flow rates for the monolith in
methanol (MeOH), then repeated to give a second set of data points (incr 2 and decr 2). This was
repeated in dichloromethane (DCM). Trend lines are shown for pressures recorded with increasing
flow rates for methanol (incr 1, blue line) and dichloromethane (incr 1, green line). The data points of
incr 1, decr 1, incr 2 and decr 2 for each solvent either overlap or are close to each other, indicating
good run-to-run reproducibility.
Electronic Supplementary Material (ESI) for Polymer ChemistryThis journal is © The Royal Society of Chemistry 2013
8
Figure S8: Backpressure vs. flow rate graphs obtained when methanol or dichloromethane was flowed through a monolith (made with [CPDTC]r = 2) and a 2.8 bar backpressure regulator (BPR).
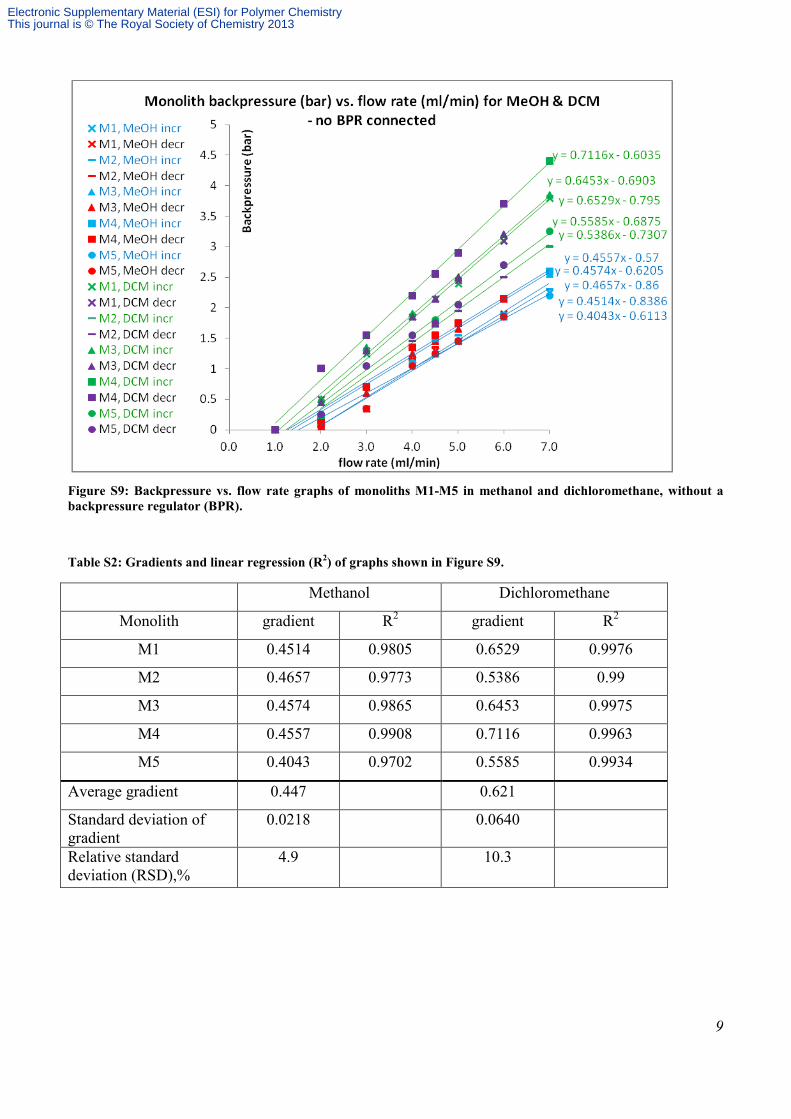
3.3. Repeated monolith synthesis: batch-to-batch reproducibility
Figure S9 shows backpressure vs. flow rate graphs of monoliths M1-M5 made with [CPDTC]r = 0.4.
Pressures were recorded at increasing (incr) followed by decreasing (decr) flow rates for each
monolith in methanol, followed by dichloromethane. Trend lines are shown for pressures recorded
with increasing flow rates for methanol (blue line) and dichloromethane (green line). Table S2 lists
the gradients and linear regressions (R2) obtained.
Electronic Supplementary Material (ESI) for Polymer ChemistryThis journal is © The Royal Society of Chemistry 2013
9
Figure S9: Backpressure vs. flow rate graphs of monoliths M1-M5 in methanol and dichloromethane, without a backpressure regulator (BPR).
Table S2: Gradients and linear regression (R2) of graphs shown in Figure S9.
Methanol Dichloromethane
Monolith gradient R2 gradient R2
M1 0.4514 0.9805 0.6529 0.9976
M2 0.4657 0.9773 0.5386 0.99
M3 0.4574 0.9865 0.6453 0.9975
M4 0.4557 0.9908 0.7116 0.9963
M5 0.4043 0.9702 0.5585 0.9934
Average gradient 0.447 0.621
Standard deviation of gradient
0.0218 0.0640
Relative standard deviation (RSD),%
4.9 10.3
Electronic Supplementary Material (ESI) for Polymer ChemistryThis journal is © The Royal Society of Chemistry 2013
10
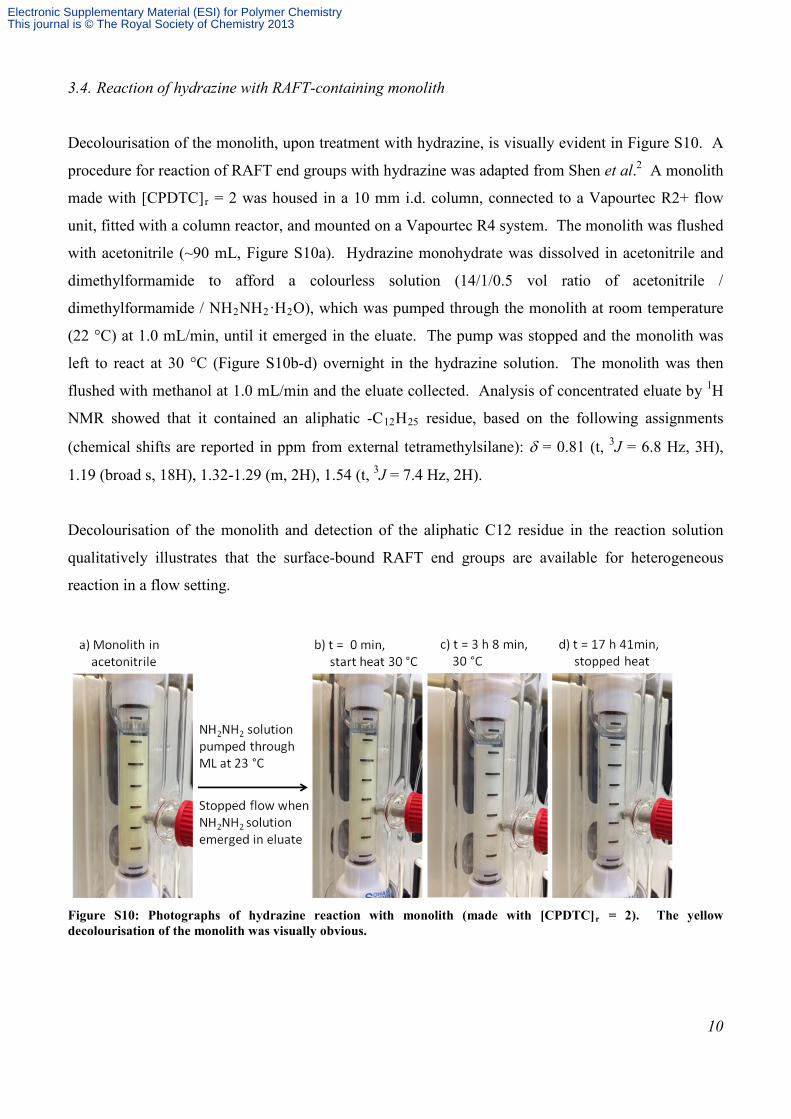
3.4. Reaction of hydrazine with RAFT-containing monolith
Decolourisation of the monolith, upon treatment with hydrazine, is visually evident in Figure S10. A
procedure for reaction of RAFT end groups with hydrazine was adapted from Shen et al.2 A monolith
made with [CPDTC]r = 2 was housed in a 10 mm i.d. column, connected to a Vapourtec R2+ flow
unit, fitted with a column reactor, and mounted on a Vapourtec R4 system. The monolith was flushed
with acetonitrile (~90 mL, Figure S10a). Hydrazine monohydrate was dissolved in acetonitrile and
dimethylformamide to afford a colourless solution (14/1/0.5 vol ratio of acetonitrile /
dimethylformamide / NH2NH2·H2O), which was pumped through the monolith at room temperature
(22 °C) at 1.0 mL/min, until it emerged in the eluate. The pump was stopped and the monolith was
left to react at 30 °C (Figure S10b-d) overnight in the hydrazine solution. The monolith was then
flushed with methanol at 1.0 mL/min and the eluate collected. Analysis of concentrated eluate by 1H
NMR showed that it contained an aliphatic -C12H25 residue, based on the following assignments
(chemical shifts are reported in ppm from external tetramethylsilane): δ = 0.81 (t, 3J = 6.8 Hz, 3H),
1.19 (broad s, 18H), 1.32-1.29 (m, 2H), 1.54 (t, 3J = 7.4 Hz, 2H).
Decolourisation of the monolith and detection of the aliphatic C12 residue in the reaction solution
qualitatively illustrates that the surface-bound RAFT end groups are available for heterogeneous
reaction in a flow setting.
Figure S10: Photographs of hydrazine reaction with monolith (made with [CPDTC]r = 2). The yellow decolourisation of the monolith was visually obvious.
Electronic Supplementary Material (ESI) for Polymer ChemistryThis journal is © The Royal Society of Chemistry 2013
11
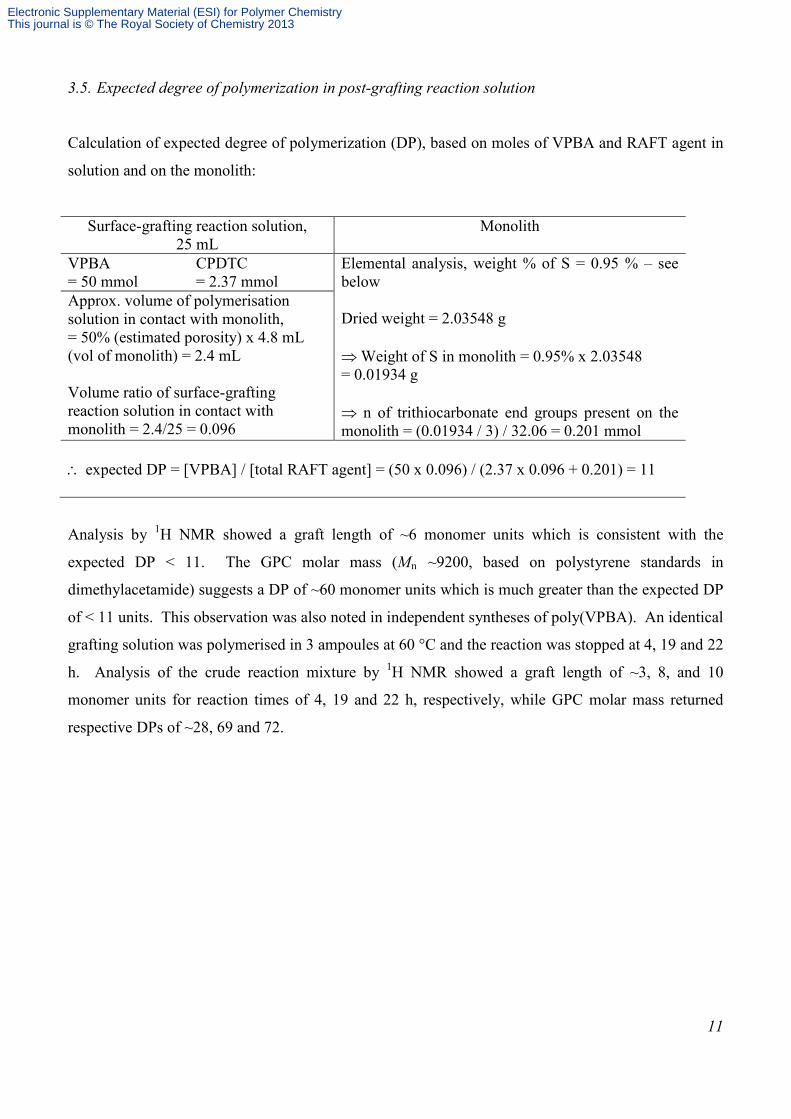
3.5. Expected degree of polymerization in post-grafting reaction solution
Calculation of expected degree of polymerization (DP), based on moles of VPBA and RAFT agent in
solution and on the monolith:
Surface-grafting reaction solution, 25 mL
Monolith
VPBA = 50 mmol
CPDTC = 2.37 mmol
Elemental analysis, weight % of S = 0.95 % – see below Dried weight = 2.03548 g ⇒ Weight of S in monolith = 0.95% x 2.03548 = 0.01934 g ⇒ n of trithiocarbonate end groups present on the monolith = (0.01934 / 3) / 32.06 = 0.201 mmol
Approx. volume of polymerisation solution in contact with monolith, = 50% (estimated porosity) x 4.8 mL (vol of monolith) = 2.4 mL Volume ratio of surface-grafting reaction solution in contact with monolith = 2.4/25 = 0.096 ∴ expected DP = [VPBA] / [total RAFT agent] = (50 x 0.096) / (2.37 x 0.096 + 0.201) = 11
Analysis by 1H NMR showed a graft length of ~6 monomer units which is consistent with the
expected DP < 11. The GPC molar mass (Mn ~9200, based on polystyrene standards in
dimethylacetamide) suggests a DP of ~60 monomer units which is much greater than the expected DP
of < 11 units. This observation was also noted in independent syntheses of poly(VPBA). An identical
grafting solution was polymerised in 3 ampoules at 60 °C and the reaction was stopped at 4, 19 and 22
h. Analysis of the crude reaction mixture by 1H NMR showed a graft length of ~3, 8, and 10
monomer units for reaction times of 4, 19 and 22 h, respectively, while GPC molar mass returned
respective DPs of ~28, 69 and 72.
Electronic Supplementary Material (ESI) for Polymer ChemistryThis journal is © The Royal Society of Chemistry 2013
12
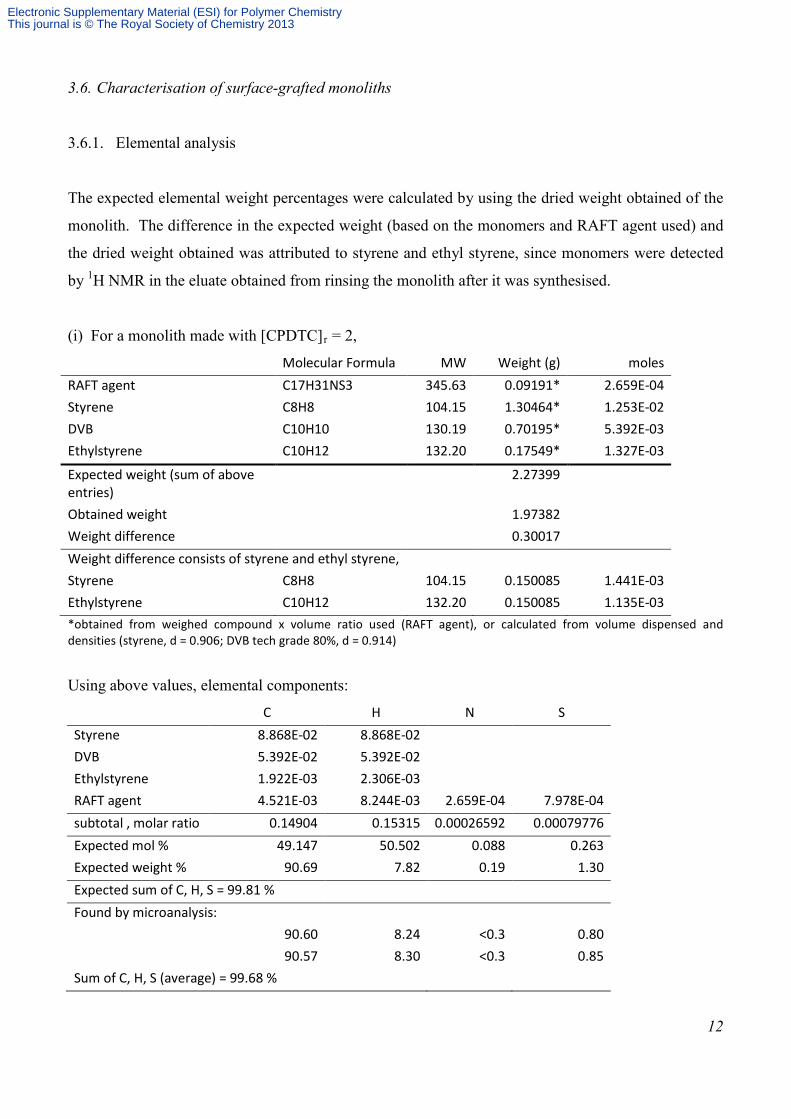
3.6. Characterisation of surface-grafted monoliths
3.6.1. Elemental analysis
The expected elemental weight percentages were calculated by using the dried weight obtained of the
monolith. The difference in the expected weight (based on the monomers and RAFT agent used) and
the dried weight obtained was attributed to styrene and ethyl styrene, since monomers were detected
by 1H NMR in the eluate obtained from rinsing the monolith after it was synthesised.
(i) For a monolith made with [CPDTC]r = 2,
Molecular Formula MW Weight (g) moles RAFT agent C17H31NS3 345.63 0.09191* 2.659E-04 Styrene C8H8 104.15 1.30464* 1.253E-02 DVB C10H10 130.19 0.70195* 5.392E-03 Ethylstyrene C10H12 132.20 0.17549* 1.327E-03
Expected weight (sum of above entries)
2.27399
Obtained weight 1.97382 Weight difference 0.30017 Weight difference consists of styrene and ethyl styrene, Styrene C8H8 104.15 0.150085 1.441E-03 Ethylstyrene C10H12 132.20 0.150085 1.135E-03 *obtained from weighed compound x volume ratio used (RAFT agent), or calculated from volume dispensed and densities (styrene, d = 0.906; DVB tech grade 80%, d = 0.914)
Using above values, elemental components:
C H N S
Styrene 8.868E-02 8.868E-02 DVB 5.392E-02 5.392E-02 Ethylstyrene 1.922E-03 2.306E-03 RAFT agent 4.521E-03 8.244E-03 2.659E-04 7.978E-04
subtotal , molar ratio 0.14904 0.15315 0.00026592 0.00079776 Expected mol % 49.147 50.502 0.088 0.263 Expected weight % 90.69 7.82 0.19 1.30 Expected sum of C, H, S = 99.81 %
Found by microanalysis:
90.60 8.24 <0.3 0.80
90.57 8.30 <0.3 0.85
Sum of C, H, S (average) = 99.68 %
Electronic Supplementary Material (ESI) for Polymer ChemistryThis journal is © The Royal Society of Chemistry 2013

13
(ii) For a poly(VPBA)-grafted monolith, (monolith made with [CPDTC]r = 2),
Weight gain = 61.7 mg from 1.97382g (ie, 3.1% wt gain)
Molecular Formula MW Weight (g) moles RAFT agent C17H31NS3 345.63 0.09191* 2.659E-04 Styrene C8H8 104.15 1.30464* 1.253E-02 DVB C10H10 130.19 0.70195* 5.392E-03 Ethylstyrene C10H12 132.20 0.17549* 1.327E-03
Expected weight (sum of above entries)
2.27399
Obtained weight 1.97382 Weight difference 0.30017 Weight difference consists of styrene and ethyl styrene, Styrene C8H8 104.15 0.150085 1.441E-03 Ethylstyrene C10H12 132.20 0.150085 1.135E-03 Weight gain after grafting, VPBA C8H9BO2 147.97 0.0617 4.170E-04 *obtained from weighed compound x volume ratio used (RAFT agent), or calculated from volume dispensed and densities (styrene, d = 0.906; DVB tech grade 80%, d = 0.914)
Using above values, elemental components:
C H N S B O
Styrene 8.868E-02 8.868E-02 DVB 5.392E-02 5.392E-02 Ethylstyrene 1.922E-03 2.306E-03 RAFT agent 4.521E-03 8.244E-03 2.659E-04 7.978E-04
VPBA 3.336E-03 3.753E-03
4.170E-04 8.340E-04 subtotal, molar ratio 0.15238 0.15690 0.00026592 0.00079776 0.00041698 0.00083395 Expected mol % 48.903 50.355 0.085 0.256 0.134 0.268 Expected weight % 89.86 7.75 0.19 1.30 0.23 0.68 Expected sum of C, H, S = 98.94 %
Expected sum of N, B, O = 1.06 %
Found by microanalysis: (analysis of B and O was unavailable)
89.67 8.16 <0.3 0.95 89.88 8.25 <0.3 0.95
Sum of C, H, S (average) = 98.93 % N, B, O by difference = 1.07 %
The sums of C, H and S, determined by elemental analysis, decreased from 99.68 % to 98.93 % after
grafting. This decrease suggests incorporation of other elements due to the successful grafting
process.
Electronic Supplementary Material (ESI) for Polymer ChemistryThis journal is © The Royal Society of Chemistry 2013
14
3.6.2. X-ray photoelectron spectroscopy
X-ray photoelectron spectroscopy (XPS) analysis was performed using an AXIS Ultra DLD
spectrometer (Kratos Analytical Inc., Manchester, UK) with a monochromated Al Kα source at a
power of 180 W (15 kV × 12 mA), a hemispherical analyser operating in the fixed analyser
transmission mode and the standard aperture (analysis area: 0.3 mm × 0.7 mm). The total pressure in
the main vacuum chamber during analysis was typically between 10-9 and 10-8 mbar. Survey spectra
were acquired at a pass energy of 160 eV. To obtain more detailed information about chemical
structure, oxidation states etc., high resolution spectra were recorded from individual peaks at 20 eV
pass energy (yielding a typical peak width for polymers of 0.9 - 1.0 eV). Each specimen was analysed
at an emission angle of 0° as measured from the surface normal. Assuming typical values for the
electron attenuation length of relevant photoelectrons the XPS analysis depth (from which 95 % of the
detected signal originates) ranges between 5 and 10 nm. Data processing (quantification) was
performed using CasaXPS processing software version 2.3.15 (Casa Software Ltd., Teignmouth, UK).
All elements present were identified from survey spectra. The atomic concentrations of the detected
elements were calculated using integral peak intensities and the sensitivity factors supplied by the
manufacturer. Binding energies were referenced to the aliphatic hydrocarbon peak at 285.0 eV. The
accuracy associated with quantitative XPS is ca. 10 % - 15 %. Precision (ie. reproducibility) depends
on the signal/noise ratio but is usually much better than 5%.
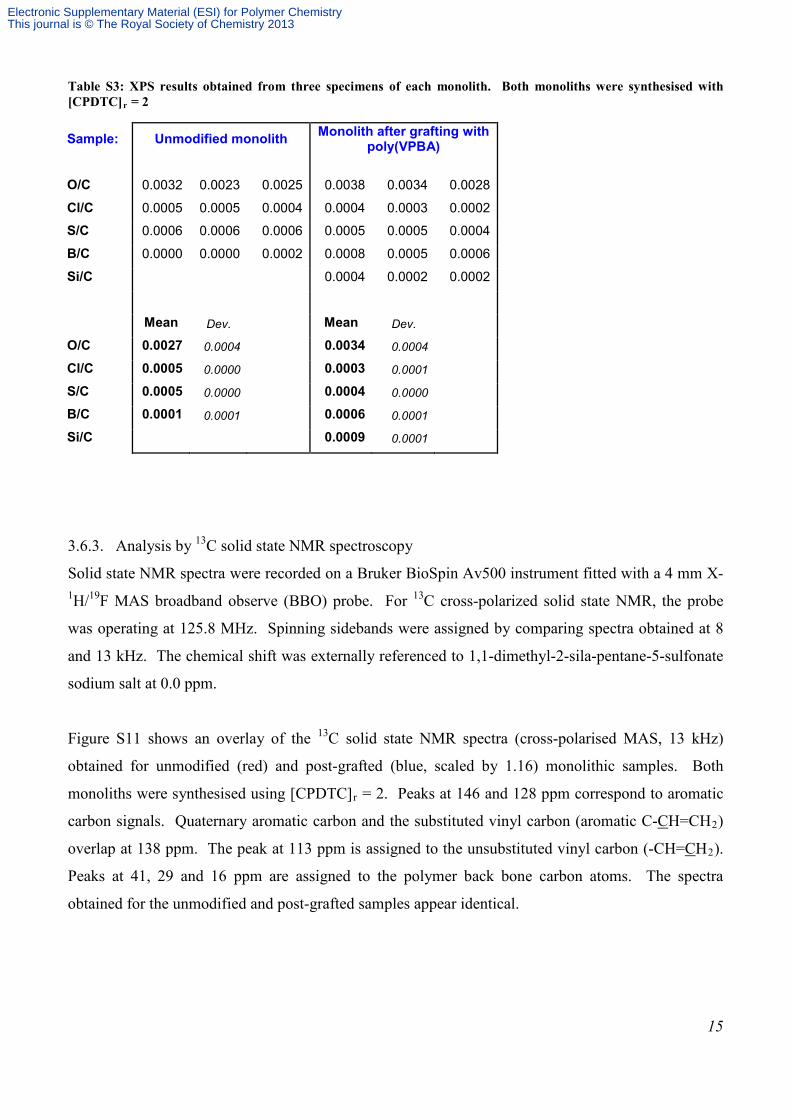
XPS analysis was performed to obtain relative elemental information at a monolith’s surface, before
and after grafting. Both monoliths were synthesised with [CPDTC]r = 2. Three specimens from each
freshly fractured monolith were analysed. The data in Table S3 describes the relative amount of an
element as a ratio of carbon. The mean amount of oxygen and boron has increased after grafting,
indicating successful incorporation of the boronic acid moiety, while the mean amount of sulfur
remained relatively unchanged.
Electronic Supplementary Material (ESI) for Polymer ChemistryThis journal is © The Royal Society of Chemistry 2013
15
Table S3: XPS results obtained from three specimens of each monolith. Both monoliths were synthesised with [CPDTC]r = 2
Sample: Unmodified monolith Monolith after grafting with poly(VPBA)
O/C 0.0032 0.0023 0.0025 0.0038 0.0034 0.0028
Cl/C 0.0005 0.0005 0.0004 0.0004 0.0003 0.0002
S/C 0.0006 0.0006 0.0006 0.0005 0.0005 0.0004
B/C 0.0000 0.0000 0.0002 0.0008 0.0005 0.0006
Si/C
0.0004 0.0002 0.0002
Mean Dev. Mean Dev.
O/C 0.0027 0.0004 0.0034 0.0004
Cl/C 0.0005 0.0000 0.0003 0.0001
S/C 0.0005 0.0000 0.0004 0.0000
B/C 0.0001 0.0001 0.0006 0.0001
Si/C 0.0009 0.0001
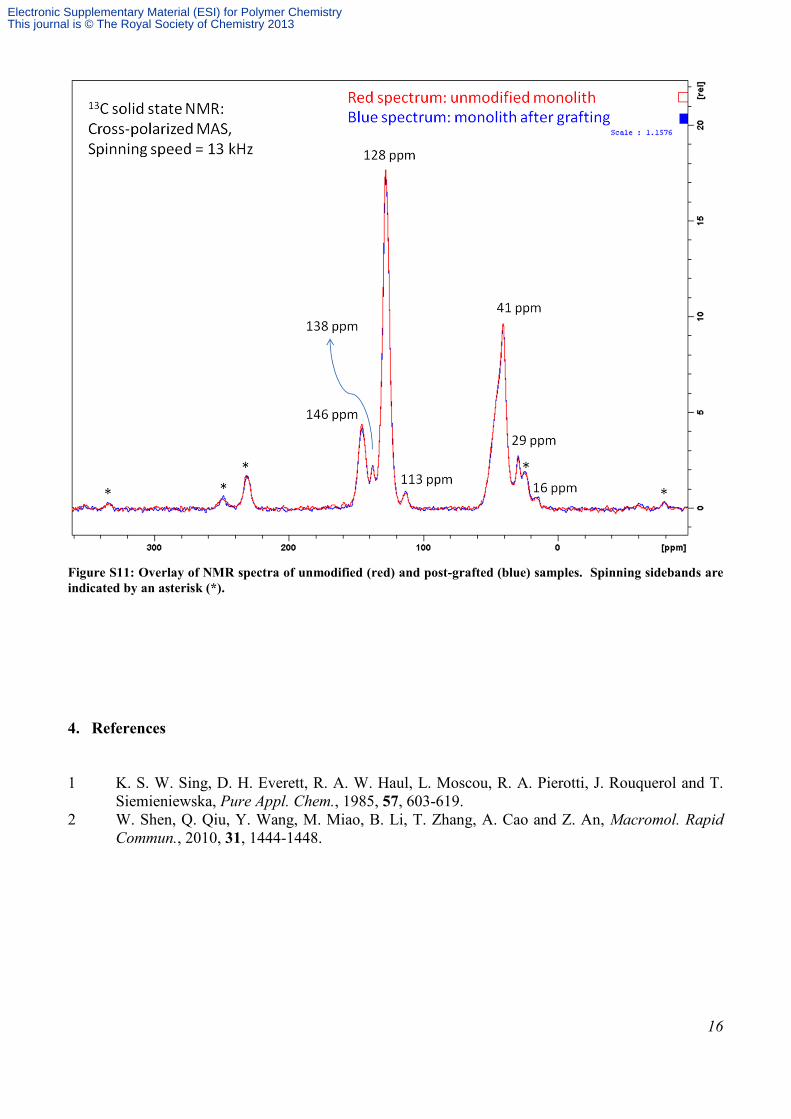
3.6.3. Analysis by 13C solid state NMR spectroscopy
Solid state NMR spectra were recorded on a Bruker BioSpin Av500 instrument fitted with a 4 mm X-1H/19F MAS broadband observe (BBO) probe. For 13C cross-polarized solid state NMR, the probe
was operating at 125.8 MHz. Spinning sidebands were assigned by comparing spectra obtained at 8
and 13 kHz. The chemical shift was externally referenced to 1,1-dimethyl-2-sila-pentane-5-sulfonate
sodium salt at 0.0 ppm.
Figure S11 shows an overlay of the 13C solid state NMR spectra (cross-polarised MAS, 13 kHz)
obtained for unmodified (red) and post-grafted (blue, scaled by 1.16) monolithic samples. Both
monoliths were synthesised using [CPDTC]r = 2. Peaks at 146 and 128 ppm correspond to aromatic
carbon signals. Quaternary aromatic carbon and the substituted vinyl carbon (aromatic C-CH=CH2)
overlap at 138 ppm. The peak at 113 ppm is assigned to the unsubstituted vinyl carbon (-CH=CH2).
Peaks at 41, 29 and 16 ppm are assigned to the polymer back bone carbon atoms. The spectra
obtained for the unmodified and post-grafted samples appear identical.
Electronic Supplementary Material (ESI) for Polymer ChemistryThis journal is © The Royal Society of Chemistry 2013
16
Figure S11: Overlay of NMR spectra of unmodified (red) and post-grafted (blue) samples. Spinning sidebands are indicated by an asterisk (*).
4. References
1 K. S. W. Sing, D. H. Everett, R. A. W. Haul, L. Moscou, R. A. Pierotti, J. Rouquerol and T. Siemieniewska, Pure Appl. Chem., 1985, 57, 603-619.
2 W. Shen, Q. Qiu, Y. Wang, M. Miao, B. Li, T. Zhang, A. Cao and Z. An, Macromol. Rapid Commun., 2010, 31, 1444-1448.
Electronic Supplementary Material (ESI) for Polymer ChemistryThis journal is © The Royal Society of Chemistry 2013


![Weak Temperature Dependence of Structure in Hydrophobic … · 2016. 7. 20. · styrene and sodium styrene sulfonate [poly-(sodium styrene sulfonate) f-(styrene) 1 f] (PSSNa) whose](https://img.dokumen.tips/doc/110x75/6121e88d85512935481dfaad/weak-temperature-dependence-of-structure-in-hydrophobic-2016-7-20-styrene-and.jpg)