Embed Size (px)
Citation preview

Supplementary information
Supplementary information for“How copper catalyzes the electroreductionof carbon dioxide into hydrocarbon fuels”
Andrew A. Peterson, Frank Abild-Pedersen, Felix Studt,Jan Rossmeisl, Jens K. Nørskov
Center for Atomic-scale Materials Design, Department of Physics,Technical University of Denmark, DK-2800 Lyngby, Denmark.
1 Computational hydrogen electrodeA reaction pathway (shown in Figure S1) involving 41 reaction intermediates was analyzed inthe current work. The free energy change of each step that involves an electrochemical proton-electron transfer will be a function of the applied electrical potential. The effect of applyingthis potential was based upon a technique, described earlier by Nørskov et al. [1], which we areherein referring to as the computational hydrogen electrode (CHE) model. This technique alsoprovides an elegant way of avoiding the explicit treatment of solvated protons.
In this technique, zero voltage is defined based on the reversible hydrogen electrode (RHE),in which the reaction
H+ + e− ←→ 12H2 (1)
is defined to be in equilibrium at zero voltage, at all values of pH, at all temperatures, andwith H2 at 101325 Pa pressure. Therefore, in the CHE, the chemical potential of a proton-electron pair, µ(H+) + µ(e−) is equal to half of the chemical potential of gaseous hydrogen (1/2µ(H2)) at a potential of 0 V. In this way, the chemical potential of the proton-electron pair can becalculated simply by calculating the chemical potential of gas-phase H2. The chemical potentialof the proton-electron pair can be adjusted as a function of the applied potential by the standardrelation between chemical and electrical potential, ∆G = −eU , where e is the elementarypositive charge and U is the applied bias. Since the RHE is defined to be at 0 V at all pH values,a pH correction is not needed. Thus, the total chemical potential of the proton-electron pair asa function of applied potential, at all temperature and pH values, can be calculated as
µ(H+) + µ(e−) =1
2µ(H2(g))− eU (2)
As an example, to calculate the free energy change from State 3 (adsorbed CO) to State 23(adsorbed CHO), the free energy change of the below chemical reaction needs to be calculated:
CO∗+ (H+ + e−) −→ CHO∗ (3)
where an asterisk (∗) indicates that the species is adsorbed on the copper surface. The freeenergy change of this reaction would thus be:
Page S1
Supplementary Material (ESI) for Energy & Environmental Science.This journal is © Royal Society of Chemistry 2010
Supplementary information
�� � � � � � � �
��
�
��
�
�
��
��
��
�
��
��
��
��
��
��
��
��
��
��
��
��
��
�
���
��
��
��
��
��
�
��
�
��
��
��
�
��
���
�
�
��
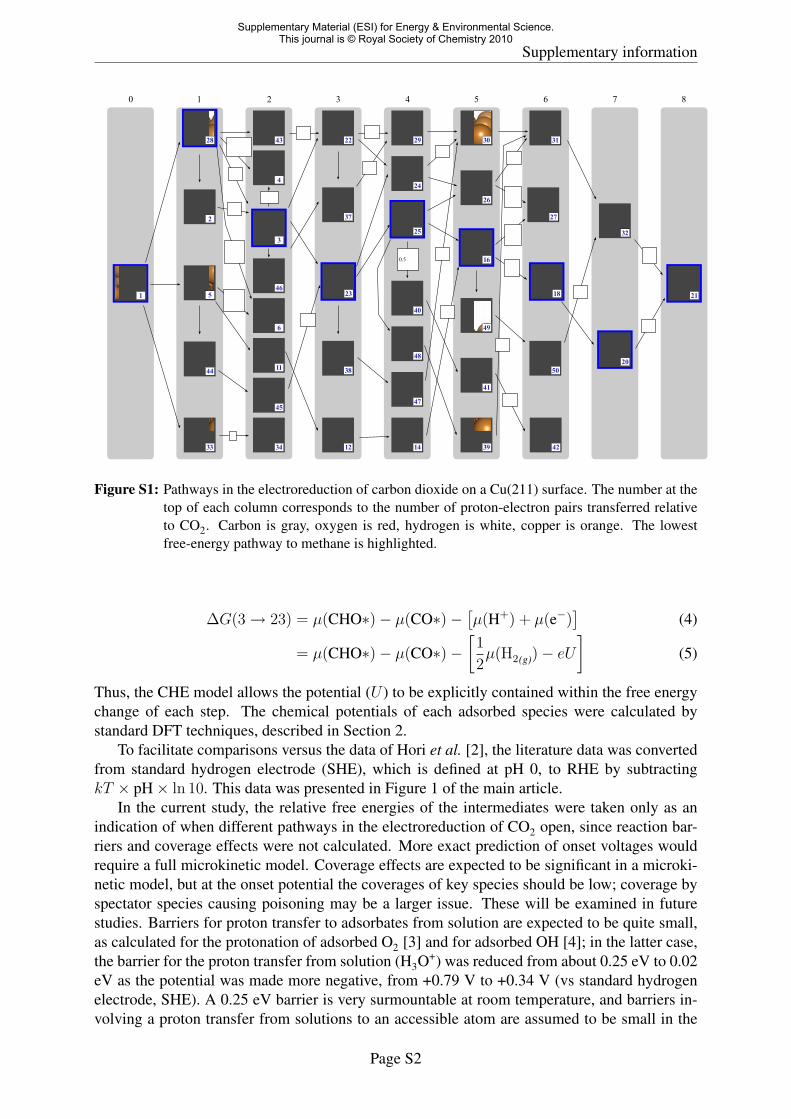
Figure S1: Pathways in the electroreduction of carbon dioxide on a Cu(211) surface. The number at thetop of each column corresponds to the number of proton-electron pairs transferred relativeto CO2. Carbon is gray, oxygen is red, hydrogen is white, copper is orange. The lowestfree-energy pathway to methane is highlighted.
∆G(3→ 23) = µ(CHO∗)− µ(CO∗)−[µ(H+) + µ(e−)
](4)
= µ(CHO∗)− µ(CO∗)−[
1
2µ(H2(g))− eU
](5)
Thus, the CHE model allows the potential (U ) to be explicitly contained within the free energychange of each step. The chemical potentials of each adsorbed species were calculated bystandard DFT techniques, described in Section 2.
To facilitate comparisons versus the data of Hori et al. [2], the literature data was convertedfrom standard hydrogen electrode (SHE), which is defined at pH 0, to RHE by subtractingkT × pH× ln 10. This data was presented in Figure 1 of the main article.
In the current study, the relative free energies of the intermediates were taken only as anindication of when different pathways in the electroreduction of CO2 open, since reaction bar-riers and coverage effects were not calculated. More exact prediction of onset voltages wouldrequire a full microkinetic model. Coverage effects are expected to be significant in a microki-netic model, but at the onset potential the coverages of key species should be low; coverage byspectator species causing poisoning may be a larger issue. These will be examined in futurestudies. Barriers for proton transfer to adsorbates from solution are expected to be quite small,as calculated for the protonation of adsorbed O2 [3] and for adsorbed OH [4]; in the latter case,the barrier for the proton transfer from solution (H3O+) was reduced from about 0.25 eV to 0.02eV as the potential was made more negative, from +0.79 V to +0.34 V (vs standard hydrogenelectrode, SHE). A 0.25 eV barrier is very surmountable at room temperature, and barriers in-volving a proton transfer from solutions to an accessible atom are assumed to be small in the
Page S2
Supplementary Material (ESI) for Energy & Environmental Science.This journal is © Royal Society of Chemistry 2010

Supplementary information
current study. This assumption will need to be validated for individual adsorbates in futurestudies, in particular when microkinetic modeling is undertaken.
2 Electronic structure calculations
2.1 Adsorbate energiesElectronic structure calculations were performed using density functional theory (DFT) with therevised Perdew-Burke-Ernzerhof (RPBE) [5] exchange-correlation functional in a plane wavepseudopotential implementation [6, 7] using the Dacapo DFT calculator in the ASE simulationenvironment [8, 9]. Calculations were carried out on the 211 step of the fcc Cu surface, usinga 3×3×3 (3×2×3 for small-molecule adsorptions) periodic cell with a 3.71 A lattice constantand with 12 A of vacuum. A stepped surface is used because they are generally found to be mostreactive for C-O bond-breaking [10] – a process of critical importance here. Standard dipolecorrections were employed, and field effects were investigated, but found to be minimal inaccordance with Karlberg et al. [11] and not included. Plane wave and density cut-off energiesof 340 and 500 eV, respectively, were employed with a Fermi-level smearing width of 0.1eV and (4,4,1) k-point sampling. Geometries were optimized and the lowest energy bindinglocation is reported.
The electronic energies of all intermediate states reported in this study (and shown in Fig-ure 2 of the main article) are summarized in Tables S1 and S2. In these tables, the lowest energybonding site and optimized geometry are shown for all adsorbates. States with multiple adsor-bates (e.g., state 2) are calculated by summing the calculations of the two individual adsorbates,thus keeping coverages consistent between states. The electronic energy difference between the(slab + adsorbate) and the clean slab is reported in the tables, not including any free energycorrections or hydrogen-bond stabilization.
Free energies of adsorbates were calculated by treating all 3N degrees of freedom of theadsorbate as vibrational and assuming that any changes in the vibrations of the copper surfacecaused by the presence of the adsorbate were minimal, in accordance with Jones et al. [12].Modes of vibration were found by performing a normal-mode analysis; all vibrations weretreated in the harmonic oscillator approximation. Zero-point energies, entropies, and heat ca-pacities were calculated from these vibrations by standard methods [13] and used to convertthe electronic energies into free energies at 18.5◦C (to permit comparison to the data of Hori etal. [2]). The contribution to the free energy for each adsorbate involved in the lowest-energypathways are listed in Table S3. We include solvation at the water-solid interface approxi-mately by exploiting the findings that hydroxyl adsorbates (OH*) exposed to the liquid waterwere found to be stabilized by approximately 0.5 eV [1, 14, 15], and hydroxyl that is indirectlybound to the surface through other atoms, *R-OH, may be stabilized by 0.25 eV (as shown forOOH) [4]. The solvent stabilization of adsorbed CO was calculated in the present study byan identical method, employing a hexagonal water overlayer above a CO group adsorbed on aCu 111 surface. This resulted in a CO* stabilization of 0.1 eV which was applied to CO* andCHO*.
2.2 Non-adsorbed species and gas-phase correctionElectronic structure calculations of non-adsorbed species were performed using the same tech-niques as described above for adsorbed species, except with a Fermi-level smearing of 0.01eV. Electronic energies (E) of gas-phase species were converted into chemical potentials (µ) at
Page S3
Supplementary Material (ESI) for Energy & Environmental Science.This journal is © Royal Society of Chemistry 2010

Supplementary information
Table S1: Description and energies of states used in this study. ∆E is the electronic energy of thestate minus the electronic energy of the clean slab(s) associated with that state, with C atomsreferenced to graphene, H atoms to 1/2 H2, and O atoms to (H2O-H2).
Label Description Geom. Slab size ∆E (eV)
1 * - 0.00
2 OH* + CO* 3×2×3 (CO*), 3×3×3 (OH*) 0.98
3 CO* 3×2×3 1.05
4 * - 0.00
5 OCHO* 3×3×3 0.28
6 * - 0.00
11 OCH2O* 3×3×3 1.91
12 O* + CH3O* 3×2×3 (O*), 3×3×3 (CH3O*) 0.97
14 OH* + CH3O* 3×3×3 (OH*), 3×3×3 (CH3O*) -0.03
16 CH3O* 3×3×3 0.04
18 O* 3×2×3 0.93
20 OH* 3×3×3 -0.07
21 * - 0.00
22 COH* 3×3×3 2.35
23 CHO* 3×3×3 1.54
24 CHOH* 3×3×3 1.56
25 CH2O* 3×3×3 1.06
26 CH2OH* 3×3×3 0.97
27 * - 0.00
28 COOH* 3×3×3 1.22
Page S4
Supplementary Material (ESI) for Energy & Environmental Science.This journal is © Royal Society of Chemistry 2010

Supplementary information
Table S2: Description and energies of states used in this study. ∆E is the electronic energy of thestate minus the electronic energy of the clean slab(s) associated with that state, with C atomsreferenced to graphene, H atoms to 1/2 H2, and O atoms to (H2O-H2).
Label Description Geom. Slab size ∆E (eV)
29 C* 3×2×3 2.42
30 OH* 3×3×3 -0.07
31 CH2* 3×2×3 0.88
32 CH3* 3×2×3 -0.29
33 H* 3×2×3 -0.15
34 * - 0.00
37 C* + OH* 3×2×3 (C*), 3×3×3 (OH*) 2.35
38 CH* + O* 3×2×3 (CH*), 3×2×3 (O*) 2.39
39 OH* + CH2* 3×3×3 (OH*), 3×2×3 (CH2*) 0.81
40 O* 3×2×3 0.93
41 OH* 3×3×3 -0.07
42 * - 0.00
43 C(OH)OH* 3×3×3 2.25
44 O* + CHO* 3×2×3 (O*), 3×3×3 (CHO) 2.47
45 OH* + CHO* 3×3×3 (OH*), 3×3×3 (CHO*) 1.47
46 C* + O* 3×2×3 (C*), 3×2×3 (O*) 3.35
47 OH* + CH* 3×3×3 (OH*), 3×2×3 (CH*) 1.39
48 O* + CH2* 3×2×3 (O*), 3×2×3 (CH2*) 1.81
49 O* + CH3* 3×2×3 (O*), 3×2×3 (CH3*) 0.64
50 OH* + CH3* 3×3×3 (OH*), 3×2×3 (CH3*) -0.35
Page S5
Supplementary Material (ESI) for Energy & Environmental Science.This journal is © Royal Society of Chemistry 2010

Supplementary information
Table S3: Contributions to the adsorbate free energy from the zero-point energy correction, enthalpictemperature correction, entropy, and the total free energy correction, respectively. All valuesare given in eV.
Adsorbate ZPE∫CP dT −T S G− Eelec
OH* 0.364 0.046 -0.079 0.331CO* 0.192 0.076 -0.153 0.115OCHO* 0.624 0.102 -0.234 0.491H* 0.160 0.005 -0.007 0.159COOH* 0.624 0.096 -0.178 0.542CHO* 0.444 0.086 -0.184 0.346CH2O* 0.758 0.091 -0.190 0.659CH3O* 1.108 0.093 -0.179 1.022O* 0.072 0.025 -0.038 0.059
Table S4: Faradaic yields of products of CO2 electroreduction as reported by Hori [2]. The Faradaicyields are converted to molar yields, which are taken as the partial pressures (when multipliedby 101325 Pa) used in chemical potential calculations in the current study.
Product Faradaic yield (%) Molar yield (%)CH4 29.4 20.2C2H4 30.1 13.8H2 10.9 29.9HCOOH 9.7 26.6CH3CH2OH 6.9 3.2C3H7OH 3.0 0.9CO 2.0 5.5
18.5◦C by standard ideal-gas methods [13]. Pressure corrections were treated as follows: CO2was calculated at 101325 Pa (1 atm). Gaseous products in the pathway were calculated at partialpressures corresponding to the Faradaic yields reported by Hori et al. [2], converted to molaryields and multiplied by one atmosphere, as shown in Table S4. The free energy of liquid waterwas calculated as an ideal gas and adjusted to a fugacity of 3534 Pa, which is the vapor pressureof water (at which point the chemical potential of liquid and vapor phases are equal). Similarly,formic acid was calculated as an ideal gas with a fugacity of 2.0 Pa, which corresponds to anaqueous-phase activity of 0.01. Methanol was calculated at a fugacity of 6080 Pa, which fromits vapor-liquid equilibrium with water corresponds to a liquid mole fraction of 0.01. The com-ponents of the energy calculations for all non-adsorbed species are summarized in Table S5; allfugacity assumptions are also contained in this table.
As reported elsewhere [16], the gas-phase thermochemical reaction energies calculated withthe RPBE functional were found to be inconsistent with experimental values. In particular, thereaction enthalpy of the water-gas shift reaction was found to be particularly deviant from itsknown experimental value; the thermochemistry of this reaction is of particular importance inthis study. To quantify this inaccuracy, a set of 11 species in 21 reactions (listed in Table S6),focused on the energies of CO2, CO, H2, and H2O, was statistically analyzed. A sensitivityanalysis was undertaken comparing the calculated reaction enthalpies (∆rxnH) to literature en-thalpies taken from NIST [17]. A systematic error was found in all species containing the OCObackbone, specifically CO2, HCOOH, CH3COOH, and HCOOCH3 (of which, only CO2 and
Page S6
Supplementary Material (ESI) for Energy & Environmental Science.This journal is © Royal Society of Chemistry 2010

Supplementary information
Table S5: Assumed fugacity for each non-adsorbate species, along with calculated electronic energy,zero-point energy correction, enthalpic temperature correction, entropy contribution, andchemical potential, respectively. Electronic energies and chemical potentials do not includethe gas-phase correction. H2 is the value used for gaseous hydrogen, H2 (ref) is used for thecomputational hydrogen electrode as described in Section 1.
Species Fugacity Eelec ZPE∫CP dT −T S µ
(Pa) (eV) (eV) (eV) (eV) (eV)CO2 101325 0.90 0.31 0.10 -0.65 0.66CO 5562 1.75 0.14 0.09 -0.67 1.31H2 30296 -0.00 0.27 0.09 -0.42 -0.06HCOOH 2 0.92 0.90 0.11 -1.02 0.91CH3OH 6079 0.06 1.35 0.11 -0.79 0.73H2O 3534 0.03 0.58 0.10 -0.65 0.05CH4 20467 -1.22 1.20 0.10 -0.60 -0.53CH2O 101325 1.19 0.70 0.10 -0.66 1.34C2H4 13942 -0.01 1.36 0.11 -0.71 0.74H2 (ref) 101325 -0.00 0.27 0.09 -0.39 -0.03
HCOOH are significant in the current study). The sensitivity analysis results of varying theenergy of these species is shown in Figure S2. Fourteen of the 21 reactions in this set are af-fected by the OCO-containing species. The mean absolute error of the unaffected (“bystander”)reactions is 0.157 eV; the mean absolute error of the affected reactions at 0 eV correction is0.385 eV. As shown, the optimal correction to these species is +0.45 eV. This results in a reduc-tion in the mean absolute error of the affected reactions to 0.061 eV. This represents a reductionin the error of the affected reactions by 84%, and an overall reduction in error (including thebystander reactions) of 70%. The slope of the affected reactions curve is at its maximum abso-lute value at 0 correction, and remains at this maximum value almost until the optimal value of0.45 eV correction is reached, indicating that the error is directionally constant. Table S7 showsthe reactions with and without the OCO correction applied; as can be seen, with the correc-tion applied all ∆rxnH values are within 0.20 eV of their literature values. Thus, the correctionof +0.45 eV was applied to CO2 and HCOOH in the current study. The sensitivity analysisrevealed no other systematic errors in RPBE gas-phase values above 0.2 eV.
To determine if the RPBE gas-phase correction to CO2 and HCOOH was artificially skewingthe results, the complete analysis was repeated with the Perdew-Burke-Ernzerhof (PBE) [18]exchange-correlation functional, rather than the RPBE functional. The sensitivity analysis inthe gas-phase was repeated, and CO, rather than CO2, was found to be the largest outlier, assummarized in Table S8. (Table S8 shows only single-molecule optimums, thus an optimalcorrection of +0.41 eV is shown for CO2, rather than the +0.45 eV correction noted earlier forall OCO-containing species.) This table implies that the gas-phase error in PBE lies largelyon the CO molecule. Thus, an independent set of calculations can be made with the PBEfunctional without the effect of systematically changing the crucial CO2 energy; comparisonof these results to the RPBE results may provide an indication of if the CO2 correction wasunfairly biasing the results.
The full CHE model was repeated in the PBE functional with a CO correction. Gas-phasecalculations were undertaken in a manner identical to that described earlier, and a correction of-0.51 eV was made to the CO energy. Energies and vibrations were calculated in a relaxed andself-consistent manner in the PBE functional. Similarly, all adsorbate energies were calculated
Page S7
Supplementary Material (ESI) for Energy & Environmental Science.This journal is © Royal Society of Chemistry 2010

Supplementary information
Table S6: Reactions analyzed for the gas-phase ∆H comparisons (at 25◦C and 101325 Pa).
Rxn Stoichiometry0 CO2 + H2 −→ CO + H2O1 4 H2 + CO2 −→ CH4 + 2 H2O2 3 H2 + CO −→ CH4 + H2O3 CO2 + H2 −→ HCOOH4 CO + H2O −→ HCOOH5 3 H2 + CO2 −→ CH3OH + H2O6 2 H2 + CO −→ CH3OH7 3 H2 + CO2 −→ 1/2 CH3CH2OH + 3/2 H2O8 2 H2 + CO −→ 1/2 CH3CH2OH + 1/2 H2O9 10/3 H2 + CO2 −→ 1/3 C3H8 + 2 H2O
10 7/3 H2 + CO −→ 1/3 C3H8 + H2O11 7/2 H2 + CO2 −→ 1/2 C2H6 + 2 H2O12 5/2 H2 + CO −→ 1/2 C2H6 + H2O13 3 H2 + CO2 −→ 1/2 C2H4 + 2 H2O14 2 H2 + CO −→ 1/2 C2H4 + H2O15 11/4 H2 + CO2 −→ 1/4 CH2−−CHCH−−CH2 + 2 H2O16 7/4 H2 + CO −→ 1/4 CH2−−CHCH−−CH2 + H2O17 2 H2 + CO2 −→ 1/2 CH3COOH + H2O18 CO + H2 −→ 1/2 CH3COOH19 2 H2 + CO2 −→ 1/2 HCOOCH3 + H2O20 CO + H2 −→ 1/2 HCOOCH3
0.4 0.2 0.0 0.2 0.4correction, eV
0.0
0.1
0.2
0.3
0.4
0.5
0.6
0.7
0.8
0.9
mean a
bso
lute
err
or
, eV
affected reactions
bystander reactions
Figure S2: Sensitivity analysis to the enthalpy correction of OCO-containing gaseous species. ‘affectedreactions’ refers to the reactions in Table S6 that contain CO2, HCOOH, CH3COOH andHCOOCH3. ‘bystander reactions’ contain none of these species and are thus not affected.The mean absolute error is the absolute error per reaction as compared to NIST values.
Page S8
Supplementary Material (ESI) for Energy & Environmental Science.This journal is © Royal Society of Chemistry 2010

Supplementary information
Table S7: Reaction enthalpies (in eV) of the reactions listed in Table S6, in both the uncorrectedstate (∆Hunc) and corrected (∆Hcor) with +0.45 eV for CO2, HCOOH, CH3COOH, andHCOOCH3. Reference values (∆Href) are from NIST [17].
Rxn ∆Href ∆Hunc error ∆Hcor error0 0.43 1.02 0.59 0.57 0.141 -1.71 -1.27 0.44 -1.72 -0.012 -2.14 -2.28 -0.15 -2.28 -0.153 0.15 0.26 0.11 0.26 0.114 -0.27 -0.75 -0.48 -0.30 -0.035 -0.55 -0.15 0.41 -0.60 -0.046 -0.98 -1.16 -0.18 -1.16 -0.187 -0.89 -0.46 0.43 -0.91 -0.028 -1.32 -1.48 -0.16 -1.48 -0.169 -1.30 -0.82 0.47 -1.27 0.02
10 -1.72 -1.84 -0.12 -1.84 -0.1211 -1.37 -0.92 0.45 -1.37 0.0012 -1.80 -1.93 -0.14 -1.93 -0.1413 -0.66 -0.25 0.41 -0.70 -0.0414 -1.09 -1.27 -0.18 -1.27 -0.1815 -0.65 -0.24 0.41 -0.69 -0.0416 -1.08 -1.26 -0.18 -1.26 -0.1817 -0.67 -0.35 0.32 -0.58 0.0918 -1.10 -1.37 -0.27 -1.15 -0.0519 -0.17 -0.01 0.17 -0.23 -0.0620 -0.60 -1.02 -0.42 -0.80 -0.20
Table S8: Comparison of the gas-phase errors encountered with the RPBE and PBE exchange-correlation functionals. MAE compares the mean absolute error (in eV) of the reactions inTable S6. The numbers next to the molecules indicate the optimal correction to each speciesto minimize the MAE, considering single molecules only.
RPBE PBEMAE .309 .334CO -.18 -.51CO2 +.41 +.13H2 +.09 -.08H2O -.21 -.06
Page S9
Supplementary Material (ESI) for Energy & Environmental Science.This journal is © Royal Society of Chemistry 2010

Supplementary information
Table S9: Comparison of limiting potentials and steps for RPBE and PBE functionals.Limiting step and potential
Pathway RPBE PBEH2 *→H* -0.03 V H*→H2 -0.09 VHCOOH * + CO2 →COOH* -0.41 V OCHO*→HCOOH -0.32 VCO * + CO2 →COOH* -0.41 V * + CO2 →COOH* -0.46 VCH4 CO*→CHO* -0.74 V CO*→CHO* -0.61 V
self-consistently in the PBE functional with relaxed geometries and using the optimized latticeconstant of 3.66 A for PBE. Binding sites were assumed to be unchanged by the choice offunctional.
The results of this PBE verification are shown in Table S9. As can be seen, the limitingpotential at which each product is first exergonic is unchanged (within ∼0.1 V) when using thegas-corrected PBE or the gas-corrected RPBE functional. The pathway to produce formic acidvia a formate (OCHO*) intermediate is predicted to open at lower voltages in the PBE functionalthan the pathway via carboxyl (COOH*); however, this does not effect the conclusions of thepresent study (but may become significant in future studies). Note that the limiting step alsochanges in the hydrogen evolution reaction, but since the steps are very equally spaced thiscan be caused by only slight deviations in the numerical results. The PBE functional (with aCO correction) is in reasonable agreement with the RPBE functional (with CO2 and HCOOHcorrections), indicating that the CO2 gas-phase correction did not significantly skew the resultsin this study.
3 Optimized geometriesThe optimized geometries of each state reported in the manuscript are given in cartesian coor-dinates (with atomic positions in A) below.
Clean copper slabs
(3 × 2 × 3)
18
Cu 0.023149899367056 -0.013748619948101 -0.107137632694855Cu 0.018125062968156 2.606921203120689 -0.106782762968729Cu 2.136179449245979 1.302936468197497 -0.771122377732500Cu 2.131287894812869 3.929204496713564 -0.770920653353346Cu 4.259593458787066 0.007674360982615 -1.485427508011709Cu 4.255361607537337 2.631045256202375 -1.486144608849377Cu 0.000000000000000 1.311683079101046 -2.271901729212500Cu 0.000000000000000 3.935049237303137 -2.271901729212500Cu 2.141969477273816 0.000000000000000 -3.029202366200713Cu 2.141969477273816 2.623366158202091 -3.029202366200713Cu 4.283939018806718 1.311683079101046 -3.786502821436787Cu 4.283939018806718 3.935049237303137 -3.786502821436787Cu 0.000000000000000 0.000000000000000 -4.543803458425000Cu 0.000000000000000 2.623366158202091 -4.543803458425000Cu 2.141969477273816 1.311683079101046 -5.301104095413213Cu 2.141969477273816 3.935049237303137 -5.301104095413213Cu 4.283939018806718 0.000000000000000 -6.058404550649287Cu 4.283939018806718 2.623366158202091 -6.058404550649287
Page S10
Supplementary Material (ESI) for Energy & Environmental Science.This journal is © Royal Society of Chemistry 2010
Supplementary information
(3 × 3 × 3)
27
Cu 0.000000000000000 -0.027223894129920 -0.105033215460043Cu 2.623365750684083 -0.027223403371283 -0.105033964465299Cu 5.246732723922190 -0.027223403371283 -0.105033964465299Cu 1.311678901878981 4.286403238305489 -0.771245053005469Cu 3.935049237303136 4.286403559091568 -0.771247198514549Cu 6.558411702628815 4.286403238305489 -0.771245053005469Cu -0.000000000000000 2.164893521726736 -1.491346803849511Cu 2.623366512703471 2.164894244026212 -1.491347981565420Cu 5.246731961902801 2.164894244026212 -1.491347981565420Cu 1.311677832368729 0.000000000000000 -2.271902300225000Cu 3.935049237303136 0.000000000000000 -2.271902300225000Cu 6.558412772139069 0.000000000000000 -2.271902300225000Cu 0.000000000000000 4.283941139356521 -3.029196795065000Cu 2.623363534835933 4.283941139356521 -3.029196795065000Cu 5.246734939770341 4.283941139356521 -3.029196795065000Cu 1.311677832368729 2.141967356724013 -3.786510105610000Cu 3.935049237303136 2.141967356724013 -3.786510105610000Cu 6.558412772139069 2.141967356724013 -3.786510105610000Cu 0.000000000000000 0.000000000000000 -4.543804600450001Cu 2.623363534835933 0.000000000000000 -4.543804600450001Cu 5.246734939770341 0.000000000000000 -4.543804600450001Cu 1.311677832368729 4.283941139356521 -5.301099095290001Cu 3.935049237303136 4.283941139356521 -5.301099095290001Cu 6.558412772139069 4.283941139356521 -5.301099095290001Cu 0.000000000000000 2.141967356724013 -6.058412405835001Cu 2.623363534835933 2.141967356724013 -6.058412405835001Cu 5.246734939770341 2.141967356724013 -6.058412405835001
State 1
(Cu slab)
See “Clean copper slabs”.
(CO2)
3
C 7.585286947984798 7.506250217967394 7.558656708153242O 7.699822277478728 7.406806785096178 8.730397096406472O 7.470686282095669 7.605628415740690 6.386929294701846
State 3
(CO on Cu)
20
Cu 0.012560654974524 -0.002287996903865 -0.024219876302100Cu 0.038623024711376 2.621583775575930 -0.120175320404396Cu 2.156240850152923 1.310848812114986 -0.801631596984093Cu 2.155544565770785 3.930342768352018 -0.801071839252335Cu 4.279959327639781 -0.001428564836467 -1.509436625593567Cu 4.284200373373347 2.622410522474831 -1.499471327970953
Page S11
Supplementary Material (ESI) for Energy & Environmental Science.This journal is © Royal Society of Chemistry 2010

Supplementary information
Cu 0.000000000000000 1.311683079101046 -2.271901729212500Cu 0.000000000000000 3.935049237303137 -2.271901729212500Cu 2.141969477273816 0.000000000000000 -3.029202366200713Cu 2.141969477273816 2.623366158202091 -3.029202366200713Cu 4.283939018806718 1.311683079101046 -3.786502821436787Cu 4.283939018806718 3.935049237303137 -3.786502821436787Cu 0.000000000000000 0.000000000000000 -4.543803458425000Cu 0.000000000000000 2.623366158202091 -4.543803458425000Cu 2.141969477273816 1.311683079101046 -5.301104095413213Cu 2.141969477273816 3.935049237303137 -5.301104095413213Cu 4.283939018806718 0.000000000000000 -6.058404550649287Cu 4.283939018806718 2.623366158202091 -6.058404550649287C -0.029727144786259 -0.006013621766350 1.852792507082586O 0.027256715009420 -0.011263385592314 3.019088198757467
State 4
(Cu slab)
See “Clean copper slabs”.
(CO)
2
O 7.641365359584055 7.457525826038232 8.132466630239048C 7.528581412468439 7.554871669340764 6.984968448121089
State 6
(Cu slab)
See “Clean copper slabs”.
(HCOOH)
5
O 6.528352196749583 6.915990925736559 7.611979141699198C 7.493781588609516 7.865490072144815 7.598126653296124O 8.685124678362378 7.648949176442666 7.463283137075990H 6.980031782529726 6.046020255945819 7.493741764491896H 7.035162736148769 8.863830785822062 7.727631852105358
State 16
(OCH3 on Cu)
32
H 0.745467448431875 -1.094899450988074 2.872207545222520H 0.724131450141828 0.628114208420895 3.339516672214321H 2.276422115735514 -0.229633471905860 3.163699090695307C 1.262913270835903 -0.128838424554792 2.743463523465977O 1.313690292609351 0.288132662556057 1.385175939180538Cu -0.059869933162263 -0.017197499347634 -0.026061240279713Cu 2.691227296374820 -0.044325852397171 -0.012068163378458Cu 5.250662763700568 -0.074708683116958 -0.117106705258280
Page S12
Supplementary Material (ESI) for Energy & Environmental Science.This journal is © Royal Society of Chemistry 2010
Supplementary information
Cu 1.310816001587201 4.253431609536332 -0.832483098801117Cu 3.929685380379550 4.261884660027959 -0.792113030567418Cu 6.564177266832544 4.265900969374292 -0.792646125980726Cu -0.014305644010168 2.144138978884708 -1.528048887131835Cu 2.626164180842501 2.138521211006583 -1.521499174670413Cu 5.242716836946304 2.142219275371003 -1.488388483499575Cu 1.311677832368730 0.000000000000000 -2.271902300225000Cu 3.935049237303136 0.000000000000000 -2.271902300225000Cu 6.558412772139066 0.000000000000000 -2.271902300225000Cu 0.000000000000000 4.283941139356521 -3.029196795065000Cu 2.623363534835933 4.283941139356521 -3.029196795065000Cu 5.246734939770341 4.283941139356521 -3.029196795065000Cu 1.311677832368730 2.141967356724013 -3.786510105610000Cu 3.935049237303136 2.141967356724013 -3.786510105610000Cu 6.558412772139066 2.141967356724013 -3.786510105610000Cu 0.000000000000000 0.000000000000000 -4.543804600450001Cu 2.623363534835933 0.000000000000000 -4.543804600450001Cu 5.246734939770341 0.000000000000000 -4.543804600450001Cu 1.311677832368730 4.283941139356521 -5.301099095290001Cu 3.935049237303136 4.283941139356521 -5.301099095290001Cu 6.558412772139066 4.283941139356521 -5.301099095290001Cu 0.000000000000000 2.141967356724013 -6.058412405835001Cu 2.623363534835933 2.141967356724013 -6.058412405835001Cu 5.246734939770341 2.141967356724013 -6.058412405835001
State 18
(O on Cu)19
Cu -0.004300822347038 -0.061380792013776 -0.053810734399919Cu -0.008661396905239 2.705589363033174 -0.052762517922369Cu 2.246936173690706 1.319598275191551 -0.641921590475549Cu 2.176852673969170 3.941689832289003 -0.840841181655495Cu 4.290387459623268 -0.003826500539351 -1.524546721201870Cu 4.289745859503829 2.631843309184542 -1.524959735901388Cu 0.000000000000000 1.311683079101046 -2.271901729212500Cu 0.000000000000000 3.935049237303137 -2.271901729212500Cu 2.141969477273816 0.000000000000000 -3.029202366200713Cu 2.141969477273816 2.623366158202091 -3.029202366200713Cu 4.283939018806718 1.311683079101046 -3.786502821436787Cu 4.283939018806718 3.935049237303137 -3.786502821436787Cu 0.000000000000000 0.000000000000000 -4.543803458425000Cu 0.000000000000000 2.623366158202091 -4.543803458425000Cu 2.141969477273816 1.311683079101046 -5.301104095413213Cu 2.141969477273816 3.935049237303137 -5.301104095413213Cu 4.283939018806718 0.000000000000000 -6.058404550649287Cu 4.283939018806718 2.623366158202091 -6.058404550649287O 0.950071058153411 1.325709808209899 0.851403423061966
(CH4)5
C 7.585238100732373 7.506222746239414 7.558634389912713H 8.224778502636889 8.136113301059938 8.187653263007167H 7.068457361805176 6.769827884065217 8.184805492525472H 8.201490760408081 6.986231575637561 6.816133364302076H 6.846266203796022 8.132744874011845 7.045934239001313
Page S13
Supplementary Material (ESI) for Energy & Environmental Science.This journal is © Royal Society of Chemistry 2010

Supplementary information
State 20
(OH on Cu)
29
H 1.311673193199244 1.162171065368676 1.757859178243893O 1.309217128160848 0.244619762657903 1.413968142960989Cu -0.054962260525875 -0.023865256534894 -0.015664368990109Cu 2.679104036010647 -0.017540173061078 -0.012035857716456Cu 5.244765395416072 -0.070912652554636 -0.125407568438563Cu 1.314850844577905 4.244443374523436 -0.842789301125355Cu 3.930427470568576 4.261058246262149 -0.792841345538455Cu 6.566493291618749 4.258712808163383 -0.797702514775933Cu -0.009715734201361 2.140748422261043 -1.526324513487080Cu 2.645053989430926 2.144831987082274 -1.523408439687679Cu 5.250109950811189 2.136094612177384 -1.490054028452506Cu 1.311677832368730 0.000000000000000 -2.271902300225000Cu 3.935049237303136 0.000000000000000 -2.271902300225000Cu 6.558412772139066 0.000000000000000 -2.271902300225000Cu 0.000000000000000 4.283941139356521 -3.029196795065000Cu 2.623363534835933 4.283941139356521 -3.029196795065000Cu 5.246734939770341 4.283941139356521 -3.029196795065000Cu 1.311677832368730 2.141967356724013 -3.786510105610000Cu 3.935049237303136 2.141967356724013 -3.786510105610000Cu 6.558412772139066 2.141967356724013 -3.786510105610000Cu 0.000000000000000 0.000000000000000 -4.543804600450001Cu 2.623363534835933 0.000000000000000 -4.543804600450001Cu 5.246734939770341 0.000000000000000 -4.543804600450001Cu 1.311677832368730 4.283941139356521 -5.301099095290001Cu 3.935049237303136 4.283941139356521 -5.301099095290001Cu 6.558412772139066 4.283941139356521 -5.301099095290001Cu 0.000000000000000 2.141967356724013 -6.058412405835001Cu 2.623363534835933 2.141967356724013 -6.058412405835001Cu 5.246734939770341 2.141967356724013 -6.058412405835001
State 21
(Cu slab)
See “Clean copper slabs”.
(H2O)
3
O 7.614317566614155 7.480921184089151 7.856387072490542H 7.495555052934019 8.297920102904893 7.332865567817379H 7.616927361165037 6.764846707656943 7.190927662140631
State 23
(CHO on Cu)
30
H 1.312898959735840 -0.917833817508481 2.183407908513928O 1.309097004261219 1.111672515178829 2.133284222474549
Page S14
Supplementary Material (ESI) for Energy & Environmental Science.This journal is © Royal Society of Chemistry 2010

Supplementary information
C 1.313013387441828 0.017323427075040 1.568072378069514Cu 0.044850843965235 -0.097652254677620 -0.096033920089193Cu 2.585482666634804 -0.097986609372224 -0.095811618133439Cu 5.249321737341685 -0.089945623639865 -0.178378742967902Cu 1.312334097786074 4.211638893561339 -0.867978249926096Cu 3.936361459857662 4.254210472326520 -0.836870645293868Cu 6.561763892351531 4.255090971787613 -0.837573426792628Cu -0.014105643849957 2.128276676437247 -1.556114601438970Cu 2.636849303718392 2.128387036688195 -1.556522170645458Cu 5.245138793239257 2.133965644734372 -1.534475103566648Cu 1.311677832368730 0.000000000000000 -2.271902300225000Cu 3.935049237303136 0.000000000000000 -2.271902300225000Cu 6.558412772139066 0.000000000000000 -2.271902300225000Cu 0.000000000000000 4.283941139356521 -3.029196795065000Cu 2.623363534835933 4.283941139356521 -3.029196795065000Cu 5.246734939770341 4.283941139356521 -3.029196795065000Cu 1.311677832368730 2.141967356724013 -3.786510105610000Cu 3.935049237303136 2.141967356724013 -3.786510105610000Cu 6.558412772139066 2.141967356724013 -3.786510105610000Cu 0.000000000000000 0.000000000000000 -4.543804600450001Cu 2.623363534835933 0.000000000000000 -4.543804600450001Cu 5.246734939770341 0.000000000000000 -4.543804600450001Cu 1.311677832368730 4.283941139356521 -5.301099095290001Cu 3.935049237303136 4.283941139356521 -5.301099095290001Cu 6.558412772139066 4.283941139356521 -5.301099095290001Cu 0.000000000000000 2.141967356724013 -6.058412405835001Cu 2.623363534835933 2.141967356724013 -6.058412405835001Cu 5.246734939770341 2.141967356724013 -6.058412405835001
State 25
(CH2O on Cu)
31
O 1.845272620691200 0.024908266734931 1.832244453700665C 0.571595493787099 -0.019347362252447 2.039565388720506H 0.116459788027946 -0.943651786226625 2.436588506556569H 0.020802069225723 0.921607480696652 2.229385218552973Cu -0.037034927373193 -0.071348667522584 -0.055187345811175Cu 2.662898349329812 -0.014847507173345 -0.026907815921549Cu 5.275860852106195 -0.059772459340169 -0.113266136923653Cu 1.315019726618762 4.241777115412966 -0.832483855128398Cu 3.933003582510525 4.273074084012917 -0.800384882054134Cu 6.558904463764711 4.249956521139479 -0.782996344526780Cu -0.008455985337665 2.129600118190814 -1.515738229853282Cu 2.624958223356101 2.136402351232421 -1.520950063585345Cu 5.237547094986153 2.143873893598655 -1.501515953012097Cu 1.311677832368730 0.000000000000000 -2.271902300225000Cu 3.935049237303136 0.000000000000000 -2.271902300225000Cu 6.558412772139066 0.000000000000000 -2.271902300225000Cu 0.000000000000000 4.283941139356521 -3.029196795065000Cu 2.623363534835933 4.283941139356521 -3.029196795065000Cu 5.246734939770341 4.283941139356521 -3.029196795065000Cu 1.311677832368730 2.141967356724013 -3.786510105610000Cu 3.935049237303136 2.141967356724013 -3.786510105610000Cu 6.558412772139066 2.141967356724013 -3.786510105610000Cu 0.000000000000000 0.000000000000000 -4.543804600450001
Page S15
Supplementary Material (ESI) for Energy & Environmental Science.This journal is © Royal Society of Chemistry 2010
Supplementary information
Cu 2.623363534835933 0.000000000000000 -4.543804600450001Cu 5.246734939770341 0.000000000000000 -4.543804600450001Cu 1.311677832368730 4.283941139356521 -5.301099095290001Cu 3.935049237303136 4.283941139356521 -5.301099095290001Cu 6.558412772139066 4.283941139356521 -5.301099095290001Cu 0.000000000000000 2.141967356724013 -6.058412405835001Cu 2.623363534835933 2.141967356724013 -6.058412405835001Cu 5.246734939770341 2.141967356724013 -6.058412405835001
State 28
(COOH on Cu)
31
Cu -0.074750498070359 -0.007638579063276 -0.029686452773966Cu 2.685792189254784 -0.055402358311775 -0.033707563692602Cu 5.242990114896003 -0.071984554346328 -0.122168762056901Cu 1.299317104727358 4.252168543281243 -0.829119313294996Cu 3.929321886971891 4.241713410194023 -0.808307855564635Cu 6.554861945697155 4.258467208468602 -0.801707457740463Cu -0.006914501843705 2.133517615795299 -1.515028533658096Cu 2.616654941110440 2.130470164924930 -1.516540180017955Cu 5.242542129714536 2.131103095555645 -1.499126456946215Cu 1.311677860253994 0.000000000000000 -2.271902281872826Cu 3.935049295425415 0.000000000000000 -2.271902281872826Cu 6.558412990538727 0.000000000000000 -2.271902281872826Cu 0.000000000000000 4.283941086422146 -3.029196593852703Cu 2.623363460566097 4.283941086422146 -3.029196593852703Cu 5.246734895737518 4.283941086422146 -3.029196593852703Cu 1.311677860253994 2.141967287592095 -3.786509971389933Cu 3.935049295425415 2.141967287592095 -3.786509971389933Cu 6.558412990538727 2.141967287592095 -3.786509971389933Cu 0.000000000000000 0.000000000000000 -4.543804563745653Cu 2.623363460566097 0.000000000000000 -4.543804563745653Cu 5.246734895737518 0.000000000000000 -4.543804563745653Cu 1.311677860253994 4.283941086422146 -5.301099156101373Cu 3.935049295425415 4.283941086422146 -5.301099156101373Cu 6.558412990538727 4.283941086422146 -5.301099156101373Cu 0.000000000000000 2.141967287592095 -6.058412253262759Cu 2.623363460566097 2.141967287592095 -6.058412253262759Cu 5.246734895737518 2.141967287592095 -6.058412253262759C 1.933784678952641 0.012271538818138 1.783049054796720O 2.702500863787407 -0.022617465787421 2.888908297585203O 0.682805585763145 0.101327525994398 1.940210229133982H 2.107444961812050 0.045290226228421 3.681183140919075
State 33
(H on Cu)
19
Cu 0.064813226751864 -0.006059379450797 -0.082889826754620Cu 0.065472660995090 2.641529302353994 -0.082800921425567Cu 2.171619323785953 1.320657468475068 -0.719313683379730Cu 2.184780130076707 3.945910691506923 -0.801368026620648Cu 4.290157754210671 0.014736633794212 -1.494810454846268
Page S16
Supplementary Material (ESI) for Energy & Environmental Science.This journal is © Royal Society of Chemistry 2010

Supplementary information
Cu 4.296878373542302 2.628655099623332 -1.496880818710797Cu 0.000000000000000 1.311683079101046 -2.271901729212500Cu 0.000000000000000 3.935049237303137 -2.271901729212500Cu 2.141969477273816 0.000000000000000 -3.029202366200713Cu 2.141969477273816 2.623366158202091 -3.029202366200713Cu 4.283939018806718 1.311683079101046 -3.786502821436787Cu 4.283939018806718 3.935049237303137 -3.786502821436787Cu 0.000000000000000 0.000000000000000 -4.543803458425000Cu 0.000000000000000 2.623366158202091 -4.543803458425000Cu 2.141969477273816 1.311683079101046 -5.301104095413213Cu 2.141969477273816 3.935049237303137 -5.301104095413213Cu 4.283939018806718 0.000000000000000 -6.058404550649287Cu 4.283939018806718 2.623366158202091 -6.058404550649287H 0.936959927954270 1.313074393687589 0.652413075273655
State 34
(Cu slab)
See “Clean copper slabs”.
(H2)
2
H 7.621799265246641 7.474518079395500 7.932282369050250H 7.548709691150781 7.537920035839598 7.185022644661871
References[1] Nørskov, J. K. et al. Origin of the overpotential for oxygen reduction at a fuel-cell cathode.
The Journal of Physical Chemistry B 108, 17886–17892 (2004).
[2] Hori, Y., Murata, A. & Takahashi, R. Formation of hydrocarbons in the electrochemicalreduction of carbon dioxide at a copper electrode in aqueous solution. Journal of theChemical Society, Faraday Transactions 1 85, 2309–2326 (1989).
[3] Janik, M. J., Taylor, C. D. & Neurock, M. First-principles analysis of the initial elec-troreduction steps of oxygen over Pt(111). Journal of the Electrochemical Society 156,B126–B135 (2009).
[4] Tripkovic, V., Skulason, E., Siahrostami, S., Nørskov, J. & Rossmeisl, J. The oxygen re-duction reaction mechanism on Pt(111) from density functional theory calculations. Elec-trochim. Acta (2010). Doi:10.1016/j.electacta.2010.02.056.
[5] Hammer, B., Hansen, L. B. & Nørskov, J. K. Improved adsorption energetics withindensity-functional theory using revised Perdew-Burke-Ernzerhof functionals. PhysicalReview B 59, 7413–7421 (1999).
[6] Payne, M. C., Teter, M. P., Allan, D. C., Arias, T. A. & Joannopoulos, J. D. Iterativeminimization techniques for ab initio total-energy calculations: molecular dynamics andconjugate gradients. Reviews of Modern Physics 64, 1045–1097 (1992).
[7] Vanderbilt, D. Soft self-consistent pseudopotentials in a generalized eigenvalue formalism.Physical Review B 41, 7892–7895 (1990).
Page S17
Supplementary Material (ESI) for Energy & Environmental Science.This journal is © Royal Society of Chemistry 2010
Supplementary information
[8] Bahn, S. R. & Jacobsen, K. W. An object-oriented scripting interface to a legacy electronicstructure code. Computing in Science & Engineering 4, 56–66 (2002).
[9] Both Dacapo and ASE are open-source software packages available athttps://wiki.fysik.dtu.dk.
[10] Nørskov, J. K. et al. Universality in heterogeneous catalysis. Journal of Catalysis 209,275 – 278 (2002).
[11] Karlberg, G. S., Rossmeisl, J. & Nørskov, J. K. Estimations of electric field effects onthe oxygen reduction reaction based on the density functional theory. Physical ChemistryChemical Physics 9, 5158–5161 (2007).
[12] Jones, G. et al. First principles calculations and experimental insight into methane steamreforming over transition metal catalysts. Journal of Catalysis 259, 147–160 (2008).
[13] Cramer, C. J. Essentials of Computational Chemistry (Wiley, 2004), 2nd edn.
[14] Rossmeisl, J., Greeley, J. & Karlberg, G. S. Electrocatalysis and catalyst screening fromdensity functional theory calculations. In Koper, M. T. M. (ed.) Fuel Cell Catalysis: ASurface Science Approach, chap. 3, 57–92 (Wiley, 2009).
[15] Karlberg, G. S. & Wahnstrom, G. Density-functional based modeling of the intermediatein the water production reaction on Pt(111). Physical Review Letters 92, 136103 (2004).
[16] Blaylock, D. W., Ogura, T., Green, W. H. & Beran, G. J. O. Computational investigationof thermochemistry and kinetics of steam methane reforming on Ni(111) under realisticconditions. The Journal of Physical Chemistry C 113, 4898–4908 (2009).
[17] Afeefy, H., Liebman, J. & Stein, S. Neutral thermochemical data. In Linstrom, P. &Mallard, W. (eds.) NIST Chemistry WebBook, NIST Standard Reference Database Number69 (National Institute of Standards and Technology, Gaithersburg MD, USA, 2010).
[18] Perdew, J. P., Burke, K. & Ernzerhof, M. Generalized gradient approximation made sim-ple. Physical Review Letters 77, 3865–3868 (1996).
Page S18
Supplementary Material (ESI) for Energy & Environmental Science.This journal is © Royal Society of Chemistry 2010