Embed Size (px)
Citation preview

Supplementary Information:
Appendix S1. Other approaches to cost estimation

Analysts and policymakers must make important decisions in the face of uncertainty on
how electricity-generating technologies are likely to evolve. Key factors include
investment costs, operation and maintenance costs, technical performance, and public
acceptability. Here, our focus is on assessing the future capital costs of integral light-
water small modular nuclear reactors (SMRs). These constitute an emerging technology
that uses the same operational principles as large light water reactors but in a size range
of 300MWe or less, as compared to conventional Gigawatt-scale units.
While they are not all applicable to projecting the future cost of SMRs, several methods
deserve consideration: 1) running regression or econometric methods that use historical
data to generate estimates; 2) employing scaling factors from technologies where costs
are known and applying them to the new technology in question; 3) building component-
and process-based bottom-up engineering-economic models; and 4) using structured
expert interviews to elicit estimates.
One strategy is to investigate how similar technologies have performed in the past. There
is ample literature on technological innovation related to electricity generating systems
that uses regression and econometric models to estimate how the cost of these systems
has evolved as their cumulative added capacity increases (this is termed “learning by
doing”), as more research dollars are poured into their commercialization (“learning by
researching”), or as a function of the implementation of policies that are designed to
accelerate their market penetration. These investigations usually report their conclusions

in terms of “learning rates”: the percentage reductions in the technologies’ costs when
their installed capacity is doubled.
Although there have been several attempts to estimate nuclear power’s learning rates over
the past few decades, the technology uniquely handicaps these efforts. The facts that (1)
there are fewer than 450 nuclear power plants in the world and (2) the “technology”
employed in these plants varies quite widely, meaning that many different plants sit on
different cost curves, results in costs that are variable and generate little insight to guide
estimates of future costs. We present a few reported learning rates here. In their 2001
study, McDonald and Schrattenholzer (S1) report learning rates for a number of energy
technologies, including nuclear power plants. They estimate that the learning rate of
nuclear power in the developed world (those countries that belong to the Organization for
Economic Cooperation and Development) from 1975 to 1993 is about 6%; Using existing
data on the American nuclear industry, as well as previously unpublished data on the
French nuclear experience, Grubler (S2) finds an “observed real cost escalation [that] is
quite robust against the data and model uncertainties that can be explored”. Grubler
concludes that, for the Gigawatt-scale nuclear reactors in operation today, there is a
“negative learning by doing” effect: specific costs increase rather than decrease with
accumulated experience. He explains this by emphasizing several caveats associated with
these data, including points made above. For example, Grubler notes the different
institutional arrangements (such as safety regulations) that different reactors had to
contend with, as well as the aforementioned cross-generational variations among nuclear
reactor designs that make such comparisons questionable. Questioning recent claims of

nuclear power’s economic viability, Cooper (31) conducts a similar assessment of the
costs of U.S. nuclear power plants. In his work, nuclear power exhibits an increasing cost
trend as a function of the cumulative capacity installed.
These methods are inappropriate here because, in using learning rates to forecast future
costs, a modeler implicitly assumes that the trend in future costs will be similar to what
we have seen in the past. This does not hold for SMRs, the business case for which is
predicated on the assumption that they will be factory-fabricated, unlike legacy nuclear
plants. An even more fundamental point is that this strategy is indefensible for these
SMRs, which are a new, emergent technology for which there is no historical data.
Another strategy is to estimate the cost of a new technology by applying a scaling factor
to an existing benchmark. This could be done for SMRs by using the reported costs of
large-scale nuclear reactors as a starting point, “scaling” the costs only by size (MWe
capacity). While Kuzentsov and Barkatullah acknowledge the fact that SMR cost
estimates in 2009 may be mere conjecture, they explicitly adopt this approach (27).
Another way of generating these estimates is by applying other theoretical scaling factors
that take into account the inherent differences between the technologies. Because SMRs
would be manufactured in a factory, for example, a researcher might scour the literature
for an estimate of the cost reductions that factory fabrication generates in other industries,
applying that factor (or a modified version of it) to the large reactor cost estimates he or
she is using as a benchmark. Other factors that have been mentioned in the literature as

being relevant for SMRs include technical progress economies and modular construction
economies, among others. Carelli et al. (34) provide a good example of this approach.
A third method to estimate the future costs of SMRs is by using detailed component and
process based bottom-up engineering-economic models. For example, the Electric Power
Research Institute (EPRI) is working with vendors and utilities to develop an SMR utility
requirements document (URD) that details the necessary components and processes for a
given plant configuration (S3). Naturally, given the proprietary nature of design details
and the complexity of this task, these estimates, especially if they are designed to be
publically available, take time to develop. These efforts are valuable; they help modelers
develop a better scope when generating estimates that include process and support
facilities, fuel handling and storage equipment, and even the basic transmission yard
infrastructure required for SMRs.
The final method, used in this paper, is a top-down expert elicitation, an approach to
generating estimates that we explain in the methods section of our paper and in appendix
S4 of the supplementary information. When well designed and executed, expert
elicitation not only generates estimates, it provides a structured discussion that serves as
an outlet for participating experts who are themselves uncertain of the future direction of
their proposed technology. These discussions, while qualitative, generate much insight:
they highlight questions experts think have yet to be addressed, for example, providing

fertile ground for further assessment and public discourse. None of the other methods
listed above do this.
In Figure S1, we compare our results with estimates of likely SMR cost from the
literature derived using some of the methods outlined above. Notice the narrow range
within which all of these prior estimates fall, when compared with the results of our
elicitation. While our experts may be subject to overconfidence, these results suggest that
other methods may be even more susceptible to underestimating costs and associated
uncertainties. At this stage of such a complex technology’s development, most of these
prior estimates have either been derived using the “anchor” of large reactor costs or via
consultation with a small number of experts. Notice also the lack of systematic treatment
of uncertainty in many of these estimates.
Our experts also provided us with a wide range of estimates for large, current-generation
nuclear reactors. There is a long history of cost estimates for conventional reactors that
have turned out to be in serious error (S9). Figure S2 compares the estimated cost of
nuclear plants prior to construction with their actual cost: in some cases, actual costs
turned out to be many times greater than estimated cost (S10).
The fact that not all of the estimates we elicited for conventional reactors overlap
indicates that, despite this history that all our experts know about, many are still

producing cost estimates that are "overconfident" (i.e. too narrow). Despite our best
efforts to reduce overconfidence during the elicitation, the same is probably also true for
many, if not all, of the estimates for SMRs made by our experts. However, as Figure S1
suggests, the result we report are probably considerably less overconfident than previous
estimates.
We are fully aware that, when it comes to an emergent technology like SMRs, there is
much uncertainty on how costs and performance are likely to evolve over time. We do
not argue that expert elicitation dominates other methods: instead we argue that given the
uncertainty on how SMRs are likely to evolve in the near future, results from the different
methods should be provided to decision-makers in order to inform them about the
uncertainties regarding new technologies.
Appendix S1 References:
S1. McDonald A, Schrattenholzer L (2001) Learning rates for energy technologies.
Energy Policy 29:255–261.
S2. Grubler A (2010) The cost of the French nuclear scale-up: A case of negative
learning by doing. Energy Policy 38:5174–5188.
S3. Mulford TJ (2010) RIC 2010 Regulatory and Policy Issues for Small Modular
Reactors (SMRs). Presentation to the U.S. Nuclear Regulatory Commission,
Rockville, Maryland.

S4. Solan D et al. (2010) Economic and Employment Impacts of Small Modular
Nuclear Reactors. Energy Policy Institute, Boise State University, Boise, ID.
S5. Welling C (2010) SMR Financing and Economics The Nuclear Option: Is Small
Scale Nuclear Energy an Option for Alaska? Presentation at the University of
Alaska Fairbanks, Fairbanks, AK.
S6. Nuclear Energy Agency (2011) Current Status, Technical Feasibility, and
Economics of Small Nuclear Reactors. Nuclear Energy Agency, Paris, France.
S7. Cunningham N (2012) Small Modular Reactors: A Possible Path Forward for
Nuclear Power. American Security Project, Washington, DC.
S8. Black G (2012) Estimating the Economic Impacts of Small Modular Reactors.
Presentation to the Platts 3rd Annual Small Modular Reactors Conference,
Arlington, VA.
S9. Ramana MV (2009) Nuclear Power: Economic, Safety, Health, and
Environmental Issues of Near-Term Technologies. Annu Rev Environ Resour
34:127-152.
S10. Talabi S, Fischbeck P (2012) Advancing Risk Management in Nuclear Power
Plant EPC Projects - An Empirical Evaluation of Risk Management Practices on
Steam Generator Replacement Projects. Proceedings of the 7th World Congress
on Engineering Asset Management, Springer, London, Deajeon, Korea
Republic.

Figure Legends:
Figure S1: A comparison of our elicitation results with existing estimates of SMR cost,
the sources of which are listed either in the main manuscript or in appendix S1. Estimates
were adjusted for inflation and, like our results, are presented in 2012 dollars.
Figure S2: Nuclear power has a record of poor and optimistic cost estimation. As this
plot by Talabi and Fischbeck (S10) shows, in some cases, actual costs turned out to be
many times greater than the cost estimates made prior to construction.

Figure S1

Figure S2

Supplementary Information:
Table S1: A list of small (<300MWe) reactor designs, sorted alphabetically by country,
then by name. The reactor types are as follows: iPWR = integral pressurized water
reactor; PWR = pressurized water reactor; BWR = boiling water reactor; HWR = heavy
water reactor; LMR = liquid metal reactor; HTR = high temperature gas cooled reactor;
MSR = molten salt reactor; and TWR = traveling wave reactor.
No. Name Developer Country Reactor type
Capacity (MWe)
Ref.
1 CAREM-25 CNEA Argentina iPWR 25-150 26 2 FBNR FURGS Brazil iPWR 72 26 3 ACP100 CNNC China PWR 100 S11 4 CEFR CNEIC China LMR 20 26 5 CNP-300 CNNC China PWR 325 26 6 HTR-PM Tsinghua University China HTR 105 26 7 Flexblue DCNS France PWR 50 - 250 26 8 PHWR-220 NPCIL India HWR 235 26 9 4S Toshiba Japan LMR 10 26 10 SMART KAERI Korea iPWR 100 26 11 ABV-6M OKBM Russia PWR 8.6 26 12 BREST-OD-300 RDIPE Russia LMR 300 26 13 KLT-40S OKBM Russia PWR 35 26 14 RITM OKBM Russia iPWR 50 26 15 SVBR-100 JSC AKME Russia LMR 100 26 16 UNITHERM RDIPE Russia PWR 2.5 26 17 VK-300 RDIPE Russia BWR 250 26 18 WWER-300 OKBM Russia PWR 300 26 19 EM2 General Atomics USA HTR 240 26 20 G4M Gen 4 Energy USA LMR 25 26 21 SMR-160 (HI-SMUR) Holtec International USA PWR 160 * 22 mPower Babcock & Wilcox USA iPWR 180 26 23 NuScale NuScale Power USA iPWR 45 26 24 PRISM GEH USA LMR 155 26 25 Traveling Wave Reactor Terrapower USA TWR ~300 S12 26 Westinghouse SMR Westinghouse USA iPWR 225 26
*Anton S. SMR-160: An Unconditionally Safe Source of Pollution-Free Nuclear Energy for the Post-Fukushima Age. Presentation to the Nuclear Energy Standards Coordination Collaborative, July 17, 2012, Washington, DC.

Table S1 References:
S11. Sun S, Zhang L (2011) The Development of Multi-Purpose Modular Reactors with
Improved Safety in China. Presentation to the INPRO Dialogue Forum on Nuclear
Energy Innovations, International Atomic Energy Agency, Vienna, Austria.
S12. Ellis T et al. (2010) Traveling-Wave Reactors: A Truly Sustainable and Full-Scale
Resource for Global Energy Needs. Proceedings of ICAPP ’10, San Diego, CA.

Supplementary Information:
Appendix S2. Full expert elicitation protocol

M. G
rang
er M
orga
n Lo
rd C
hair
Prof
esso
r of
Engi
neer
ing
Dep
artm
ent H
ead,
En
gine
erin
g an
d Pu
blic
Pol
icy
Car
negi
e M
ello
n U
nive
rsity
Pi
ttsbu
rgh,
PA
152
13
gm
5d@
andr
ew.c
mu.
edu
412
– 26
8 –
2672
(off
ice)
ht
tp://
ww
w.e
pp.c
mu.
edu
Ahm
ed A
bdul
la
Gra
duat
e St
uden
t En
gine
erin
g an
d Pu
blic
Pol
icy
Car
negi
e M
ello
n U
nive
rsity
Pi
ttsbu
rgh,
PA
152
13
ay
a1@
cmu.
edu
412
– 95
3 –
3425
(mob
ile)
http
://ce
dm.e
pp.c
mu.
edu
Inês
Aze
vedo
A
ssis
tant
Res
earc
h Pr
ofes
sor
Engi
neer
ing
and
Publ
ic P
olic
y D
irect
or, C
limat
e an
d En
ergy
D
ecis
ion
Mak
ing
(CED
M) C
ente
r C
arne
gie
Mel
lon
Uni
vers
ity
Pitts
burg
h, P
A 1
5213
iaze
vedo
@cm
u.ed
u 41
2 –
268
– 58
47 (o
ffic
e)
http
://ce
dm.e
pp.c
mu.
edu
Elic
itatio
n of
Exp
ert A
sses
smen
ts
of S
mal
l Mod
ular
Rea
ctor
Cos
ts
In
terv
iew
Pro
toco
l
Exp
ert:
___
____
____
____
____
____
____
__
Dat
e: _
____
____
____
____
____
____
____

Part
I.
Intro
duct
ion
Part
II.
How
will
this
elic
itatio
n w
ork?
A
not
e on
the
pitfa
lls o
f elic
itatio
n.
Part
III.
Dem
ogra
phic
info
rmat
ion
Part
IV.
Bac
kgro
und
info
rmat
ion
on te
chno
logi
es u
nder
co
nsid
erat
ion
Part
V.
Elic
iting
ove
rnig
ht c
osts
Part
VI.
Plan
t mod
ules
und
er c
onsi
dera
tion
Part
VII
. El
iciti
ng c
onst
ruct
ion
sche
dule
s
Part
VII
I. W
hat i
s the
influ
ence
of m
odul
arity
on
cost
s?
Part
IX.
Wha
t is t
he p
erfe
ct S
MR
dep
loym
ent s
cena
rio?
Part
X.
Whi
ch S
MR
-spe
cific
cha
ract
eris
tics m
ake
them
pa
rticu
larly
eco
nom
ical
ly a
ttrac
tive?
Part
XI.
Whi
ch sa
fety
and
secu
rity
conc
erns
pos
e th
e gr
eate
st
chal
leng
es to
SM
R d
evel
opm
ent,
depl
oym
ent,
and
oper
atio
n?
Part
XII
. O
pen-
ende
d qu
estio
ns
Part
I. In
trod
uctio
n O
utlin
e of
the
Inte
rvie
w P
roto
col
Bec
ause
SM
Rs h
ave
yet t
o be
con
stru
cted
, the
re is
no
data
that
w
ould
allo
w fo
r a b
otto
m-u
p an
alys
is o
f eco
nom
ic c
osts
to ta
ke
plac
e. A
ll cu
rren
t cos
t est
imat
es u
se la
rge
reac
tor (
LR) c
osts
as a
pr
oxy
whe
n di
scus
sing
the
econ
omic
s of S
MR
s. W
e ar
e w
orki
ng to
elic
it co
sts f
or th
e co
nstru
ctio
n of
smal
l, m
odul
ar n
ucle
ar re
acto
rs (S
MR
s) o
f the
ligh
t wat
er v
arie
ty. O
ur
goal
is to
ass
ess w
hen
an e
cono
mic
cas
e ca
n be
mad
e fo
r SM
Rs.
Than
k yo
u fo
r you
r par
ticip
atio
n!
Will
ref
eren
ce b
e m
ade
to p
ropr
ieta
ry b
luep
rint
s?
No.
Gen
eric
, pub
licly
ava
ilabl
e bl
uepr
ints
of S
MRs
will
be
used
in
the
elic
itatio
n. In
vest
igat
ors
will
not
ask
for
prop
riet
ary
info
rmat
ion
rega
rdin
g a
part
icul
ar S
MR
desi
gn.
W
ill h
ard
data
be
elic
ited
for
a pa
rtic
ular
SM
R d
esig
n?
No.
We
will
not
ask
for
desi
gn-s
peci
fic h
ard
data
that
mig
ht
com
prom
ise
prop
riet
ary
vend
or in
form
atio
n.
W
hat w
ill y
ou r
ecei
ve u
pon
the
com
plet
ion
of th
e pr
oced
ure?
W
e w
ill d
eliv
er a
repo
rt a
sses
sing
SM
R ec
onom
ic v
iabi
lity
usin
g th
e el
icite
d es
timat
es. I
f res
pond
ents
’ ano
nym
ity c
an b
e pr
otec
ted,
we
will
del
iver
indi
vidu
al, a
nony
miz
ed e
stim
ates
from
eac
h ex
pert
als
o.
H
ow w
ill p
artic
ipan
ts’ a
nony
mity
be
prot
ecte
d?
Each
par
ticip
ant w
ill b
e as
sign
ed a
num
ber.
No
nam
es w
ill b
e re
cord
ed. W
e w
ill u
se th
is n
umbe
r bo
th o
n th
e au
dio
tape
s an
d on
th
e tr
ansc
ribe
d re
sults
. Aud
io ta
pes
will
be
dest
roye
d on
ce th
e tr
ansc
ript
ion
proc
ess
is c
ompl
eted
.
Page
2

A n
ote
on th
e pi
tfal
ls o
f elic
itatio
n Pa
rt II
. How
will
this
elic
itatio
n w
ork?
Page
3
On
the
follo
win
g pa
ges,
you
will
be
aske
d qu
estio
ns re
latin
g to
the
econ
omic
via
bilit
y of
two
light
wat
er S
MR
des
igns
. Th
e pr
oced
ure
will
firs
t ent
ail t
he c
olle
ctio
n of
som
e de
mog
raph
ic
info
rmat
ion
abou
t you
– th
e ex
pert
– in
a fo
rm th
at d
oesn
’t di
rect
ly
iden
tify
you.
W
e ha
ve d
ivid
ed th
e In
tern
atio
nal A
tom
ic E
nerg
y A
genc
y’s
(IA
EA’s
) cod
e of
acc
ount
s for
a c
onve
ntio
nal n
ucle
ar p
ower
pla
nt
into
twel
ve c
apita
l cos
t mod
ules
. We
will
brie
fly d
iscu
ss h
ow e
ach
of th
ese
mod
ules
will
be
influ
ence
d by
the
mov
e fr
om c
onve
ntio
nal
– i.e
. ske
leta
l – c
onst
ruct
ion
to S
MR
pla
nts.
Estim
ates
for t
he c
apita
l cos
t of S
MR
s – a
nd fo
r som
e SM
R
com
pone
nts –
will
then
be
elic
ited.
We
will
firs
t elic
it th
e lo
wer
-bo
und
estim
ate
(in y
our j
udgm
ent,
wha
t is t
he lo
wes
t pos
sibl
e co
st
for s
aid
com
pone
nt),
then
the
uppe
r-bou
nd e
stim
ate,
bef
ore
aski
ng
for a
n es
timat
e of
‘mos
t lik
ely’
cos
t, w
hich
wou
ld b
e yo
ur ‘b
est
gues
s’. W
e do
this
to a
void
som
e of
the
mor
e pr
omin
ent p
itfal
ls o
f ex
pert
elic
itatio
n, a
s dis
cuss
ed in
the
adja
cent
pan
el to
the
right
. W
e ar
e al
so tr
ying
to d
eter
min
e w
hich
fact
ors s
peci
fic to
SM
Rs
mak
e th
em m
ost e
cono
mic
ally
via
ble
in y
our o
pini
on. S
imila
rly,
wha
t saf
ety
conc
erns
are
mos
t lik
ely
to im
pede
SM
R d
eplo
ymen
t?
In e
ach
of th
ese
sect
ions
, we
hope
to e
ngag
e in
a su
bsta
ntiv
e di
scus
sion
. If y
ou a
re n
ot c
omfo
rtabl
e w
ith a
que
stio
n, d
o no
t he
sita
te to
out
line
your
grie
vanc
es. I
f you
wis
h to
inte
rjec
t with
a
note
you
bel
ieve
is o
f par
ticul
ar im
port
ance
, we
urge
you
to d
o so
. Thi
s elic
itatio
n pr
oced
ure
will
be
reco
rded
onl
y fo
r the
pur
pose
s of
tran
scrib
ing
your
resp
onse
s. U
pon
com
plet
ion
of th
is
trans
crip
tion,
all
tape
s will
be
dest
roye
d.
The
aca
dem
ic li
tera
ture
is r
eple
te w
ith e
vide
nce
emph
asiz
ing
the
subj
ectiv
e na
ture
of e
licita
tion
proc
edur
es
such
as t
hese
. The
re re
mai
ns n
o cl
ear-c
ut fo
rmul
a fo
r how
to
robu
stly
ass
ess a
nd a
djus
t for
this
subj
ectiv
ity.
Res
earc
h sh
ows t
hat r
espo
nden
ts –
bot
h ex
perts
and
layp
eopl
e –
have
a te
nden
cy to
be
over
conf
iden
t whe
n an
swer
ing
ques
tions
. Th
e co
gniti
ve h
euris
tics t
hat p
lagu
e el
icita
tion
proc
edur
es in
clud
e th
e av
aila
bilit
y an
d th
e an
chor
ing
and
adju
stm
ent h
euris
tics.
In th
e av
aila
bilit
y he
uris
tic, a
re
spon
dent
’s a
nsw
er d
epen
ds o
n ho
w e
asy
it is
to re
call
answ
ers
to p
revi
ousl
y-as
ked,
sim
ilar q
uest
ions
. In
the
anch
orin
g th
e ad
just
men
t heu
rist
ic, a
resp
onde
nt c
hoos
es a
n an
swer
that
then
be
com
es a
n an
chor
. All
disc
ussi
ons r
evol
ve a
roun
d th
is n
atur
al
star
ting
poin
t. Th
is a
ncho
r, in
suffi
cien
tly a
djus
ted,
bia
ses t
he
final
resu
lt.
For i
nfor
mat
ion
on th
ese
heur
istic
s, an
d on
dea
ling
with
un
certa
inty
in q
uant
itativ
e ris
k an
d po
licy
anal
ysis
, ple
ase
cons
ult U
ncer
tain
ty, b
y M
orga
n an
d H
enrio
n.
Figu
re d
emon
stra
ting
the
avai
labi
lity
heur
istic
. Fr
om L
icht
enst
ein
et a
l. (1
978)
A
ncho
ring
& a
djus
tmen
t in
EIA
fore
cast
s. Fr
om F
isch
er e
t al.
(RFF
200
8)

Aud
iting
/ Fi
nanc
ial /
Acc
ount
ing
Gov
ernm
ent r
elat
ions
/ M
arke
ting
/ PR
Tech
nica
l ser
vice
s / O
pera
tions
/ R
esea
rch
and
Dev
elop
men
t M
anag
emen
t / P
roje
ct M
anag
emen
t Su
pply
cha
in lo
gist
ics
Hum
an re
sour
ces /
Leg
al
Part
III
. Dem
ogra
phic
info
rmat
ion
Page
4
We
will
now
col
lect
som
e ba
sic
dem
ogra
phic
info
rmat
ion.
Thi
s inf
orm
atio
n sh
ould
hav
e lit
tle b
earin
g on
our
fina
l res
ults
. We
only
wis
h to
co
llect
this
info
rmat
ion
in o
rder
to h
ighl
ight
mor
e ac
cura
tely
the
sum
of s
kills
and
exp
erie
nce
we
have
man
aged
to in
corp
orat
e in
to o
ur
inve
stig
atio
n.
Age
:
Year
you
firs
t wor
ked
in th
e nu
clea
r ind
ustry
:
Num
ber o
f yea
rs sp
ent i
n th
e nu
clea
r ind
ustry
:
Hig
hest
leve
l of e
duca
tiona
l atta
inm
ent:
In w
hich
of t
he fo
llow
ing
area
s do
you
ha
ve p
rofe
ssio
nal e
xper
ienc
e? P
leas
e ch
eck
all t
hat a
pply
:
Num
ber o
f yea
rs sp
ent i
n m
anag
emen
t (if
any)
:
In w
hich
cat
egor
y do
es y
our
curr
ent
posi
tion
fall?
Aud
iting
/ Fi
nanc
ial /
Acc
ount
ing
Gov
ernm
ent r
elat
ions
/ M
arke
ting
/ PR
Tech
nica
l ser
vice
s / O
pera
tions
/ R
esea
rch
and
Dev
elop
men
t M
anag
emen
t / P
roje
ct M
anag
emen
t Su
pply
cha
in lo
gist
ics
Hum
an re
sour
ces /
Leg
al

Part
IV.
Bac
kgro
und
info
rmat
ion
on S
MR
num
ber
1
We
will
con
side
r tw
o SM
R te
chno
logi
es in
this
elic
itatio
n. P
ublic
ly-a
vaila
ble
imag
es a
nd st
atis
tics a
re p
rese
nted
her
e:
We
shal
l cal
l thi
s des
ign
SMR
Num
ber 1
Ther
mal
cap
acity
– 1
60 M
Wt
Elec
trica
l cap
acity
– 4
5 M
we
Cap
acity
fact
or –
gre
ater
than
90
perc
ent
Con
tain
men
t dim
ensi
ons –
60
ft. b
y 14
ft. (
diam
eter
) con
tain
men
t ves
sel m
odul
e R
PV d
imen
sion
s – 4
5 ft.
by
9 ft.
(dia
met
er) r
eact
or v
esse
l mod
ule
RPV
wei
ght –
300
tons
as s
hipp
ed fr
om fa
bric
atio
n Fu
el –
stan
dard
LW
R fu
el in
17
x 17
con
figur
atio
n. 2
4 as
sem
blie
s. Ea
ch 6
ft. l
ong.
Page
5
The
pict
ure
to th
e le
ft is
take
n fr
om C
lean
Tech
nica
(http
://c1
.cle
ante
chni
ca.c
om/fi
les/
2008
/07/
nusc
ale_
pow
er_m
odul
e.jp
g). T
he p
ictu
res i
n th
e ce
nter
and
to th
e rig
ht a
re ta
ken
from
Dr.
Jose
R
eyes
’ (N
uSca
le C
TO) “
Intro
duct
ion
to N
uSca
le D
esig
n” p
re-a
pplic
atio
n pr
esen
tatio
n to
the
Nuc
lear
Reg
ulat
ory
Com
mis
sion
(Jul
y 24
, 200
8).

Part
IV.
Bac
kgro
und
info
rmat
ion
on S
MR
num
ber
2
We
shal
l cal
l thi
s de
sign
SM
R N
umbe
r 2
Ther
mal
cap
acity
– 8
00 M
Wt
Elec
trica
l cap
acity
– 2
25 M
we
Cap
acity
fact
or –
gre
ater
than
90
perc
ent
Con
tain
men
t dim
ensi
ons
– 89
ft. b
y 32
ft. (
diam
eter
) con
tain
men
t ves
sel m
odul
e R
PV d
imen
sion
s –
81 ft
. by
12 ft
. (di
amet
er) r
eact
or v
esse
l mod
ule
RPV
wei
ght –
unk
now
n Fu
el –
sta
ndar
d LW
R fu
el in
17
x 17
con
figur
atio
n. 8
9 as
sem
blie
s. E
ach
8 ft.
long
.
Page
6
The
pict
ure
to th
e le
ft is
a s
naps
hot t
aken
from
the
Wes
tingh
ouse
SM
R v
ideo
(http
://w
ww
.wes
tingh
ouse
nucl
ear.c
om/s
mr/s
mr.w
mv)
. The
pic
ture
in th
e ce
nter
is a
sna
psho
t tak
en fr
om th
e W
estin
ghou
se
web
site
(http
://w
ww
.wes
tingh
ouse
nucl
ear.c
om/s
mr/s
mr.s
wf)
. The
pic
ture
to th
e rig
ht is
take
n fr
om th
e W
estin
ghou
se S
MR
pro
duct
she
et (h
ttp://
ww
w.w
estin
ghou
senu
clea
r.com
/sm
r/fac
t_sh
eet.p
df).

Part
IV. H
ypot
hetic
al n
ucle
ar p
ower
pla
nt fo
otpr
ints
Page
7
Gen
erat
ion
II P
lant
G
ener
atio
n II
I+ P
lant
SM
R 2
SM
R 1
Gen
erat
ion
II P
lant
G
ener
atio
n II
I+ P
lant
SMR
2
SMR
1 Pr
ofile
Vie
w
Top
Vie
w
200
m
(656
ft.)
Bui
ldin
gs in
pin
k ar
e Se
ism
ic I
cate
gory
bui
ldin
gs

Part
IV.
Com
pari
son
of r
eact
or p
ress
ure
vess
el d
imen
sion
s
Page
8
9.8$%$
19.7$%$
29.5$%$
39.4$%$
SMR
1
160
MW
(t)
SMR
2
800
MW
(t)
H = 45ft. (14m) D = 9ft. (3m)!
H = 81ft. (25m) D = 12ft. (4m)!
The picture of the four large reactor RPVs is from:
http://www.rist.or.jp/atom
ica/data/pict/02/02040101/
05.gif. WH = Westinghouse; KWU = KW
U/Siem
ens

Part
IV.
We
wou
ld li
ke to
exp
lore
the
5 sc
enar
ios
belo
w
Page
9
Scen
ario
1
Scen
ario
2
Scen
ario
3
Scen
ario
4
Scen
ario
5
Plan
t with
1 G
enII
I+
conv
entio
nal r
eact
or
1,00
0 M
We
Plan
t with
1
x SM
R 1
45 M
We
Plan
t with
5
x SM
R 1
225
MW
e
Plan
t with
24
x S
MR
1
1,08
0 M
We
Plan
t with
1
x SM
R 2
225
MW
e
Bui
ldin
gs in
pin
k ar
e Se
ism
ic I
ca
tego
ry b
uild
ings
Scen
ario
1: t
he p
ictu
re a
t the
top
is fr
om th
e In
stitu
te fo
r Sou
ther
n St
udie
s (h
ttp://
ww
w.s
outh
erns
tudi
es.o
rg/im
ages
/site
piec
es/A
P100
0Rea
ctor
.jpg)
, and
the
pict
ure
at th
e bo
ttom
is fr
om th
e IA
EA (h
ttp://
aris
.iaea
.org
/son
ar/
imag
e/p0
0179
_im
age0
16.jp
g). S
cena
rios
2 th
roug
h 4:
the
pict
ures
are
from
the
the
IAEA
, clo
ckw
ise
from
top
(con
trol r
oom
: http
://ar
is.ia
ea.o
rg/s
onar
/imag
e/N
uSca
le/N
uSca
le%
20-%
20Fi
g%20
8%20
-%20
Con
trol
%20
Roo
m.p
ng, t
wel
ve-u
nit p
lant
blu
eprin
t: h
ttp://
aris
.iaea
.org
/son
ar/im
age/
NuS
cale
/NuS
cale
%20
-%20
Fig%
209%
20-%
2012
%20
unit%
20m
odel
.png
, and
twel
ve-u
nit p
lant
layo
ut: h
ttp://
aris
.iaea
.org
/son
ar/im
age/
NuS
cale
/N
uSca
le%
20-%
20Fi
g%20
10%
20-%
2012
%20
unit%
20la
yout
.png
). Sc
enar
io 5
: the
pic
ture
at t
he to
p is
from
the
Wes
tingh
ouse
web
site
(http
://w
ww
.wes
tingh
ouse
nucl
ear.c
om/s
mr/i
mag
es/s
mr_
mai
n_he
ader
.png
) and
the
pict
ure
at th
e bo
ttom
is a
sna
psho
t tak
en fr
om th
e W
estin
ghou
se S
MR
vid
eo (h
ttp://
ww
w.w
estin
ghou
senu
clea
r.com
/sm
r/sm
r.wm
v).

Part
V. E
liciti
ng o
vern
ight
cos
ts –
dem
onst
ratio
n
Page
10
In y
our b
est e
ngin
eerin
g ju
dgm
ent,
give
n th
e in
form
atio
n cu
rren
tly a
vaila
ble
and
your
exp
erie
nce
in th
e in
dust
ry, w
hat r
ange
of o
vern
ight
co
sts
– in
dol
lars
per
kW
– d
o yo
u ex
pect
in e
ach
of th
e fo
llow
ing
scen
ario
s? B
elow
, we
dem
onst
rate
the
form
at in
whi
ch w
e w
ould
like
th
e an
swer
to th
is q
uest
ion.
Dem
onst
ratio
n
Scen
ario
0
Range of overnight costs ($/kW)

Part
V. E
liciti
ng o
vern
ight
cos
ts –
con
vent
iona
l rea
ctor
pla
nt
Page
11
In y
our b
est e
ngin
eerin
g ju
dgm
ent,
give
n th
e in
form
atio
n cu
rren
tly a
vaila
ble
and
your
exp
erie
nce
in th
e in
dust
ry, w
hat r
ange
of o
vern
ight
co
sts
– in
dol
lars
per
kW
– d
o yo
u ex
pect
for a
con
vent
iona
l, 1,
000
MW
e nu
clea
r pow
er p
lant
?
Plan
t with
1 G
enII
I+
conv
entio
nal r
eact
or
Scen
ario
1
1,00
0 M
We
Range of overnight costs ($/kW)

Part
V. E
liciti
ng o
vern
ight
cos
ts –
SM
R p
lant
sce
nari
os
Page
12
In y
our b
est e
ngin
eerin
g ju
dgm
ent,
give
n th
e in
form
atio
n cu
rren
tly a
vaila
ble
and
your
exp
erie
nce
in th
e in
dust
ry, w
hat r
ange
of o
vern
ight
co
sts
– in
dol
lars
per
kW
– d
o yo
u ex
pect
for e
ach
of th
e SM
R p
lant
sce
nario
s be
low
? W
e as
sum
e th
at th
e SM
R p
lant
s ar
e po
pula
ted
with
Nth
-of-
a-ki
nd S
MR
mod
ules
.
Plan
t with
1
x SM
R 1
Scen
ario
2
45 M
We
Plan
t with
5
x SM
R 1
Scen
ario
3
225
MW
e
Plan
t with
24
x S
MR
1
Scen
ario
4
1,08
0 M
We
Plan
t with
1
x SM
R 2
Scen
ario
5
225
MW
e
Range of overnight costs ($/kW)
Range of overnight costs ($/kW)
Range of overnight costs ($/kW)
Range of overnight costs ($/kW)

Part
V. P
roba
bilit
y of
sce
nari
os a
chie
ving
a ta
rget
cos
t - 1
Page
13
Wha
t is
the
prob
abili
ty o
f eac
h sc
enar
io a
chie
ving
an
over
nigh
t cos
t le
ss th
an $
4,00
0 pe
r kW
whe
n it
achi
eves
Nth
-of-
a-ki
nd p
enet
ratio
n?
Plan
t with
1 G
enII
I+
conv
entio
nal r
eact
or
Scen
ario
1
1,00
0 M
We
Plan
t with
1
x SM
R 1
Scen
ario
2
45 M
We
Plan
t with
5
x SM
R 1
Scen
ario
3
225
MW
e
Plan
t with
24
x S
MR
1
Scen
ario
4
1,08
0 M
We
Plan
t with
1
x SM
R 2
Scen
ario
5
225
MW
e
0.1
0.2
0.3
0.4
0.9
0.8
0.6
0.7
0.5
0.0
1.0
0.1
0.2
0.3
0.4
0.9
0.8
0.6
0.7
0.5
0.0
1.0
0.1
0.2
0.3
0.4
0.9
0.8
0.6
0.7
0.5
0. 0
1.0
0.1
0.2
0.3
0.4
0.9
0.8
0.6
0.7
0.5
0.0
1.0
0.1
0.2
0.3
0.4
0.9
0.8
0.6
0.7
0.5
0.0
1.0
0.1
0.2
0.3
0.4
0.9
0.8
0.6
0.7
0.5
0.0
1.0
0.1
0.2
0.3
0.4
0.9
0.8
0.6
0.7
0.5
0.0
1.0
0.1
0.2
0.3
0.4
0.9
0.8
0.6
0.7
0.5
0.0
1.0
0.1
0.2
0.3
0.4
0.9
0.8
0.6
0.7
0.5
0.0
1.0
0.1
0.2
0.3
0.4
0.9
0.8
0.6
0.7
0.5
0.0
1.0

Part
V. P
roba
bilit
y of
sce
nari
os a
chie
ving
a ta
rget
cos
t - 2
Page
14
Wha
t is
the
prob
abili
ty o
f eac
h sc
enar
io a
chie
ving
an
over
nigh
t cos
t gr
eate
r tha
n $6
,000
per
kW
whe
n it
achi
eves
Nth
-of-
a-ki
nd p
enet
ratio
n?
Plan
t with
1 G
enII
I+
conv
entio
nal r
eact
or
Scen
ario
1
1,00
0 M
We
Plan
t with
1
x SM
R 1
Scen
ario
2
45 M
We
Plan
t with
5
x SM
R 1
Scen
ario
3
225
MW
e
Plan
t with
24
x S
MR
1
Scen
ario
4
1,08
0 M
We
Plan
t with
1
x SM
R 2
Scen
ario
5
225
MW
e
0.1
0.2
0.3
0.4
0.9
0.8
0.6
0.7
0.5
0.0
1.0
0.1
0.2
0.3
0.4
0.9
0.8
0.6
0.7
0.5
0.0
1.0
0.1
0.2
0.3
0.4
0.9
0.8
0.6
0.7
0.5
0. 0
1.0
0.1
0.2
0.3
0.4
0.9
0.8
0.6
0.7
0.5
0.0
1.0
0.1
0.2
0.3
0.4
0.9
0.8
0.6
0.7
0.5
0.0
1.0
0.1
0.2
0.3
0.4
0.9
0.8
0.6
0.7
0.5
0.0
1.0
0.1
0.2
0.3
0.4
0.9
0.8
0.6
0.7
0.5
0.0
1.0
0.1
0.2
0.3
0.4
0.9
0.8
0.6
0.7
0.5
0.0
1.0
0.1
0.2
0.3
0.4
0.9
0.8
0.6
0.7
0.5
0.0
1.0
0.1
0.2
0.3
0.4
0.9
0.8
0.6
0.7
0.5
0.0
1.0

Part
VI.
Ran
king
con
vent
iona
l pla
nt m
odul
es u
nder
con
side
ratio
n
Page
15
Usi
ng th
e IA
EA C
ode
of A
ccou
nts (
2000
), w
e ha
ve c
onde
nsed
the
capi
tal i
nves
tmen
t in
a po
wer
pla
nt in
to tw
elve
mod
ules
. Th
ese
are
show
n be
low
. Ple
ase
rank
the
mod
ules
bas
ed o
n th
e sh
are
of c
apita
l cos
t tha
t eac
h ac
coun
ts fo
r (ra
nk o
f 1 fo
r th
e m
odul
e th
at a
ccou
nts
for
the
grea
test
sha
re).
We
are
refe
rrin
g to
the
capi
tal c
osts
ass
ocia
ted
with
con
stru
ctio
n of
a c
onve
ntio
nal 1
,000
MW
e nu
clea
r pow
er p
lant
.
We
divi
de a
nuc
lear
pow
er p
lant
into
the
follo
win
g m
odul
es:
Bui
ldin
g an
d si
te p
repa
ratio
n
Rea
ctor
pla
nt e
quip
men
t
Turb
ine
plan
t equ
ipm
ent
Gen
erat
or p
lant
equ
ipm
ent
Con
dens
ate,
feed
wat
er, a
nd m
ain
stea
m sy
stem
Wat
er in
take
and
wat
er re
ject
ion
Elec
trica
l equ
ipm
ent a
nd I&
C p
lant
equ
ipm
ent
HVA
C a
nd fi
re fi
ghtin
g eq
uipm
ent
Site
equ
ipm
ent (
cran
es, h
oist
s, el
evat
ors)
En
gine
erin
g, d
esig
n, a
nd la
yout
serv
ices
Con
stru
ctio
n la
bor,
proj
ect m
anag
emen
t, fa
cilit
ies,
and
tool
s
Tran
spor
tatio
n an
d tra
nspo
rtatio
n in
sura
nce
Rank

Part
VI.
Ran
king
SM
R p
lant
mod
ules
und
er c
onsi
dera
tion
Page
16
We
now
wan
t you
to th
ink
abou
t SM
Rs i
n ge
nera
l. G
iven
the
inhe
rent
cha
ract
eris
tics o
f SM
R p
lant
s, pl
ease
rank
onc
e m
ore
the
mod
ules
ba
sed
on th
e sh
are
of c
apita
l cos
t tha
t – in
you
r eng
inee
ring
judg
men
t – e
ach
will
acc
ount
for (
rank
of 1
for t
he m
odul
e th
at a
ccou
nts f
or
the
grea
test
shar
e).
We
divi
de a
nuc
lear
pow
er p
lant
into
the
follo
win
g m
odul
es:
Bui
ldin
g an
d si
te p
repa
ratio
n
Rea
ctor
pla
nt e
quip
men
t
Turb
ine
plan
t equ
ipm
ent
Gen
erat
or p
lant
equ
ipm
ent
Con
dens
ate,
feed
wat
er, a
nd m
ain
stea
m sy
stem
Wat
er in
take
and
wat
er re
ject
ion
Elec
trica
l equ
ipm
ent a
nd I&
C p
lant
equ
ipm
ent
HVA
C a
nd fi
re fi
ghtin
g eq
uipm
ent
Site
equ
ipm
ent (
cran
es, h
oist
s, el
evat
ors)
En
gine
erin
g, d
esig
n, a
nd la
yout
serv
ices
Con
stru
ctio
n la
bor,
proj
ect m
anag
emen
t, fa
cilit
ies,
and
tool
s
Tran
spor
tatio
n an
d tra
nspo
rtatio
n in
sura
nce
Rank
D
o yo
u fo
rese
e an
y of
the
mod
ules
bei
ng ir
rele
vant
for
SMRs
? W
ould
you
sug
gest
we
igno
re s
ome
of th
e m
odul
es li
sted
?

Part
VI.
Per
cent
age
of c
osts
acc
ount
ed fo
r by
5 to
p-ra
nked
pla
nt m
odul
es
Page
17
For
a ty
pica
l 1,0
00 M
We
conv
entio
nal p
lant
: W
hat p
erce
ntag
e of
cap
ital c
osts
do
you
fore
see
the
top
five
mod
ules
you
cho
se o
n pa
ge 1
5 w
ill a
ccou
nt fo
r?
For
SMR
pla
nts:
W
hat p
erce
ntag
e of
cap
ital c
osts
do
you
fore
see
the
top
five
mod
ules
yo
u ch
ose
on p
age
16 w
ill a
ccou
nt fo
r?
Percentage of capital costs accounted for by the 5 most capital-intensive modules
10%
20%
30%
40%
90%
80%
60%
70%
50%
0%
100%
1,00
0 M
We
conv
entio
nal p
lant
Percentage of capital costs accounted for by the 5 most capital-intensive modules
10%
20%
30%
40%
90%
80%
60%
70%
50%
0%
100%
10%
20%
30%
40%
90%
80%
60%
70%
50%
0%
100%
10%
20%
30%
40%
90%
80%
60%
70%
50%
0%
100%
1 x
SMR
1
45 M
We
5 x
SMR
1
225
MW
e 24
x S
MR
1
1,08
0MW
e 1
x SM
R 2
22
5 M
We

Part
VI.
In
top-
dow
n an
alys
es, c
an m
odul
es b
e sc
aled
usi
ng c
onve
ntio
nal r
eact
or c
osts
? Page
18
In th
e lit
erat
ure,
aut
hors
scal
e gr
oss c
apita
l cos
ts b
y re
acto
r cap
acity
. We
wou
ld n
ow li
ke to
exp
lore
this
app
roac
h to
det
erm
inin
g SM
R
plan
t cap
ital c
osts
. For
a fi
rst a
ttem
pt a
t a to
p-do
wn
cost
est
imat
e, is
it fa
ir to
ass
ume
that
som
e of
the
cost
s ass
ocia
ted
with
a p
lant
op
erat
ing
SMR
s are
scal
able
rela
tive
to th
e ba
se c
ase
of a
con
vent
iona
l (1,
000
MW
e) n
ucle
ar p
ower
pla
nt?
In y
our
engi
neer
ing
judg
men
t, is
it a
ppro
pria
te to
sca
le S
MR
plan
t cap
ital c
osts
? Fo
r ea
ch o
f the
mod
ules
bel
ow, p
leas
e ch
eck
the
appr
opri
ate
boxe
s an
d no
te c
avea
ts, i
f any
. B
uild
ing
and
site
pre
para
tion
Rea
ctor
pla
nt e
quip
men
t
Turb
ine
plan
t equ
ipm
ent
Gen
erat
or p
lant
equ
ipm
ent
Con
dens
ate,
feed
wat
er, a
nd m
ain
stea
m sy
stem
Wat
er in
take
and
wat
er re
ject
ion
Elec
trica
l equ
ipm
ent a
nd I&
C p
lant
equ
ipm
ent
HVA
C a
nd fi
re fi
ghtin
g eq
uipm
ent
Site
equ
ipm
ent (
cran
es, h
oist
s, el
evat
ors)
Engi
neer
ing,
des
ign,
and
layo
ut se
rvic
es
Con
stru
ctio
n la
bor,
proj
ect m
anag
emen
t, fa
cilit
ies,
and
tool
s
Tran
spor
tatio
n an
d tra
nspo
rtatio
n in
sura
nce
Scal
able
by re
acto
r cap
acity
Scal
able
by p
lant
foot
prin
t
Not s
cala
ble
Scal
able,
but
with
cave
ats

Part
VII
. Elic
iting
con
stru
ctio
n sc
hedu
les
- dem
onst
ratio
n
Page
19
Her
e, w
e w
ould
like
you
to p
leas
e sk
etch
app
ropr
iate
con
stru
ctio
n sc
hedu
les f
or v
ario
us p
lant
scen
ario
s. B
elow
, we
dem
onst
rate
the
form
at in
whi
ch w
e w
ould
like
the
answ
er to
this
que
stio
n.
Dem
onst
ratio
n Sc
enar
io 0
Year
0
Year
___
_ Ye
ar _
___
Year
___
_ Ye
ar _
___
Year
___
_
% of project completion
50%
100%
0%

Part
VII
. Elic
iting
con
stru
ctio
n sc
hedu
les
– co
nven
tiona
l rea
ctor
pla
nt
Page
20
Firs
t, ca
n yo
u pl
ease
ske
tch
wha
t wou
ld b
e, in
you
r eng
inee
ring
judg
men
t, an
app
ropr
iate
con
stru
ctio
n sc
hedu
le fo
r a c
onve
ntio
nal,
1,00
0MW
e nu
clea
r pow
er p
lant
con
stru
ctio
n pr
ojec
t?
Plan
t with
1 G
enII
I+
conv
entio
nal r
eact
or
Scen
ario
1
1,00
0 M
We
Year
0
Year
___
_ Ye
ar _
___
Year
___
_ Ye
ar _
___
Year
___
_
% of project completion
50%
100%
0%

Part
VII
. Elic
iting
con
stru
ctio
n sc
hedu
les
– SM
R n
umbe
r 1
Page
21
Shor
ter c
onst
ruct
ion
sche
dule
s m
ay re
duce
the
cost
of c
apita
l for
SM
R o
pera
tors
. C
an y
ou p
leas
e sk
etch
wha
t wou
ld b
e, in
you
r eng
inee
ring
judg
men
t, an
app
ropr
iate
con
stru
ctio
n sc
hedu
le fo
r one
of t
he S
MR
num
ber 1
pl
ant s
cena
rios
we
have
bee
n in
vest
igat
ing?
Plan
t with
1
x SM
R 1
Sc
enar
io 2
45
MW
e
Year
0
Year
___
_ Ye
ar _
___
Year
___
_ Ye
ar _
___
Year
___
_
% of project completion
50%
100%
0%

Part
VII
. Elic
iting
con
stru
ctio
n sc
hedu
les
– SM
R n
umbe
r 2
Page
22
Can
you
do
the
sam
e fo
r the
one
SM
R n
umbe
r 2 p
lant
sce
nario
we
have
bee
n in
vest
igat
ing?
Plan
t with
1
x SM
R 2
Sc
enar
io 5
22
5 M
We
Year
0
Year
___
_ Ye
ar _
___
Year
___
_ Ye
ar _
___
Year
___
_
% of project completion
50%
100%
0%

Part
VII
I. W
hat i
s the
influ
ence
of m
odul
arity
on
SMR
mod
ule
cost
s?
Page
23
How
eco
nom
ical
ly a
dvan
tage
ous i
s the
mod
ular
ity o
f SM
Rs?
If
we
wer
e to
bui
ld S
MR
mod
ule
One
at s
ite A
, and
then
add
mod
ules
incr
emen
tally
– a
ll at
site
A –
how
muc
h of
the
cost
of m
odul
e O
ne
do w
e ex
pect
to in
cur w
ith e
ach
incr
emen
tal u
nit?
Scen
ario
0
Dem
onst
ratio
n
Mod
ule
1
% of first module cost
12
24
15
18
21
9 6
3
Whe
n an
swer
ing
this
que
stio
n, p
leas
e do
the
follo
win
g:
(1)
Plac
e a
dot w
here
you
thin
k th
e fir
st m
odul
e w
ould
be
on th
e y-
axis
(at m
odul
e 1)
(2
) D
raw
the
curv
e th
at c
orre
spon
ds to
you
r est
imat
e of
mod
ular
ity’s
influ
ence
on
the
capi
tal c
ost o
f sub
sequ
ent m
odul
es in
stal
led
at th
e sa
me
site
.

Part
VII
I. W
hat i
s the
influ
ence
of m
odul
arity
on
SMR
num
ber
1 m
odul
e co
sts?
Page
24
How
eco
nom
ical
ly a
dvan
tage
ous i
s the
mod
ular
ity o
f SM
Rs?
If
we
wer
e to
bui
ld S
MR
mod
ule
One
at s
ite A
, and
then
add
mod
ules
incr
emen
tally
– a
ll at
site
A –
how
muc
h of
the
cost
of m
odul
e O
ne
do w
e ex
pect
to in
cur w
ith e
ach
incr
emen
tal u
nit?
SMR
Num
ber
1 45
MW
e m
odul
es
Mod
ule
1
% of first module cost
12
24
15
18
21
9 6
3
Whe
n an
swer
ing
this
que
stio
n, p
leas
e do
the
follo
win
g:
(1)
Plac
e a
dot w
here
you
thin
k th
e fir
st m
odul
e w
ould
be
on th
e y-
axis
(at m
odul
e 1)
(2
) D
raw
the
curv
e th
at c
orre
spon
ds to
you
r est
imat
e of
mod
ular
ity’s
influ
ence
on
the
capi
tal c
ost o
f sub
sequ
ent m
odul
es in
stal
led
at th
e sa
me
site
.

Part
VII
I. W
hat i
s the
influ
ence
of m
odul
arity
on
SMR
num
ber
2 m
odul
e co
sts?
Page
25
How
eco
nom
ical
ly a
dvan
tage
ous i
s the
mod
ular
ity o
f SM
Rs?
If
we
wer
e to
bui
ld S
MR
mod
ule
One
at s
ite A
, and
then
add
mod
ules
incr
emen
tally
– a
ll at
site
A –
how
muc
h of
the
cost
of m
odul
e O
ne
do w
e ex
pect
to in
cur w
ith e
ach
incr
emen
tal u
nit?
SMR
Num
ber
2 22
5 M
We
mod
ules
Mod
ule
1
% of first module cost
3 4
2
Whe
n an
swer
ing
this
que
stio
n, p
leas
e do
the
follo
win
g:
(1)
Plac
e a
dot w
here
you
thin
k th
e fir
st m
odul
e w
ould
be
on th
e y-
axis
(at m
odul
e 1)
(2
) D
raw
the
curv
e th
at c
orre
spon
ds to
you
r est
imat
e of
mod
ular
ity’s
influ
ence
on
the
capi
tal c
ost o
f sub
sequ
ent m
odul
es in
stal
led
at th
e sa
me
site
.

Part
IX
. Wha
t do
you
envi
sion
as
the
perf
ect S
MR
dep
loym
ent s
cena
rio?
Page
26
We
wan
t to
expl
ore
SMR
siti
ng o
ptio
ns. W
hich
com
bina
tion
of fa
ctor
s w
ould
– if
ach
ieve
d –
cons
titut
e a
‘bes
t-cas
e’ s
cena
rio fo
r SM
R
depl
oym
ent?
Thi
s is
esp
ecia
lly im
porta
nt a
s so
me
SMR
ven
dors
are
exp
lorin
g th
e sa
le o
f suc
h un
its to
cou
ntrie
s w
hose
nuc
lear
in
fras
truct
ure
is e
ither
not
as
deve
lope
d as
the
Uni
ted
Stat
es’,
or is
pra
ctic
ally
non
-exi
sten
t.
Can
you
com
men
t on
wha
t the
per
fect
SM
R
depl
oym
ent s
cena
rio w
ould
look
like
?
Dis
cuss
regu
lato
ry in
stitu
tions
, sec
urity
requ
irem
ents
, lab
or c
osts
, ene
rgy
need
s, a
nd c
ost o
f alte
rnat
ives
.
Polit
ical
map
of t
he w
orld
take
n fr
om h
ttp://
ww
w.u
nici
st.n
et/p
artn
ers-
new
s/w
p-co
nten
t/upl
oads
/200
9/01
/pol
itica
l-wor
ld-m
ap-2
007.
gif.
It is
repr
oduc
ed in
bla
ck a
nd w
hite
her
e.

Part
X. A
sses
sing
the
econ
omic
att
ract
iven
ess
of S
MR
s
Page
27
Bot
h ac
adem
ic st
udie
s and
ven
dor m
ater
ials
tout
the
pote
ntia
l eco
nom
ic b
enef
its o
f SM
Rs.
Afte
r stu
dyin
g th
e lit
erat
ure
in d
epth
, we
have
com
pile
d a
list o
f the
se b
enef
its.
Her
e, w
e w
ould
like
you
r opi
nion
on
thes
e be
nefit
s: w
hich
do
you
thin
k m
erit
atte
ntio
n an
d m
ore
rese
arch
, and
whi
ch d
o no
t?
SMR-
spec
ific
adva
ntag
es w
e co
nsid
er h
ere
are:
Fa
ctor
y fa
bric
atio
n of
reac
tor +
NSS
S
Elim
inat
ion
of n
eed
for s
kele
tal c
onst
ruct
ion
Inhe
rent
sim
plic
ity o
f des
ign
Diff
eren
t saf
ety
and
plan
ning
cos
ts
Mor
e fle
xibl
e si
zing
opt
ions
Mor
e fle
xibl
e si
ting
optio
ns
Shor
ter c
onst
ruct
ion
sche
dule
s
Alte
rnat
ive
end-
use
optio
ns
Diff
eren
t dec
omm
issi
onin
g co
sts
Of u
tmos
t va
lue
Of u
tmos
t va
lue
Of n
o va
lue
Of s
ome
valu
e
Of n
o va
lue
Of s
ome
valu
e

Of u
tmos
t co
ncer
n
Part
XI.
Safe
ty a
nd se
curi
ty: c
halle
nges
face
d by
SM
Rs
Page
28
Two
of th
e m
uch-
tout
ed b
enef
its o
f SM
Rs a
re th
at th
ey, i
n th
eory
, elim
inat
e th
e ris
k of
larg
e-br
eak
LOC
As
and
inco
rpor
ate
man
y pa
ssiv
e sa
fety
feat
ures
. Her
e, w
e w
ould
like
you
r opi
nion
on
whi
ch sa
fety
con
cern
s are
alle
viat
ed b
y SM
R
depl
oym
ent (
com
pare
d to
con
vent
iona
l nuc
lear
reac
tors
) and
whi
ch c
once
rns a
re n
ot.
Safe
ty c
once
rns w
e w
ould
like
you
to c
onsi
der a
re:
Act
ive
sabo
tage
(inc
ludi
ng p
rolif
erat
ion)
Larg
e-br
eak
loss
of c
oola
nt a
ccid
ents
Smal
l-bre
ak lo
ss o
f coo
lant
acc
iden
ts
Ope
rato
r tra
inin
g cu
lture
Spen
t fue
l sto
ckpi
le m
anag
emen
t
Com
mon
mod
e fa
ilure
s
Extre
me,
low
-pro
babi
lity
even
ts
Rea
ctor
des
ign
Ade
quac
y of
regu
lato
ry fr
amew
ork
Mai
nten
ance
cul
ture
Loss
of o
ff-si
te p
ower
Of u
tmos
t co
ncer
n O
f no
conc
ern
Of a
s muc
h co
ncer
n as
la
rge
reac
tors
Of n
o co
ncer
n O
f as m
uch
conc
ern
as
larg
e re
acto
rs

Part
XII
. Ope
n-en
ded
ques
tions
Page
29
Bel
ow, y
ou w
ill fi
nd a
list
of q
uest
ions
we
wou
ld a
lso
like
to e
xplo
re.
You
need
not
pro
vide
qua
ntita
tive
resp
onse
s if t
hat m
akes
you
feel
unc
omfo
rtabl
e.
Rea
listic
ally
, in
term
s of n
umbe
r of j
obs r
equi
red,
wha
t pe
rcen
tage
of s
ite-w
ork
do y
ou e
xpec
t to
see
elim
inat
ed th
anks
to
inhe
rent
sim
plic
ity o
f SM
R d
esig
n?
Is th
e on
-site
wor
k yo
u el
imin
ate
parti
cula
rly c
ost-i
nten
sive
? If
so,
wha
t per
cent
age
of m
an-h
ours
do
you
expe
ct to
be
elim
inat
ed
than
ks to
inhe
rent
sim
plic
ity o
f SM
R d
esig
ns?
O&
M c
osts
: can
fuel
cos
ts c
an b
e sc
aled
by
reac
tor o
utpu
t, gi
ven
that
fuel
ass
embl
y de
sign
is e
xact
ly th
at o
f con
vent
iona
l re
acto
rs?
Do
you
belie
ve c
hoos
ing
a pa
rticu
lar s
taffi
ng sc
enar
io
can
have
a si
gnifi
cant
impa
ct o
n SM
R p
lant
ope
ratin
g co
sts?
If y
ou w
ere
in c
harg
e of
the
NR
C, w
hat c
hang
es to
the
Com
mis
sion
’s c
urre
nt a
ppro
ach
to li
cens
ing
SMR
des
igns
wou
ld
you
enac
t to
acce
lera
te th
e co
mm
erci
aliz
atio
n an
d de
ploy
men
t of
SMR
s of t
he li
ght w
ater
var
iety
?
Wha
t que
stio
ns w
ould
you
hav
e lik
ed u
s to
ask?
A
re th
ere
expe
rts y
ou k
now
and
wou
ld b
e co
mfo
rtabl
e ha
ving
us
spea
k to
and
incl
ude
in th
is in
vest
igat
ion?

Supplementary Information:
Appendix S3. Disaggregating the elicitation task using the IAEA code of accounts

A code of accounts is a numbering system that uniquely identifies the individual
components of a project. In 2000, the International Atomic Energy Agency (IAEA)
issued a technical report concerning the “economic evaluation of bids for nuclear power
plants” (29). This was done to help those countries or non-nuclear utilities that wished to
invite bids for nuclear plants but did not yet have a robust authority with its own accounts
system that could evaluate such bids. Presumably, organs like the IAEA also put out this
material to slowly nudge both existing and newly established organizations towards
standardizing everything from the industry’s jargon to the accounts system itself.
Section 4.2 and Annex I of the IAEA’s report describe the Agency’s accounts system in
detail. Here, we are concerned with those components that fall within the scope of
overnight cost. The IAEA labels these costs “fore costs.” The description of these
accounts, taken directly from the IAEA’s report, is presented below. Overnight cost
includes accounts 21 through 41, accounts 50 through 54, and account 70. The subset of
accounts that we considered in this investigation is very close to the scope of overnight
cost as defined by the IAEA. It included accounts 21 through 41 and account 50, but
excluded accounts 51 through 54 and account 70, which fall under the scope of owner’s
cost. The code of accounts was further simplified to make it easier to digest by our
experts, given the limited time we had with each.
We tried to be consistent when answering experts’ queries as to where certain
components, tools, or jobs fell in this classification scheme. One of the IAEA accounts
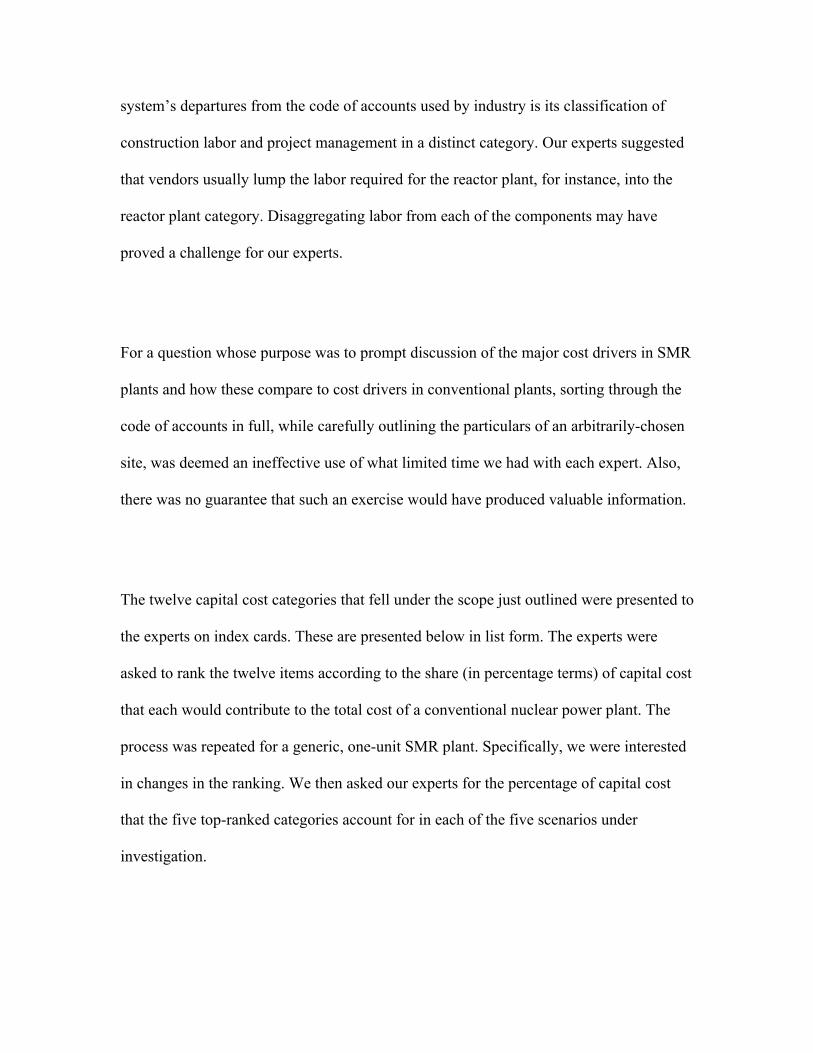
system’s departures from the code of accounts used by industry is its classification of
construction labor and project management in a distinct category. Our experts suggested
that vendors usually lump the labor required for the reactor plant, for instance, into the
reactor plant category. Disaggregating labor from each of the components may have
proved a challenge for our experts.
For a question whose purpose was to prompt discussion of the major cost drivers in SMR
plants and how these compare to cost drivers in conventional plants, sorting through the
code of accounts in full, while carefully outlining the particulars of an arbitrarily-chosen
site, was deemed an ineffective use of what limited time we had with each expert. Also,
there was no guarantee that such an exercise would have produced valuable information.
The twelve capital cost categories that fell under the scope just outlined were presented to
the experts on index cards. These are presented below in list form. The experts were
asked to rank the twelve items according to the share (in percentage terms) of capital cost
that each would contribute to the total cost of a conventional nuclear power plant. The
process was repeated for a generic, one-unit SMR plant. Specifically, we were interested
in changes in the ranking. We then asked our experts for the percentage of capital cost
that the five top-ranked categories account for in each of the five scenarios under
investigation.

Table S2 lists the five top-ranked items for both a conventional nuclear plant and a
generic, one-unit SMR plant, according to each of the experts who responded to this
question. Reactor plant equipment is the one category that is ranked in the top five by all
experts (for both conventional and SMR plants). All experts believe that the share of
capital cost accounted for by reactor plant equipment is higher for SMR plants than it is
for conventional plants. Four other categories are present in more than half of the
responses for a conventional plant. These are (1) turbine plant equipment, (2) building
and site preparation, (3) electrical equipment and I&C plant equipment, and (4)
construction labor, project management, facilities, and tools. For a conventional nuclear
plant, the last of these is ranked highest by almost half of the experts. The proportion of
cost accounted for by construction labor is lower for SMR plants, thanks to the fewer
number of labor-intensive jobs needed at an SMR construction site. Experts agreed that
this is one of the fundamental benefits of SMRs. Building and site preparation is assigned
a lower share of capital cost in SMR plants as well, and it drops out of the top five in
some experts’ judgment. On the other hand, electrical equipment and I&C plant
equipment generally accounts for a greater share of capital cost in an SMR plant, as it is
the same equipment you would need in a conventional plant. While there is commonality
in the rankings, the issue is hardly cut-and-dry: seven out of the twelve categories feature
in ranks one to three for both conventional and SMR plants.
The percentage of capital cost that the five top-ranked items account for in a conventional
1,000MWe Gen III+ plant ranges from 50% to 90%, with general consensus centering on
two-thirds to three-quarters of total project cost, as Figure S3 shows. A similar lack of

consensus exists for the four SMR scenarios. We engaged in a substantial discussion with
each expert regarding the cost of multi-module facilities. Some believed that, with
twenty-four SMRs on a single site, the cost of the twenty-four reactor modules would
dominate the total project cost. Others vehemently disagreed, suggesting that the
operation-construction interface for such a facility would require a large staff. The
common theme we found is that, while some SMR-specific advantages may reduce the
costs of particular components or systems, these effects may be cancelled out by potential
cost inflation in other areas.
The twelve capital cost categories under consideration are listed below, along with a short
summary of what each entails. This list is adapted from the report in question (29):
1) Building and site preparation
- Land reclamation, clearing, and grading
- Access roads, sidewalks, access roads connected with public roads
- Railway access
- Sanitary installations, yard drainage
- Storm sewer systems, waterfront structures
- Harbor and cranes, waterway improvements
- Air access facilities
- Excavation and foundation for buildings
2) Reactor plant equipment

- Reactor vessel and accessories
- Studs, fasteners, seals, gaskets, tubes, and fittings
- Reactor vessel internals (core tank, baffles, shrouds, moderators, reactivity
control components, upper core structure, CR guide assemblies,
distributors, etc.)
- Reactor vessel support structures
- Reactor control devices (CRDMs, in-core instrumentation, neutron
sources, boron shutdown systems)
- Main heat transfer and transport system (coolant system)
- Reactor auxiliary systems
- Reactor ancillary systems
- Nuclear fuel handling and storage systems
3) Turbine plant equipment
- High pressure and low pressure turbines
- Turbine drain system; seal steam/leak off system
- Moisture separator/reheater system
- Turbine bypass system
- Lubrication and control fluid system
- Ancillary equipment (main stops, throttles, valves, piping, insulation,
instrumentation, etc.)
- Support structures, foundation, mechanical parts
4) Generator plant equipment
- Generator
- Water system
- H2 system
- CO2 system
- N2 system
- Lubrication system
- Seal oil system
- Excitation system
5) Condensate, feedwater, and main steam system
- Main condensate, feedwater, and main steam systems
- Piping
- Valves and fittings
- Supports (piping related)
- Insulation
- Pumps, storage tanks, and heaters
- Emergency feedwater system
6) Water intake and water rejection
- Circulation water intake canals, works, structures, etc.
- Water pump structures (circulation, service, process cooling pumps)
- Water overflow structures, surge tanks, discharge canals
- Circulation water aeration structures, water surge ponds

- Cooling water structures, tower pump structures, connection structures,
and discharge structures
- Circulation water piping
7) Electrical equipment and I&C plant equipment
- Bus ducts, breaker systems, and switchgear
- DC distribution and sub-distribution equipment
- Batteries and chargers
- Converters and inverters, plus control and monitoring
- Earthing equipment
- Diesel and diesel control equipment
- Aux equipment: transformers, motors, cables, penetrations, junction boxes,
supporting structures
- Ancillary and communication systems
- Sensors, signal processing equipment, computers, monitoring equipment,
instrumentation equipment
8) HVAC and fire fighting equipment
- Ventilation and air conditioning systems for reactor building, reactor
auxiliary building, and fuel building (those buildings that are in controlled
areas)
- Ventilation and air conditioning systems for those buildings that are not in
controlled areas

- Both of the above include filters, heaters, coolers, fans, blowers,
humidifiers, ducts, piping, valves, and other equipment (motors and
actuators)
- Alarm and sprinkler systems, plus piping and valves
- Mobile installations
- Manually operated fire fighting equipment
9) Site equipment (cranes, hoists, elevators, etc.)
- Polar crane inside reactor building
- Gantry crane outside reactor building
- Cranes in turbine building
- Cranes in reactor auxiliary building
- Elevators in reactor building
- Elevators in reactor auxiliary building
- Elevators in electrical building
- Laboratory equipment
10) Engineering, design, and layout services
- Civil engineering, general plant layout and design
- Mechanical engineering for systems and components
- Electrical engineering for systems and components
- I&C and reactor protection engineering

- Reactor physics, thermodynamics, thermohydraulics, plant dynamics,
analogue computer analysis, earthquake analysis, chemistry and other
engineering activities not directly component or system related
- Construction and/or erection manuals and instruction preparation,
commissioning instructions, operation procedures, as well as quality
assurance measures
11) Construction labor, project management, facilities, and tools
- Civil works, mechanical systems, electrical systems
- Administration, cost control, contracting, scheduling
- Quality assurance
- Field offices with installation, social buildings, warehouses, workshops,
guard houses, and fences
- Provisional installation during construction
- Fuel for engines, turbines, and boilers
- Waste storage and treatment
- Communication equipment
- Heavy construction equipment
12) Transportation and transportation insurance
- Harbor crane
- Gantry
- Unloading equipment

- Lorries
- Scaffolds, ladders, and stairways

Figure Legends:
Figure S3: Share (percentage) of capital cost accounted for by the five top-ranked
categories when constructing conventional and SMR plants. Note that the information is
presented by expert, and not by scenario, because expert rankings differ. In other words,
rankings are comparable across scenarios for each individual expert, but not across
experts.

Figure S3

Tabl
e S2
: Exp
erts
wer
e as
ked
to r
ank
the
twel
ve c
apita
l cos
t ite
ms
in th
e IA
EA’s
Cod
e of
Acc
ount
s by
the
shar
e of
cap
ital c
ost
each
acc
ount
s fo
r bo
th in
a ty
pica
l, 1,
000M
We,
Gen
III+
nuc
lear
pla
nt a
nd in
a g
ener
ic, o
ne-u
nit S
MR
plan
t.
!
Five
top-
rank
ed it
ems i
n a
typi
cal,
1,00
0MW
e, G
en II
I+ n
ucle
ar p
lant
Five
top-
rank
ed it
ems i
n a
gene
ric,
one-
unit
SMR
pla
nt
Le
gend
Ran
k
1 2
3 4
5
1 2
3 4
5
Cod
e It
em
A
R
PE
EIC
C
FS
TPE
GPE
RPE
EI
C
TPE
GPE
C
FS
B
SP
Bui
ldin
g an
d si
te p
repa
ratio
n B
CPM
B
SP
RPE
TP
E EI
C
R
PE
CPM
B
SP
TPE
EIC
RPE
R
eact
or p
lant
equ
ipm
ent
C
R
PE
TPE
CPM
B
SP
EDL
R
PE
CPM
EI
C
TPE
BSP
TPE
Turb
ine
plan
t equ
ipm
ent
D
C
PM
RPE
TP
E C
FS
EIC
RPE
TP
E C
PM
CFS
EI
C
G
PE
Gen
erat
or p
lant
equ
ipm
ent
E
C
PM
RPE
ED
L B
SP
TPE
R
PE
EDL
CPM
TP
E G
PE
C
FS
Con
dens
ate,
feed
wat
er, a
nd m
ain
stea
m sy
stem
F
R
PE
TPE
BSP
C
PM
EDL
B
SP
CPM
R
PE
TPE
GPE
WIR
W
ater
inta
ke a
nd w
ater
reje
ctio
n G
RPE
B
SP
TPE
CPM
ED
L
BSP
C
PM
RPE
TP
E EI
C
EI
C
Elec
trica
l equ
ipm
ent a
nd I&
C p
lant
equ
ipm
ent
H
R
PE
TPE
BSP
C
PM
EIC
BSP
C
PM
EIC
HV
C
HV
AC
and
fire
figh
ting
equi
pmen
t I
EI
C
CPM
ED
L R
PE
GPE
EIC
C
PM
EDL
RPE
G
PE
SE
Q
Site
equ
ipm
ent (
cran
es, h
oist
s, el
evat
ors)
J
C
PM
RPE
TP
E B
SP
EIC
RPE
C
PM
BSP
TP
E W
IR
ED
L En
gine
erin
g, d
esig
n, a
nd la
yout
serv
ices
K
RPE
C
PM
EDL
TPE
BSP
RPE
C
PM
EDL
TPE
BSP
CPM
C
onst
ruct
ion
labo
r, pr
ojec
t man
agem
ent,
faci
litie
s, an
d to
ols
L
C
PM
BSP
R
PE
TPE
CFS
CPM
R
PE
WIR
TP
E B
SP
TT
I Tr
ansp
orta
tion
and
trans
porta
tion
insu
ranc
e

Supplementary Information:
Appendix S4. More details about the expert elicitation

Developing the protocol:
We started with a list of the questions we wanted answered. After several rounds of
discussion among the authors, each of which resulted in the iterative expansion of certain
areas of inquiry, their exclusion, or the refinement of the questions, we settled on queries
related to the following areas:
1. capital costs of each of the five scenarios we developed;
2. the probability that the costs for each scenario would fall below certain target
costs;
3. each single-unit SMR’s construction duration;
4. the components that account for most of the cost of an SMR project;
5. expert judgments on where in the world these reactors could see first-of-a-kind
and nth-of-a-kind deployment; and,
6. a general list of open-ended questions designed to stir discussion.
Once the protocol was completed, we conducted a set of pilot interviews with non-
experts. These were designed to highlight problems in the interviewer’s delivery or in the
phrasing of the questions. As a result of what we learned in these interviews, we
rephrased some questions to better delineate the scope of the investigation, we added a
‘background’ section to provide as much reference information as the pilot testers
deemed necessary to absorb the tasks, and we noted the need for visual aids to help guide
the experts through the protocol. Consultations with researchers in behavioral social
science raised methodological questions regarding the structure of response forms and

visual aids. After further revisions, additional pilot testing was carried out, this time with
an expert from the pool of experts we had been building during the course of the
protocol’s development. Because experts have demanding schedules, we constrained the
protocol so that it took around two hours. In the end, interviews took between one and
four hours. Necessarily, a balance had to be struck between items that went on the
protocol forms and those that were verbally relayed to each expert. Interviews were
recorded and transcribed manually by the authors (we decided against using software in
order to catch the nuances that different intonations suggested. Also, the software we
tried had obvious problems with the terminology and acronyms that were employed).
Where transition words and silence-fillers (like “umm”) were deliberately uttered to
express hesitation about a prompted claim, this was usually brought up in the course of
the interview and duly noted in the transcripts using brackets. Upon transcription, audio
files were deleted.
Addressing the pitfalls of expert elicitation:
Pitfalls such as over confidence, and the bias that cognitive heuristics can produce arise
in any process involving human judgment about uncertainty. The difference in a well-
designed expert elicitation is that one can adopt strategies designed to minimize their
influence. Strategies we employed included: 1) prompting experts to justify their
estimates and 2) asking for probabilistic judgments in more than one way, checking for
consistency in the process. Below, we walk through one example of such an elicitation

for illustrative purposes. The procedure followed was that pioneered by Morgan and
Henrion (10) that provides a more comprehensive treatment.
Assume an expert provided a lower bound estimate for the capital cost of a scenario when
prompted. We then asked them to explain why they thought that number was correct
(regardless of what it was). For example, if an expert provided a lower bound of $3,000
per kWe, we asked why it could not be lower. We might say: "Suppose the number
actually turns out to be $2,500, can you suggest a way in which that might happen?" The
purpose of this prompting exercise was to expand the universe of alternatives that the
expert considered. This process was repeated for the upper bound. In either case, if the
expert revised their estimate, they were effectively considering a more complete universe
of alternatives than they previously had, which means their revised range was less
overconfident than their original range. The expert may stick to their original range after
prompting from the interviewer, which is also fine: the interviewer’s job was to prod and
caution experts about overconfidence (each interview was preceded with a discussion of
what overconfidence is and how it manifests itself in such procedures), not to coerce the
expert into providing a wider range. In order to avoid "anchoring," the interviewer
elicited the median, or “best,” estimate last.
The second method we used to avoid overconfidence was a consistency check. In our
case, once we had elicited a range of estimates of capital cost for each scenario, we
proceeded to a seemingly different question that asked experts for the probability of

capital costs for each scenario (a) falling below $4,000 per kWe and (b) rising above
$6,000 per kWe. By answering these two questions, however, the expert provided us what
we needed to construct a cumulative distribution function (CDF) that we could then
compare to the probabilistic judgments provided in response to the first question above. If
the two CDFs generated two different pictures of capital cost, the inconsistency was
brought to the expert’s attention, and they were asked to revise their estimates.
The above discussion demonstrates the importance of developing a well-specified system
for the elicitation, hence our emphasis on the technical depth that went into developing
each scenario. This supports our argument that, in the context of energy technologies,
asking simply for estimates of “solar panel costs” or “SMR costs” is inappropriate.