Embed Size (px)
Citation preview

2000 4000 6000 8000 10000 12000 14000 16000 18000m/z-21
100
%
-3
100
%
-5
100
%
TOF LD+ 267
7661
511133111514
20552922 3841 4683
565370006199
15307
1129210256 1397513625
TOF LD+ 514x62299
2257
1613
7659
653533112326
2511
2638
5114
435338594417
5655
5699 6668
1532313057
112967882100119033 12768
1314114215
15481
15696 17518 17918
TOF LD+ 58
3310
20132055 1649941623351 1295412108639756524952 6600 7984 1000292788181 10260
1342914820 16231 17709
1+
2+
3+
3+
2+
1+1+
2+
3+
1+
1+
2+
2+
+ =13057+2257 = 1531413057+2299 = 15356
calf H3
Extract on beads + calf H3
Extract on beadsPeptides examined by reflectron
S.1. Endopeptidase activity against calf histone H3.Empty sepharose beads (upper panel) and extract from stationary phase (G0) on sepharose beads (middle panel) were assayed on thymus calf H3 (dark blue circle). Extract from stationary phase (G0) on sepharose beads was assyedin the absence of substrate as control (lowest panel). All reactions were analyzed by MALDI. The two peptides peaksproduct of the reaction are highlighted (red and light blue circle). The light blue peak was analyzed by reflectron (see S2).
Nature Structural & Molecular Biology: doi:10.1038/nsmb.1534
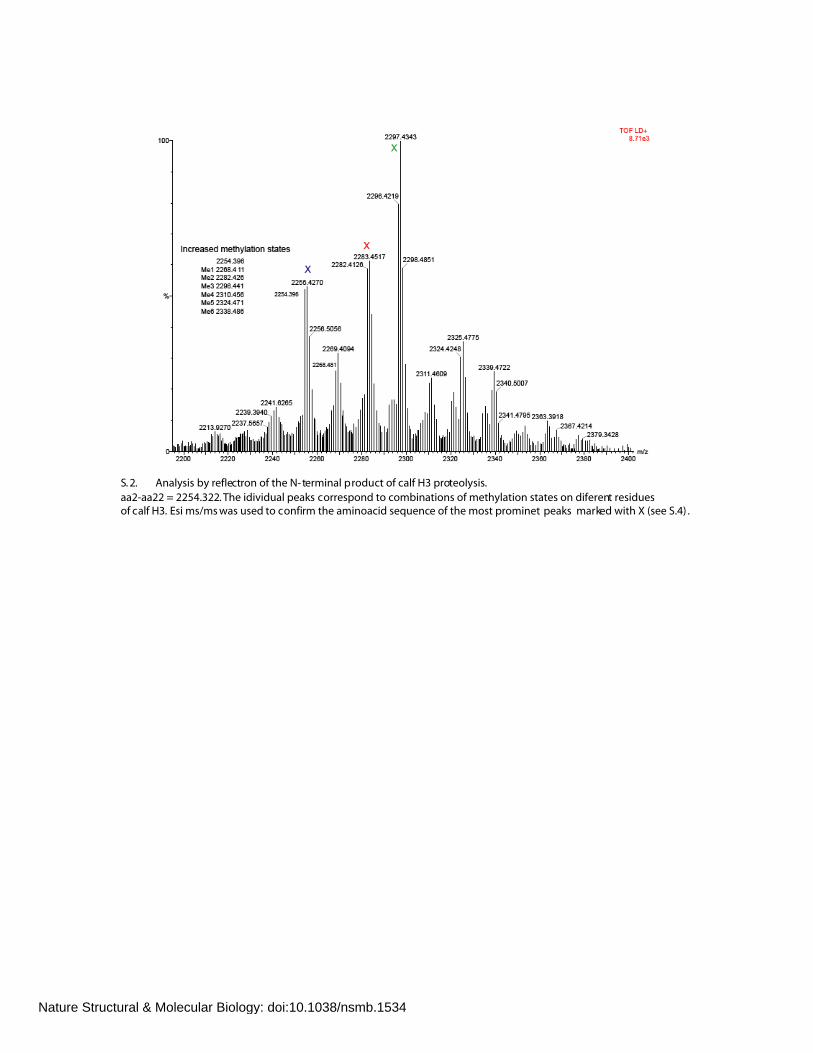
S. 2. Analysis by reflectron of the N-terminal product of calf H3 proteolysis.aa2-aa22 = 2254.322. The idividual peaks correspond to combinations of methylation states on diferent residuesof calf H3. Esi ms/ms was used to confirm the aminoacid sequence of the most prominet peaks marked with X (see S.4) .
Nature Structural & Molecular Biology: doi:10.1038/nsmb.1534

Helena 221-31 peptide + YASL 4-JUL-2008PNAC Facility
1000 1200 1400 1600 1800 2000 2200 2400 2600 2800 3000 3200 3400 3600m/z0
100
%
0
100
%
helena_221-31yasl 9 (0.373) Cn (Cen,1, 50.00, Ht); Sb (2,40.00 ); Cm (1:39) TOF LD+ 1.75e4x4 1676.86
1676.44
1598.85
1570.871116.60
1128.07 1556.881146.78
1677.39 3353.02
1677.84
2255.382254.37
1678.40
1678.82
1679.38
1696.452099.29
1913.13
3351.94
2256.39
3196.81
3195.932257.54
3167.882468.44 2555.58
3355.02
3355.89
3356.98
3357.86
3358.863427.95
helena_221-31 4 (0.184) Cn (Cen,1, 50.00, Ht); Sb (2,40.00 ); Cm (1:15) TOF LD+ 7.65e3x4 3352.96
1677.41
1676.35
1598.87
1118.37 1568.811326.83
3351.921677.88
1678.30
3197.83
3195.871696.482347.45
1697.34 2278.561843.30
2467.42 3167.813154.852740.56
3353.96
3354.94
3355.89
3356.91
3357.84
3391.893425.93
[M+H]+
∆Arg
∆Arg
-116.02 = loss of thioester group (116.03)
22-31teTKAARKSAPA-SCH2CH2COOCH2CH3
1116.63m/z
1-21ARTKQTARKSTGGKAPRKQLA
2254.32m/z
1-21 [M+2H]2+
[M+H]+
1-31te
1-31teARTKQTARKSTGGKAPRKQLATKAARKSAPA -SCH2CH2COOCH2CH3
3351.92m/z
1-31te [M+2H]2+
1-31te [M+2H]2+
1515
S.3. Endopeptidase activity against a synthetic H3 peptide.Sepharose beads bound extract from yeast grown to stationary phase (G0) was assayed on peptide consistingof aa1-aa30 human H3 (upper panel). Empty sepharose beads were assayed on the same peptide as control(lower panel). Both reactions were analyzed by MALDI. The substrate and the two peptides product are highlighted (red). 1-31te = 1-31thioester
Nature Structural & Molecular Biology: doi:10.1038/nsmb.1534

helena_calfH3beads_4
T:
250 300 350 400 450 500 550 600 650 700 750 800
m/z
0
20
40
60
80
100737.74673.63
685.28
642.30457.19
636.37521.42 672.79574.98 593.69 712.36 783.43
664.80 686.34607.31512.67459.22 738.40554.44454.92314.19228.22 784.41300.87253.87 538.39 746.01326.09 354.04 430.89365.16 792.56387.35
x3
850 900 950 1000 1050 1100 1150 1200 1250 1300 1350 1400
m/z
0
20
40
60
80
1001014.43
1213.62 1341.68
877.78 899.62 1214.851126.67 1342.62963.42 1015.301005.40 1108.341035.06868.78 1343.441127.64835.52 1324.741195.50955.07 1089.81 1395.231178.79969.53 1075.56 1291.70900.59 1245.24
1354.67
x3
1450 1500 1550 1600 1650 1700 1750 1800 1850 1900 1950 2000
m/z
0
20
40
60
80
100
1464.12
1411.671631.981476.68 1664.001508.71 1566.311417.32 1528.69 1823.551738.971624.491481.04 1756.731675.281583.59 1724.85
x10
2254.3MH+ ms/ms 3+
y12
y19 2+
y13y11
y9
y7
y18 2+y17 2+
ARTKQTARKSTGGKAPRKQLAPredicted y-ions for this sequence
y9-y13 and y172+-y192+ pattern and peptide mass consistent with sequence
S 4. ES ms/ms analysis of the H3 endopeptidase N-terminal product “X” .
“X” :
Nature Structural & Molecular Biology: doi:10.1038/nsmb.1534
250 300 350 400 450 500 550 600 650 700 750 800
m/z
0
20
40
60
80
100747.17
783.54645.95
651.80544.72 640.08594.73741.54590.86547.05
535.40459.15 612.17484.16723.13527.40 798.96548.03436.01 768.71228.98 485.65 657.05335.24 463.28313.11 414.61 712.29365.16295.20
685.85404.34390.75354.62266.01248.33
x5 x3
850 900 950 1000 1050 1100 1150 1200 1250 1300 1350 1400
m/z
0
20
40
60
80
100
R
e
l
a
t
i
v
e
A
b
u
n
d
a
n
c
e
913.63 1126.58968.381108.62
904.87840.44 1370.55969.37
891.70 978.44 1127.88850.651213.63
868.52 1214.671178.85914.42 1028.98 1160.59999.40947.37 1311.83
834.46 1073.91 1339.821298.31
942.42 1081.87 1351.83 1371.731041.48 1330.781224.36 1265.43
x5 x5 x10
1450 1500 1550 1600 1650 1700 1750 1800 1850 1900 1950 2000
m/z
0
20
40
60
80
100
1424.841577.881515.57
1650.021479.631457.62 1808.731537.70 1606.90 1727.14 1749.971707.98 1920.99
x10
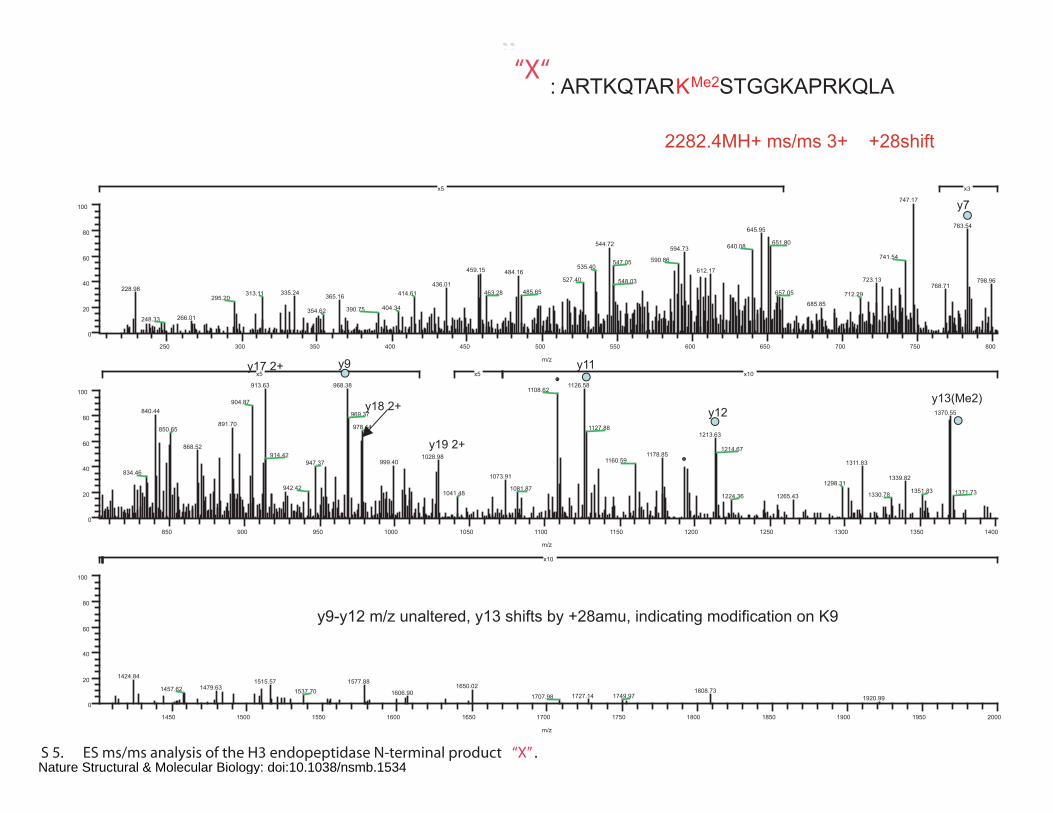
2282.4MH+ ms/ms 3+ +28shift
y12
y19 2+
y13(Me2)
: ARTKQTARKMe2STGGKAPRKQLA
y11y9
y7
y17 2+
y18 2+
y9-y12 m/z unaltered, y13 shifts by +28amu, indicating modification on K9
”“X“
S 5. ES ms/ms analysis of the H3 endopeptidase N-terminal product “X” . Nature Structural & Molecular Biology: doi:10.1038/nsmb.1534
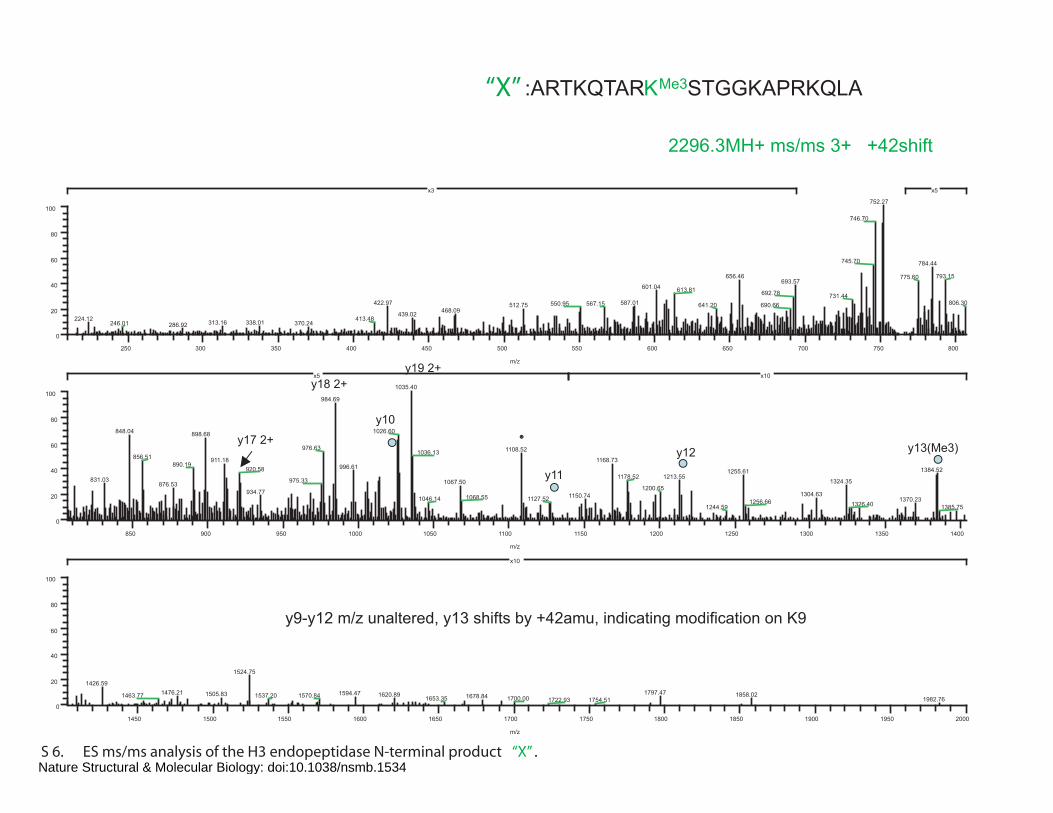
S 6. ES ms/ms analysis of the H3 endopeptidase N-terminal product “X” .
250 300 350 400 450 500 550 600 650 700 750 800
m/z
0
20
40
60
80
100752.27
746.70
745.70 784.44
656.46 793.15775.60693.57
601.04 613.81 692.78 731.44587.01 806.30422.97 567.15550.95 690.66641.20512.75
468.09439.02413.48224.12 313.16 338.01246.01 370.24286.92
x3 x5
850 900 950 1000 1050 1100 1150 1200 1250 1300 1350 1400
m/z
0
20
40
60
80
100
R
e
l
a
t
i
v
e
A
b
u
n
d
a
n
c
e
1035.40
984.69
1026.60848.04 898.68
976.63 1108.521036.13856.51 1168.73911.18
890.19 996.61920.58 1384.521255.611213.551178.52831.03 975.33 1324.351067.50876.53 1200.65934.77 1304.631150.741068.55 1127.521046.14 1370.231256.66 1326.40 1385.751244.59
x5 x10
1450 1500 1550 1600 1650 1700 1750 1800 1850 1900 1950 2000
m/z
0
20
40
60
80
100
1524.75
1426.591476.21 1797.471594.471505.83 1620.89 1858.021463.77 1537.20 1570.84 1678.84 1700.001653.35 1982.761722.93 1754.51
x10
2296.3MH+ ms/ms 3+ +42shift
y12 y13(Me3)
y11
y10
y19 2+y18 2+
y17 2+
:ARTKQTARKMe3STGGKAPRKQLA
y9-y12 m/z unaltered, y13 shifts by +42amu, indicating modification on K9
“X”
Nature Structural & Molecular Biology: doi:10.1038/nsmb.1534
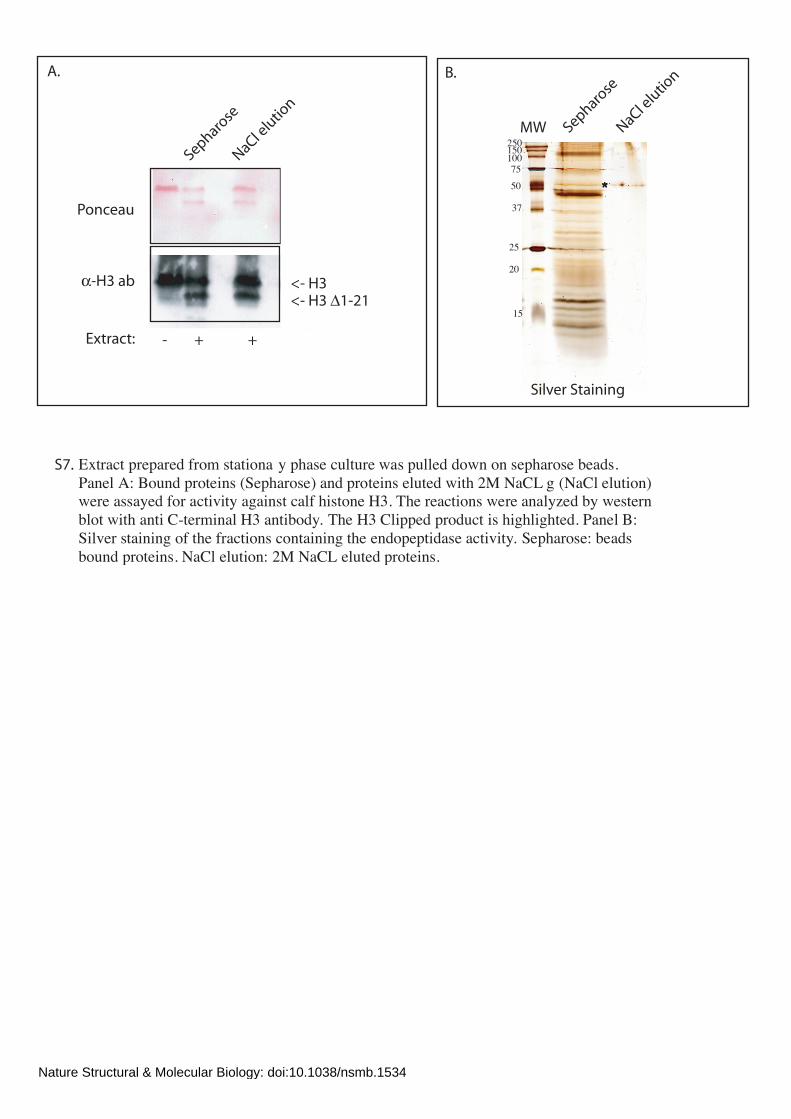
Extract prepared from stationa
r
y phase culture was pulled down on sepharose beads.Panel A: Bound proteins (Sepharose) and proteins eluted with 2M NaCL g (NaCl elution)were assayed for activity against calf histone H3. The reactions were analyzed by westernblot with anti C-terminal H3 antibody. The H3 Clipped product is highlighted. Panel B:Silver staining of the fractions containing the endopeptidase activity. Sepharose: beadsbound proteins. NaCl elution: 2M NaCL eluted proteins.
S7.
MW Sepharose
NaCl elu
tion
50
37
25
20
15
75100150250
Silver Staining
B. A.
Ponceau
α-H3 ab
Extract: - + +
NaCl elu
tion
Sepharose
<- H3<- H3 ∆1-21
Nature Structural & Molecular Biology: doi:10.1038/nsmb.1534
0
0.5
1
1.5
2
2.5
1 2 3 4 5 6 7 8 9 10 11 12 13 14
OD: 0.6 OD: 5 OD: 7 OD: 11
Relative Fluorescense Units
Chromatin Inmunoprecipitation HSP12 promoter
CN
C
N C
N CN
0
50
100
150
200
250
300
350
400
1 2 3 4
OD: 0.6 OD: 5 OD: 7 OD: 11
HSP12 mRNA level
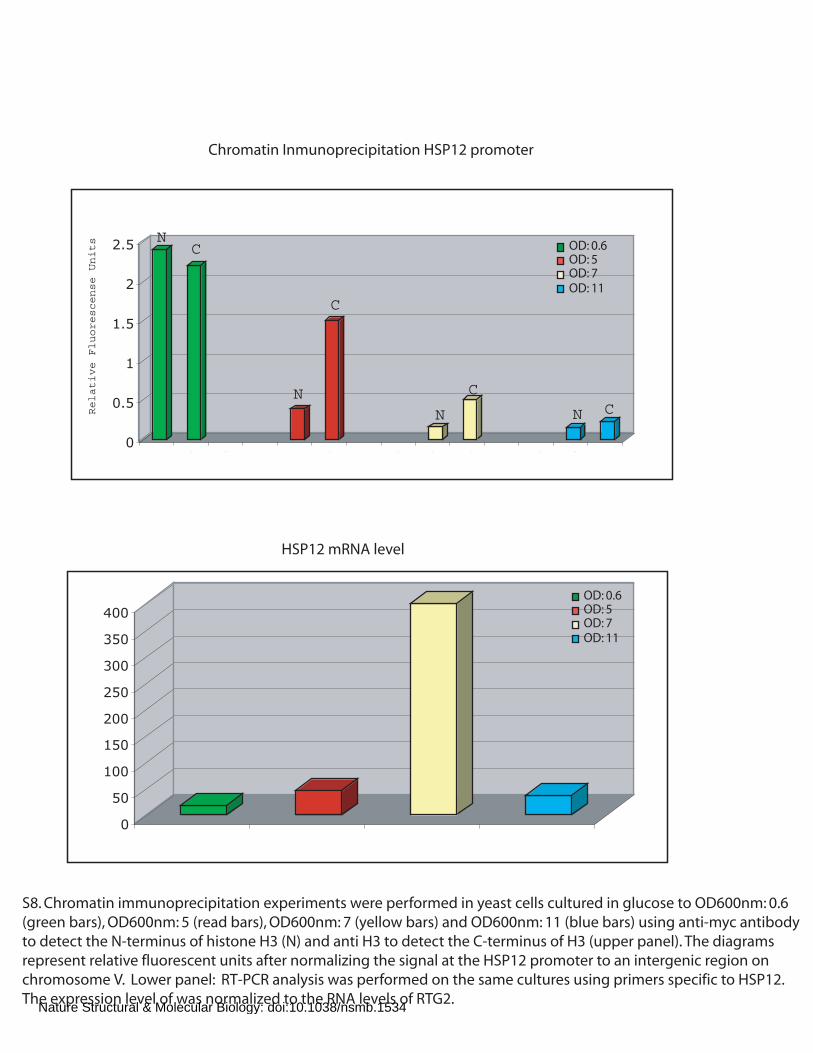
S8. Chromatin immunoprecipitation experiments were performed in yeast cells cultured in glucose to OD600nm: 0.6 (green bars), OD600nm: 5 (read bars), OD600nm: 7 (yellow bars) and OD600nm: 11 (blue bars) using anti-myc antibody to detect the N-terminus of histone H3 (N) and anti H3 to detect the C-terminus of H3 (upper panel). The diagrams represent relative fluorescent units after normalizing the signal at the HSP12 promoter to an intergenic region on chromosome V. Lower panel: RT-PCR analysis was performed on the same cultures using primers specific to HSP12. The expression level of was normalized to the RNA levels of RTG2.
Nature Structural & Molecular Biology: doi:10.1038/nsmb.1534

Supplementary Table 1
S1 NMA111
S8 PRB1
S8 YSP3
S8 KEX2
S8 YCR54C
S9 DAP2
S9 YNL320W
S10 YBR139W
S10 KEX1
S16 PIM1
S26 IMP1
S26 IMP2
S33 YJU3
S33 MET2
S33 ECM18
S33 ICT1
S54 YGR101W
S54 YOL107W
S52 RBD2
S59 NUP100
S9 STE13
S59 NUP145 (unviable)
S59 NSP116 (unviable)
S26 SEC11 (unviable)
S10 PRC1
S: Serine protease
Table 1. Knocked out strains tested for H3 endopeptidase activity.
All strains were BY4741 background from Open Biosystem. Yeasts were grown to
stationary phase (OD600mn=5-7) and proteins bound to sepharose beads were assayed on
recombinant histone H3. The activity was detected by western blot with anti H3 antibody.
Nature Structural & Molecular Biology: doi:10.1038/nsmb.1534


![[XLS]images.nature.com · Web viewSheet3 Sheet2 Sheet1 IHIHJGHHGEFB?EGGJJIIJJJJIIJIHJJJHHHHHFFFFFCCC HWI-1KL140:55:C20PMACXX:7:1202:12155:176874 1S28M CATATTTTCTTGTTGCTTCTTAACTAGCT](https://img.dokumen.tips/doc/110x75/5b024b8c7f8b9a6a2e8f9246/xls-viewsheet3-sheet2-sheet1-ihihjghhgefbeggjjiijjjjiijihjjjhhhhhfffffccc-hwi-1kl14055c20pmacxx7120212155176874.jpg)


