Embed Size (px)
Citation preview

Supplemental Materials for:
Fibrocyte-like cells recruited to the spleen support innate and
adaptive immune responses to acute injury or infection
Tatiana Kisseleva1,*, Maren von Köckritz-Blickwede2, Donna Reichart3, Shauna M.
McGillvray2, Gerhard Wingender4, Mitchell Kronenberg4, Christopher K. Glass3,
Victor Nizet2,5* and David A. Brenner1
Supplemental Methods
Supplemental References
Supplemental Figures S1-S5 & Legends
Supplementary tables 1 and 2

Supplemental Methods
Mice: C57BL/6 (CD45.2 Ly5.2) mice and congenic CD45.1 Ly5.1 (#2014, referred to as “SJL”), β-actin-RFP (#6051) were purchased from The Jackson Laboratory (Bar Harbor, Main). The following mouse strains have been described previously: T cell receptor transgenic animals specific for peptides derived from chicken ovalbumin presented by H2-KP
bP (OVA P
257-264P, Vα2/β5, #3831, referred to as OT-I) (Hogquist et al.,
1994) or by I-Ab (OVAP
323-339P, Vα2/β5, #4194, referred to as OT-II) [1]; transgenic animals expressing
membrane bound chicken ovalbumin under the actin promotor (#5145, Act-mOVA) [2]; animals bearing point mutations in H2-KPbP which abrogates the presentation of OVAP
257-264P (H2-KP
bm1P, #1060, referred to as
bm1)[3]. OT-I mice were crossed with bm1 and SJL mice (OTI/bm1) and Act-mOVA mice were crossed with the bm1 mouse strain (Act-mOVA/bm1). Mice from both intercrosses were kindly provided by Dr. Schoenberger (La Jolla, CA, USA). Mice were maintained under SPF conditions at the animal facilities of UCSD (San Diego, CA, USA) and LIAI (La Jolla, CA, USA). Whole mouse genome expression microarray: The gene expression profile of CD45P
+PColP
+P cells was studied using Whole Mouse Genome Microarray
(Agilent). Splenic CD45P+PColP
+P cells were isolated from spleens of LPS-treated (6 µg/g x 3 injections) Col-
GFP mice. B-1 cells (CD5P
+PCD19P
+P) were sorted from peritoneal lavage of C57BL/6 mice. Peritoneal
macrophages were isolated from thioglycollate-stimulated C57BL/6 mice, activated for 6h with KdoR2R-Lipid A (100 ng/ml, activated macrophages, aMΦ), or left intact (quiescent macrophages, qMΦ). Total RNA from each sample was isolated using RNAeasy columns (Qiagen, Valencia, CA), 160 ng of purified RNA per sample was labeled using the LRILAK PLUS, two color low RNA input Linear Amplification kit and hybridized to a Whole Mouse Genome Microarray 4x44K 60 mer slide according to the manufacturer’s instructions (Agilent, Santa Clara, CA). Slides were scanned using the Agilent GZ505B Scanner and analyzed using the Gene Spring Software (Agilent). Quantitative RT-PCR: Total RNA was isolated from cells using RNeasy columns (Qiagen, Valencia, CA). First strand cDNA was synthesized using SuperScript III and random hexamers (Invitrogen, Carlsbad, CA). Samples were run in 20 ul reactions using an AB1 7300 (Applied Biosystems, Foster City, CA). SYBR Green oligonucleotides were used for detection and quantification of genes. Sequence-specific primers are listed below. Gene expression levels were calculated after normalization to the standard housekeeping gene GAPDH using the ∆∆ CT method as described by the manufacturer (Invitrogen, Carlsbad, CA), and expressed as relative mRNA levels compared with control. The results are represented as average ± SEM, p<0.0001 Primers for RT-PCR
Gene/Primers Forward Reverse
CD34 AAGGCTGGGTGAAGACCCTTA AAGGCTGGGTGAAGACCCTTA
mCramp GCTGTGGCGGTCACTATCAC TGTCTAGGGACTGCTGGTTGA
Chi3I3 AGAAGGGAGTTTCAAACCTGGT GTCTTGCTCATGTGTGTAAGTGA
Collagen α1(I) ACATGTTCAGCTTTGTGGACC TAGGCCATTGTGTATGCAGC
Carbohydrate sulfotransferase 1
ATGCAATGTTCTTGGAAGGCT CTCCTCACACAACCGCTCT
Gapdh AATGTGTCCGTCGT CATCGAAGGTGGAAGAGTGG

Gr-1 GCAGTGCTACGAGTGCTATGG ACTGACGGGTCTTTAGTTTCCTT
Haptoglobin GCTATGTGGAGCACTTGGTTC CACCCATTGCTTCTCGTCGTT
IL-18r1 ACTTTTGCTGTGGAGACGTTAC CCGGCTTTTCTCTATCAGTGAAT
Lactotransferrin TGAGGCCCTTGGACTCTGT ACCCACTTTTCTCATCTCGTTC
Myeloperoxidase AGTTGTGCTGAGCTGTATGGA CGGCTGCTTGAAGTAAAACAGG
Ngp AGACCTTTGTATTGGTGGTGGC GGTTGTATGCCTCTATGGCTCTA
Perforin GCTCCCACTCCAAGGTAGC TTTGTACCAGGCGAAAACTGT
Proteoglycan 2 TGAAACTTCTGACTCCAAAAGCC CGGCATTAGCTCTTCCCCT
S100a9 TTACTTCCCACAGCCTTTGC AGGACCTGGACACAAACCAG
Vcam 1 CCATTGAAGATACCGGGAAAT TAGCTGTCTGCTCCACAGGAT
Visualization of the extracellular DNA traps. Splenic CD45P+PColP
+P cells (2 x 10P5P cells) were seeded on
Poly-l-lysine (Sigma) coated glass cover slides (8 mm diameter, 1.5 thick, Electron Microscopy Science), infected with L. monocytogenes (MOI 1:0.1 cell/bacteria), centrifuged for 5 min at 300g, incubated for additional 40 min at 37°C and 5% COR2R, fixed in 4% PFA, then washed 3 times with PBS, blocked with PBS + 3% BSA and stained with rabbit anti-cathelicidin antimicrobial peptide [4], followed by secondary goat anti rabbit Alexa fluor 568 (Invitrogen). Slides were embedded in ProlongGold antifade + Dapi (Molecular Probes) to visualize the DNA traps. To visualize live/dead bacteria, splenic CD45P
+PColP
+P cells (2 x 10P5P cells)
were co-cultured with bacteria (MOI 1:2 cell/bacteria) for 40 min, and analyzed by Live/dead BacLight Bacterial Viability Kit (Molecular Probes) following the recommendations of the manufacturer. After staining, cells were washed 3 times with PBS, fixed with 1% paraformadehyde for 5 min, washed again and mounted onto glass slides using Prolong Gold Dapi. Mounted samples were examined using an inverted confocal laser-scanning 2-photon microscope Olympus Fluoview FV1000 using a 60x/1.42 PlanApo oil objective at calibrated magnifications and FluoviewP
TMP Spectral Scanning technology (Olympus).
TFlow cytometry. TAntibodies used in this study are as follow: CD3-PE, CD8α-FITC, CD4-FITC, CD11b-PE, CD11c-APC, CD19-APC, Ter119-PE, B220-PE, B220-PE-Cy7.5, IgM-PE, IgD-APC, CD14-FITC, F4/80-APC, c-kit-PE-Cy7, Sca-1-PerCp-Cy5.5, IL-1-PE, IL-4-PE, IL-5-PE, IL-12-APC, TNF-α, IFN-γ (eBioscience, San Diego, CA). Intracellular staining was performed using BD Cytofix/Cytoperm fixation and Permeabilization Solution (BD, San Jose, CA).
SUPPLEMENTAL REFERENCES:
USupplemental References 1 (Transmigration) [5-10]
USupplemental References 2 (Anti-microbial defense) [11-22]
USupplemental References 3 (Antigen presentation) [23-36]
1. Barnden MJ, Allison J, Heath WR, Carbone FR (1998) Defective TCR expression in transgenic mice constructed using cDNA-based alpha- and beta-chain genes under the control of heterologous regulatory elements. Immunol Cell Biol 76: 34-40
2. Ehst BD, Ingulli E, Jenkins MK (2003) Development of a novel transgenic mouse for the study of interactions between CD4 and CD8 T cells during graft rejection. Am J Transplant 3: 1355-1362
3. Clarke SR, Barnden M, Kurts C, Carbone FR, Miller JF, Heath WR (2000) Characterization of the ovalbumin-specific TCR transgenic line OT-I: MHC elements for positive and negative selection. Immunol Cell Biol 78: 110-117
4. Dorschner RA, Pestonjamasp VK, Tamakuwala S, Ohtake T, Rudisill J, Nizet V, Agerberth B, Gudmundsson GH, Gallo RL (2001) Cutaneous injury induces the release of cathelicidin anti-microbial peptides active against group A Streptococcus. J Invest Dermatol 117: 91-97
5. Dale I, Fagerhol MK, Naesgaard I (1983) Purification and partial characterization of a highly immunogenic human leukocyte protein, the L1 antigen. Eur J Biochem 134: 1-6
6. Eue I, Pietz B, Storck J, Klempt M, Sorg C (2000) Transendothelial migration of 27E10+ human monocytes. Int Immunol 12: 1593-1604
7. Gebhardt C, Nemeth J, Angel P, Hess J (2006) S100A8 and S100A9 in inflammation and cancer. Biochem Pharmacol 72: 1622-1631
8. Newton RA, Hogg N (1998) The human S100 protein MRP-14 is a novel activator of the beta 2 integrin Mac-1 on neutrophils. J Immunol 160: 1427-1435
9. Rammes A, Roth J, Goebeler M, Klempt M, Hartmann M, Sorg C (1997) Myeloid-related protein (MRP) 8 and MRP14, calcium-binding proteins of the S100 family, are secreted by activated monocytes via a novel, tubulin-dependent pathway. J Biol Chem 272: 9496-9502
10. Steinbakk M, Naess-Andresen CF, Lingaas E, Dale I, Brandtzaeg P, Fagerhol MK (1990) Antimicrobial actions of calcium binding leucocyte L1 protein, calprotectin. Lancet 336: 763-765
11. Kraus D, Peschel A (2008) Staphylococcus aureus evasion of innate antimicrobial defense. Future Microbiol 3: 437-451
12. Legrand D, Elass E, Carpentier M, Mazurier J (2005) Lactoferrin: a modulator of immune and inflammatory responses. Cell Mol Life Sci 62: 2549-2559

13. Ward PP, Conneely OM (2004) Lactoferrin: role in iron homeostasis and host defense against microbial infection. Biometals 17: 203-208
14. Nizet V, Ohtake T, Lauth X, Trowbridge J, Rudisill J, Dorschner RA, Pestonjamasp V, Piraino J, Huttner K, Gallo RL (2001) Innate antimicrobial peptide protects the skin from invasive bacterial infection. Nature 414: 454-457
15. Rehaume LM, Hancock RE (2008) Neutrophil-derived defensins as modulators of innate immune function. Crit Rev Immunol 28: 185-200
16. Debono M, Gordee RS (1994) Antibiotics that inhibit fungal cell wall development. Annu Rev Microbiol 48: 471-497
17. HogenEsch H, Dunham A, Seymour R, Renninger M, Sundberg JP (2006) Expression of chitinase-like proteins in the skin of chronic proliferative dermatitis (cpdm/cpdm) mice. Exp Dermatol 15: 808-814
18. Lehtonen A, Ahlfors H, Veckman V, Miettinen M, Lahesmaa R, Julkunen I (2007) Gene expression profiling during differentiation of human monocytes to macrophages or dendritic cells. J Leukoc Biol 82: 710-720
19. Kristiansen M, Graversen JH, Jacobsen C, Sonne O, Hoffman HJ, Law SK, Moestrup SK (2001) Identification of the haemoglobin scavenger receptor. Nature 409: 198-201
20. Schaer CA, Vallelian F, Imhof A, Schoedon G, Schaer DJ (2007) CD163-expressing monocytes constitute an endotoxin-sensitive Hb clearance compartment within the vascular system. J Leukoc Biol 82: 106-110
21. Eaton JW, Brandt P, Mahoney JR, Lee JT, Jr. (1982) Haptoglobin: a natural bacteriostat. Science 215: 691-693
22. Van Vlierberghe H, Langlois M, Delanghe J (2004) Haptoglobin polymorphisms and iron homeostasis in health and in disease. Clin Chim Acta 345: 35-42
23. Blott EJ, Griffiths GM (2002) Secretory lysosomes. Nat Rev Mol Cell Biol 3: 122-131
24. Dustin ML, Tseng SY, Varma R, Campi G (2006) T cell-dendritic cell immunological synapses. Curr Opin Immunol 18: 512-516
25. Lettau M, Schmidt H, Kabelitz D, Janssen O (2007) Secretory lysosomes and their cargo in T and NK cells. Immunol Lett 108: 10-19
26. Levy S, Todd SC, Maecker HT (1998) CD81 (TAPA-1): a molecule involved in signal transduction and cell adhesion in the immune system. Annu Rev Immunol 16: 89-109
27. Metzelaar MJ, Wijngaard PL, Peters PJ, Sixma JJ, Nieuwenhuis HK, Clevers HC (1991) CD63 antigen. A novel lysosomal membrane glycoprotein, cloned by a screening procedure for intracellular antigens in eukaryotic cells. J Biol Chem 266: 3239-3245
28. Pipkin ME, Lieberman J (2007) Delivering the kiss of death: progress on understanding how perforin works. Curr Opin Immunol 19: 301-308

29. van der Merwe PA (2002) Formation and function of the immunological synapse. Curr Opin Immunol 14: 293-298
30. Voskoboinik I, Smyth MJ, Trapani JA (2006) Perforin-mediated target-cell death and immune homeostasis. Nat Rev Immunol 6: 940-952
31. Cardier JE, Barbera-Guillem E (1997) Extramedullary hematopoiesis in the adult mouse liver is associated with specific hepatic sinusoidal endothelial cells. Hepatology 26: 165-175
32. D'Addario M, Arora PD, Fan J, Ganss B, Ellen RP, McCulloch CA (2001) Cytoprotection against mechanical forces delivered through beta 1 integrins requires induction of filamin A. J Biol Chem 276: 31969-31977
33. Glogauer M, Arora P, Chou D, Janmey PA, Downey GP, McCulloch CA (1998) The role of actin-binding protein 280 in integrin-dependent mechanoprotection. J Biol Chem 273: 1689-1698
34. Jiang S, Bailey AS, Goldman DC, Swain JR, Wong MH, Streeter PR, Fleming WH (2008) Hematopoietic stem cells contribute to lymphatic endothelium. PLoS ONE 3: e3812
35. Lynch L, O'Donoghue D, Dean J, O'Sullivan J, O'Farrelly C, Golden-Mason L (2006) Detection and characterization of hemopoietic stem cells in the adult human small intestine. J Immunol 176: 5199-5204.
36. Wright N, Samuelson L, Walkup MH, Chandrasekaran P, Gerber DA (2008) Enrichment of a bipotent hepatic progenitor cell from naive adult liver tissue. Biochem Biophys Res Commun 366: 367-372

SUPPLEMENTAL FIGURES
Supplemental Figure S1. Splenic CD45P
+PColP
+P cells give rise to fibrocytes in vitro.
Splenic CD45P+PColP
+P cells from CClR4R-treated Col-into-wt mice were cultured on plastic in RPMI + 10% FCS
for 7 days, and gave rise to spindle-shaped ColP
+P fibrocytes. Representative images of three independent
experiments are shown.
Supplemental Figure S2. Phenotyping of splenic CD45P
+PColP
+P.
Flow cytometry analysis of splenic CD45P
+PColP
+P cells of LPS-treated Col-GFP mice. Dot plot analysis of
intracellular cytokines expression revealed that splenic CD45P
+PColP
+P upregulated Th1 type of cytokines IFN-
γ (19%), TNF-α (33%) and IL-1 (27%). The representative images of three different experiments are shown.
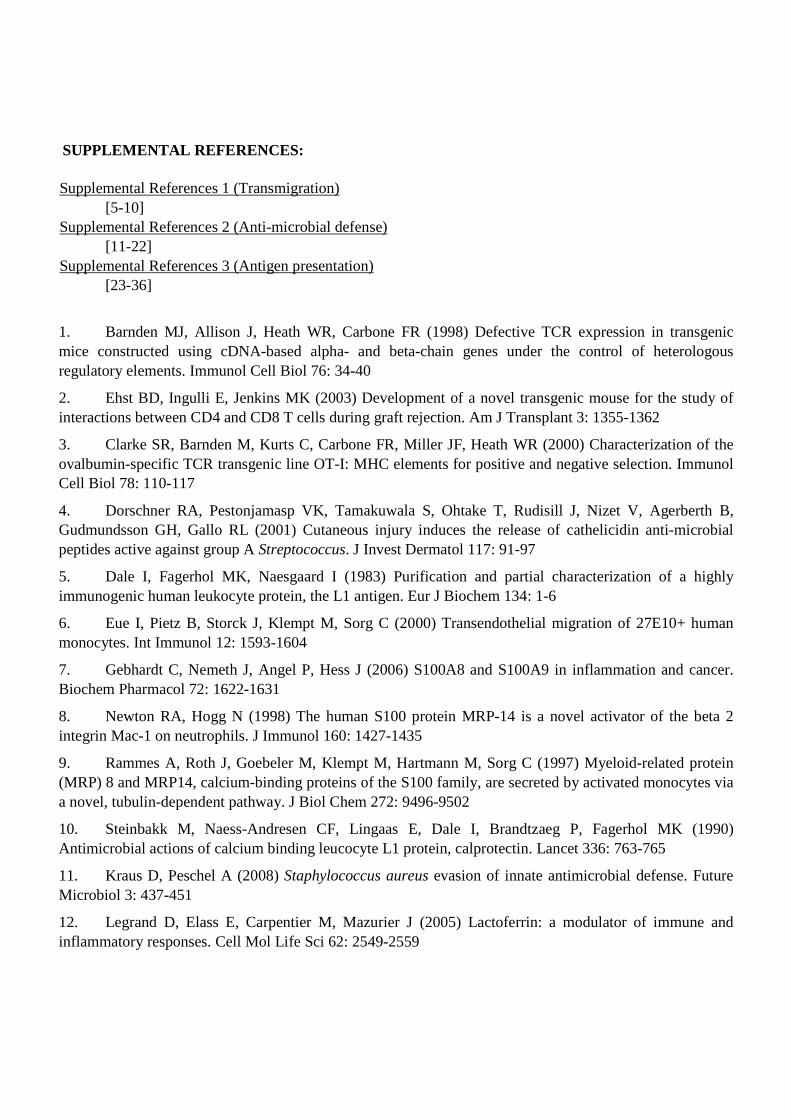
Supplemental Figure S3. Release of antimicrobial extracellular DNA-traps by PMA-treated splenic CD45+Col+ cells. CD45+Col+ cells co-incubated with PMA (25 nM/ml) for 45 min, are stained with H2A-H2B-DNA complex and anti-Collagen Type I antibodies, visualized in red (Alexa fluor 568). DNA traps are visualized in blue (Dapi), fibrocytes-like cells are visualized in green (GFP). Histone-DNA or Collagen Type I-DNA complexes are shown with arrows. Bar represents 20 µm.

Supplemental Figure S4. Splenic CD45P
+PColP
+P can act as antigen presenting cells. Splenic CD45P+PColP
+P
induced proliferation of adoptively transferred CFSE-OT-I/bm1 CD8P
+P T cells in Act-mOVA/bm1 mice.
Proliferation of CFSE-labeled T cells in the liver, spleen and peripheral lymph nodes (LN) was analyzed four days later by flow cytometry. Proliferation of CD8P
+P OT-I/bm1 cells was evaluated by flow cytometry
of CFSE dilution in activated CD44P
+P T cells. Data is shown as scatter blot analysis.
Supplemental Figure S5. Splenic CD45P
+PColP
+P cells co-express MHC II and mCRAMP. Purified from
spleens LPS-treated mice, CD45P
+PColP
+P cells are co-stained with anti-mCRAMP and anti-MHC II antibodies,
and Dapi to visualize nuclei. Co-localization of MHC II (shown in white) and mCRAMP (red) are detected in 43 ± 7% of cells. Bar represents 30 µm.

Supplementary Table 1. Expression of lineage specific markers by splenic fibrocytes. CHARACTERISTICS OF Fold qMΦ aMΦ Sp. F PRECURSOR CELLS CD34 ↑ 4 194 279 1111 CD90 (Thy-1) ↑ 21 384 80 8362 CD11b 6946 5568 3752 Gr-1 (Ly6-c) 808 3799 104007 MYELO-GRANULOCYTIC CELLS pre-myeloid GM-CSF2Rα 83405 62347 39336 GM-CSF2Rβ 31562 24544 4792 G-CSF3-R 1647 2079 1397 CD115 (M-CSFR) ND 5234 3012 Ly6G 103 195 152 S100A9 ↑ 1822 294 62 535679 S100A8 ↑ 176 200 495 35240 CD16 (FcgRIII) 45015 14243 5737 Myeloperoxidase (Mpo) ↑ 318 116 90 36910 CD11b ↑ 3.4 501 ND 7753 Lysozyme (Lyzs) 175542 114205 364293 Complement 3 1976 32305 30980
Complement factor properdin (Cfp)
70709 10799 12636
LPS binding protein (Lbp) 425 232 572 Treml4 ↑ 16 129 146 3497 S100A1α 4650 289507 589 S100A4 (FSP-1) 129914 23891 64321 CD33 734 769 283 Myd116 795 2376 2983 Myd88 7291 22298 7011 mature MΦ CD68 64924 41904 2958 CD14 11422 32145 7279 F4/80 41450 61230 8235 MHC II 500 8756 7752 CD163 801 58 623 CD300ε ↑ 3.2 97 444 1430 Scarb 1 2921 1290 2030 Msr 1 2781 9813 682 Msr 2 404 177 220
Spp1 secreted phosphoprotein
171301 121114 17606
PI3K 5 25339 14812 11639 TREM2 107077 69314 7364 IFN-γ ↑ 4 77 556 696 Lactotransferrin ↑ 195 195 71 36315 Haptoglobin ↑ 22 1596 1955 36502
MΦ expressed gene 1 (Mpeg1) 160405 142407 26035
Marco 5120 8952 2986 DENDRITIC CELLS CD80 150 598.3 215 CD83 6793 26213 6894 CD86 265 1427 410

CD32 (FcgRII) 15866.9 9882 8616.4 MHCII Q region (H2-Q8) 500 8756 7752 Histocompatibility 13 (H13) ↑ 5.5 1541 64 8477 Histocompatibility (H2-K1) 137851 ND 204021 CD11c 2147 3319 2410 CD11b 6946 5568 3752 CYTOTOXIC CELLS CD226 82 60 109 Granzyme A ↑ 15 81 60 559 Granzyme B ↑ 4 77 113 459 Cathepsin W ↑ 14 196 77 2823 Cathepsin G ↑ 79 158 84 12504 Perforin ↑ 2 80 61 446 Proteoglycan 2 (PRG2) ↑ 40 116 80 12168 MHC II 500 8756 7752
Killer cell lectin receptor Klra7
↑ 23 223 68 5250
Klra23 ↑ 17 130 61 2176 Klrd1 (CD94) ↑ 13 261 56 3330
Leukotreine B4 receptor 1 (Ltb4r1)
↑ 10 471 159 4460
NK cell group 7 sequence ↑ 16 123 68 1988 CD244 NK cell receptor 2B4 ↑ 2.7 650 290 1757 CD247 ↑ 6 136 83 841 CD56 (NCAM) ↑ 2.3 77 299 696 CD69 90 82.7 116 CD94 ↑ 1.2 105 ND 495 CD16 45015 14243 5737 CD44 8073 11522 4171 CD1d 585 1564 5018 Il-4 100 80 129 IL-12Rβ1 106 626 492 IL-18R1 ↑ 7.5 138 59 1040 IL18 678 6738 731 MYOFIBROBLASTS TGFβ induced 8255 13516 17603 TGF-β1 2711 2718 1020 TGFβ-RI 3700 2009 1178 TGF-βR II 11234 2159 5702 HGF 104 102 73 PDGFα 12098 2099 1074 PDGF assoc. protein (Pdap1) 8618 9967 10238 Smad3 237 156 797 Smad2 974 1459 572 Smad4 8955 4190 6030 Ltbp-2 95 1334 153 Ltbp-3 5678 3950 1016 Vimentin 94906 62098 30278 α-smooth muscle actin 159 2535 206 Collagen 7α1 ↑ 1.5 326 136 995 Collagen 11α2 ↑ 1.4 159 97 482 Collagen 14α1 84 164 154 Collagen 4α4 437 852 1264 Collagen1α1 ↑ 1.6 120 58 201 Cytoplasmic β-actin ↑ 3.7 1616 ND 6952
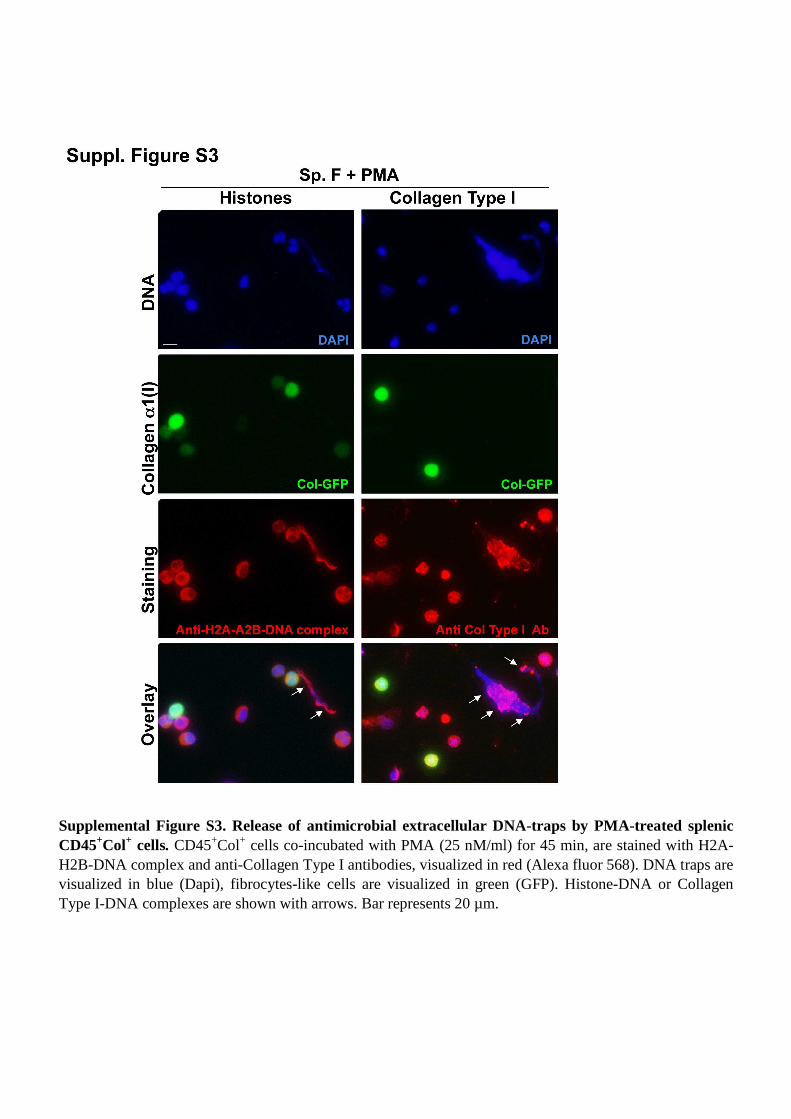
Tubulin β3 ↑ 2 565 ND 1636 Tubulin β5 23261 ND 32335 NEUTROPHILS Neutrophil elastase 2 (Ela2) ↑ 5.3 61 66 403 Ngp ↑ 90 94 82 8494 CD11a 316 8959 10559 CD16b 45015 14243 5737 CD24a 4103 1476 16251 CD32 15866 9882 8616 CD43 1502 550 17885 CD66 435 256 617 CD88 298 292 130 CD114 1647 2079 1397 CD116 83405 62347 39336 CD123 6110 5513 3277 CD128a 10633 3733 3510 CD147 1419 1631 896 CD156 262 128 153 CD170 169 ND 116 CD177 102 62 1044
Supplementary Table 1. Expression of lineage specific markers by splenic fibrocytes. Gene expression microarray of the whole mouse genome was performed to assess function of splenic fibrocytes. Fibrocyte gene expression was compared with expression profiles of quiescent and activated macrophages (qMΦ and aMΦ). The data is presented for five cell types and grouped according to expression of lineage specific genes, characteristic for 1) precursor cells, 2) myelo-monocytic cells, 3) dendritic cells, 4) cytotoxic cells; 5) myofibroblasts, 6) neutrophils. Genes with highest expression in splenic fibrocytes and their fold induction are indicated by pink field.
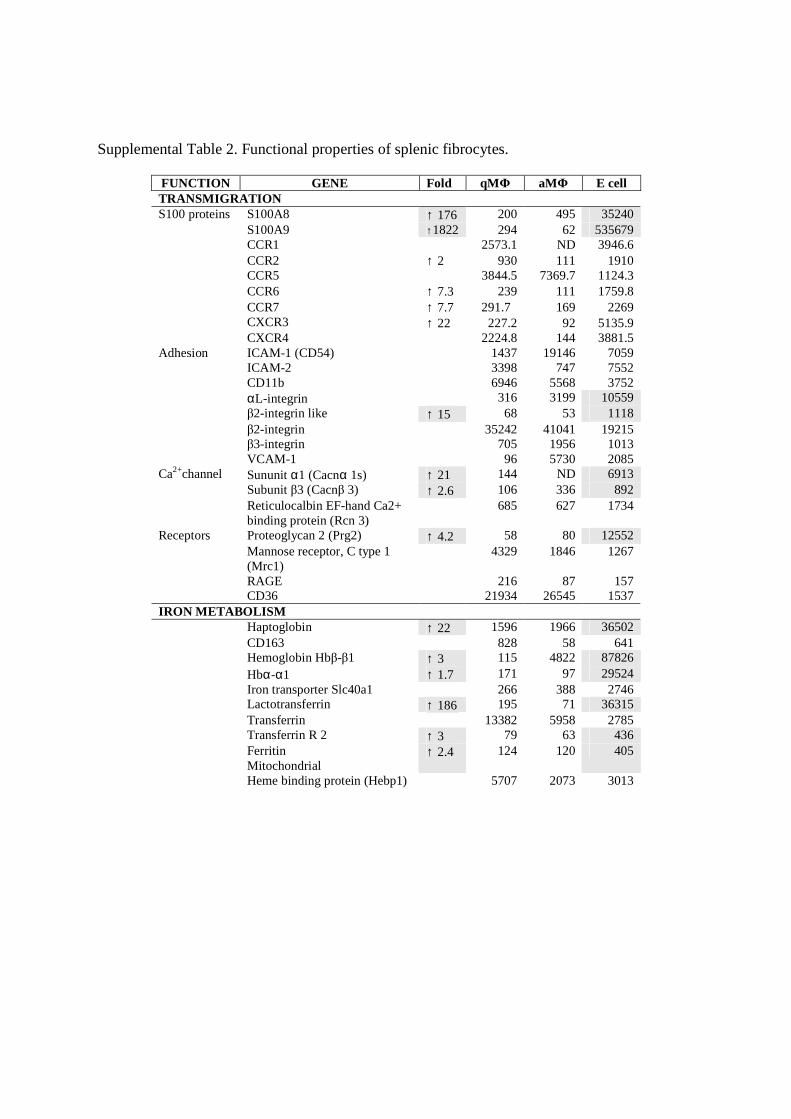
Supplemental Table 2. Functional properties of splenic fibrocytes.
FUNCTION GENE Fold qMΦ aMΦ E cell TRANSMIGRATION S100 proteins S100A8 ↑ 176 200 495 35240 S100A9 ↑1822 294 62 535679 CCR1 2573.1 ND 3946.6 CCR2 ↑ 2 930 111 1910 CCR5 3844.5 7369.7 1124.3 CCR6 ↑ 7.3 239 111 1759.8 CCR7 ↑ 7.7 291.7 169 2269 CXCR3 ↑ 22 227.2 92 5135.9 CXCR4 2224.8 144 3881.5 Adhesion ICAM-1 (CD54) 1437 19146 7059 ICAM-2 3398 747 7552 CD11b 6946 5568 3752 αL-integrin 316 3199 10559 β2-integrin like ↑ 15 68 53 1118 β2-integrin 35242 41041 19215 β3-integrin 705 1956 1013 VCAM-1 96 5730 2085 Ca2+channel Sununit α1 (Cacnα 1s) ↑ 21 144 ND 6913 Subunit β3 (Cacnβ 3) ↑ 2.6 106 336 892 Reticulocalbin EF-hand Ca2+
binding protein (Rcn 3) 685 627 1734
Receptors Proteoglycan 2 (Prg2) ↑ 4.2 58 80 12552 Mannose receptor, C type 1
(Mrc1) 4329 1846 1267
RAGE 216 87 157 CD36 21934 26545 1537 IRON METABOLISM Haptoglobin ↑ 22 1596 1966 36502 CD163 828 58 641 Hemoglobin Hbβ-β1 ↑ 3 115 4822 87826 Hbα-α1 ↑ 1.7 171 97 29524 Iron transporter Slc40a1 266 388 2746 Lactotransferrin ↑ 186 195 71 36315 Transferrin 13382 5958 2785 Transferrin R 2 ↑ 3 79 63 436 Ferritin
Mitochondrial ↑ 2.4 124 120 405
Heme binding protein (Hebp1) 5707 2073 3013
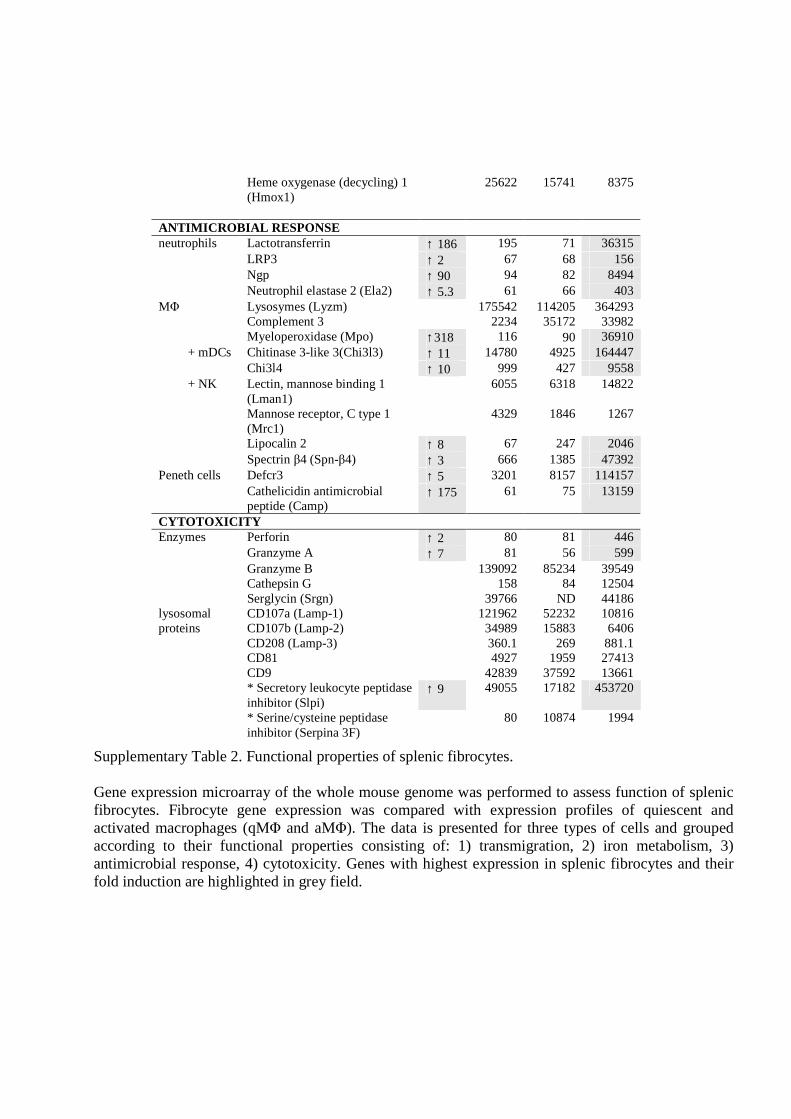
Supplementary Table 2. Functional properties of splenic fibrocytes. Gene expression microarray of the whole mouse genome was performed to assess function of splenic fibrocytes. Fibrocyte gene expression was compared with expression profiles of quiescent and activated macrophages (qMΦ and aMΦ). The data is presented for three types of cells and grouped according to their functional properties consisting of: 1) transmigration, 2) iron metabolism, 3) antimicrobial response, 4) cytotoxicity. Genes with highest expression in splenic fibrocytes and their fold induction are highlighted in grey field.
Heme oxygenase (decycling) 1 (Hmox1)
25622 15741 8375
ANTIMICROBIAL RESPONSE neutrophils Lactotransferrin ↑ 186 195 71 36315 LRP3 ↑ 2 67 68 156 Ngp ↑ 90 94 82 8494 Neutrophil elastase 2 (Ela2) ↑ 5.3 61 66 403 MΦ Lysosymes (Lyzm) 175542 114205 364293 Complement 3 2234 35172 33982 Myeloperoxidase (Mpo) ↑318 116 90 36910 + mDCs Chitinase 3-like 3(Chi3l3) ↑ 11 14780 4925 164447 Chi3l4 ↑ 10 999 427 9558 + NK Lectin, mannose binding 1
(Lman1) 6055 6318 14822
Mannose receptor, C type 1 (Mrc1)
4329 1846 1267
Lipocalin 2 ↑ 8 67 247 2046 Spectrin β4 (Spn-β4) ↑ 3 666 1385 47392 Peneth cells Defcr3 ↑ 5 3201 8157 114157 Cathelicidin antimicrobial
peptide (Camp) ↑ 175 61 75 13159
CYTOTOXICITY Enzymes Perforin ↑ 2 80 81 446 Granzyme A ↑ 7 81 56 599 Granzyme B 139092 85234 39549 Cathepsin G 158 84 12504 Serglycin (Srgn) 39766 ND 44186 lysosomal CD107a (Lamp-1) 121962 52232 10816 proteins CD107b (Lamp-2) 34989 15883 6406 CD208 (Lamp-3) 360.1 269 881.1 CD81 4927 1959 27413 CD9 42839 37592 13661 * Secretory leukocyte peptidase
inhibitor (Slpi) ↑ 9 49055 17182 453720
* Serine/cysteine peptidase inhibitor (Serpina 3F)
80 10874 1994