Embed Size (px)
Citation preview
SUPPLEMENTAL MATERIALS Association analyses identifies multiple new lung cancer susceptibility loci and their interactions with smoking in Chinese population
Jing Dong, Zhibin Hu, Chen Wu, Huan Guo, Baosen Zhou, Jiachun Lv, Daru Lu,
Kexin Chen, Yongyong Shi, Minjie Chu, Cheng Wang, Ruyang Zhang, Juncheng Dai,
Yue Jiang, Songyu Cao, Zhenzhen Qin, Dianke Yu, Hongxia Ma, Guangfu Jin,
Jianhang Gong, Chongqi Sun, Xueying Zhao, Zhihua Yin, Lei Yang, Zhiqiang Li,
Qifei Deng, Jiucun Wang, Wei Wu, Hong Zheng, Guoquan Zhou, Hongyan Chen,
Peng Guan, Zhihang Peng, Yijiang Chen, Yongqian Shu, Lin Xu, Xiangyang Liu, Li
Liu, Pin Xu, Baohui Han, Chunxue Bai, Yuxia Zhao, Haibo Zhang, Ying Yan,
Christopher I. Amos, Feng Chen, Wen Tan, Li Jin, Tangchun Wu, Dongxin Lin &
Hongbing Shen
Nature Genetics: doi:10.1038/ng.2351

Figure Legend Supplementary Figure 1: Summary of the study design. The contents in dotted lines are those reported in Hu et al. 1 The contents in full line are for the current study.
Nature Genetics: doi:10.1038/ng.2351

Supplementary Figure 2: Stratification analyses of the associations between lung cancer risk and the five SNPs by study center. Each box and horizontal line represents the OR and 95% CI derived from the additive model. P values are from heterogeneity tests based on chi-squared based Q test.
Nature Genetics: doi:10.1038/ng.2351

Supplementary Table 1. Summary description of the samples used in this study
Variables
GWAS scan Replication I The Nanjing Study The Beijing Study Nanjing Beijing Case Control Case Control Case Control Case Control
(n=1473) (n=1962) (n=858) (n=1115) (n=749) (n=754) (n=1534) (n=1489) Age (Mean ± S.D.) 60.08±10.30 59.35±9.74 60.00±10.23 62.45±9.18 61.11±10.22 61.55±9.81 58.14±9.71 53.95±13.09 Gender
Male 1057 1214 654 872 540 533 1029 992 Female 416 748 204 243 209 221 505 497
Smoking Status Current Smokers 741 636 511 447 393 247 726 553 Former smokers 168 83 86 143 80 15 186 19 Never smokers 564 1243 261 525 276 492 622 917
Smoking Levels (Mean ± S.D.) 41.43±26.86 30.96±20.28 44.81±29.64 32.35±19.88 41.5±25.98 26.90±19.28 39.60±25.26 25.88±18.44 ≤ 24(Pack-years) 225 308 151 224 400 626 892 1220 > 24(Pack-years) 684 411 446 366 349 128 642 269
Histology Squamous cell carcinoma 421 401 235 587
Adenocarcinoma 896 408 373 780 Small cell carcinoma 129 49 45 100
Other a 27 0 96 67 a Other includes large cell lung cancer and mixed cell carcinoma.
Nature Genetics: doi:10.1038/ng.2351
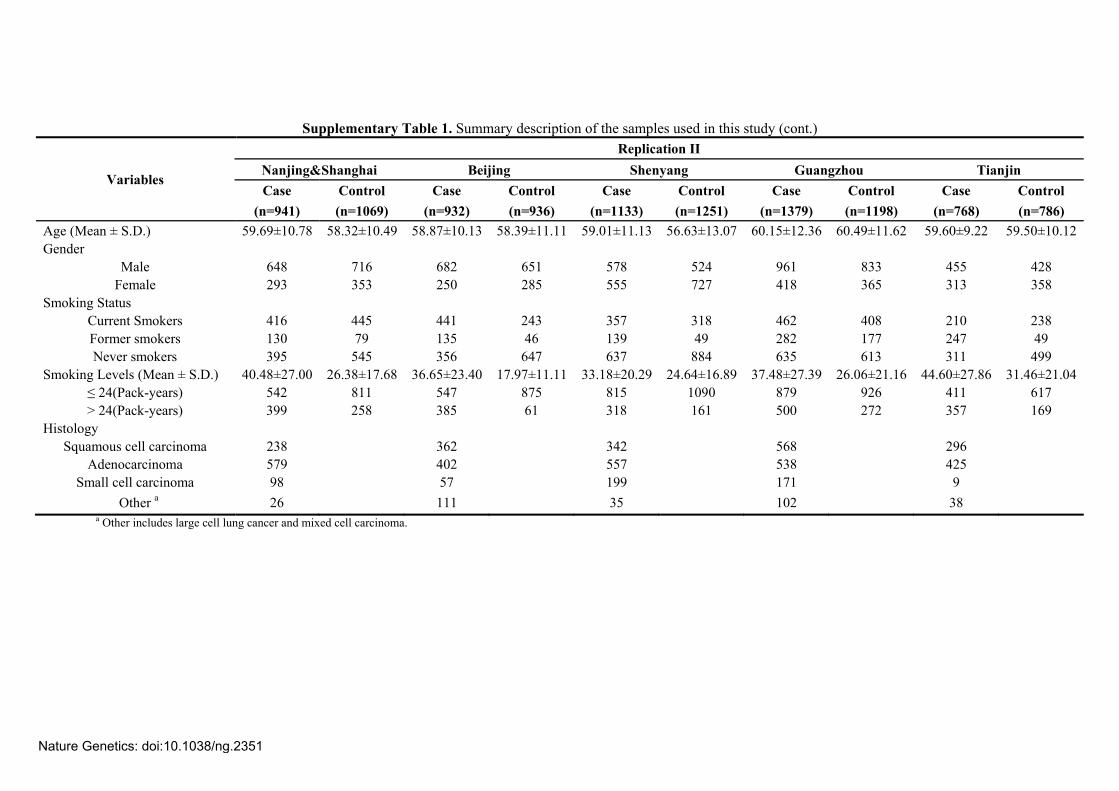
Supplementary Table 1. Summary description of the samples used in this study (cont.)
Variables
Replication II Nanjing&Shanghai Beijing Shenyang Guangzhou Tianjin Case Control Case Control Case Control Case Control Case Control
(n=941) (n=1069) (n=932) (n=936) (n=1133) (n=1251) (n=1379) (n=1198) (n=768) (n=786) Age (Mean ± S.D.) 59.69±10.78 58.32±10.49 58.87±10.13 58.39±11.11 59.01±11.13 56.63±13.07 60.15±12.36 60.49±11.62 59.60±9.22 59.50±10.12 Gender
Male 648 716 682 651 578 524 961 833 455 428 Female 293 353 250 285 555 727 418 365 313 358
Smoking Status Current Smokers 416 445 441 243 357 318 462 408 210 238 Former smokers 130 79 135 46 139 49 282 177 247 49 Never smokers 395 545 356 647 637 884 635 613 311 499
Smoking Levels (Mean ± S.D.) 40.48±27.00 26.38±17.68 36.65±23.40 17.97±11.11 33.18±20.29 24.64±16.89 37.48±27.39 26.06±21.16 44.60±27.86 31.46±21.04 ≤ 24(Pack-years) 542 811 547 875 815 1090 879 926 411 617 > 24(Pack-years) 399 258 385 61 318 161 500 272 357 169
Histology Squamous cell carcinoma 238 362 342 568 296
Adenocarcinoma 579 402 557 538 425 Small cell carcinoma 98 57 199 171 9
Other a 26 111 35 102 38 a Other includes large cell lung cancer and mixed cell carcinoma.
Nature Genetics: doi:10.1038/ng.2351
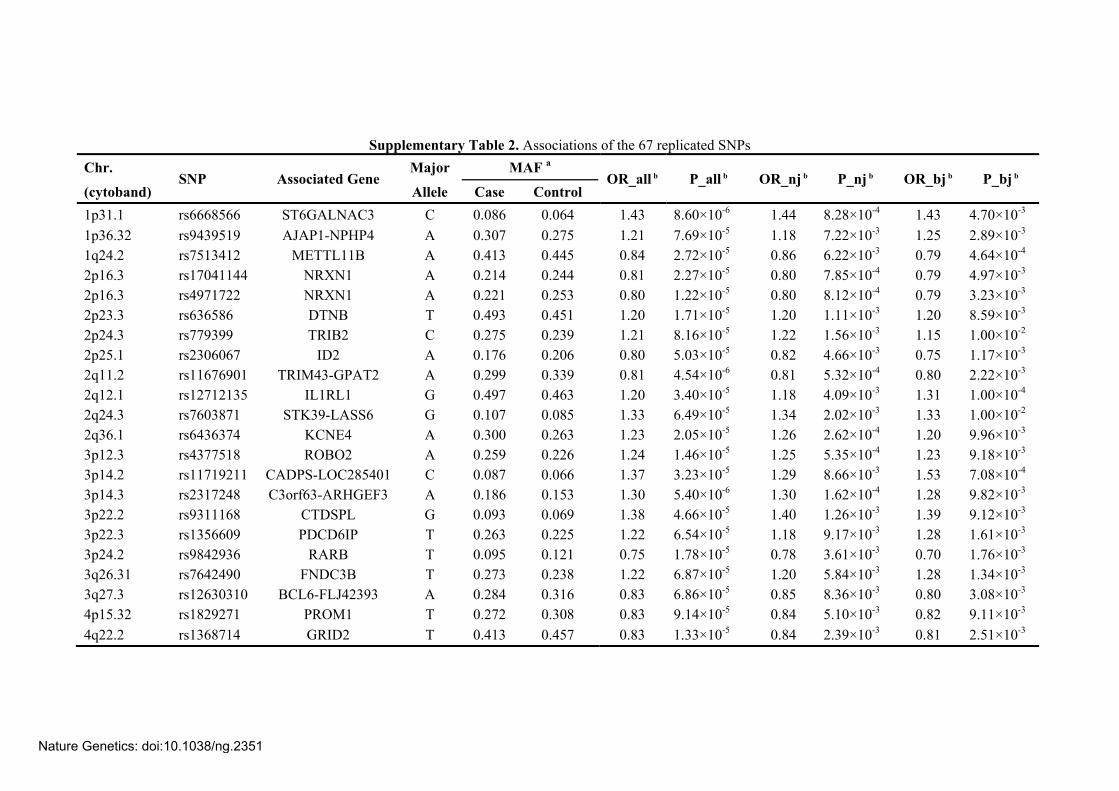
Supplementary Table 2. Associations of the 67 replicated SNPs
Chr. SNP Associated Gene
Major MAF a OR_all b P_all b OR_nj b P_nj b OR_bj b P_bj b
(cytoband) Allele Case Control 1p31.1 rs6668566 ST6GALNAC3 C 0.086 0.064 1.43 8.60×10⁻⁶ 1.44 8.28×10⁻⁴ 1.43 4.70×10⁻³ 1p36.32 rs9439519 AJAP1-NPHP4 A 0.307 0.275 1.21 7.69×10⁻⁵ 1.18 7.22×10⁻³ 1.25 2.89×10⁻³ 1q24.2 rs7513412 METTL11B A 0.413 0.445 0.84 2.72×10⁻⁵ 0.86 6.22×10⁻³ 0.79 4.64×10⁻⁴ 2p16.3 rs17041144 NRXN1 A 0.214 0.244 0.81 2.27×10⁻⁵ 0.80 7.85×10⁻⁴ 0.79 4.97×10⁻³ 2p16.3 rs4971722 NRXN1 A 0.221 0.253 0.80 1.22×10⁻⁵ 0.80 8.12×10⁻⁴ 0.79 3.23×10⁻³ 2p23.3 rs636586 DTNB T 0.493 0.451 1.20 1.71×10⁻⁵ 1.20 1.11×10⁻³ 1.20 8.59×10⁻³ 2p24.3 rs779399 TRIB2 C 0.275 0.239 1.21 8.16×10⁻⁵ 1.22 1.56×10⁻³ 1.15 1.00×10⁻² 2p25.1 rs2306067 ID2 A 0.176 0.206 0.80 5.03×10⁻⁵ 0.82 4.66×10⁻³ 0.75 1.17×10⁻³ 2q11.2 rs11676901 TRIM43-GPAT2 A 0.299 0.339 0.81 4.54×10⁻⁶ 0.81 5.32×10⁻⁴ 0.80 2.22×10⁻³ 2q12.1 rs12712135 IL1RL1 G 0.497 0.463 1.20 3.40×10⁻⁵ 1.18 4.09×10⁻³ 1.31 1.00×10⁻⁴ 2q24.3 rs7603871 STK39-LASS6 G 0.107 0.085 1.33 6.49×10⁻⁵ 1.34 2.02×10⁻³ 1.33 1.00×10⁻² 2q36.1 rs6436374 KCNE4 A 0.300 0.263 1.23 2.05×10⁻⁵ 1.26 2.62×10⁻⁴ 1.20 9.96×10⁻³ 3p12.3 rs4377518 ROBO2 A 0.259 0.226 1.24 1.46×10⁻⁵ 1.25 5.35×10⁻⁴ 1.23 9.18×10⁻³ 3p14.2 rs11719211 CADPS-LOC285401 C 0.087 0.066 1.37 3.23×10⁻⁵ 1.29 8.66×10⁻³ 1.53 7.08×10⁻⁴ 3p14.3 rs2317248 C3orf63-ARHGEF3 A 0.186 0.153 1.30 5.40×10⁻⁶ 1.30 1.62×10⁻⁴ 1.28 9.82×10⁻³ 3p22.2 rs9311168 CTDSPL G 0.093 0.069 1.38 4.66×10⁻⁵ 1.40 1.26×10⁻³ 1.39 9.12×10⁻³ 3p22.3 rs1356609 PDCD6IP T 0.263 0.225 1.22 6.54×10⁻⁵ 1.18 9.17×10⁻³ 1.28 1.61×10⁻³ 3p24.2 rs9842936 RARB T 0.095 0.121 0.75 1.78×10⁻⁵ 0.78 3.61×10⁻³ 0.70 1.76×10⁻³ 3q26.31 rs7642490 FNDC3B T 0.273 0.238 1.22 6.87×10⁻⁵ 1.20 5.84×10⁻³ 1.28 1.34×10⁻³ 3q27.3 rs12630310 BCL6-FLJ42393 A 0.284 0.316 0.83 6.86×10⁻⁵ 0.85 8.36×10⁻³ 0.80 3.08×10⁻³ 4p15.32 rs1829271 PROM1 T 0.272 0.308 0.83 9.14×10⁻⁵ 0.84 5.10×10⁻³ 0.82 9.11×10⁻³ 4q22.2 rs1368714 GRID2 T 0.413 0.457 0.83 1.33×10⁻⁵ 0.84 2.39×10⁻³ 0.81 2.51×10⁻³
Nature Genetics: doi:10.1038/ng.2351

Supplementary Table 2. Associations of the 67 replicated SNPs (cont.) Chr. SNP Associated Gene Major MAF a
OR_all b P_all b OR_nj b P_nj b OR_bj b P_bj b (cytoband) Allele Case Control 4q31.3 rs11945847 LRBA A 0.138 0.111 1.34 6.52×10⁻⁶ 1.35 4.30×10⁻⁴ 1.33 6.48×10⁻³ 4q35.1 rs1458898 MGC45800 C 0.151 0.127 1.31 1.31×10⁻⁵ 1.30 1.77×10⁻³ 1.34 2.04×10⁻³ 5p13.1 rs325879 HEATR7B2-C6 T 0.461 0.424 1.20 1.92×10⁻⁵ 1.17 5.90×10⁻³ 1.27 6.33×10⁻⁴ 5q13.3 rs10515209 C5orf37-SV2C C 0.089 0.066 1.39 3.94×10⁻⁵ 1.38 1.80×10⁻³ 1.42 7.28×10⁻³ 5q13.3 rs16872674 POLK-C5orf37 C 0.105 0.083 1.32 5.21×10⁻⁵ 1.33 1.11×10⁻³ 1.33 1.00×10⁻² 5q22.3 rs1350105 CCDC112-FEM1C A 0.059 0.077 0.72 9.87×10⁻⁵ 0.75 9.22×10⁻³ 0.67 2.84×10⁻³ 5q23.2 rs10069190 ZNF608 C 0.253 0.289 0.82 3.68×10⁻⁵ 0.84 5.65×10⁻³ 0.80 3.03×10⁻³ 5q31.1 rs247008 IL3-CSF2-P4HA2 G 0.430 0.475 0.83 1.14×10⁻⁵ 0.85 1.29×10⁻³ 0.81 2.09×10⁻³ 5q31.1 rs2526303 LYRM7 A 0.486 0.470 1.20 2.59×10⁻⁵ 1.20 1.07×10⁻³ 1.22 4.53×10⁻³ 5q31.1 rs2551038 HINT1 C 0.147 0.179 0.78 2.22×10⁻⁵ 0.78 7.94×10⁻⁴ 0.77 5.43×10⁻³ 5q31.1 rs27437 IL3-CSF2-P4HA2 A 0.332 0.295 1.20 2.64×10⁻⁵ 1.17 9.63×10⁻³ 1.22 5.79×10⁻³ 5q32 rs2895680 PPP2R2B-STK32A-DPYSL3 T 0.322 0.281 1.23 4.92×10⁻⁶ 1.23 4.16×10⁻⁴ 1.22 8.49×10⁻³ 6q25.1 rs17087042 ZC3H12D C 0.266 0.303 0.83 8.64×10⁻⁵ 0.85 7.28×10⁻³ 0.79 2.04×10⁻³ 7p21.1 rs1178120 HDAC9 C 0.211 0.248 0.82 5.92×10⁻⁵ 0.80 8.13×10⁻⁴ 0.82 9.53×10⁻³ 7q21.11 rs6975360 PCLO T 0.077 0.054 1.39 7.33×10⁻⁵ 1.35 3.75×10⁻³ 1.46 8.30×10⁻³ 7q21.11 rs7794837 GRM3 A 0.460 0.418 1.19 4.37×10⁻⁵ 1.20 1.01×10⁻³ 1.19 9.25×10⁻³ 8p11.21 rs4576415 ZMAT4 A 0.199 0.166 1.23 9.45×10⁻⁵ 1.20 7.70×10⁻³ 1.29 4.54×10⁻³ 8q13.3 rs1905041 MSC A 0.071 0.052 1.43 4.98×10⁻⁵ 1.40 3.87×10⁻³ 1.46 5.11×10⁻³ 8q22.3 rs7831907 SNX31-PABPC1 G 0.075 0.098 0.72 2.31×10⁻⁵ 0.74 2.09×10⁻³ 0.70 3.69×10⁻³ 9p13.1 rs10974033 C9orf122-CNTNAP3 T 0.219 0.184 1.21 9.67×10⁻⁵ 1.22 3.16×10⁻³ 1.25 9.35×10⁻³ 9p23 rs1339274 TYRP1 G 0.114 0.089 1.37 9.85×10⁻⁶ 1.38 3.10×10⁻⁴ 1.28 9.69×10⁻³ 9q31.3 rs2146079 DNAJC25 C 0.411 0.451 0.83 9.78×10⁻⁶ 0.83 9.01×10⁻⁴ 0.82 3.11×10⁻³ 10p14 rs1663689 GATA3 A 0.382 0.421 0.84 3.03×10⁻⁵ 0.87 7.28×10⁻³ 0.78 6.93×10⁻⁴
Nature Genetics: doi:10.1038/ng.2351

Supplementary Table 2. Associations of the 67 replicated SNPs (cont.) Chr. SNP Associated Gene Major MAF a
OR_all b P_all b OR_nj b P_nj b OR_bj b P_bj b (cytoband) Allele Case Control 10p14 rs4749765 KRT8 T 0.431 0.396 1.20 2.29×10⁻⁵ 1.17 6.04×10⁻³ 1.23 3.10×10⁻³ 11q13.4 rs588097 UCP2 C 0.488 0.451 1.20 2.99×10⁻⁵ 1.19 2.11×10⁻³ 1.24 2.16×10⁻³ 11q13.4 rs940828 PLEKHB1 A 0.292 0.255 1.24 1.26×10⁻⁵ 1.21 3.23×10⁻³ 1.27 2.01×10⁻³ 12p13.32 rs10492061 KCNA6-KCNA1 C 0.320 0.291 1.20 7.47×10⁻⁵ 1.22 8.25×10⁻⁴ 1.22 8.32×10⁻³ 12q24.12 rs4767944 ALDH2 T 0.386 0.346 1.21 1.44×10⁻⁵ 1.23 2.89×10⁻⁴ 1.24 2.22×10⁻³ 12q24.13 rs1419616 PTPN11-RPH3A T 0.367 0.323 1.20 4.20×10⁻⁵ 1.21 1.16×10⁻³ 1.23 3.25×10⁻³ 13q12.11 rs7989659 FTHL3P C 0.191 0.158 1.24 4.52×10⁻⁵ 1.25 9.66×10⁻⁴ 1.24 1.00×10⁻² 13q12.2 rs12583724 GTF3A G 0.093 0.071 1.40 1.97×10⁻⁵ 1.36 2.50×10⁻³ 1.42 5.99×10⁻³ 13q12.3 rs9315112 HSPH1 G 0.135 0.111 1.34 6.34×10⁻⁶ 1.29 3.03×10⁻³ 1.41 9.66×10⁻⁴ 13q21.33 rs9564643 KLHL1 A 0.323 0.289 1.21 3.50×10⁻⁵ 1.18 5.94×10⁻³ 1.26 1.89×10⁻³ 13q31.3 rs9523844 GPC5-GPC6 T 0.483 0.471 1.20 9.08×10⁻⁶ 1.18 3.60×10⁻³ 1.23 2.49×10⁻³ 14q31.3 rs1483067 FLRT2 G 0.083 0.059 1.35 5.60×10⁻⁵ 1.29 3.59×10⁻³ 1.58 2.66×10⁻³ 14q32.2 rs10151617 C14orf177 T 0.239 0.213 1.23 6.71×10⁻⁵ 1.16 9.81×10⁻³ 1.29 1.58×10⁻³ 15q21.1 rs12438247 SEMA6D A 0.483 0.481 1.18 8.45×10⁻⁵ 1.16 6.26×10⁻³ 1.21 8.04×10⁻³ 16p13.2 rs12445627 A2BP1 T 0.228 0.195 1.24 4.94×10⁻⁵ 1.24 2.10×10⁻³ 1.26 6.09×10⁻³ 16q12.2 rs9921518 IRX3 G 0.074 0.050 1.40 4.15×10⁻⁵ 1.34 2.60×10⁻³ 1.58 1.55×10⁻³ 17p13.1 rs3967769 GAS7 T 0.375 0.337 1.20 6.55×10⁻⁵ 1.24 2.21×10⁻⁴ 1.16 9.05×10⁻³ 18p11.21 rs12458580 C18orf1 C 0.286 0.252 1.24 1.18×10⁻⁵ 1.27 1.77×10⁻⁴ 1.25 3.86×10⁻³ 19p13.2 rs17001493 ZNF833 G 0.083 0.109 0.73 2.27×10⁻⁵ 0.73 4.97×10⁻⁴ 0.71 6.52×10⁻³ 19p13.2 rs3745662 ZNF833-ZNF823 A 0.092 0.116 0.75 3.93×10⁻⁵ 0.75 2.03×10⁻³ 0.72 5.03×10⁻³ 20q13.2 rs4809957 CYP24A1 C 0.387 0.347 1.19 7.62×10⁻⁵ 1.17 6.25×10⁻³ 1.24 2.75×10⁻³ 21q21.3 rs468476 APP-CYYR1 G 0.312 0.350 0.84 8.72×10⁻⁵ 0.85 5.25×10⁻³ 0.79 1.28×10⁻³ a MAF, Minor allele-frequency. b OR_all: OR for the all samples in GWAS scan; OR_nj, P_nj : OR and P values for the Nanjing study samples in GWAS scan; OR_bj, P_bj : OR and P values for the Beijing study samples in GWAS scan. Adjusted by age, gender, pack-year of smoking and PCs adjustment.
Nature Genetics: doi:10.1038/ng.2351

Supplementary Table 3. SNPs that reached the validation criteria but were in strong linkage disequilibrium (r2 > 0.8) with selected replication SNPs
Chr. SNP OR P value Replicated SNPs r2 1q24.2 rs12122745 0.83 2.73×10⁻⁵ rs7513412 0.99 2q11.2 rs11164049 0.83 7.68×10⁻⁵ rs11676901 0.91 2p16.3 rs17041217 0.81 1.76×10⁻⁵ rs4971722 0.95 2 p23 rs936012 1.19 2.48×10⁻⁵ rs636586 1.00 4q22.2 rs1347249 0.84 3.49×10⁻⁵ rs1368714 0.99 4q22.2 rs1836114 0.84 3.39×10⁻⁵ rs1368714 1.00 4q22.2 rs2217717 0.84 3.86×10⁻⁵ rs1368714 0.99 4q22.2 rs6852170 0.84 5.22×10⁻⁵ rs1368714 0.98 4q22.2 rs7691723 0.84 2.41×10⁻⁵ rs1368714 0.98 4q22.2 rs976841 0.84 2.70×10⁻⁵ rs1368714 0.99 4q35.1 rs2609551 1.27 9.30×10⁻⁵ rs1458898 0.98 5q23.2 rs10062543 0.83 7.39×10⁻⁵ rs10069190 0.98 5q23.2 rs10066153 0.83 5.33×10⁻⁵ rs10069190 0.97 5q23.2 rs10077548 0.82 4.67×10⁻⁵ rs10069190 0.99 5q23.2 rs4283782 0.83 8.77×10⁻⁵ rs10069190 0.97 5q23.2 rs6891783 0.83 8.14×10⁻⁵ rs10069190 0.92 5q23.2 rs949973 0.82 4.75×10⁻⁵ rs10069190 0.99 5q23.2 rs949974 0.83 4.81×10⁻⁵ rs10069190 0.90 9q31.3 rs1547089 0.85 9.87×10⁻⁵ rs2146079 0.99 10p14 rs10905386 1.20 3.22×10⁻⁵ rs4749765 1.00 11q13.4 rs1726745 1.19 3.01×10⁻⁵ rs588097 0.98 12q24.12 rs11066019 1.19 3.03×10⁻⁵ rs4767944 0.99 13q31.3 rs1414134 1.18 3.70×10⁻⁵ rs9523844 0.90 13q31.3 rs1414135 1.18 5.24×10⁻⁵ rs9523844 0.89 13q31.3 rs7982281 1.18 3.76×10⁻⁵ rs9523844 0.89 13q31.3 rs9523845 1.18 8.27×10⁻⁵ rs9523844 1.00 13q31.3 rs9561205 1.18 3.80×10⁻⁵ rs9523844 0.89 20q13.2 rs1570669 1.19 8.03×10⁻⁵ rs4809957 0.99
Nature Genetics: doi:10.1038/ng.2351

Supplementary Table 4. Associations of 67 SNPs in GWAS scan and validations SNPs Chr. Study Cases b Controls b MAF c OR
P d (Major/minor) a (cytoband) Cases Controls (95% CI) d
rs6668566 1p31.1 GWAS 31/333/1921 17/347/2631 0.086 0.064 1.43(1.22-1.68) 8.60×10⁻⁶ C/G Replication I 20/361/1891 15/323/1895 0.088 0.079 1.11(0.95-1.30) 1.91×10⁻¹ rs9439519 1p36.32 GWAS 204/1018/1104 231/1229/1615 0.307 0.275 1.21(1.10-1.32) 7.69×10⁻⁵ A/G Replication I 204/966/1113 145/921/1177 0.301 0.270 1.13(1.03-1.25) 1.38×10⁻²
Replication II 412/2117/2513 401/2048/2715 0.292 0.276 1.08(1.01-1.15) 1.95×10⁻² Combined All 820/4101/4730 777/4198/5507 0.297 0.274 1.11(1.06-1.16) 3.65×10⁻⁶
rs7513412 1q24.2 GWAS 392/1142/796 626/1478/962 0.413 0.445 0.84(0.77-0.91) 2.72×10⁻⁵ A/G Replication I 389/1111/757 413/1074/744 0.419 0.426 1.00(0.91-1.09) 9.67×10⁻¹ rs17041144 2p16.3 GWAS 108/781/1440 183/1135/1757 0.214 0.244 0.81(0.73-0.89) 2.27×10⁻⁵ A/G Replication I 115/785/1332 122/820/1269 0.227 0.241 0.96(0.86-1.06) 3.92×10⁻¹ rs4971722 2p16.3 GWAS 122/739/1365 201/1092/1657 0.221 0.253 0.80(0.73-0.89) 1.22×10⁻⁵ A/C Replication I 131/798/1311 133/832/1212 0.237 0.252 0.95(0.86-1.05) 3.22×10⁻¹ rs636586 2p23.3 GWAS 562/1168/597 635/1500/938 0.493 0.451 1.20(1.11-1.31) 1.71×10⁻⁵ T/G Replication I 472/1272/539 452/1045/743 0.485 0.435 1.14(1.04-1.25) 6.35×10⁻³
Replication II 1207/2458/1405 1207/2564/1464 0.481 0.476 1.03(0.97-1.09) 3.48×10⁻¹ Combined All 2241/4898/2541 2294/5109/3145 0.485 0.460 1.10(1.06-1.15) 3.10×10⁻⁶
rs779399 2p24.3 GWAS 179/918/1223 177/1113/1780 0.275 0.239 1.21(1.10-1.33) 8.16×10⁻⁵ C/A Replication I 173/911/1176 168/847/1212 0.278 0.266 1.06(0.97-1.17) 1.86×10⁻¹ rs2306067 2p25.1 GWAS 78/662/1588 142/985/1950 0.176 0.206 0.80(0.72-0.89) 5.03×10⁻⁵ A/G Replication I 82/688/1494 88/681/1466 0.188 0.192 0.97(0.87-1.09) 6.43×10⁻¹ rs11676901 2q11.2 GWAS 213/966/1149 345/1395/1332 0.299 0.339 0.81(0.74-0.89) 4.54×10⁻⁶ A/C Replication I 219/924/1129 191/974/1077 0.300 0.302 0.99(0.90-1.09) 7.66×10⁻¹ rs12712135 2q12.1 GWAS 575/1147/563 646/1516/868 0.497 0.463 1.20(1.10-1.30) 3.40×10⁻⁵ G/A Replication I 535/1180/546 534/1131/563 0.498 0.494 1.04(0.95-1.13) 4.27×10⁻¹
Nature Genetics: doi:10.1038/ng.2351
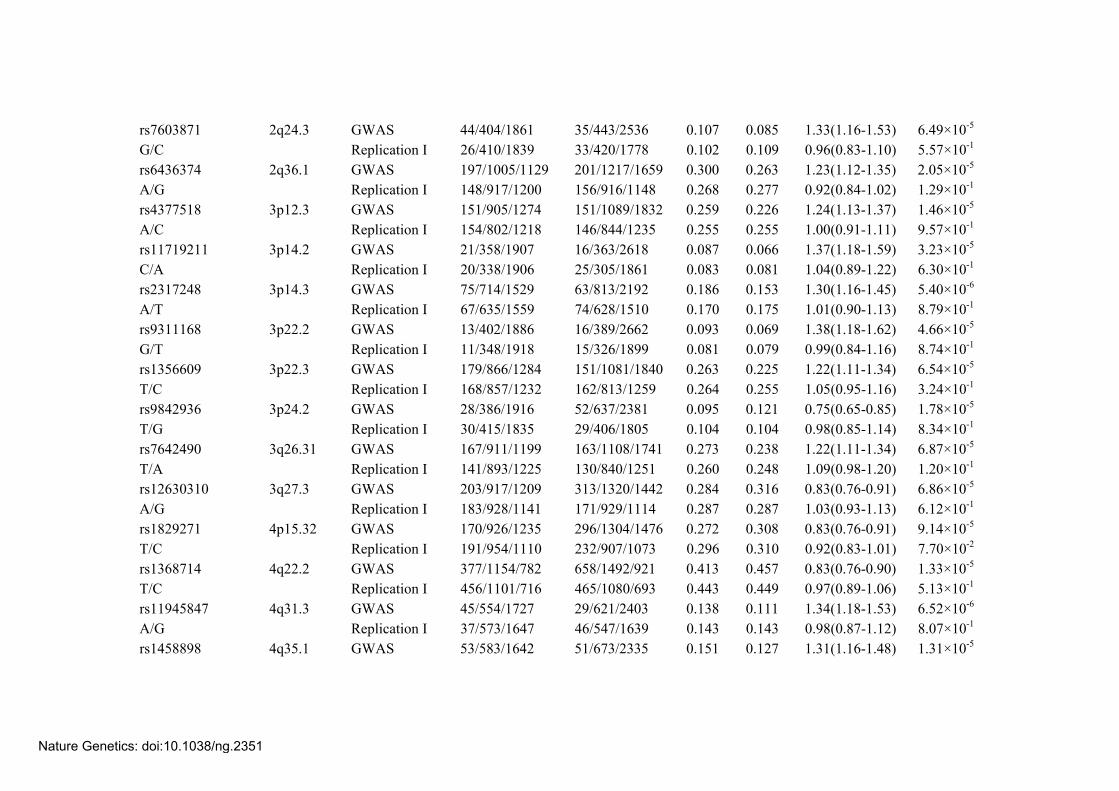
rs7603871 2q24.3 GWAS 44/404/1861 35/443/2536 0.107 0.085 1.33(1.16-1.53) 6.49×10⁻⁵ G/C Replication I 26/410/1839 33/420/1778 0.102 0.109 0.96(0.83-1.10) 5.57×10⁻¹ rs6436374 2q36.1 GWAS 197/1005/1129 201/1217/1659 0.300 0.263 1.23(1.12-1.35) 2.05×10⁻⁵ A/G Replication I 148/917/1200 156/916/1148 0.268 0.277 0.92(0.84-1.02) 1.29×10⁻¹ rs4377518 3p12.3 GWAS 151/905/1274 151/1089/1832 0.259 0.226 1.24(1.13-1.37) 1.46×10⁻⁵ A/C Replication I 154/802/1218 146/844/1235 0.255 0.255 1.00(0.91-1.11) 9.57×10⁻¹ rs11719211 3p14.2 GWAS 21/358/1907 16/363/2618 0.087 0.066 1.37(1.18-1.59) 3.23×10⁻⁵ C/A Replication I 20/338/1906 25/305/1861 0.083 0.081 1.04(0.89-1.22) 6.30×10⁻¹ rs2317248 3p14.3 GWAS 75/714/1529 63/813/2192 0.186 0.153 1.30(1.16-1.45) 5.40×10⁻⁶ A/T Replication I 67/635/1559 74/628/1510 0.170 0.175 1.01(0.90-1.13) 8.79×10⁻¹ rs9311168 3p22.2 GWAS 13/402/1886 16/389/2662 0.093 0.069 1.38(1.18-1.62) 4.66×10⁻⁵ G/T Replication I 11/348/1918 15/326/1899 0.081 0.079 0.99(0.84-1.16) 8.74×10⁻¹ rs1356609 3p22.3 GWAS 179/866/1284 151/1081/1840 0.263 0.225 1.22(1.11-1.34) 6.54×10⁻⁵ T/C Replication I 168/857/1232 162/813/1259 0.264 0.255 1.05(0.95-1.16) 3.24×10⁻¹ rs9842936 3p24.2 GWAS 28/386/1916 52/637/2381 0.095 0.121 0.75(0.65-0.85) 1.78×10⁻⁵ T/G Replication I 30/415/1835 29/406/1805 0.104 0.104 0.98(0.85-1.14) 8.34×10⁻¹ rs7642490 3q26.31 GWAS 167/911/1199 163/1108/1741 0.273 0.238 1.22(1.11-1.34) 6.87×10⁻⁵ T/A Replication I 141/893/1225 130/840/1251 0.260 0.248 1.09(0.98-1.20) 1.20×10⁻¹ rs12630310 3q27.3 GWAS 203/917/1209 313/1320/1442 0.284 0.316 0.83(0.76-0.91) 6.86×10⁻⁵ A/G Replication I 183/928/1141 171/929/1114 0.287 0.287 1.03(0.93-1.13) 6.12×10⁻¹ rs1829271 4p15.32 GWAS 170/926/1235 296/1304/1476 0.272 0.308 0.83(0.76-0.91) 9.14×10⁻⁵ T/C Replication I 191/954/1110 232/907/1073 0.296 0.310 0.92(0.83-1.01) 7.70×10⁻² rs1368714 4q22.2 GWAS 377/1154/782 658/1492/921 0.413 0.457 0.83(0.76-0.90) 1.33×10⁻⁵ T/C Replication I 456/1101/716 465/1080/693 0.443 0.449 0.97(0.89-1.06) 5.13×10⁻¹ rs11945847 4q31.3 GWAS 45/554/1727 29/621/2403 0.138 0.111 1.34(1.18-1.53) 6.52×10⁻⁶ A/G Replication I 37/573/1647 46/547/1639 0.143 0.143 0.98(0.87-1.12) 8.07×10⁻¹ rs1458898 4q35.1 GWAS 53/583/1642 51/673/2335 0.151 0.127 1.31(1.16-1.48) 1.31×10⁻⁵
Nature Genetics: doi:10.1038/ng.2351

C/T Replication I 49/475/1705 37/555/1602 0.129 0.143 0.89(0.78-1.01) 7.53×10⁻² rs325879 5p13.1 GWAS 482/1138/661 523/1532/984 0.461 0.424 1.20(1.11-1.31) 1.92×10⁻⁵ T/A Replication I 420/1127/704 440/1079/693 0.437 0.443 0.99(0.91-1.08) 8.25×10⁻¹ rs10515209 5q13.3 GWAS 24/369/1938 7/394/2676 0.089 0.066 1.39(1.19-1.62) 3.94×10⁻⁵ C/G Replication I 11/344/1922 10/333/1895 0.080 0.079 1.05(0.90-1.24) 5.27×10⁻¹ rs16872674 5q13.3 GWAS 28/434/1869 16/478/2583 0.105 0.083 1.32(1.16-1.52) 5.21×10⁻⁵ C/T Replication I 17/392/1871 17/397/1828 0.093 0.096 0.99(0.85-1.15) 9.25×10⁻¹ rs1350105 5q22.3 GWAS 5/260/2034 19/433/2603 0.059 0.077 0.72(0.61-0.85) 9.87×10⁻⁵ A/G Replication I 15/286/1970 16/294/1925 0.070 0.073 0.95(0.81-1.13) 5.82×10⁻¹ rs10069190 5q23.2 GWAS 155/869/1307 247/1283/1545 0.253 0.289 0.82(0.75-0.90) 3.68×10⁻⁵ C/T Replication I 149/889/1236 174/897/1159 0.261 0.279 0.92(0.84-1.02) 1.14×10⁻¹ rs247008 5q31.1 GWAS 418/1164/742 717/1480/873 0.430 0.475 0.83(0.76-0.90) 1.14×10⁻⁵ G/A Replication I 443/1133/685 478/1124/628 0.447 0.466 0.88(0.81-0.97) 6.84×10⁻³
Replication II 1012/2451/1501 1149/2484/1495 0.451 0.466 0.93(0.87-0.98) 8.36×10⁻³ Combined All 1873/4748/2928 2344/5088/2996 0.445 0.469 0.89(0.86-0.93) 7.68×10⁻⁸
rs2526303 5q31.1 GWAS 606/1169/541 689/1512/875 0.486 0.470 1.20(1.10-1.30) 2.59×10⁻⁵ A/G Replication I 550/1129/597 528/1083/627 0.490 0.478 1.07(0.98-1.17) 1.06×10⁻¹ rs2551038 5q31.1 GWAS 47/576/1660 107/870/2049 0.147 0.179 0.78(0.70-0.88) 2.22×10⁻⁵ C/G Replication I 46/773/1424 55/698/1456 0.193 0.183 1.06(0.94-1.19) 3.58×10⁻¹ rs27437 5q31.1 GWAS 244/1038/1018 266/1280/1521 0.332 0.295 1.20(1.10-1.31) 2.64×10⁻⁵ A/G Replication I 221/995/1031 215/953/1053 0.320 0.311 1.06(0.97-1.17) 2.16×10⁻¹ rs2895680 5q32 GWAS 250/1001/1077 248/1231/1598 0.322 0.281 1.23(1.13-1.35) 4.92×10⁻⁶ T/C Replication I 247/1035/1001 188/958/1097 0.335 0.297 1.16(1.05-1.29) 3.95×10⁻³
Replication II 532/2137/2428 542/2040/2642 0.314 0.299 1.07(1.00-1.13) 3.53×10⁻² Combined All 1029/4173/4506 978/4229/5337 0.321 0.293 1.14(1.09-1.19) 6.60×10⁻⁹
rs17087042 6q25.1 GWAS 177/888/1266 278/1308/1491 0.266 0.303 0.83(0.76-0.91) 8.64×10⁻⁵ C/T Replication I 196/855/1227 183/846/1209 0.274 0.271 1.01(0.92-1.11) 8.77×10⁻¹
Nature Genetics: doi:10.1038/ng.2351

rs1178120 7p21.1 GWAS 106/773/1452 193/1137/1747 0.211 0.248 0.82(0.74-0.90) 5.92×10⁻⁵ C/T Replication I 109/810/1351 125/748/1357 0.226 0.224 1.04(0.94-1.15) 4.77×10⁻¹ rs6975360 7q21.11 GWAS 13/334/1984 6/320/2751 0.077 0.054 1.39(1.18-1.63) 7.33×10⁻⁵ T/C Replication I 19/307/1939 9/291/1936 0.076 0.069 1.07(0.90-1.26) 4.58×10⁻¹ rs7794837 7q21.11 GWAS 514/1116/700 532/1504/1036 0.460 0.418 1.19(1.10-1.29) 4.37×10⁻⁵ A/G Replication I 474/1167/630 474/1087/674 0.466 0.455 1.07(0.98-1.17) 1.60×10⁻¹ rs4576415 8p11.21 GWAS 96/734/1498 80/862/2135 0.199 0.166 1.23(1.11-1.36) 9.45×10⁻⁵ A/G Replication I 66/698/1511 63/674/1505 0.182 0.178 1.05(0.93-1.18) 4.42×10⁻¹ rs1905041 8q13.3 GWAS 16/299/2014 11/299/2761 0.071 0.052 1.43(1.20-1.69) 4.98×10⁻⁵ A/C Replication I 10/337/1924 12/337/1888 0.079 0.081 1.00(0.85-1.18) 9.79×10⁻¹ rs7831907 8q22.3 GWAS 17/316/1992 29/543/2501 0.075 0.098 0.72(0.62-0.84) 2.31×10⁻⁵ G/A Replication I 15/355/1894 17/343/1874 0.085 0.084 1.02(0.87-1.19) 8.56×10⁻¹ rs10974033 9p13.1 GWAS 128/756/1432 120/878/2045 0.219 0.184 1.21(1.10-1.34) 9.67×10⁻⁵ T/A Replication I 77/740/1420 102/763/1347 0.200 0.219 0.89(0.79-0.99) 3.26×10⁻² rs1339274 9p23 GWAS 32/454/1780 39/457/2502 0.114 0.089 1.37(1.19-1.57) 9.85×10⁻⁶ G/T Replication I 28/444/1787 22/413/1728 0.111 0.106 1.04(0.90-1.20) 6.13×10⁻¹ rs2146079 9q31.3 GWAS 421/1074/834 625/1524/928 0.411 0.451 0.83(0.76-0.90) 9.78×10⁻⁶ C/T Replication I 378/1112/764 424/1043/732 0.414 0.430 0.93(0.85-1.02) 1.31×10⁻¹ rs1663689 10p14 GWAS 355/1072/904 544/1498/1030 0.382 0.421 0.84(0.77-0.91) 3.03×10⁻⁵ A/G Replication I 353/1030/877 370/1121/721 0.384 0.421 0.83(0.76-0.91) 7.73×10⁻⁵
Replication II 797/2294/1850 951/2352/1809 0.394 0.416 0.91(0.86-0.96) 1.14×10⁻³ Combined All 1505/4396/3631 1865/4971/3560 0.389 0.419 0.88(0.84-0.91) 2.84×10⁻¹⁰
rs4749765 10p14 GWAS 442/1127/762 491/1454/1132 0.431 0.396 1.20(1.10-1.31) 2.29×10⁻⁵ T/C Replication I 362/1158/717 418/1099/696 0.421 0.437 0.92(0.84-1.01) 8.56×10⁻² rs588097 11q13.4 GWAS 534/1153/589 591/1500/883 0.488 0.451 1.20(1.10-1.31) 2.99×10⁻⁵ C/T Replication I 548/1077/645 532/1090/609 0.479 0.483 0.96(0.88-1.04) 3.27×10⁻¹ rs940828 11q13.4 GWAS 183/960/1131 196/1152/1685 0.292 0.255 1.24(1.12-1.36) 1.26×10⁻⁵
Nature Genetics: doi:10.1038/ng.2351
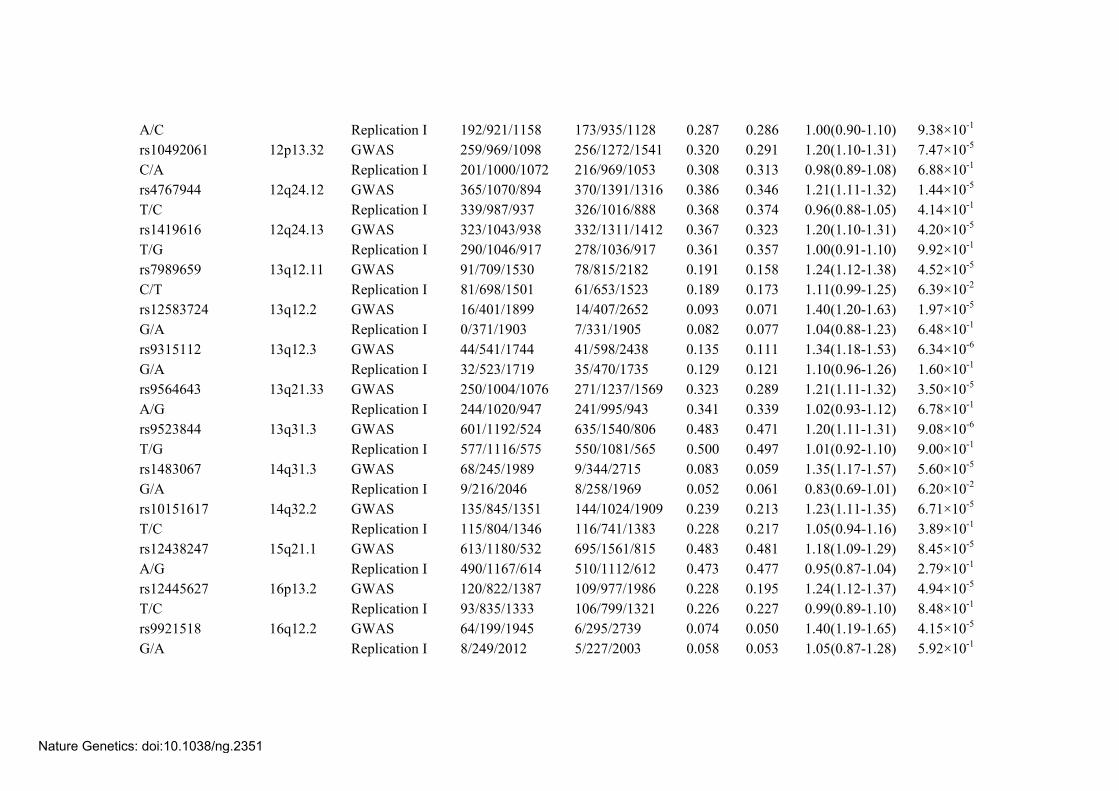
A/C Replication I 192/921/1158 173/935/1128 0.287 0.286 1.00(0.90-1.10) 9.38×10⁻¹ rs10492061 12p13.32 GWAS 259/969/1098 256/1272/1541 0.320 0.291 1.20(1.10-1.31) 7.47×10⁻⁵ C/A Replication I 201/1000/1072 216/969/1053 0.308 0.313 0.98(0.89-1.08) 6.88×10⁻¹ rs4767944 12q24.12 GWAS 365/1070/894 370/1391/1316 0.386 0.346 1.21(1.11-1.32) 1.44×10⁻⁵ T/C Replication I 339/987/937 326/1016/888 0.368 0.374 0.96(0.88-1.05) 4.14×10⁻¹ rs1419616 12q24.13 GWAS 323/1043/938 332/1311/1412 0.367 0.323 1.20(1.10-1.31) 4.20×10⁻⁵ T/G Replication I 290/1046/917 278/1036/917 0.361 0.357 1.00(0.91-1.10) 9.92×10⁻¹ rs7989659 13q12.11 GWAS 91/709/1530 78/815/2182 0.191 0.158 1.24(1.12-1.38) 4.52×10⁻⁵ C/T Replication I 81/698/1501 61/653/1523 0.189 0.173 1.11(0.99-1.25) 6.39×10⁻² rs12583724 13q12.2 GWAS 16/401/1899 14/407/2652 0.093 0.071 1.40(1.20-1.63) 1.97×10⁻⁵ G/A Replication I 0/371/1903 7/331/1905 0.082 0.077 1.04(0.88-1.23) 6.48×10⁻¹ rs9315112 13q12.3 GWAS 44/541/1744 41/598/2438 0.135 0.111 1.34(1.18-1.53) 6.34×10⁻⁶ G/A Replication I 32/523/1719 35/470/1735 0.129 0.121 1.10(0.96-1.26) 1.60×10⁻¹ rs9564643 13q21.33 GWAS 250/1004/1076 271/1237/1569 0.323 0.289 1.21(1.11-1.32) 3.50×10⁻⁵ A/G Replication I 244/1020/947 241/995/943 0.341 0.339 1.02(0.93-1.12) 6.78×10⁻¹ rs9523844 13q31.3 GWAS 601/1192/524 635/1540/806 0.483 0.471 1.20(1.11-1.31) 9.08×10⁻⁶ T/G Replication I 577/1116/575 550/1081/565 0.500 0.497 1.01(0.92-1.10) 9.00×10⁻¹ rs1483067 14q31.3 GWAS 68/245/1989 9/344/2715 0.083 0.059 1.35(1.17-1.57) 5.60×10⁻⁵ G/A Replication I 9/216/2046 8/258/1969 0.052 0.061 0.83(0.69-1.01) 6.20×10⁻² rs10151617 14q32.2 GWAS 135/845/1351 144/1024/1909 0.239 0.213 1.23(1.11-1.35) 6.71×10⁻⁵ T/C Replication I 115/804/1346 116/741/1383 0.228 0.217 1.05(0.94-1.16) 3.89×10⁻¹ rs12438247 15q21.1 GWAS 613/1180/532 695/1561/815 0.483 0.481 1.18(1.09-1.29) 8.45×10⁻⁵ A/G Replication I 490/1167/614 510/1112/612 0.473 0.477 0.95(0.87-1.04) 2.79×10⁻¹ rs12445627 16p13.2 GWAS 120/822/1387 109/977/1986 0.228 0.195 1.24(1.12-1.37) 4.94×10⁻⁵ T/C Replication I 93/835/1333 106/799/1321 0.226 0.227 0.99(0.89-1.10) 8.48×10⁻¹ rs9921518 16q12.2 GWAS 64/199/1945 6/295/2739 0.074 0.050 1.40(1.19-1.65) 4.15×10⁻⁵ G/A Replication I 8/249/2012 5/227/2003 0.058 0.053 1.05(0.87-1.28) 5.92×10⁻¹
Nature Genetics: doi:10.1038/ng.2351

a Major/minor alleles; b Variant homozygote/Heterozygote/Wild type homozygote; c MAF, Minor allele frequency; d Adjusted by age, gender, pack-year of smoking and PCs adjustent for GWAS, adjusted by age, gender and pack-year of smoking for others.
rs3967769 17p13.1 GWAS 317/1115/899 332/1407/1336 0.375 0.337 1.20(1.10-1.31) 6.55×10⁻⁵ T/G Replication I 256/1027/981 255/1003/961 0.340 0.341 1.03(0.94-1.13) 5.35×10⁻¹ rs12458580 18p11.21 GWAS 190/951/1189 181/1186/1701 0.286 0.252 1.24(1.13-1.36) 1.18×10⁻⁵ C/T Replication I 160/914/1198 165/865/1207 0.272 0.267 1.01(0.92-1.12) 8.10×10⁻¹ rs17001493 19p13.2 GWAS 16/356/1959 30/609/2437 0.083 0.109 0.73(0.63-0.85) 2.27×10⁻⁵ G/T Replication I 14/340/1924 18/380/1837 0.081 0.093 0.87(0.74-1.02) 8.43×10⁻² rs3745662 19p13.2 GWAS 16/388/1871 35/624/2343 0.092 0.116 0.75(0.65-0.86) 3.93×10⁻⁵ A/C Replication I 12/391/1878 19/399/1816 0.091 0.098 0.95(0.81-1.10) 4.70×10⁻¹ rs4809957 20q13.2 GWAS 335/1124/862 383/1359/1316 0.387 0.347 1.19(1.09-1.30) 7.62×10⁻⁵ C/T Replication I 310/1095/857 291/1008/927 0.379 0.357 1.10(1.01-1.21) 3.85×10⁻²
Replication II 853/2255/1867 729/2388/2031 0.398 0.374 1.11(1.05-1.17) 4.83×10⁻⁴ Combined All 1498/4474/3586 1403/4755/4274 0.391 0.362 1.13(1.08-1.18) 1.20×10⁻⁸
rs468476 21q21.3 GWAS 237/977/1114 360/1432/1283 0.312 0.350 0.84(0.77-0.92) 8.72×10⁻⁵ G/T Replication I 288/978/1003 252/1030/958 0.342 0.342 1.00(0.92-1.10) 9.31×10⁻¹
Nature Genetics: doi:10.1038/ng.2351

Supplementary Table 5. Summary of GWAS scan and replication studies for the 5 SNPs
SNP Study Cases c Controls c MAF d ORhet ORhomo
Cases Controls (95% CI) e (95% CI) e
rs1663689 GWAS 355/1072/904 544/1498/1030 0.382 0.421 0.82(0.72-0.93) 0.71(0.59-0.84)10p14 A/G a Replication I 353/1030/877 370/1121/721 0.384 0.421 0.73(0.63-0.84) 0.74(0.61-0.89)9065201 b Replication II 797/2294/1850 951/2352/1809 0.394 0.416 0.95(0.87-1.04) 0.81(0.72-0.91) Combined All 1505/4396/3631 1865/4971/3560 0.389 0.419 0.86(0.80-0.91) 0.77(0.71-0.84) SC 512/1600/1252 1865/4971/3560 0.390 0.419 0.88(0.80-0.97) 0.76(0.67-0.87) AC 779/2189/1875 1865/4971/3560 0.387 0.419 0.84(0.77-0.90) 0.78(0.71-0.87) SCC 128/386/322 1865/4971/3560 0.384 0.419 0.83(0.71-0.97) 0.73(0.59-0.91) Other 86/221/182 1865/4971/3560 0.402 0.419 0.85(0.70-1.05) 0.87(0.67-1.13)rs2895680 GWAS 250/1001/1077 248/1231/1598 0.322 0.281 1.25(1.11-1.42) 1.49(1.21-1.84)5q32 T/C a Replication I 247/1035/1001 188/958/1097 0.335 0.297 1.08(0.93-1.25) 1.45(1.16-1.82)146624308 b Replication II 532/2137/2428 542/2040/2642 0.314 0.299 1.14(1.05-1.24) 1.06(0.92-1.21) Combined All 1029/4173/4506 978/4229/5337 0.321 0.293 1.17(1.10-1.24) 1.25(1.14-1.39) SC 299/1450/1681 978/4229/5337 0.299 0.293 1.17(1.07-1.28) 0.96(0.82-1.12) AC 604/2150/2173 978/4229/5337 0.341 0.293 1.18(1.09-1.27) 1.44(1.28-1.61) SCC 86/354/412 978/4229/5337 0.309 0.293 1.10(0.94-1.28) 1.07(0.84-1.37) Other 40/219/240 978/4229/5337 0.300 0.293 1.15(0.95-1.39) 0.87(0.61-1.22)rs4809957 GWAS 335/1124/862 383/1359/1316 0.387 0.347 1.25(1.10-1.42) 1.37(1.14-1.64)20q13.2 C/T a Replication I 310/1095/857 291/1008/927 0.379 0.357 1.17(1.03-1.34) 1.16(0.95-1.41)52204578 b Replication II 853/2255/1867 729/2388/2031 0.398 0.374 1.02(0.94-1.12) 1.28(1.14-1.45) Combined All 1498/4474/3586 1403/4755/4274 0.391 0.362 1.11(1.04-1.18) 1.29(1.18-1.41) SC 504/1601/1268 1403/4755/4274 0.387 0.362 1.15(1.04-1.26) 1.22(1.07-1.39) AC 784/2245/1833 1403/4755/4274 0.392 0.362 1.09(1.01-1.17) 1.30(1.17-1.44) SCC 131/411/299 1403/4755/4274 0.400 0.362 1.22(1.05-1.43) 1.33(1.06-1.65) Other 79/217/186 1403/4755/4274 0.389 0.362 1.03(0.84-1.26) 1.29(0.98-1.70)rs247008 GWAS 418/1164/742 717/1480/873 0.430 0.475 0.92(0.81-1.06) 0.67(0.57-0.80)5q31.1 G/A a Replication I 443/1133/685 478/1124/628 0.447 0.466 0.91(0.79-1.05) 0.78(0.65-0.93)131475003 b Replication II 1012/2451/1501 1149/2484/1495 0.451 0.466 0.97(0.88-1.06) 0.85(0.76-0.95) Combined All 1873/4748/2928 2344/5088/2996 0.445 0.469 0.95(0.89-1.01) 0.79(0.73-0.86)
Nature Genetics: doi:10.1038/ng.2351

SC 672/1639/1053 2344/5088/2996 0.443 0.469 0.91(0.83-1.01) 0.75(0.66-0.85) AC 926/2433/1503 2344/5088/2996 0.441 0.469 0.95(0.87-1.02) 0.78(0.70-0.86) SCC 177/415/246 2344/5088/2996 0.459 0.469 0.99(0.84-1.18) 0.86(0.70-1.06) Other 98/261/126 2344/5088/2996 0.471 0.469 1.20(0.96-1.50) 0.92(0.70-1.22)rs9439519 GWAS 204/1018/1104 231/1229/1615 0.307 0.275 1.22(1.08-1.38) 1.43(1.14-1.79)1p36.32 A/G a Replication I 204/966/1113 145/921/1177 0.301 0.270 1.09(0.96-1.24) 1.37(1.07-1.75)5264494 b Replication II 412/2117/2513 401/2048/2715 0.292 0.276 1.11(1.02-1.20) 1.12(0.96-1.30) Combined All 820/4101/4730 777/4198/5507 0.297 0.274 1.13(1.06-1.19) 1.22(1.09-1.36) SC 298/1429/1684 777/4198/5507 0.297 0.274 1.09(1.00-1.19) 1.31(1.12-1.54) AC 297/2107/2502 777/4198/5507 0.275 0.274 1.09(1.02-1.18) 0.84(0.73-0.97) SCC 57/422/360 777/4198/5507 0.319 0.274 1.52(1.31-1.77) 1.14(0.84-1.53) Other 168/143/184 777/4198/5507 0.484 0.274 1.03(0.82-1.28) 6.43(5.13-8.06)
a Major/minor alleles. b base pair position of the SNP. c Variant homozygote/Heterozygote/Wild type homozygote; d Minor allele frequency (MAF); e Adjusted by age, gender, pack-year of smoking and PCs adjustment for GWAS, adjusted by age, gender and pack-year of smoking for others; ORhet: Heterozygote vs. Wild type homozygote; ORhomo: Variant homozygote vs. Wild type homozygote. SC, squamous cell carcinoma; AC, adenocarcinoma; SCC, small cell carcinoma; other includes large cell lung cancer and mixed cell carcinoma.
Nature Genetics: doi:10.1038/ng.2351

Supplementary Table 6. SNPs identified by GWAS genotyping or imputation analyses at chromosomes 1p36.32, 5q31.1, 5q32, 10p14 and 20q13.2 and their associations with lung cancer (P <1.0×10⁻⁴)
Chr. SNP Position Minor Major MAF
P a ORadd Padd Identification by Allele Allele Cases Controls
5q31.1 rs154726 131475547 T C 0.318 0.357 0.366 0.838 2.11×10⁻⁵ Imputation 5q31.1 rs154727 131476656 G A 0.316 0.353 0.344 0.842 3.60×10⁻⁵ Imputation 5q31.1 rs154728 131476928 G T 0.316 0.355 0.409 0.837 1.68×10⁻⁵ Imputation 5q31.1 rs247008 131475003 A G 0.430 0.475 0.065 0.838 5.56×10⁻⁶ Genotyping 5q31.1 rs247294 131484927 T C 0.324 0.363 0.258 0.839 2.43×10⁻⁵ Genotyping 5q31.1 rs27437 131464860 G A 0.332 0.295 0.931 1.186 5.45×10⁻⁵ Genotyping 5q31.1 rs368443 131480322 T C 0.316 0.354 0.431 0.839 2.31×10⁻⁵ Imputation 5q31.1 rs411219 131479532 G A 0.316 0.354 0.431 0.839 2.31×10⁻⁵ Imputation 5q31.1 rs633150 131477962 G A 0.316 0.354 0.431 0.839 2.31×10⁻⁵ Imputation 5q32 rs11167981 146617349 A G 0.323 0.287 0.792 1.183 6.71×10⁻⁵ Imputation 5q32 rs2895680 146624308 C T 0.322 0.281 0.623 1.217 3.22×10⁻⁶ Genotyping 10p14 rs11256000 9054027 T A 0.372 0.410 0.882 0.852 6.00×10⁻⁵ Imputation 10p14 rs12253258 9064296 C T 0.356 0.394 0.940 0.854 8.18×10⁻⁵ Imputation 10p14 rs1663670 9059265 C T 0.382 0.420 1.000 0.855 7.44×10⁻⁵ Imputation 10p14 rs1663689 9065201 G A 0.382 0.421 1.000 0.853 5.66×10⁻⁵ Genotyping 10p14 rs1663690 9064524 A G 0.382 0.420 0.971 0.855 7.62×10⁻⁵ Imputation 10p14 rs1663691 9063738 G A 0.382 0.420 0.971 0.855 7.62×10⁻⁵ Imputation 10p14 rs1705328 9064823 C A 0.382 0.420 0.971 0.855 7.62×10⁻⁵ Imputation 10p14 rs1775574 9063728 T C 0.382 0.420 0.971 0.855 7.62×10⁻⁵ Imputation 10p14 rs1775575 9064365 A G 0.382 0.420 0.971 0.855 7.62×10⁻⁵ Imputation 10p14 rs34385685 9047222 A T 0.383 0.420 0.971 0.856 8.50×10⁻⁵ Imputation 10p14 rs35766269 9063821 T A 0.382 0.420 0.971 0.855 7.62×10⁻⁵ Imputation 10p14 rs706773 9061187 C T 0.382 0.420 1.000 0.857 8.76×10⁻⁵ Imputation
Nature Genetics: doi:10.1038/ng.2351

10p14 rs827626 9062024 C G 0.382 0.420 0.971 0.855 7.62×10⁻⁵ Imputation 20q13.2 rs1570669 52207834 T C 0.385 0.346 0.111 1.180 4.01×10⁻⁵ Genotyping 20q13.2 rs1570670 52207986 A G 0.384 0.347 0.095 1.175 5.95×10⁻⁵ Imputation 20q13.2 rs2274130 52208008 A G 0.382 0.344 0.162 1.174 6.59×10⁻⁵ Imputation 20q13.2 rs2274132 52208310 G A 0.384 0.347 0.095 1.175 5.95×10⁻⁵ Imputation 20q13.2 rs2296237 52208699 G A 0.384 0.347 0.095 1.175 5.95×10⁻⁵ Imputation 20q13.2 rs2296238 52208725 C T 0.384 0.347 0.095 1.175 5.95×10⁻⁵ Imputation 20q13.2 rs2296239 52208935 C T 0.384 0.347 0.095 1.175 5.95×10⁻⁵ Imputation 20q13.2 rs2296240 52209135 A G 0.385 0.347 0.095 1.175 5.80×10⁻⁵ Imputation 20q13.2 rs3787553 52210764 G A 0.384 0.347 0.095 1.175 5.95×10⁻⁵ Imputation 20q13.2 rs4809957 52204578 T C 0.387 0.347 0.282 1.183 3.27×10⁻⁵ Genotyping 20q13.2 rs6091824 52206643 C T 0.389 0.352 0.192 1.173 7.08×10⁻⁵ Imputation 20q13.2 rs6091825 52208566 G A 0.384 0.347 0.095 1.175 5.95×10⁻⁵ Imputation 20q13.2 rs6097810 52207041 T C 0.384 0.347 0.095 1.175 5.95×10⁻⁵ Imputation 20q13.2 rs751087 52210324 T C 0.384 0.347 0.095 1.175 5.95×10⁻⁵ Imputation 20q13.2 rs751089 52210176 G T 0.384 0.347 0.095 1.175 5.95×10⁻⁵ Imputation 20q13.2 rs912505 52210248 A G 0.384 0.347 0.095 1.175 5.95×10⁻⁵ Imputation 20q13.2 rs927651 52206303 A G 0.384 0.347 0.095 1.175 5.95×10⁻⁵ Imputation 20q13.2 rs927652 52206318 T C 0.384 0.347 0.095 1.175 5.95×10⁻⁵ Imputation
a P values for Hardy-Weinberg Equilibrium in controls.
Nature Genetics: doi:10.1038/ng.2351

Supplementary Table 7. Stratification analysis on the 5 SNPs
Variables rs1663689 rs2895680
Cases a Controls a OR (95% CI) P b P c Cases a Controls a OR (95% CI) P b P c
Age 1.000 0.538
≤60 792/2296/1926 1024/2641/1944 0.88(0.83-0.93) 2.88×10⁻⁶ 555/2218/2328 544/2245/2882 1.15(1.09-1.22) 1.76×10⁻⁶
>60 713/2100/1705 841/2330/1616 0.88(0.82-0.93) 2.34×10⁻⁵ 474/1955/2178 434/1984/2455 1.12(1.05-1.19) 7.11×10⁻⁴
Gender 0.793 0.002 Male 1016/2996/2432 1189/3214/2266 0.87(0.83-0.92) 3.31×10⁻⁷ 576/2745/3247 668/2400/3684 1.08(1.02-1.14) 6.66×10⁻³
Female 489/1400/1199 676/1757/1294 0.88(0.82-0.94) 1.98×10⁻⁴ 453/1428/1259 310/1829/1653 1.25(1.16-1.35) 1.46×10⁻⁹
Smoking status 0.967 0.002 Never 613/1801/1538 1098/2994/2161 0.88(0.83-0.93) 7.51×10⁻⁶ 509/1791/1729 534/2687/3131 1.23(1.16-1.31) 1.44×10⁻¹¹ Ever 240/653/522 129/299/215 0.88(0.77-1.00) 5.31×10⁻² 134/592/714 73/248/338 1.00(0.87-1.15) 9.64×10⁻¹
Current 652/1942/1571 638/1678/1184 0.87(0.81-0.93) 2.02×10⁻⁵ 386/1790/2063 371/1294/1868 1.07(1.00-1.15) 4.63×10⁻² Smoking dose 0.531 <0.001
Never 613/1801/1538 1098/2994/2161 0.88(0.83-0.93) 7.51×10⁻⁶ 509/1791/1729 534/2687/3131 1.23(1.16-1.31) 1.44×10⁻¹¹
0-24 247/759/574 378/972/720 0.91(0.83-1.00) 5.80×10⁻² 147/700/779 202/743/1154 1.15(1.04-1.27) 5.07×10⁻³
>24 645/1836/1519 389/1005/679 0.85(0.79-0.92) 3.12×10⁻⁵ 373/1682/1998 242/799/1052 0.97(0.90-1.05) 4.67×10⁻¹
Histology 0.296 0.015 SC 512/1600/1252 1865/4971/3560 0.87(0.82-0.93) 1.90×10⁻⁵ 299/1450/1681 978/4229/5337 1.05(0.98-1.12) 1.53×10⁻¹
AC 779/2189/1875 1865/4971/3560 0.87(0.83-0.92) 1.12×10⁻⁷ 604/2150/2173 978/4229/5337 1.19(1.13-1.25) 3.22×10⁻¹¹
SCC 128/386/322 1865/4971/3560 0.85(0.77-0.94) 2.11×10⁻³ 86/354/412 978/4229/5337 1.06(0.95-1.18) 3.18×10⁻¹
LC 32/97/52 1865/4971/3560 1.09(0.88-1.34) 4.31×10⁻¹ 18/79/93 978/4229/5337 1.03(0.82-1.28) 8.21×10⁻¹
Mixed 54/124/130 1865/4971/3560 0.83(0.70-0.98) 2.62×10⁻² 22/140/147 978/4229/5337 1.00(0.84-1.19) 9.90×10⁻¹ a Variant homozygote/Heterozygote/Wild type homozygote; b Adjusted by age, gender and pack-year of smoking where is appropriate. SC, squamous cell carcinoma; AC, adenocarcinoma; SCC, small cell carcinoma; LC, large cell lung cancer; mixed, mixed cell carcinoma. c Test for heterogeneity.
Nature Genetics: doi:10.1038/ng.2351

Supplementary Table 7. Stratification analysis on the 5 SNPs (cont.)
Variables rs4809957 rs247008
Cases a Controls a OR (95% CI) P b P c Cases a Controls a OR (95% CI) P b P c
Age 0.103 0.006
≤60 796/2390/1830 733/2601/2293 1.17(1.10-1.23) 1.17×10⁻⁷ 1014/2482/1520 1240/2731/1650 0.94(0.89-0.99) 3.04×10⁻²
>60 702/2084/1756 670/2154/1981 1.09(1.02-1.16) 8.16×10⁻³ 859/2266/1408 1104/2357/1346 0.84(0.79-0.89) 1.81×10⁻⁸
Gender 0.845 1.000 Male 965/3077/2416 896/3019/2769 1.13(1.07-1.19) 9.54×10⁻⁶ 1286/3211/1962 1551/3191/1948 0.89(0.85-0.94) 1.42×10⁻⁵
Female 533/13971170 507/1736/1505 1.14(1.06-1.22) 3.11×10⁻⁴ 587/1537/966 793/1897/1048 0.89(0.83-0.96) 1.50×10⁻³
Smoking status 0.188 0.057 Never 693/1792/1489 833/2898/2554 1.16(1.10-1.23) 3.66×10⁻⁷ 780/1957/1211 1311/3163/1811 0.94(0.89-1.00) 3.85×10⁻² Ever 205/639/574 88/297/260 1.01(0.88-1.16) 8.72×10⁻² 281/723/415 161/296/190 0.91(0.80-1.03) 1.46×10⁻¹
Current 600/2043/1523 482/1560/1460 1.13(1.06-1.21) 3.56×10⁻⁴ 812/2068/1302 872/1629/995 0.85(0.80-0.90) 3.26×10⁻⁷ Smoking dose 0.266 0.075
Never 693/1792/1489 833/2898/2554 1.16(1.10-1.23) 3.66×10⁻⁷ 780/1957/1211 1311/3163/1811 0.94(0.89-1.00) 3.85×10⁻²
0-24 211/762/604 291/921/862 1.06(0.96-1.16) 2.52×10⁻¹ 310/775/510 507/962/603 0.86(0.78-0.94) 8.21×10⁻⁴
>24 594/1920/1493 279/936/858 1.12(1.04-1.22) 3.25×10⁻³ 783/2016/1207 526/963/582 0.85(0.79-0.92) 3.87×10⁻⁵
Histology 0.025 0.236 SC 504/1601/1268 1403/4755/4274 1.11(1.05-1.18) 7.41×10⁻⁴ 672/1639/1053 2344/5088/2996 0.87(0.82-0.92) 5.29×10⁻⁶
AC 784/2245/1833 1403/4755/4274 1.13(1.07-1.18) 3.12×10⁻⁶ 926/2433/1503 2344/5088/2996 0.89(0.85-0.93) 1.98×10⁻⁶
SCC 131/411/299 1403/4755/4274 1.17(1.05-1.29) 3.80×10⁻³ 177/415/246 2344/5088/2996 0.93(0.84-1.03) 1.88×10⁻¹
LC 38/88/54 1403/4755/4274 1.46(1.19-1.80) 4.34×10⁻⁴ 42/100/40 2344/5088/2996 1.11(0.90-1.37) 3.12×10⁻¹
Mixed 41/129/132 1403/4755/4274 0.94(0.79-1.11) 4.52×10⁻¹ 56/161/86 2344/5088/2996 0.90(0.77-1.06) 2.23×10⁻¹ a Variant homozygote/Heterozygote/Wild type homozygote; b Adjusted by age, gender and pack-year of smoking where is appropriate. SC, squamous cell carcinoma; AC, adenocarcinoma; SCC, small cell carcinoma; LC, large cell lung cancer; mixed, mixed cell carcinoma. c Test for heterogeneity.
Nature Genetics: doi:10.1038/ng.2351

Supplementary Table 7. Stratification analysis on the 5 SNPs (cont.)
Variables rs9439519
Cases a Controls a OR (95% CI) P b P c
Age 0.252
≤60 429/2187/2451 411/2254/2976 1.14(1.07-1.21) 2.69×10⁻⁵
>60 391/1914/2279 366/1944/2531 1.08(1.01-1.16) 2.21×10⁻²
Gender 0.011 Male 579/2783/3167 494/2642/3576 1.16(1.10-1.23) 2.43×10⁻⁷
Female 241/1318/1563 283/1556/1931 1.03(0.96-1.11) 4.17×10⁻¹
Smoking status 0.023 Never 309/1711/1985 480/2568/3276 1.06(1.00-1.13) 7.04 ×10⁻² Ever 137/594/697 48/231/371 1.29(1.12-1.50) 5.10×10⁻⁴
Current 374/1796/2048 249/1399/1860 1.16(1.08-1.25) 3.09×10⁻⁵ Smoking dose 0.044
Never 309/1711/1985 480/2568/3276 1.06(1.00-1.13) 7.04 ×10⁻² 0-24 165/642/797 146/803/1127 1.21(1.09-1.34) 2.67×10⁻⁴ >24 346/1748/1948 151/827/1104 1.17(1.07-1.27) 3.43×10⁻⁴
Histology <0.001SC 298/1429/1684 777/4198/5507 1.12(1.05-1.20) 7.70×10⁻⁴
AC 297/2107/2502 777/4198/5507 1.00(0.95-1.06) 9.84×10⁻¹
SCC 57/422/360 777/4198/5507 1.25(1.12-1.40) 1.19×10⁻⁴
LC 41/57/88 777/4198/5507 1.57(1.27-1.95) 4.53×10⁻⁵
Mixed 127/86/96 777/4198/5507 3.18(2.70-3.74) 3.32×10-44 a Variant homozygote/Heterozygote/Wild type homozygote; b Adjusted by age, gender and pack-year of smoking where is appropriate. SC, squamous cell carcinoma; AC, adenocarcinoma; SCC, small cell carcinoma; LC, large cell lung cancer; mixed, mixed cell carcinoma. c Test for heterogeneity.
Nature Genetics: doi:10.1038/ng.2351

Supplementary Table 8. Interactions between smoking and 4 SNPs
Smoking rs2895680 rs4809957
Genotypes Case/Control OR(95%CI) Genotypes Case/Control OR(95%CI) Never TT 1729/3131 1.00 CC 1489/2554 1.00 Never TC 1791/2687 1.15(1.05-1.25) CT 1792/2898 1.06(0.97-1.16)Never CC 509/534 1.65(1.44-1.89) TT 693/833 1.42(1.26-1.60)0-24 TT 779/1154 1.52(1.36-1.70) CC 604/862 1.55(1.36-1.76)0-24 TC 700/743 2.08(1.84-2.36) CT 762/921 1.82(1.61-2.06)0-24 CC 147/202 1.61(1.29-2.01) TT 211/291 1.60(1.32-1.95)>24 TT 1998/1052 4.33(3.91-4.80) CC 1493/858 3.91(3.48-4.38)>24 TC 1682/799 4.77(4.28-5.33) CT 1920/936 4.60(4.12-5.14)>24 CC 373/242 3.48(2.92-4.15) TT 594/279 4.77(4.06-5.61)
P for interaction (multiplicative) 1.72×10⁻¹⁰ 5.07×10⁻³
Nature Genetics: doi:10.1038/ng.2351
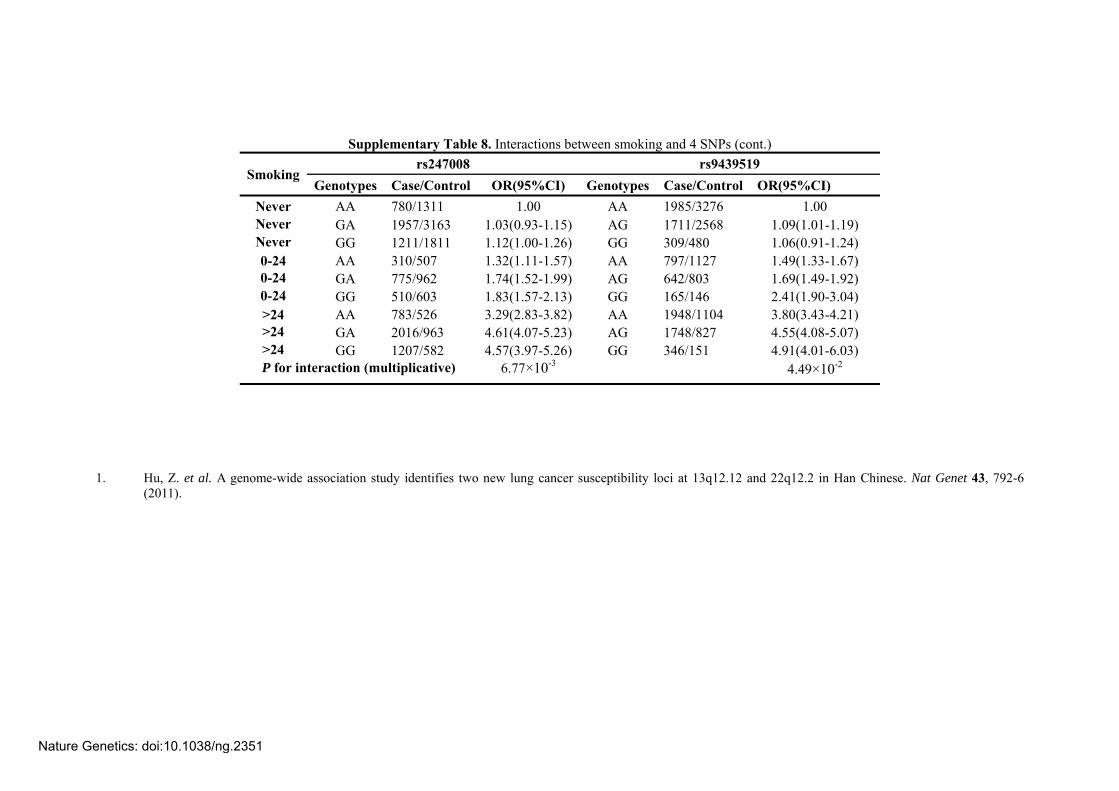
Supplementary Table 8. Interactions between smoking and 4 SNPs (cont.)
Smoking rs247008 rs9439519
Genotypes Case/Control OR(95%CI) Genotypes Case/Control OR(95%CI) Never AA 780/1311 1.00 AA 1985/3276 1.00 Never GA 1957/3163 1.03(0.93-1.15) AG 1711/2568 1.09(1.01-1.19) Never GG 1211/1811 1.12(1.00-1.26) GG 309/480 1.06(0.91-1.24) 0-24 AA 310/507 1.32(1.11-1.57) AA 797/1127 1.49(1.33-1.67) 0-24 GA 775/962 1.74(1.52-1.99) AG 642/803 1.69(1.49-1.92) 0-24 GG 510/603 1.83(1.57-2.13) GG 165/146 2.41(1.90-3.04) >24 AA 783/526 3.29(2.83-3.82) AA 1948/1104 3.80(3.43-4.21) >24 GA 2016/963 4.61(4.07-5.23) AG 1748/827 4.55(4.08-5.07) >24 GG 1207/582 4.57(3.97-5.26) GG 346/151 4.91(4.01-6.03) P for interaction (multiplicative) 6.77×10⁻³ 4.49×10⁻²
1. Hu, Z. et al. A genome-wide association study identifies two new lung cancer susceptibility loci at 13q12.12 and 22q12.2 in Han Chinese. Nat Genet 43, 792-6
(2011).
Nature Genetics: doi:10.1038/ng.2351