Embed Size (px)
Citation preview

Supplemental Investor Information
George Ellison, CEO
Robin Lowe, CFO
Miles Adams, SVP Property Operations
© 2019 Front Yard Residential. All rights reserved.
1st Quarter 2019
welcome
1
home.

Forward-looking Statements
This presentation contains forward-looking statements within the meaning of Section 27A of the Securities Act of 1933, as amended, and
Section 21E of the Securities Exchange Act of 1934, as amended, regarding management’s beliefs, estimates, projections, anticipations and
assumptions with respect to, among other things, the Company’s financial results, future operations, business plans and investment
strategies as well as industry and market conditions. These statements may be identified by words such as “anticipate,” “intend,”
“expect,” “may,” “could,” “should,” “would,” “plan,” “estimate,” “target,” “seek,” “believe” and other expressions or words of similar meaning.
We caution that forward-looking statements are qualified by the existence of certain risks and uncertainties that could cause actual
results and events to differ materially from what is contemplated by the forward-looking statements. Factors that could cause our actual
results to differ materially from these forward-looking statements may include, without limitation, our ability to implement our business
strategy; our ability to make distributions to stockholders; our ability to acquire SFR assets for our portfolio, including difficulties in
identifying assets to acquire; the impact of changes to the supply of, value of and the returns on SFR assets; our ability to successfully
integrate newly acquired properties into our portfolio of SFR properties; our ability to successfully perform property management
services for our SFR assets at the standard and/or the cost that we anticipate; our ability to predict our costs; our ability to effectively
compete with our competitors; our ability to apply the proceeds from financing activities or asset sales to target single-family rental
assets in a timely manner; our ability to sell non-core properties on favorable terms and on a timely basis or at all; the failure to
identify unforeseen expenses or material liabilities associated with asset acquisitions through the due diligence process prior to such
acquisitions; changes in the market value of our single-family rental properties and real estate owned; changes in interest rates; our
ability to obtain and access financing arrangements on favorable terms or at all; our ability to maintain adequate liquidity; our ability to
retain our engagement of Altisource Asset Management Corporation; the failure of our third party vendors to effectively perform their
obligations under their respective agreements with us; our failure to maintain our qualification as a REIT; our failure to maintain our
exemption from registration under the Investment Company Act; the impact of adverse real estate, mortgage or housing markets; the
impact of adverse legislative, regulatory or tax changes; and other risks and uncertainties detailed in the “Risk Factors” and other
sections described from time to time in our current and future filings with the Securities and Exchange Commission. In addition, financial
risks such as liquidity, interest rate and credit risks could influence future results. The foregoing list of factors should not be construed
as exhaustive.
The statements made in this presentation are current as of the date of this presentation only. The Company undertakes no obligation to
publicly update or revise any forward-looking statements or any other information contained herein, whether as a result of new
information, future events or otherwise.
© 2019 Front Yard Residential. All rights reserved. 2

Table of Contents
I. Company Update
II. Financial Results
III. Portfolio Information
IV. Definitions and Disclosures
© 2019 Front Yard Residential. All rights reserved. 3

1st Quarter 2019 Highlights
© 2019 Front Yard Residential. All rights reserved. 4
1. Comparisons to 1Q 2018
Note: Please see the Definitions and Disclosures section of this presentation for important information on definitions of metrics and reconciliations to GAAP. Core FFO
reconciliation to GAAP can be found on page 13.
Balance Sheet
Fixed or capped debt of 92%, up from 65%1
Weighted average debt duration of 5.5
years, up from 3.4 years1
Amended Credit Suisse and Nomura
warehouse lines, improving fee structures
and reducing interest rate spreads
Financial
Rental revenue of $52.6 million, up 32%1
Stabilized Rental NOI of $32.1 million, up
24%1
Stabilized Rental Core NOI Margin of 62.7%
Core FFO per share of $0.07, up 47%1
Portfolio
Stabilized Rental portfolio of 14,407 homes,
up 23%1
Sold 576 non-core rental assets for gain of
$7.5 million
Operations
Stabilized blended rent growth of 4.3%
Stabilized leased percentage of 95.7%
Stabilized rental turnover of 6.1%
Successfully internalized homes, ahead of
schedule

Company Snapshot
© 2019 Front Yard Residential. All rights reserved. 5
1. As of March 31, 2019, 120 rental homes and 37 legacy REOs were being prepared for sale and will be classified as held for sale once listed.
2. Please see the Definitions and Disclosures section of this presentation for important information on definitions of metrics and reconciliations to GAAP.
($s in thousands, except per home and per share amounts) (unaudited)
Mar 31, 2019 Dec 31, 2018 Sep 30, 2018 Jun 30, 2018 Mar 31, 2018
Portfolio Information - end of period
Total Rental Homes 14,497 14,544 14,587 11,886 11,954
Leased 13,788 13,546 13,562 11,064 11,090
Ready to rent 260 434 424 335 493
Under turn 378 428 479 350 230
Under renovation 71 136 122 137 141
Stabilized Rentals 14,407 14,383 14,447 11,729 11,760
% of rentals stabilized 99% 99% 99% 99% 98%
% of Stabilized Rentals leased 95.7% 94.2% 93.9% 94.3% 94.3%
Total REOs 388 901 896 411 462
Previous rentals identified for sale1 313 797 763 221 142
Legacy REO1 75 104 133 190 320
Total Rental and REO 14,885 15,445 15,483 12,297 12,416
Selected Operating Information2
Stabilized Rental revenue 51,968$ 51,575$ 46,691$ 40,906$ 39,765$
Stabilized Core rental revenues 51,124$ 50,679$ 45,903$
Total rental revenue 52,625$ 54,029$ 48,313$ 40,906$ 39,765$
Stabilized Rental Net Operating Income 32,061$ 31,688$ 28,843$ 26,393$ 25,945$
Stabilized Rental NOI Margin 61.7% 61.4% 61.8% 64.5% 65.2%
Stabilized Rental Core NOI Margin 62.7% 62.5% 62.8%
Stabilized Rental average monthly rent per leased property 1,267$ 1,261$ 1,254$ 1,247$ 1,237$
Stabilized Rental blended average change in rent 4.3% 4.3% 4.3% 4.2% 3.5%
Stabilized Rental turnover rate 6.1% 6.6% 7.2% 8.7% 6.3%
New AMA Agreement
© 2019 Front Yard Residential. All rights reserved. 6
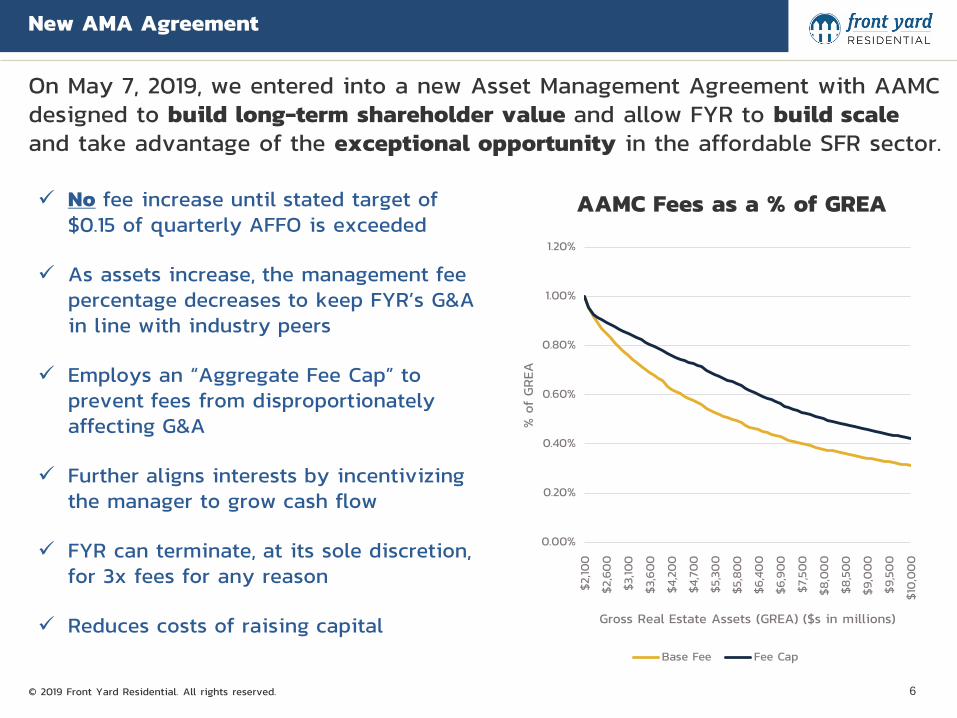
On May 7, 2019, we entered into a new Asset Management Agreement with AAMC designed to build long-term shareholder value and allow FYR to build scaleand take advantage of the exceptional opportunity in the affordable SFR sector.
No fee increase until stated target of $0.15 of quarterly AFFO is exceeded
As assets increase, the management fee percentage decreases to keep FYR’s G&A in line with industry peers
Employs an “Aggregate Fee Cap” to prevent fees from disproportionately affecting G&A
Further aligns interests by incentivizing the manager to grow cash flow
FYR can terminate, at its sole discretion, for 3x fees for any reason
Reduces costs of raising capital
AAMC Fees as a % of GREA
0.00%
0.20%
0.40%
0.60%
0.80%
1.00%
1.20%
$2,10
0
$2,6
00
$3,10
0
$3,600
$4,200
$4,700
$5,300
$5,800
$6,400
$6,9
00
$7,500
$8,0
00
$8,500
$9,0
00
$9,500
$10
,000
% o
f GREA
Gross Real Estate Assets (GREA) ($s in millions)
Base Fee Fee Cap

Strong Performance on Initiatives
© 2019 Front Yard Residential. All rights reserved. 7
Complete the internalization of property management
Successfully internalized our homes, ahead of original schedule
Focus on maximizing operating efficiencies Ongoing
Increased leased rate by over 150 bps
Blended rent growth strong in the first quarter at 4.3%
Strategically prune existing SFRs in non-target markets Ongoing
Sold 576 non-core rental properties for gain of $7.5 million
Continue to optimize balance sheet Ongoing
Increased fixed or capped debt to 92%
Reduced warehouse interest rates
Maintain focus on capital allocation On Track
Cover dividend with rental operating cash flow On Track
Revisit asset management agreement
New AMA agreement designed to deliver long-term shareholder value
The first quarter was extremely productive and we made excellent progress on our goals.

© 2019 Front Yard Residential. All rights reserved. 8
Financial Results

Consolidated Statements of Operations - GAAP
© 2019 Front Yard Residential. All rights reserved. 9
($s in thousands, except per share amounts)
Three Months Ended
Mar 31, 2019 Mar 31, 2018
Revenues: (unaudited) (unaudited)
Rental revenues 52,625$ 39,765$
Total revenues 52,625 39,765
Expenses:
Residential property operating expenses 18,437 13,855
Property management expenses 3,675 2,937
Depreciation and amortization 22,385 19,190
Acquisition and integration costs 2,211 33
Impairment 1,020 7,575
Mortgage loan servicing costs 387 355
Interest expense 21,510 16,063
Share-based compensation 1,119 (414)
General and administrative 5,766 2,673
Management fees to AAMC 3,575 3,790
Total expenses 80,085 66,057
Net gain (loss) on real estate and mortgage loans 8,777 (1,634)
Operating loss (18,683) (27,926)
Casualty losses (393) -
Insurance recoveries 527 -
Other income 49 576
Loss before income taxes (18,500) (27,350)
Income tax expense 8 -
Net loss (18,508)$ (27,350)$
Loss per basic share of common stock (0.35)$ (0.51)$
Weighted average common stock outstanding - basic 53,630,204 53,454,063
Loss per diluted share of common stock (0.35)$ (0.51)$
Weighted average common stock outstanding - diluted 53,630,204 53,454,063

Consolidated Balance Sheets
© 2019 Front Yard Residential. All rights reserved. 10
($s in thousands)
Assets: Mar 31, 2019 Dec 31, 2018
Real estate held for use: (unaudited)
Land 394,846$ 395,532$
Rental residential properties 1,667,962 1,667,939
Real estate owned 33,801 40,496
Total real estate held for use 2,096,609 2,103,967
Less: accumulated depreciation (154,245) (137,881)
Total real estate held for use, net 1,942,364 1,966,086
Real estate assets held for sale 42,406 146,921
Mortgage loans at fair value 4,848 8,072
Cash and cash equivalents 43,629 44,186
Restricted cash 38,343 36,974
Accounts receivable 15,428 11,591
Goodwill 13,376 13,376
Prepaid expenses and other assets 40,865 43,045
Total assets 2,141,259$ 2,270,251$
Liabilities:
Repurchase and loan agreements 1,631,979$ 1,722,219$
Accounts payable and accrued liabilities 66,250 72,672
Payable to AAMC 3,711 3,968
Total liabilities 1,701,940 1,798,859
Equity:
Common stock, at par 536 536
Additional paid-in capital 1,185,251 1,184,132
Accumulated deficit (727,193) (700,623)
Accumulated other comprehensive loss (19,275) (12,653)
Total equity 439,319 471,392
Total liabilities and equity 2,141,259$ 2,270,251$

Real Estate Assets
© 2019 Front Yard Residential. All rights reserved. 11
1. The carrying value of an asset held for use is based on historical cost plus renovation costs, net of any accumulated depreciation and impairment. Assets held
for sale are carried at the lower of the carrying value or estimated fair value less costs to sell.
2. The carrying value of certain properties acquired on November 29, 2017 are included based upon the initial purchase price, certain of which are subject to
potential purchase price adjustment provisions as set forth in the purchase and sale agreement.
3. As of March 31, 2019, 120 rental homes and 37 legacy REOs were being prepared for sale and will be classified as held for sale once listed.
Note: Please see the Definitions and Disclosures section of this presentation for important information on definitions of metrics and reconciliations to GAAP.
($s in thousands) (unaudited)
As of Mar 31, 2019
Stabilized
Non-
Stabilized Total
Carrying
Value1,2
CV per
home
Rental Homes
Leased 13,788 - 13,788 1,815,270$ 132$
Listed and ready for rent 241 19 260 34,742 134
Unit Turn 378 - 378 52,732 140
Renovation - 71 71 8,003 113
Total rental homes 14,407 90 14,497 1,910,747 132
Previous rentals identified for sale3
- 313 313 47,805 153
Legacy REO3
- 75 75 26,218 350
14,407 478 14,885 1,984,770$ 133$

Stabilized Rental Operating Efficiency
© 2019 Front Yard Residential. All rights reserved. 12
Note: Please see the Definitions and Disclosures section of this presentation for important information on definitions of metrics and reconciliations to GAAP.
($s in thousands) (unaudited)
Stabilized Rental Portfolio Mar 31, 2019 Mar 31, 2018
Rental revenues 51,968$ 39,765$
Less: Resident charge-backs (844) (562)
Core revenues 51,124 39,203
Fixed Expenses:
Taxes 8,272 6,317
Insurance 956 673
HOA 569 563
Controllable Expenses:
Repair, maintenance and turn 6,608 3,765
Property management 3,502 2,502
Total property operating expenses 19,907 13,820
Less: Resident charge-backs (844) (562)
Core property operating expenses 19,063 13,258
Stabilized Rental NOI 32,061$ 25,945
Count at end of period 14,407 11,760
Average count of Stabilized Rentals 14,395 11,740
Three Months Ended

1. Other adjustments include non-recurring income/expense items and one-time costs that management has determined are not representative of Front Yard’s
core on-going operations.
Note: Please see the Definitions and Disclosures section of this presentation for important information on definitions of metrics and reconciliations to GAAP.
FFO and Core FFO
© 2019 Front Yard Residential. All rights reserved. 13
($s in thousands, except per share amounts) (unaudited)
Reconciliation of GAAP net loss to FFO, and Core FFO:
Three Months Ended Three Months Ended
Mar 31, 2019 Mar 31, 2018
GAAP net loss (18,508)$ (27,350)$
Depreciation and amortization 22,385 19,190
Impairment 1,020 7,575
Net (gain) loss on real estate and mortgage loans (8,777) 1,634
FFO (3,880) 1,049
Acquisition and integration costs 2,211 33
Non-cash interest expense 2,229 1,526
Share-based compensation 1,119 (414)
Other adjustments1
2,022 307
Core FFO 3,701 2,501
Weighted average common stock outstanding - diluted 53,630,204 53,454,063
FFO per share - diluted (0.07)$ 0.02$
Core FFO per share - diluted 0.07$ 0.05$
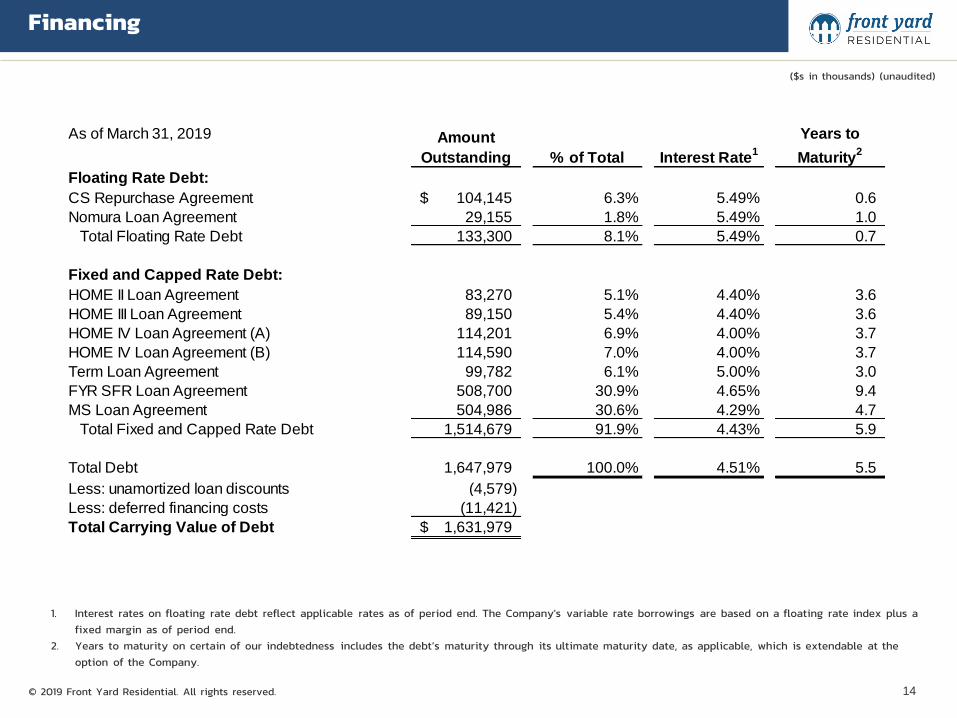
Financing
© 2019 Front Yard Residential. All rights reserved. 14
($s in thousands) (unaudited)
1. Interest rates on floating rate debt reflect applicable rates as of period end. The Company's variable rate borrowings are based on a floating rate index plus a
fixed margin as of period end.
2. Years to maturity on certain of our indebtedness includes the debt’s maturity through its ultimate maturity date, as applicable, which is extendable at the
option of the Company.
As of March 31, 2019 Amount
Outstanding % of Total Interest Rate1
Years to
Maturity2
Floating Rate Debt:
CS Repurchase Agreement 104,145$ 6.3% 5.49% 0.6
Nomura Loan Agreement 29,155 1.8% 5.49% 1.0
Total Floating Rate Debt 133,300 8.1% 5.49% 0.7
Fixed and Capped Rate Debt:
HOME II Loan Agreement 83,270 5.1% 4.40% 3.6
HOME III Loan Agreement 89,150 5.4% 4.40% 3.6
HOME IV Loan Agreement (A) 114,201 6.9% 4.00% 3.7
HOME IV Loan Agreement (B) 114,590 7.0% 4.00% 3.7
Term Loan Agreement 99,782 6.1% 5.00% 3.0
FYR SFR Loan Agreement 508,700 30.9% 4.65% 9.4
MS Loan Agreement 504,986 30.6% 4.29% 4.7
Total Fixed and Capped Rate Debt 1,514,679 91.9% 4.43% 5.9
Total Debt 1,647,979 100.0% 4.51% 5.5
Less: unamortized loan discounts (4,579)
Less: deferred financing costs (11,421)
Total Carrying Value of Debt 1,631,979$

Targets to Increase Operating Cash Flow Unchanged
© 2019 Front Yard Residential. All rights reserved.
Note: Estimates are based on a number of assumptions, including, without limitation, assumptions regarding portfolio growth, management of expenses and operating efficiency,
including turn times, repair & maintenance, rental rates, and other revenue and expenses. Management may adjust these estimates at any time, and actual results could vary
materially. The Company does not provide corresponding GAAP measure for, or reconciliation to, Net Operating Income (NOI), NOI Margin, Core FFO, Core FFO per share per quarter,
AFFO or AFFO per share per quarter because we are unable to reasonably predict the impact of certain items contained in the GAAP measures on a forward-looking basis, including
non-recurring and infrequent items that are not indicative of the Company’s ongoing operations. Such items include, but are not limited to, net gain or loss on sales and impairment
of real estate assets, casualty losses, share-based compensation and acquisition and integration costs. These items are uncertain, depend on various factors and could have a material
impact on our GAAP results for the target period.
15
Revenue Drivers Increase home count (~16K homes) Rent increases (3% - 4%) Occupancy (95% - 96%) Other income
Core FFO per share per quarterCore Funds from Operations (Core FFO)
General and administrative
Interest expense (~4.75% annualized rate)
Efficiency Drivers Internalization of PM Self-performing R&M and turn Vendor and supply management
YE 2019 Annualized Run Rate
$240 - $250 million revenue
$158 - $165 million NOI
~$83 million
$26 - $28 million
AFFO per share per quarterAdjusted Funds from Operations (AFFO)
$47 - $54 million
$27 - $34 million
$0.13 - $0.16
$0.22 - $0.25
~66% NOI marginx
=

Portfolio Information
© 2019 Front Yard Residential. All rights reserved. 16
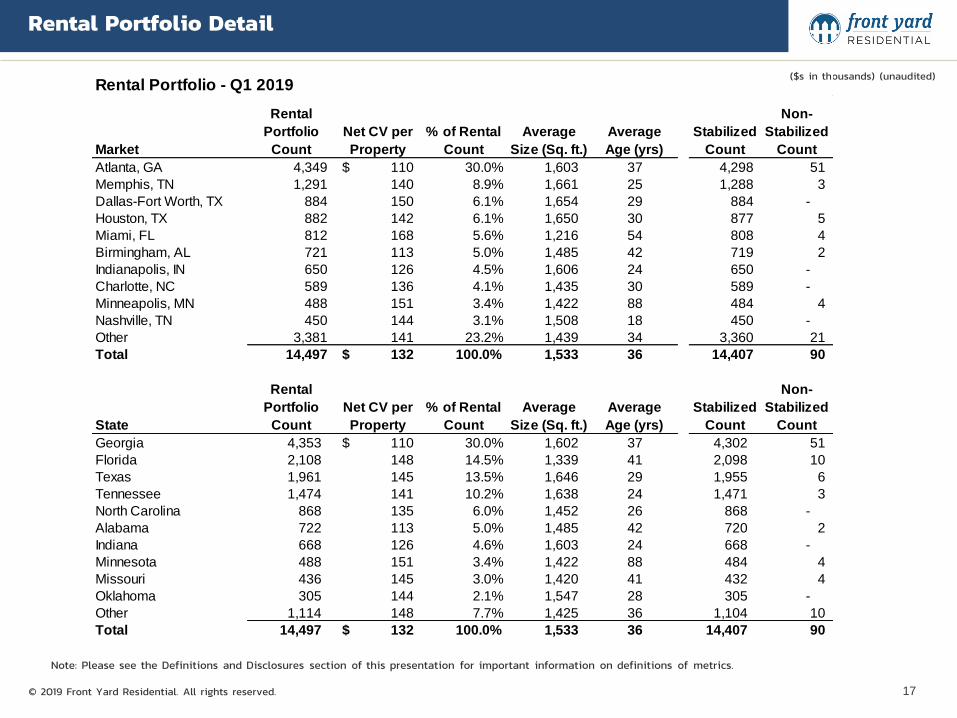
Rental Portfolio Detail
© 2019 Front Yard Residential. All rights reserved. 17
Note: Please see the Definitions and Disclosures section of this presentation for important information on definitions of metrics.
($s in thousands) (unaudited)Rental Portfolio - Q1 2019
Market
Rental
Portfolio
Count
Net CV per
Property
% of Rental
Count
Average
Size (Sq. ft.)
Average
Age (yrs)
Stabilized
Count
Non-
Stabilized
Count
Atlanta, GA 4,349 110$ 30.0% 1,603 37 4,298 51
Memphis, TN 1,291 140 8.9% 1,661 25 1,288 3
Dallas-Fort Worth, TX 884 150 6.1% 1,654 29 884 -
Houston, TX 882 142 6.1% 1,650 30 877 5
Miami, FL 812 168 5.6% 1,216 54 808 4
Birmingham, AL 721 113 5.0% 1,485 42 719 2
Indianapolis, IN 650 126 4.5% 1,606 24 650 -
Charlotte, NC 589 136 4.1% 1,435 30 589 -
Minneapolis, MN 488 151 3.4% 1,422 88 484 4
Nashville, TN 450 144 3.1% 1,508 18 450 -
Other 3,381 141 23.2% 1,439 34 3,360 21
Total 14,497 132$ 100.0% 1,533 36 14,407 90
State
Rental
Portfolio
Count
Net CV per
Property
% of Rental
Count
Average
Size (Sq. ft.)
Average
Age (yrs)
Stabilized
Count
Non-
Stabilized
Count
Georgia 4,353 110$ 30.0% 1,602 37 4,302 51
Florida 2,108 148 14.5% 1,339 41 2,098 10
Texas 1,961 145 13.5% 1,646 29 1,955 6
Tennessee 1,474 141 10.2% 1,638 24 1,471 3
North Carolina 868 135 6.0% 1,452 26 868 -
Alabama 722 113 5.0% 1,485 42 720 2
Indiana 668 126 4.6% 1,603 24 668 -
Minnesota 488 151 3.4% 1,422 88 484 4
Missouri 436 145 3.0% 1,420 41 432 4
Oklahoma 305 144 2.1% 1,547 28 305 -
Other 1,114 148 7.7% 1,425 36 1,104 10
Total 14,497 132$ 100.0% 1,533 36 14,407 90

Leasing Detail
© 2019 Front Yard Residential. All rights reserved. 18
Note: Please see the Definitions and Disclosures section of this presentation for important information on definitions of metrics and reconciliations to GAAP.
Leasing by Market - Q1 2019
Market
Avg Monthly
Rent per
Leased
Property
Stabilized
Leased %
Average
Change in
Renewal
Rent
Average
Change in
Re-lease
Rent
Blended
Average
Change in
Rent
Renewal
Rate
Turnover
Rate
Stabilized
Rental
Core NOI
Margin
Atlanta, GA 1,123$ 97.2% 4.4% 7.3% 5.6% 88% 6.1% 61.0%
Memphis, TN 1,260 95.2% 2.9% 1.5% 2.3% 63% 6.1% 69.1%
Dallas-Fort Worth, TX 1,471 95.4% 5.1% 3.7% 4.6% 76% 7.5% 57.0%
Houston, TX 1,349 93.0% 3.4% -0.3% 1.6% 65% 4.0% 48.2%
Miami, FL 1,612 95.9% 4.2% 1.8% 3.3% 89% 7.1% 60.2%
Birmingham, AL 1,131 95.3% 3.1% 3.3% 3.2% 81% 6.7% 73.6%
Indianapolis, IN 1,234 93.7% 4.3% -1.1% 2.3% 73% 6.2% 61.8%
Charlotte, NC 1,182 96.6% 4.5% 10.9% 7.9% 84% 4.9% 68.4%
Minneapolis, MN 1,429 99.4% 3.5% 1.3% 2.3% 90% 3.1% 62.5%
Nashville, TN 1,400 97.1% 3.5% 1.0% 2.2% 77% 4.2% 76.7%
Other 1,309 94.4% 4.4% 4.6% 4.5% 73% 6.7% 63.5%
Total 1,267$ 95.7% 4.2% 4.5% 4.3% 79% 6.1% 62.7%
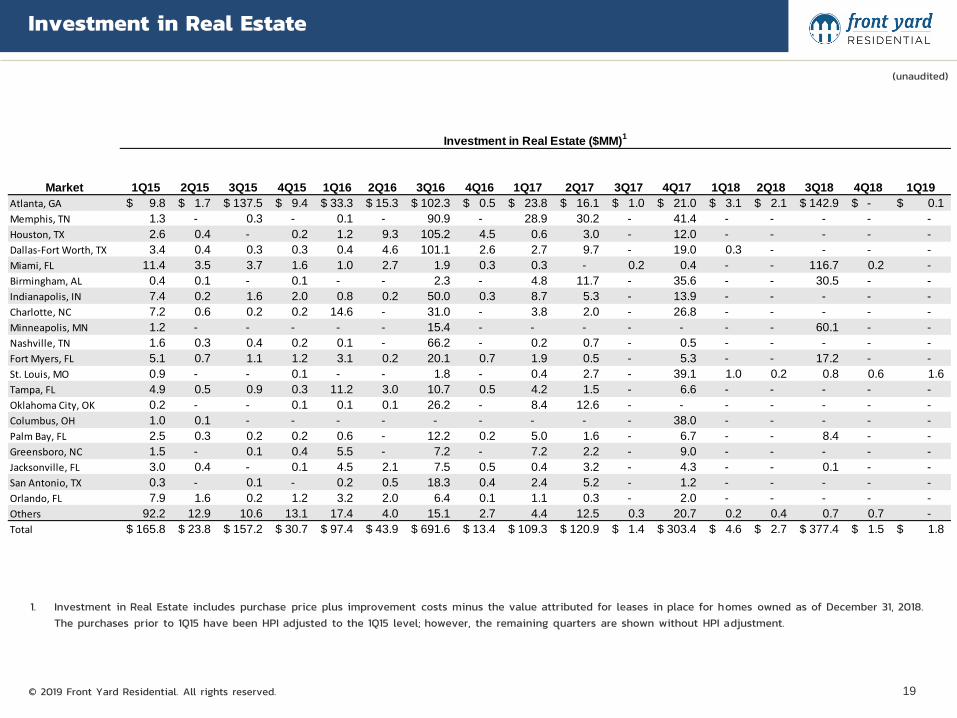
Investment in Real Estate
© 2019 Front Yard Residential. All rights reserved.
1. Investment in Real Estate includes purchase price plus improvement costs minus the value attributed for leases in place for homes owned as of December 31, 2018.
The purchases prior to 1Q15 have been HPI adjusted to the 1Q15 level; however, the remaining quarters are shown without HPI adjustment.
19
(unaudited)
Investment in Real Estate ($MM)1
Market 1Q15 2Q15 3Q15 4Q15 1Q16 2Q16 3Q16 4Q16 1Q17 2Q17 3Q17 4Q17 1Q18 2Q18 3Q18 4Q18 1Q19
Atlanta, GA 9.8$ 1.7$ 137.5$ 9.4$ 33.3$ 15.3$ 102.3$ 0.5$ 23.8$ 16.1$ 1.0$ 21.0$ 3.1$ 2.1$ 142.9$ -$ 0.1$
Memphis, TN 1.3 - 0.3 - 0.1 - 90.9 - 28.9 30.2 - 41.4 - - - - -
Houston, TX 2.6 0.4 - 0.2 1.2 9.3 105.2 4.5 0.6 3.0 - 12.0 - - - - -
Dallas-Fort Worth, TX 3.4 0.4 0.3 0.3 0.4 4.6 101.1 2.6 2.7 9.7 - 19.0 0.3 - - - -
Miami, FL 11.4 3.5 3.7 1.6 1.0 2.7 1.9 0.3 0.3 - 0.2 0.4 - - 116.7 0.2 -
Birmingham, AL 0.4 0.1 - 0.1 - - 2.3 - 4.8 11.7 - 35.6 - - 30.5 - -
Indianapolis, IN 7.4 0.2 1.6 2.0 0.8 0.2 50.0 0.3 8.7 5.3 - 13.9 - - - - -
Charlotte, NC 7.2 0.6 0.2 0.2 14.6 - 31.0 - 3.8 2.0 - 26.8 - - - - -
Minneapolis, MN 1.2 - - - - - 15.4 - - - - - - - 60.1 - -
Nashville, TN 1.6 0.3 0.4 0.2 0.1 - 66.2 - 0.2 0.7 - 0.5 - - - - -
Fort Myers, FL 5.1 0.7 1.1 1.2 3.1 0.2 20.1 0.7 1.9 0.5 - 5.3 - - 17.2 - -
St. Louis, MO 0.9 - - 0.1 - - 1.8 - 0.4 2.7 - 39.1 1.0 0.2 0.8 0.6 1.6
Tampa, FL 4.9 0.5 0.9 0.3 11.2 3.0 10.7 0.5 4.2 1.5 - 6.6 - - - - -
Oklahoma City, OK 0.2 - - 0.1 0.1 0.1 26.2 - 8.4 12.6 - - - - - - -
Columbus, OH 1.0 0.1 - - - - - - - - - 38.0 - - - - -
Palm Bay, FL 2.5 0.3 0.2 0.2 0.6 - 12.2 0.2 5.0 1.6 - 6.7 - - 8.4 - -
Greensboro, NC 1.5 - 0.1 0.4 5.5 - 7.2 - 7.2 2.2 - 9.0 - - - - -
Jacksonville, FL 3.0 0.4 - 0.1 4.5 2.1 7.5 0.5 0.4 3.2 - 4.3 - - 0.1 - -
San Antonio, TX 0.3 - 0.1 - 0.2 0.5 18.3 0.4 2.4 5.2 - 1.2 - - - - -
Orlando, FL 7.9 1.6 0.2 1.2 3.2 2.0 6.4 0.1 1.1 0.3 - 2.0 - - - - -
Others 92.2 12.9 10.6 13.1 17.4 4.0 15.1 2.7 4.4 12.5 0.3 20.7 0.2 0.4 0.7 0.7 -
Total 165.8$ 23.8$ 157.2$ 30.7$ 97.4$ 43.9$ 691.6$ 13.4$ 109.3$ 120.9$ 1.4$ 303.4$ 4.6$ 2.7$ 377.4$ 1.5$ 1.8$

Home Price Appreciation
© 2019 Front Yard Residential. All rights reserved.
1. HPI data is from FHFA’s quarterly non-seasonally adjusted all transactions index. Fort Myers, FL market comprises of Cape Coral-Fort Myers and North Port-Sarasota-
Bradenton. Tampa, FL market comprises of Tampa-St. Petersburg-Clearwater and Lakeland-Winter Haven MSAs. Palm Bay, FL market comprises of Palm Bay-Melbourne-
Titusville & Port St. Lucie MSAs. Greensboro, NC market comprises of Winston-Salem and Greensboro-High Point MSAs. Orlando, FL market comprises of Orlando-
Kissimmee-Sanford and Deltona-Daytona Beach-Ormond Beach MSAs.
20
Market1
1Q15 2Q15 3Q15 4Q15 1Q16 2Q16 3Q16 4Q16 1Q17 2Q17 3Q17 4Q17 1Q18 2Q18 3Q18 4Q18
HPI Index
Change
Atlanta, GA 100.0 103.2 105.0 106.4 107.3 110.8 113.0 114.2 115.8 120.1 122.3 124.0 127.5 131.3 135.4 135.4 35.4%
Memphis, TN 100.0 101.1 102.5 103.2 103.4 105.1 106.5 108.1 108.2 111.7 114.3 113.2 114.7 119.2 120.9 121.4 21.4%
Houston, TX 100.0 103.1 104.5 105.0 105.4 107.4 108.8 109.8 110.5 113.6 113.8 115.9 117.2 120.4 122.0 121.9 21.9%
Dallas-Fort Worth, TX 100.0 103.4 106.5 107.8 110.3 114.3 116.9 119.0 122.0 127.4 130.1 131.5 133.9 137.6 140.0 140.2 40.2%
Miami, FL 100.0 102.9 106.3 108.3 111.2 113.2 115.8 118.1 120.7 123.0 124.9 127.9 130.7 133.3 137.0 138.2 38.2%
Birmingham, AL 100.0 101.0 102.0 102.5 103.3 105.0 107.4 107.0 107.7 110.2 112.2 112.2 113.2 117.4 119.1 119.8 19.8%
Indianapolis, IN 100.0 101.9 102.3 102.8 103.6 105.3 107.4 107.8 108.5 112.1 113.5 115.4 116.5 122.9 123.4 125.4 25.4%
Charlotte, NC 100.0 101.3 102.9 104.3 106.5 108.1 110.8 112.3 114.1 118.5 120.9 121.2 123.6 130.1 130.9 133.1 33.1%
Minneapolis, MN 100.0 102.2 104.3 104.6 105.1 107.9 109.5 110.2 111.9 116.2 117.8 118.0 120.3 124.7 126.6 125.5 25.5%
Nashville, TN 100.0 102.8 105.2 106.5 109.4 112.9 114.9 117.3 120.8 124.1 126.8 129.6 131.8 136.3 139.3 141.0 41.0%
Fort Myers, FL 100.0 103.5 106.2 109.8 111.5 114.6 117.1 118.7 122.8 123.8 125.8 127.8 129.9 131.7 133.8 133.7 33.7%
St. Louis, MO 100.0 100.8 101.8 102.9 103.9 104.9 106.8 107.0 108.4 109.9 111.6 112.3 113.8 115.3 117.4 117.7 17.7%
Tampa, FL 100.0 103.2 106.3 107.3 110.3 113.7 116.4 119.8 121.8 126.5 128.8 131.6 135.9 140.1 142.8 143.5 43.5%
Oklahoma City, OK 100.0 101.8 103.7 104.6 104.8 105.6 106.8 107.3 107.8 109.9 111.9 111.2 112.8 115.1 115.2 115.5 15.5%
Columbus, OH 100.0 102.1 104.1 104.6 106.0 108.2 110.9 111.2 112.7 117.4 119.8 120.2 122.3 127.0 129.1 129.1 29.1%
Palm Bay, FL 100.0 103.6 107.8 109.6 113.1 118.7 121.4 125.0 128.3 132.5 136.8 139.4 142.6 147.8 146.7 149.7 49.7%
Greensboro, NC 100.0 101.7 102.4 101.5 103.1 104.4 106.1 106.5 103.9 108.5 108.9 110.4 112.8 114.1 117.5 119.4 19.4%
Jacksonville, FL 100.0 102.9 104.5 104.7 107.4 111.6 114.1 115.8 117.6 120.5 123.2 127.5 127.3 132.7 136.1 136.2 36.2%
San Antonio, TX 100.0 102.8 104.7 104.4 107.1 108.4 111.8 112.4 113.9 117.2 119.7 121.0 121.8 124.9 126.6 129.1 29.1%
Orlando, FL 100.0 103.4 105.3 107.8 109.4 111.8 115.8 117.9 120.7 124.5 126.9 130.3 133.6 137.1 139.9 140.6 40.6%
Top 20 markets 100.0 102.8 105.0 106.4 107.7 110.8 112.2 113.7 115.0 118.6 120.7 121.4 123.7 127.7 130.7 131.2 31.2%

Definitions and Disclosures
© 2019 Front Yard Residential. All rights reserved. 21

Definitions and Disclosures
Average change in renewal rent: Average percentage change in rent on all non-month-to-month lease renewals during the
quarter compared to previous annual contractual rent.
Average change in re-lease rent: Average percentage change in rent for new leases starting in the quarter compared to
previous annual contractual rent.
Average monthly rent per leased property: Total contractual monthly rent on all properties leased divided by the number
of properties leased at quarter end.
Blended average change in rent: Total weighted average percentage change in rent for both renewals and re-leases in the
quarter.
Renewal Rate: Calculated as the number of renewed leases in a given period divided by total leases expired, excluding
early terminations and leases transitioning to month-to-month in the period.
Rental Portfolio: We define Rental Portfolio as properties that are leased, listed and ready to rent, under renovation or in
turn status where that property is expected to become leased to qualified tenants.
Stabilized Rental: We define a property as stabilized once it has been renovated and then initially leased or available for
rent for a period greater than 90 days. All other homes are considered non-stabilized. Homes are considered stabilized
even after subsequent resident turnover. However, homes may be removed from the stabilized home portfolio and placed
in the non-stabilized home portfolio due to renovation during the home lifecycle or because they are identified for sale.
Turnover Rate: Total number of properties vacated including move-outs and early terminations during the quarter as a
percentage of the stabilized rental portfolio.
© 2019 Front Yard Residential. All rights reserved. 22

Definitions and Disclosures
© 2019 Front Yard Residential. All rights reserved. 23
FFO and Core FFO: FFO is a supplemental performance measure of an equity real estate investment trust (“REIT”) used by industry
analysts and investors in order to facilitate meaningful comparisons between periods and among peer companies. FFO is defined by the
National Association of Real Estate Investment Trusts (“NAREIT”) as GAAP net income or loss excluding gains or losses from sales of
property, impairment charges on real estate and depreciation and amortization on real estate assets adjusted for unconsolidated
partnerships and jointly owned investments.
We believe that FFO is a meaningful supplemental measure of our overall operating performance because historical cost accounting for
real estate assets in accordance with GAAP assumes that the value of real estate assets diminishes predictably over time, as reflected
through depreciation. Because real estate values have historically risen or fallen with market conditions, management considers FFO an
appropriate supplemental performance measure as it excludes historical cost depreciation, impairment charges and gains or losses related
to sales of previously depreciated homes from GAAP net income. By excluding depreciation, impairment and gains or losses on sales of
real estate, FFO provides a measure of our returns on our investments in real estate assets. However, because FFO excludes depreciation
and amortization and captures neither the changes in the value of the homes that result from use or market conditions nor the level of
capital expenditures to maintain the operating performance of the homes, all of which have real economic effect and could materially
affect our results from operations, the utility of FFO as a measure of our performance is limited.
Our Core FFO begins with FFO and is adjusted for share-based compensation; acquisition and integration costs; non-cash interest expense
related to deferred debt issuance costs, amortization of loan discounts and mark-to-market adjustments on interest rate derivatives and
other non-comparable items, as applicable. We believe that Core FFO, when used in conjunction with the results of operations under
GAAP, is a meaningful supplemental measure of our operating performance for the same reasons as FFO and is further helpful as it
provides a consistent measurement of our performance across reporting periods by removing the impact of certain items that are not
comparable from period to period. Because Core FFO, similar to FFO, captures neither the changes in the value of the homes nor the level
of capital expenditures to maintain them, the utility of Core FFO as a measure of our performance is limited.
Although management believes that FFO and Core FFO increase our comparability with other companies, these measures may not be
comparable to the FFO or Core FFO of other companies because other companies may adopt a definition of FFO other than the NAREIT
definition, may apply a different method of determining Core FFO or may utilize metrics other than or in addition to Core FFO.

Definitions and Disclosures
© 2019 Front Yard Residential. All rights reserved. 24
NOI, NOI Margin, Stabilized Rental NOI, Stabilized Rental NOI Margin and Stabilized Rental Core NOI Margin: NOI is a non-GAAP
supplemental measure that we define as rental revenues less residential property operating expenses. We define NOI Margin as NOI
divided by rental revenues. Stabilized Rental NOI and Stabilized Rental NOI Margin are calculated using only the stabilized rental
properties in our rental portfolio. Stabilized Rental NOI is a non-GAAP supplemental measure that we define as rental revenues less
residential property operating expenses of the stabilized rental properties in our rental portfolio. We define Stabilized Rental NOI
Margin as Stabilized Rental NOI divided by rental revenues. We define Stabilized Rental Core NOI Margin as Stabilized Rental NOI
divided by core rental revenues from Stabilized Rentals, which are rental revenues less tenant charge-back revenues attributable to
our Stabilized Rentals.
We consider NOI, NOI Margin, Stabilized Rental NOI, and Stabilized Rental NOI Margin to be meaningful supplemental measures of
operating performance because they reflect the operating performance of our stabilized properties without allocation of corporate
level overhead or general and administrative costs, acquisition fees and other similar costs and provide insight to the ongoing
operations of our business. In addition, Stabilized Rental Core NOI Margin removes the impact of tenant charge-backs that are
included in both revenues and expenses and therefore have a no impact to our net results of operations. These measures should be
used only as supplements to and not substitutes for net income or loss or net cash flows from operating activities as determined in
accordance with GAAP. These net operating income measures should not be used as indicators of funds available to fund cash
needs, including distributions and dividends. Although we may use these non-GAAP measures to compare our performance to other
REITs, not all REITs may calculate these non-GAAP measures in the same way, and there is no assurance that our calculation is
comparable with that of other REITs. While management believes that our calculations are reasonable, there is no standard
calculation methodology for Stabilized Rental NOI, Stabilized Rental NOI Margin or Stabilized Rental Core NOI Margin, and different
methodologies could produce materially different results.
The following table provides a reconciliation of net loss as determined in accordance with U.S. GAAP to Stabilized Rental NOI, Stabilized
Rental NOI Margin and Stabilized Rental Core NOI Margin.

Definitions and Disclosures
© 2019 Front Yard Residential. All rights reserved. 25
Reconciliation of GAAP Net Loss to Stabilized Rental NOI, Stabilized Rental NOI Margin and Stabilized Rental
Core NOI Margin
($s in thousands) (unaudited)
Three Months Ended
Mar 31, 2019 Dec 31, 2018 Sep 30, 2018 Jun 30, 2018 Mar 31, 2018
GAAP net loss (18,508)$ (34,216)$ (47,933)$ (21,336)$ (27,350)$
Adjustments:
Rental revenues from non-stabilized properties (657) (2,454) (1,622) - -
Net (gain) loss on real estate and mortgage loans (8,777) (618) (1,177) 306 1,634
Operating expenses on non-stabilized properties 2,205 2,631 2,821 2,684 2,972
Depreciation and amortization 22,385 21,910 21,100 18,761 19,190
Acquisition and integration costs 2,211 7,595 25,220 759 33
Impairment 1,020 1,740 1,276 2,143 7,575
Mortgage loan servicing costs 387 368 479 319 355
Interest expense 21,510 24,492 20,142 16,338 16,063
Share-based compensation 1,119 1,144 1,200 1,094 (414)
General and administrative 5,766 5,184 3,483 2,477 2,673
Management fees to AAMC 3,575 3,608 3,648 3,697 3,790
Income tax expense 8 40 6 - -
Other (income) expense (183) 264 200 (849) (576)
Stabilized Rental NOI 32,061$ 31,688$ 28,843$ 26,393$ 25,945$
Rental revenues 52,625$ 54,029$ 48,313$ 40,906$ 39,765$
Less: Rental revenues from non-stabilized properties (657) (2,454) (1,622) - -
Rental revenues from Stabilized Rentals 51,968 51,575 46,691 40,906 39,765
Less: Tenant charge-back revenue from Stabilized Rentals (844) (896) (788) (650) (562)
Core rental revenues from Stabilized Rentals 51,124$ 50,679$ 45,903$ 40,256$ 39,203$
Stabilized Rental NOI Margin 61.7% 61.4% 61.8% 64.5% 65.2%
Stabilized Rental Core NOI Margin 62.7% 62.5% 62.8% 65.6% 66.2%

Thank you.
© 2019 Front Yard Residential. All rights reserved. 26